Article

Naturally Occurring Variability in the Regulatory Region of the Drosophila melanogaster Gene shuttle craft Affects Gene Expression and Lifespan

by
Alexander V. Symonenko
1,*,
Natalia V. Roshina
1,2,
Olga Y. Rybina
1,
Evgeniya A. Tsybul’ko
1,
Anna V. Krementsova
1,3,
Elena A. Mikhaleva
1,
Vladimir E. Alatortsev
1,
Dmitry V. Mukha
2 and
Elena G. Pasyukova
1
1
National Research Centre “Kurchatov Institute”, 2 Kurchatov Sq., 123182 Moscow, Russia
2
Vavilov Institute of General Genetics, Russian Academy of Sciences, 3 Gubkin Str., 119991 Moscow, Russia
3
Emmanuel Institute of Biochemical Physics, Russian Academy of Sciences, 4 Kosygin St., 119334 Moscow, Russia
*
Author to whom correspondence should be addressed.
Int. J. Mol. Sci. 2026, 27(18), 8343; https://doi.org/10.3390/ijms27188343 (registering DOI)
Submission received: 21 August 2026 / Revised: 12 September 2026 / Accepted: 14 September 2026 / Published: 19 September 2026
(This article belongs to the Special Issue Bioinformatics of Genome Regulation and Structure–2026)

Abstract

Revealing gene expression patterns is essential for comprehending the genetic control of complex traits like lifespan. Analyzing structural variation in gene regulatory regions within natural populations is a promising approach in functional genetics, allowing us to identify regulatory sites that influence transcription and phenotype in vivo. We describe the structural variability of the 5′ regulatory region of the shuttle craft (stc) gene in the Alexandrov population (Russia) of Drosophila melanogaster, encoding a transcription factor homologous to human NF-X1. We evaluated the association of frequently occurring polymorphisms with fly lifespan from inbred lines sampled in 2010, 2011, and 2014. Two polymorphisms in the stc 5′ regulatory region exhibit strong associations with both lifespan and embryonic stc transcript levels. Their role in expression regulation was evaluated via reporter gene assays conducted in S2 Drosophila cell culture. The ‘C’ allele at one polymorphic site and ‘T’ at the other are associated with increased longevity and decreased embryonic stc transcription, reaffirming the link between gene expression and lifespan we previously established. Furthermore, comparing stc 5′ regulatory region variability across Alexandrov, European and African populations suggests that the macro-geographic distribution of these longevity-associated variants is consistent with a potential role in latitudinal or climatic adaptation.

1. Introduction

In multicellular organisms, precise regulation of both transcriptional and posttranscriptional programs is crucial for maintaining the accurate relationship among genomic information, individual cell identities, functional attributes of tissues and organs, and the resulting phenotype of the entire organism. The coordination of multiple distant enhancers, extensive alternative promoter usage, and numerous splicing events allows for exact and sophisticated regulation of gene expression. The complexity of the transcriptome and cis-regulatory DNA sequences, which control transcript abundance and diversification, mirrors the complexity of a living being [1]. Simultaneously, in higher organisms, the regulatory machinery exhibits evolutionary conservation and functional similarity, making Drosophila melanogaster (D. melanogaster) an effective model for functional genomics studies.
Unraveling the gene expression strategy is essential for comprehending the genetic control of complex traits, such as lifespan. The significance of such studies increases when considering biologically and socially significant quantitative traits, unequivocally including longevity. In recent years, the human lifespan has been on the rise, highlighting the value of life extension, particularly when linked with decelerated aging and the preservation of health. In this context, the search for effective molecular and cellular mechanisms to extend healthy longevity, including the potential to influence gene expression levels, has become an increasingly pressing task. In our previous work, we demonstrated that lowered embryonic transcription of the shuttle craft (stc) gene, which encodes a transcription factor involved in the control of neuronal development, led to increased longevity [2]. Furthermore, reduction in the stc transcript levels in embryos through RNA interference also resulted in increased lifespan [3]. Therefore, in laboratory experiments, the regulation of stc expression levels underlies changes in lifespan, suggesting the potential for controlling this important trait at the transcriptional level. Nevertheless, the question remains open as to how well the effects of experimental interventions reflect the patterns that exist in natural conditions.
The presence of substantial genetic and phenotypic variation in nature is widely acknowledged. Extensive data have facilitated the assessment of demography, ecological adaptation, and selection in natural populations (for example, [4,5,6,7,8,9]. Unraveling the genetic basis of natural trait variation is one of the most challenging objectives in population genetics, aiming to elucidate the connections between variations in gene structure and specific phenotypes. Significant progress has been achieved over the last few decades in comprehending the relationships between variations in gene structure and various phenotypic traits of the fruit fly, including lifespan, as well as genetic variation at both the single-gene and whole-genome levels (see for examples [10,11,12,13,14,15,16,17]).
The effects of natural genetic variation on lifespan and other life history traits in D. melanogaster were for example recently reviewed by T. Flatt [18]. Much less is known about the effect of genome variation, including its regulatory sequences, on gene transcription and furthermore, about the relationship of this altered transcription with phenotypic changes. Recently, the integration of deep DNA sequencing with RNA sequencing or metabolome profiling of inbred lines derived from natural populations of D. melanogaster has brought us closer to bridging the gap between natural genomic variation and quantitative traits. This advancement stems from the analysis of changes in so-called intermediate phenotypes, namely, transcriptomes and metabolomes [19,20,21,22,23]. In the years to come, the increasing flow of publications describing natural variation in gene expression and its associated phenotypes will improve our understanding of the genetic architecture of populations and illuminate the evolutionary forces that sustain both intra- and inter-populational diversity.
On a more precise, single-locus scale, it has been demonstrated that natural variation in the regulatory regions of D. melanogaster genes, including blw, CG9509, and MtnA, is associated with variations in gene expression and affects quantitative traits, such as lifespan [24], oxidative stress tolerance [25,26,27], adult body size, and wing loading [28], respectively. We also demonstrated that two naturally occurring polymorphisms located in the Lim3 5′ regulatory region were associated with a six-fold change in gene transcription in embryos and a 25% change in lifespan. Through a reporter gene approach, we obtained experimental evidence confirming that Lim3 transcript amounts in embryos depended on the presence of specific nucleotides at each of the two polymorphic sites located in the putative binding sites of several regulatory proteins within the active Polycomb Response Element. Importantly, markers associated with long life and intermediate Lim3 transcription were present in the population at high frequencies [29,30]. We believe that this line of research is not only crucial for describing the molecular basis of population dynamics and biodiversity but also for advancing our understanding of functional genomics and the regulation of gene expression in general.
In this paper, we explore structural variation in the 5′ regulatory region and 5′ UTR of the stc gene in the Russian population of D. melanogaster, specifically from the Alexandrov subset. Subsequently, we compare these findings with data from several European and African populations, as described by others (http://dpgp.org, [8,31,32]). Based on this comparison, we selected frequently occurring polymorphic markers characteristic of all populations and assessed the association of these markers with the lifespan of inbred lines obtained from individual females captured in the Russian population of Alexandrov in 2010, 2011 and 2014. Our findings reveal that two polymorphic markers located in the stc 5′ regulatory region are associated with both lifespan and stc transcript amounts in embryos. Their capacity to modulate transcription was demonstrated via reporter gene assays conducted in S2 Drosophila cell culture. Specifically, the presence of ‘C’ in one of the polymorphic sites and ‘T’ in the other appeared to be associated with an increase in lifespan and a decrease in stc transcription in embryos. These results further confirm our previous findings, establishing a clear link between gene expression and the nature of its impact on longevity. A comparison of our findings with published data also suggests that the geographical distribution of these longevity-associated variants is consistent with a potential role in climate adaptation.

2. Results

Our research focused on monitoring natural variation in D. melanogaster from the Alexandrov population located in the northern region of European Russia (Table A1). Flies were collected from late August to early October, a period when they were present in substantial numbers.
To evaluate the naturally occurring variation in DNA sequences and lifespan, we employed a well-known approach (for example, [33,34]) based on the analysis of ILs obtained from individual females captured in the wild through full-sib matings. According to [35], every IL is, to a reasonable extent, genetically homozygous and formally represents one haploid genome (one allele) from a natural population. In practice, however, ILs may retain heterozygous fragments. While this situation can present challenges for whole-genome sequencing, it becomes less problematic when sequencing small regions of the genome because if ILs exhibit residual heterozygosity in the region of interest, they can be selectively discarded. Considering both the limitations and benefits of this approach, which allows for the analysis of not only DNA polymorphism but also the naturally occurring variation in quantitative traits, we selected from 18 to 43 ILs per population per year for subsequent study (Table A1).
To determine whether stc expression and lifespan are associated with the naturally occurring structural variation in the putative cis-regulatory region of stc, we sequenced 868 bp from 109 ILs obtained from the Alexandrov population, including 71 bp of the 3′ UTR of the preceding gene, CG15269, 386 bp of DNA sequences located upstream of stc, and 409 bp of the stc 5′ UTR (Table A1; Figure 1). CG15269 and stc are closely linked, and previous studies (namely, [36]) have shown that the insertion causing the stc[05441] mutation, exhibiting the lethal phenotype typical of classic stc mutations, is actually located within an adjacent gene, CG15269. The relationship between these two genes remains unclear, as does the function of CG15269 (https://flybase.org/reports/FBgn0028878 (accessed on 20 August 2026)). We included the 3′ end of CG15269 in our analysis in order to increase the size of the DNA fragment preceding the structural part of stc, suggesting that it may also be part of the stc 5′ regulatory region. In the next section, we present a brief analysis of molecular variation in the cis-regulatory region of stc, using only fully read homozygous DNA sequences without any omissions.

2.1. DNA Polymorphism in the cis-Regulatory Region of the shuttle craft Gene

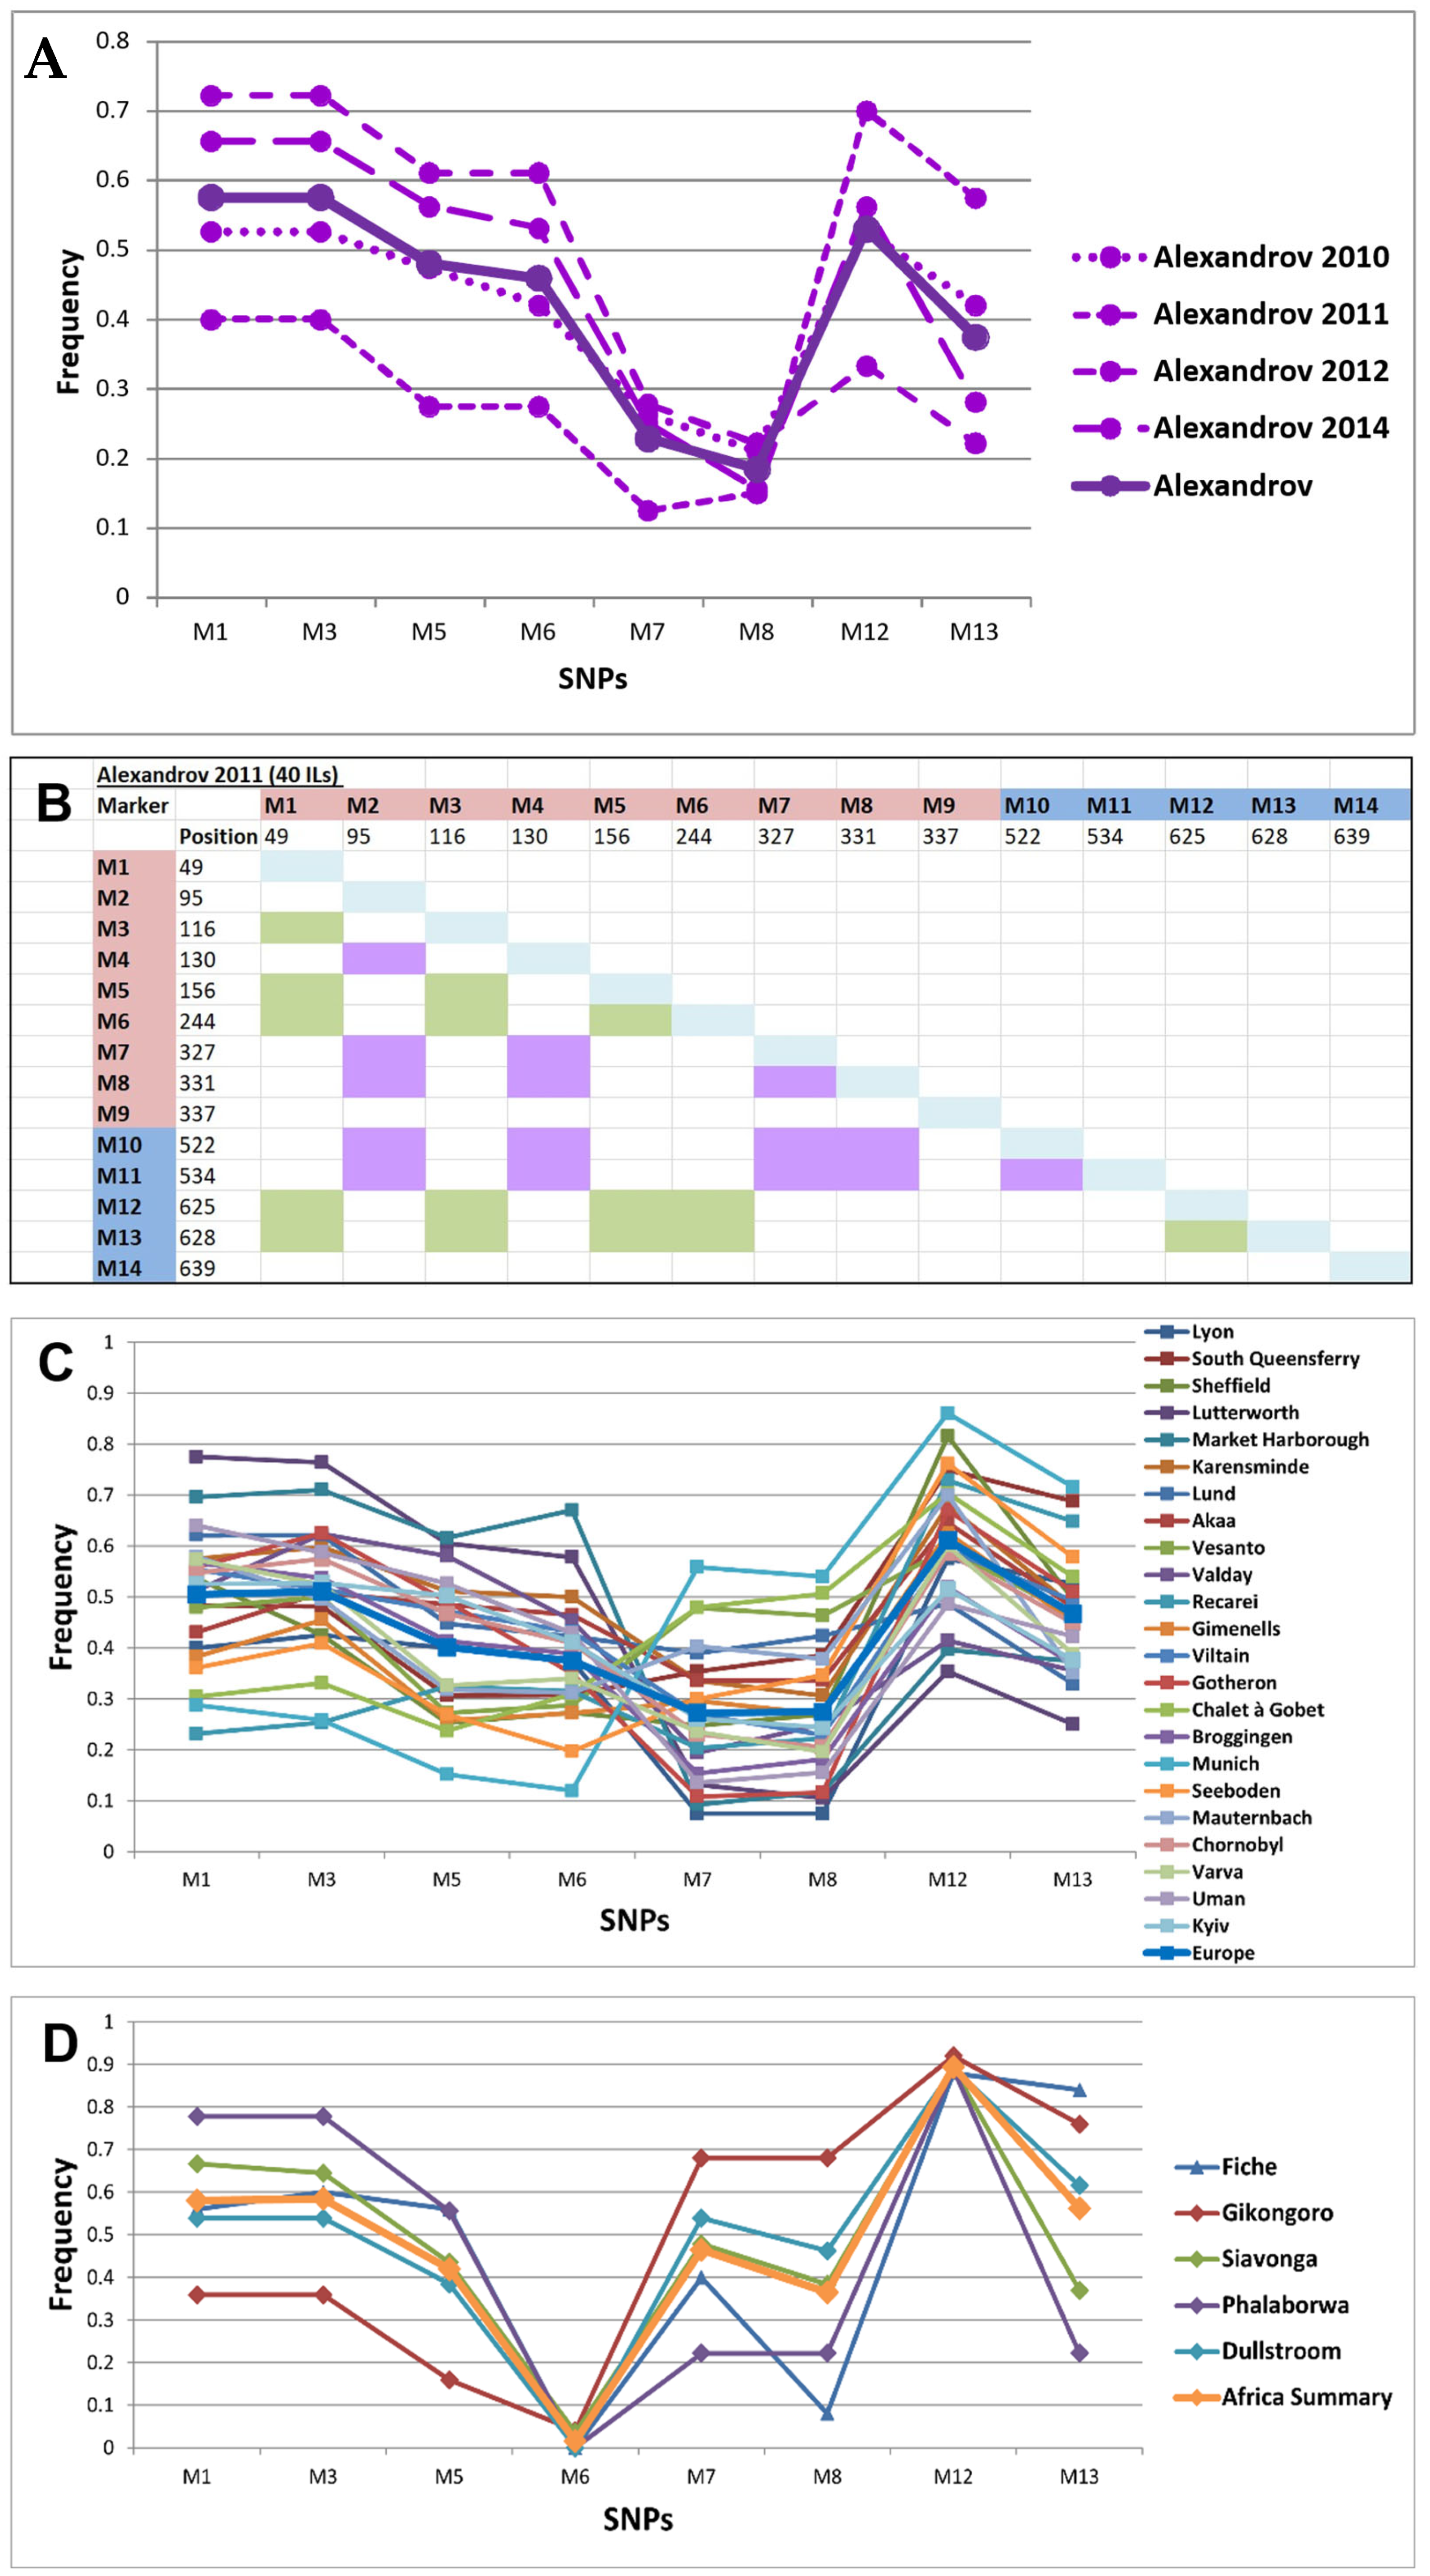
The number of nucleotide substitutions found in the Alexandrov population varied from 15 to 19 in different years. Among these, 14 SNPs occurred with a frequency equal to or greater than 5% and will be further referred to as polymorphic markers, M1–M14 (Supplementary Materials, List S1). Estimates of nucleotide diversity, based on the number of differences between pairs of sites (π, [38]), and the number of segregating sites (θ, [39]), fell within the observed range for D. melanogaster [40]. Specifically, π ranged from 0.00518 ± 0.00056 to 0.00604 ± 0.00064 (Table A1), and θ ranged from 0.00486 ± 0.00118 to 0.00626 ± 0.00144. No significant difference in nucleotide diversity was found between the years, and each year, the stc 5′ UTR was slightly more conserved than the stc 5′ regulatory region (Table A1). Comparing the frequencies of the eight most common SNPs truly segregating in the natural population (frequency greater than 10%) by year (Supplementary Materials, List S2; Figure 2A) revealed substantial changes: 2011 stood out as the most different year from the rest, whereas 2012 and 2014 showed the most similarity. The frequencies of SNPs averaged across years almost entirely corresponded to the frequencies observed in 2010. The cause of the year-to-year changes in marker frequencies remains unclear. Regarding weather conditions, summer 2010 was exceptionally hot in European Russia (https://world-weather.ru/archive/russia/aleksandrov/summer/ (accessed on 20 August 2026)), while other years experienced normal weather conditions. It is hardly reasonable to assume that special marker frequencies in 2011 were predetermined by exceptional weather in summer 2010, since the flies were caught in autumn, and there are no grounds to believe that the survival of the population during the cold winter period of 2010–2011 should have affected the frequencies differently than in other years. The frequencies of different markers changed in concert, indicating a fairly strong linkage between SNPs. Six of the eight frequent markers (M1, M3, M5, M6, M12, M13) formed a specific group of significantly linked polymorphic sites (Supplementary Materials, List S3; Figure 2B illustrates this for 2011). In the same year, an additional linkage pattern was also observed for M2, M4, M7, M8, M10, M11 (Supplementary Materials, List S3; Figure 2B). Overall, the observed patterns of linked loci deviated from the expectations of normal recombination.
To understand whether the pattern of molecular variation identified in the Alexandrov population was similar to patterns in other populations, we compared Alexandrov with other populations for which full-genome DNA sequences determined in 10 or more ILs obtained from populations at the same time (2010–2014) were available (DPGP2 and DPGP3 collections, http://dpgp.org, [31,32]): one European (Lyon, France) and five African (Fiche, Ethiopia; Gikongoro, Rwanda; Siavonga, Zambia; Phalaborwa and Dullstroom, South Africa). Only fully read DNA sequences without any omissions in the region of interest were used. Parameters of nucleotide diversity were similar in Alexandrov and all other populations (Table A1). Similar to Alexandrov, in African populations, the stc 5′ UTR was slightly more conserved than the stc 5′ regulatory region, whereas in the French population, the difference was not evident (Table A1). Similar to the Alexandrov population, in the French population, M1, M3, M5, M6, M12, and M13 formed a distinct group of significantly linked polymorphic sites (Supplementary Materials, List S3). Conversely, this pattern was not observed in the African populations; instead, in the Gikongoro and Siavonga populations M1, M3, M4, M7, and M8 exhibited linkage disequilibrium (LD, Supplementary Materials, List S3).
Molecular genetic tests for selection were used to determine whether evolutionary forces might be regulating nucleotide variation in the stc 5′ regulatory region. Notably, no significant values for D [41] (Table A1), D* and F* [42] were found in any of the populations.
The same polymorphic markers (M1–M14) were identified in all populations (refer to Supplementary Materials, List S1). In the Alexandrov and Lyon populations, only these SNPs were present. However, in African populations, nine additional SNPs with a frequency equal to or greater than 5% were found (A1–A9, Supplementary Materials, Lists S1 and S2). In recent years, a large amount of data on the variability of the D. melanogaster genome in natural populations has been obtained by pool sequencing [43]. To better assess the variability of the D. melanogaster genome in European natural populations, we used data obtained by the European Drosophila Population Genomics Consortium (DrosEU; https://droseu.net, [8]). In addition to the M1–M14 polymorphic markers found in all 22 European populations in 2014, we identified 26 SNPs with frequencies equal to or greater than 5% in one (16 SNPs), two (3 SNPs), three (3 SNPs), five (2 SNPs), six (1 SNP), or seven (1 SNP) populations (E1–E26, Supplementary Materials, List S2). Notably, only one of these additional sites matched an extra site in the African populations (A4 = E8).
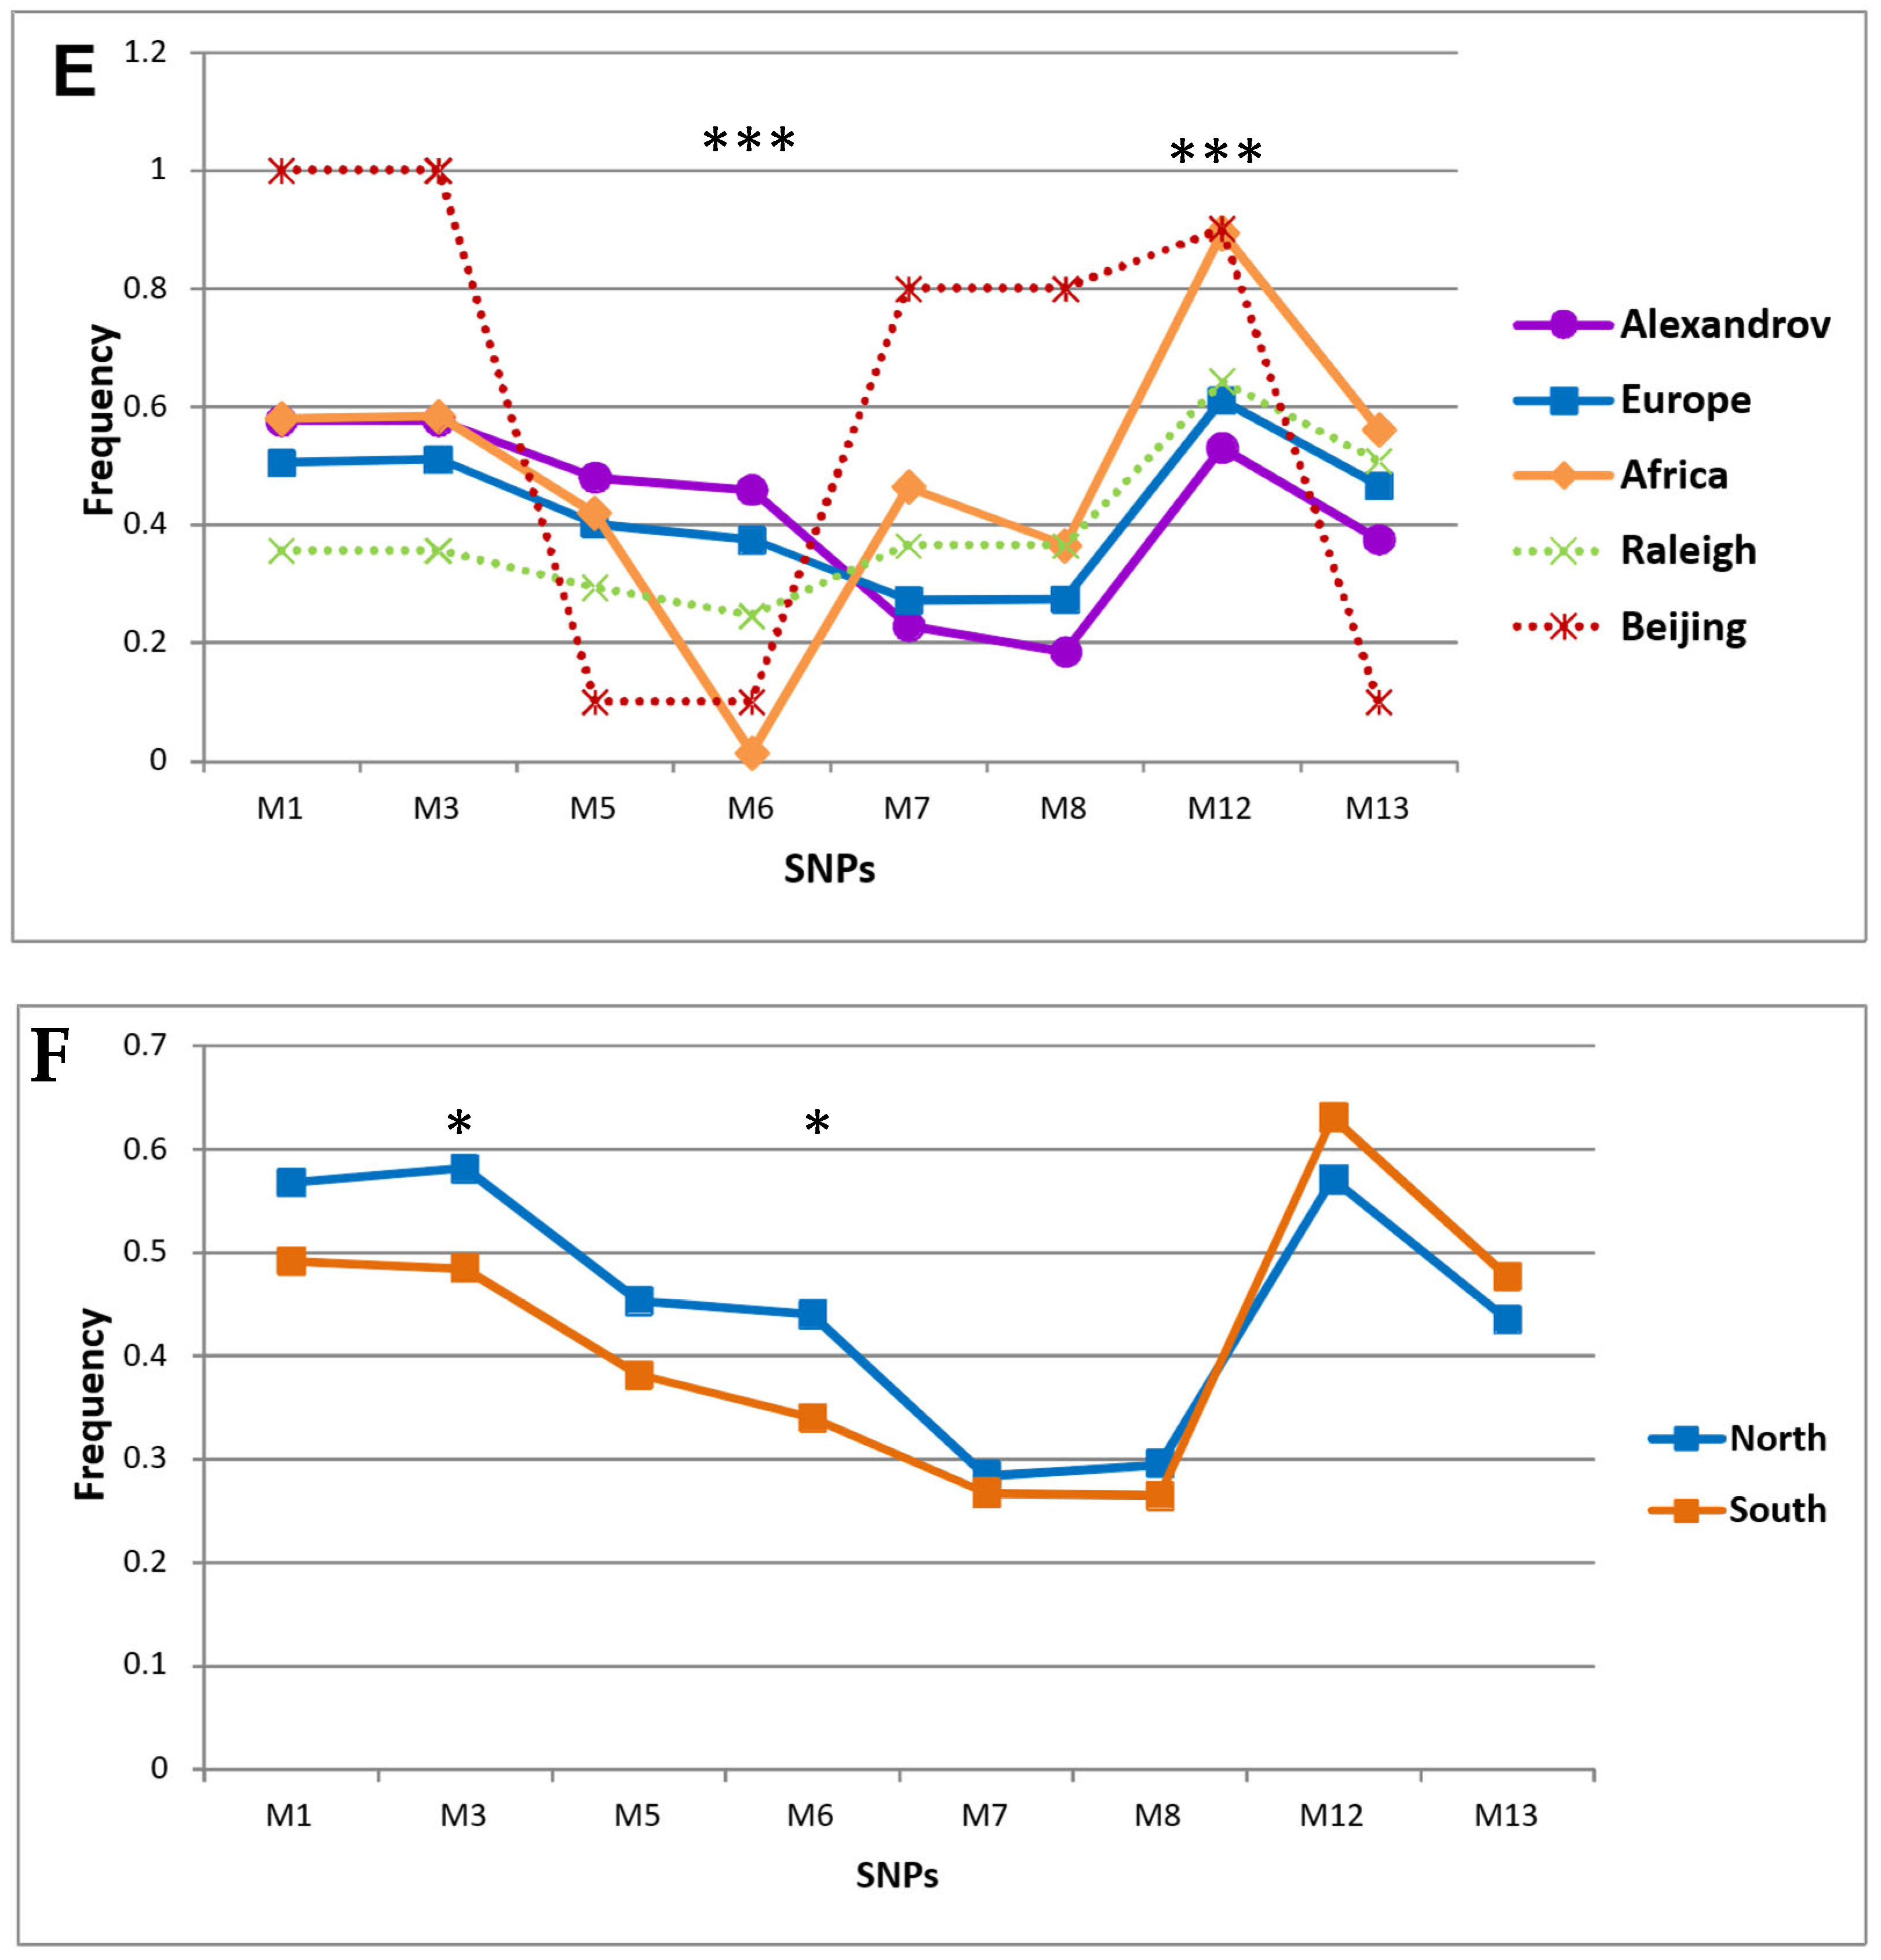
The frequencies of the M1–M14 polymorphic markers varied within both European and African populations (Figure 2C,D). Interestingly, the average yearly frequencies of M1–M14 in the Alexandrov population closely resembled the average European frequencies (Figure 2E). Against the background of the general variability in the frequencies of polymorphic markers in individual populations, two exceptions were noted: the frequencies of M6 and M12 were nearly identical in all African populations. The average frequencies of these same markers were found to be significantly different in European and African populations (Figure 2E). This finding implies a potential association between polymorphisms at these sites and adaptation to the fly environment. Indeed, all populations inhabit a relatively narrow band between 3 degrees West and 33 degrees East. Notably, European populations reside significantly farther North than African populations (latitude range of 58 to 41 degrees North for Europe compared to 10 degrees North to 25 degrees South for Africa). Thus, we hypothesize that the low frequency of T in M6 and the high frequency of C in M12 are characteristic of southern populations. To verify this assumption, we compared the frequencies of M6 and M12 in northern and southern European populations, dividing them conventionally into two groups of approximately equal numbers based on a geographic latitude threshold of 50° N (where populations > 50° N were categorized as northern and populations < 50° N as southern; Supplementary Materials, List S2). The frequencies of M6 and M12 in these groups indeed differed in accordance with expectations, providing a pattern consistent with a potential role in climatic or latitudinal adaptation (Figure 2F).
In conclusion, variation in the stc 5′ regulatory region differs between European and African populations, in accordance with similar population genetic observations [44,45]. Notably, the variation in the Aleksandrov population aligns with that of other European populations and, to some extent, in the African population, which allowed the use of it as a representative population for investigating the effect of nucleotide diversity in the stc 5′ regulatory region on gene expression and fly lifespan.

2.2. Exploring the Association Between Molecular Variation in the stc 5′ Regulatory Region and Lifespan

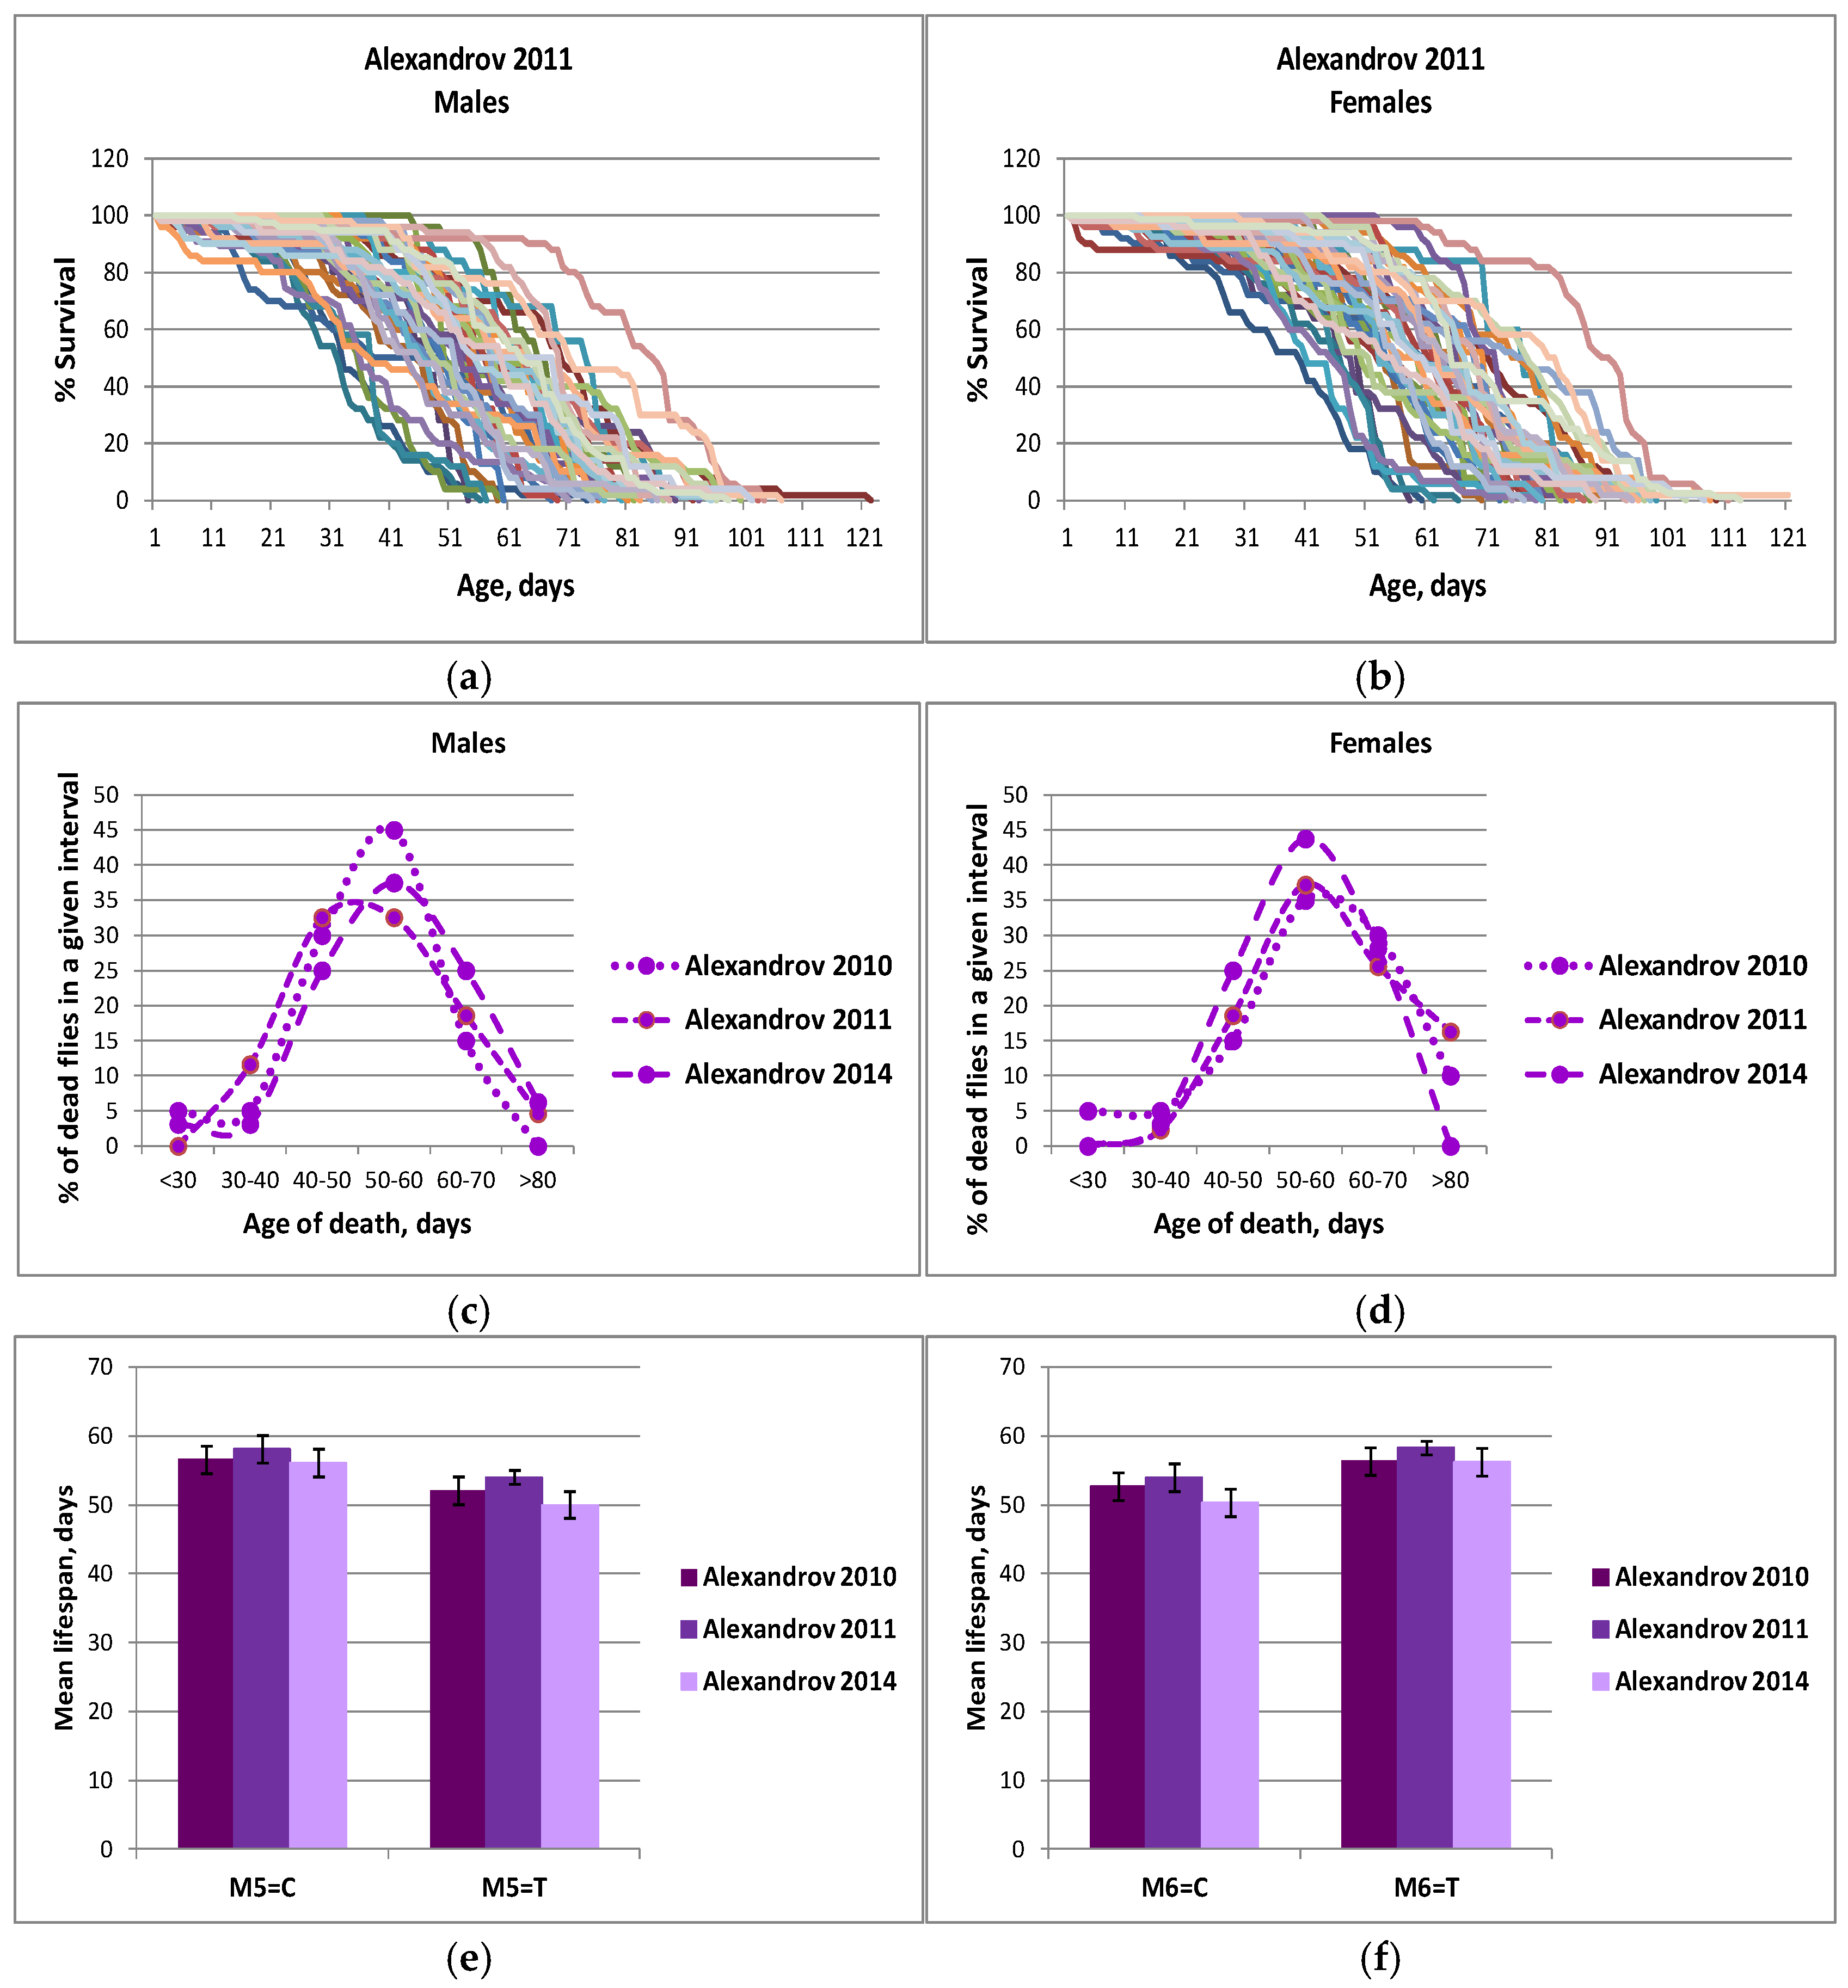
To assess associations between the naturally occurring structural variation in the cis-regulatory region of the stc gene, known to be involved in lifespan control [2], and lifespan, we measured lifespan in ILs derived from the Alexandrov 2010, Alexandrov 2011, and Alexandrov 2014 populations (Supplementary Materials, List S4). This included four lines with missing data for one or two markers, which were not included in the analysis of nucleotide diversity. We observed substantial variation in survival between the lines in both males and females (Figure 3a,b). At the same time, variation between the years was not essential (Figure 3c,d).
Association studies utilized 8 polymorphic markers present in our samples at a frequency of 10% and higher. This restriction, also employed in the analysis of essential characteristics of the structural variation in the stc 5′ regulatory region, allowed us to focus on polymorphisms that were genuinely segregating in nature.
Analysis of variance (ANOVA) did not reveal any significant association with lifespan for sex, year, or any interaction term (Supplementary Materials, List S5). Based on these results, we combined data on sexes and years for the analysis of associations between polymorphic markers and lifespan. Four markers (M1, M3, M5, and M6) showed a significant association with lifespan (Table 1, Supplementary Materials, List S5). These markers, located in the stc 5′ regulatory region (Figure 1), were in significant LD with each other (Supplementary Materials, List S3). However, ANOVA revealed that the association between the haplotype composed of the four markers and lifespan was much less significant than the association between any individual marker and lifespan (Table 1). Nonparametric, distribution-free Kruskal–Wallis tests were used to evaluate the significance of the difference in lifespan between the ILs with different nucleotides in M1, M3, M5, and M6 sites, as well as with different haplotypes, and generally confirmed the results obtained from ANOVA (Table 1).
Although M12 and M13, located in the stc 5′ UTR, were also in significant LD with M1, M3, M5, and M6 (Supplementary Materials, List S3), no association with lifespan was observed for M12 and M13 (Supplementary Materials, List S5).
Two major combinations of markers, GATC and ATCT, composed of M1, M3, M5, and M6, were present in the Alexandrov population (Table 1). A multiple comparison of means showed that only the lifespans of ILs with these haplotypes were significantly different. The mean lifespan of ILs with the minor combination of markers, ATTC, the only other combination that truly segregated in the population and thus had a reliable estimate of lifespan, did not formally differ from the lifespan of ILs with both major combinations of markers. However, it was closer to the mean lifespan of ILs with the GATC combination (Table 1). This suggested that the contribution of variation in markers M1 and M3 to the variation in lifespan was less significant than the contribution of markers M5 and M6, which were most strongly associated with lifespan. Indeed, only the significant p-values for the association between the marker allele and lifespan at M5 and M6 survived the Bonferroni correction for multiple tests. It is relevant to recall that the M1 marker is actually located in a gene other than stc, and M1 and M3 are closely linked to M5 and M6, which may explain their association with longevity. The mean lifespans of flies from ILs with different alleles in markers M5 and M6 remained quite constant over time (Figure 3e,f).
We hypothesized that polymorphisms in the regulatory region of the stc gene affect a phenotypic trait, such as lifespan, because they influence gene expression. Our next goal was to test this hypothesis.

2.3. Exploring the Association Between Molecular Variation in the stc 5′ Regulatory Region and stc Expression

Four annotated stc transcripts, two of them experimentally demonstrated to produce proteins (RA and RB differing by 21 nucleotides due to alternative splicing [36]) are reported (https://flybase.org/reports/FBgn0001978 (accessed on 20 August 2026)). stc is predominantly expressed in embryos. According to modENCODE Temporal Expression Data (https://flybase.org/reports/FBgn0001978 (accessed on 20 August 2026)), the level of stc mRNA is rather steady throughout embryogenesis, with very high amounts observed at early stages, and high amounts observed up to 18 h of development. Higher amounts of stc mRNA in early embryos may be explained by the presence of maternally derived transcripts [46]. In larvae, pupae, and adults, stc transcripts are present at low to moderate levels in most tissues, with the exception of high amounts of stc mRNA observed in ovaries. Previously, we demonstrated a substantial decrease in the level of stc transcription in mutant stcKG01230 embryos but not in larvae or adults of any age, whether virgin or mated. This result, coupled with the fact that stcKG01230 caused an increase in lifespan, led us to hypothesize that the regulation of stc expression during early development could be a determining factor for adult lifespan [2].
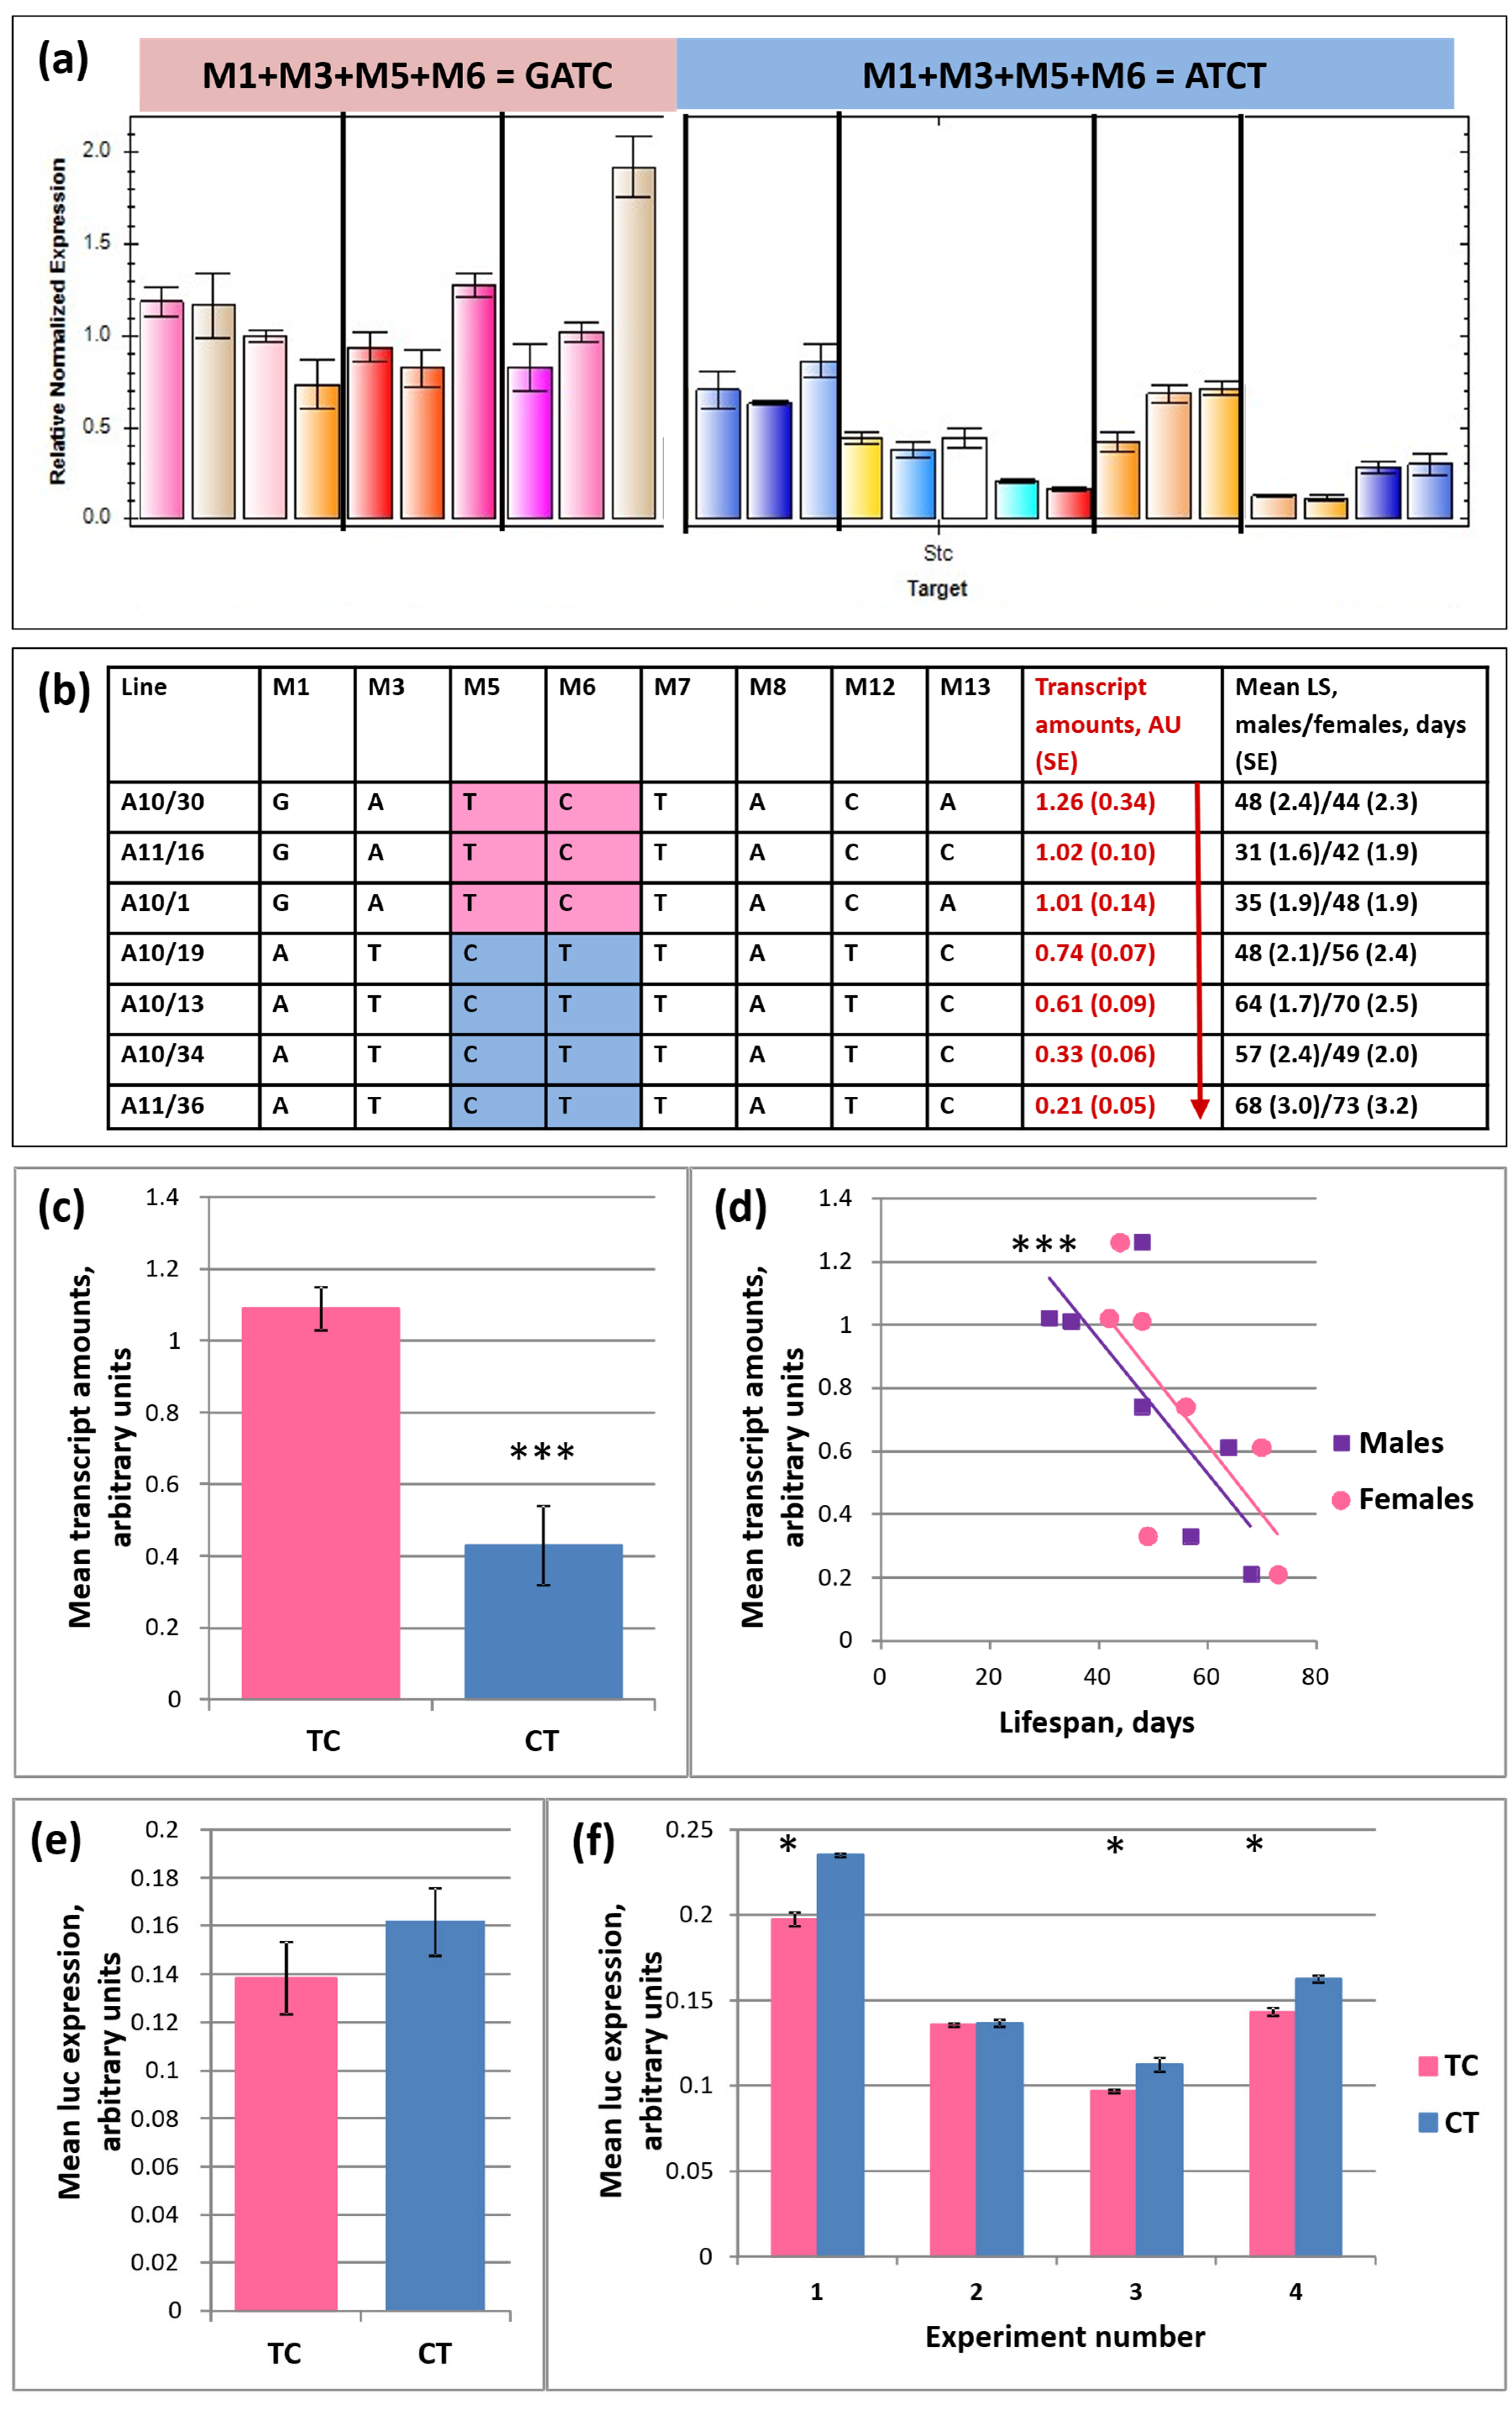
Guided by this information, to assess the impact of naturally occurring variation in the stc 5′ regulatory region on stc transcription, we evaluated the amounts of stc transcripts in 12–24 h embryos using three ILs with TC and four ILs with CT combinations of markers M5 and M6 (Figure 4a,b). Nucleotides at the other six SNPs that were present in our samples at a frequency of 10% or higher are shown in Figure 4b.
Since it is impossible to directly measure the sole RA transcript amount, we estimated the total stc transcript amount. ANOVA revealed a highly significant association between the marker combination and stc expression (p < 0.0001), whereas the specific association of lifespan with the marker combination was borderline non-significant (p = 0.0511). The Kruskal–Wallis test confirmed that stc transcript amounts were significantly different in ILs with the TC and CT genotypes (p < 0.0001; Figure 4c). The presence of C in M5 and T in M6 appeared to be associated with both increased lifespan (Figure 3e,f) and decreased stc expression (Figure 4c). Indeed, a highly significant correlation between the mean lifespans and stc expression was observed in males, females, and when both sexes were combined (p = 0.0269, p = 0.0234, and p = 0.0003, respectively; Figure 4d).
To directly assess the functionality of the naturally occurring polymorphisms and experimentally evaluate the regulatory potential of DNA sequences located upstream of the structural part of the stc gene, we performed a reporter gene assay in D. melanogaster cell culture.

2.4. Effects of Molecular Variation in the stc 5′ Regulatory Region on the Reporter Gene Expression in the S2 Cell Culture

To generate reporter constructs incorporating the firefly luciferase gene, regulated by the stc 5′ regulatory region, the relevant sequences with CT or TC combinations of markers M5 and M6 were inserted into the pGL3-Basic vector (Promega, Madison, WI, USA). Schneider S2 cells were transfected with one or the other of the two pGL3 vectors containing different structural variants of the stc 5′ regulatory region, or with the control pGL3-Basic vector. Relative luciferase activity was measured in transfected cells. In all experiments, luciferase expression in control samples was three orders of magnitude lower than in other cases.
According to ANOVA, the effect of the CT/TC combination on the level of reporter gene expression was highly significant (p = 0.0042). At the same time, ANOVA showed a significant effect of the replicate experiment (p = 0.0001), which led to significant errors in the mean expression values. Therefore, it was not surprising that the reporter gene expression, controlled by CT or TC combinations of markers M5 and M6, was not significantly different when averaged across all experiments (t-test: p = 0.1681; Kruskal–Wallis test: p = 0.3118; Figure 4e). Importantly, in all four replicate experiments, the direction of differences in reporter gene expression controlled by CT or TC combinations remained consistent (in ANOVA, the interaction term—replicate experiment by marker combination—was not significant), and in three experiments the difference in reporter gene expression was significant (t-test: p = 0.006, p = 0.0011, p = 0.0008; Kruskal–Wallis test: p = 0.0495 for each comparison; Figure 4f). Thus, we concluded that the presence of nucleotides T or C in the M5 and M6 positions can influence stc expression. Notably, the direction of the effect in the cell culture experiments turned out to be opposite to the direction of the effect in the ILs (Figure 4).

2.5. Structure of the stc 5′ Regulatory Region

To further confirm the potential functional significance of the identified polymorphic sequences, we studied their correlation with evolutionarily conserved sites using the phastCons and phastConsElements prediction tracks in the UCSC Genome Browser. We compared the level of conservation by analyzing a broader and narrower spectrum of insects (127 species vs. 24 species, including Drosophilidae and a few others), considering that the difference in conservation levels detected by these two approaches would reveal relatively more or less long-standing changes. Of the 14 polymorphisms found in Alexandrov, M6, M7, M8, M10, and M11 appeared to be located in the conserved areas of the stc regulatory region revealed for both the group of 127 and 24 insect species. However, the conservation scores for M6, M7, and M8 were somewhat unexpectedly smaller for the last group (Supplementary Materials List S2). This paradox can possibly be explained by the fact that, although located within conserved areas, these polymorphisms (M6, in particular) are subject to directional selection. This is further supported by their nucleotides having higher selection scores compared to the surrounding nucleotides, as determined based on phyloP data. Apparently, these polymorphisms are located in adaptively important sites within essential and, therefore, conserved regulatory structures in the regulatory region of the gene. This suggestion is in perfect agreement with the significance of these polymorphic sites for determining the expression level of stc demonstrated in this work.
The CAGE data for S2 cells (SRA ID: SRR6508014, [47]) were used to map the 5′-end of the stc transcripts. The mapping revealed that the stc gene exhibits dispersed transcription initiation, with multiple transcription start sites (TSSs) spread over a 66 bp region. Notably, both M10 and M11 fall within the TSS area. Core promoter motifs [37] in the stc 5′ regulatory region were determined using FIMO [48] with a significance threshold of p < 10−4 (Figure 1b). The major promoter motifs 7 and 2 [37] are located in the regions between nucleotides 424 and 436, and nucleotides 465 and 472, respectively, directly upstream of the TSS (Figure 1b). Motif 2 corresponds to the DNA replication element sequence, which is highly conserved among the core promoters of several Drosophila genes. Importantly, no polymorphisms were detected in this crucial region.
It is reasonable to hypothesize that naturally occurring sequence variations in the gene 5′ regulatory region could change binding sites of regulatory proteins and RNAs, contributing to differences in gene expression levels. To elucidate the potential transcription factors binding to the regulatory region of the stc gene, we first analyzed data from the modENCODE project (modENCODE Consortium et al., 2010 [49]). The information from this project is arguably more relevant as it describes experimentally identified transcription factors present in this region. However, the project data are limited to the stages of development at which the analysis was performed, and the accuracy of determining the boundaries of transcription factor binding sites (TFBSs) does not exceed hundreds of nucleotides. According to the modENCODE analysis, the embryonic transcription factor binding hotspot, TFBS_HSA_004897, spans the entire intergenic region between CG15269 and stc. It is associated with seven transcription factors, including those involved in the control of nervous system development during late embryogenesis, namely, H, Disco, Da, D, Dl, Twi, and Cad. Additionally, in white prepupae, enrichment of the Br transcription factor in the region was reported. Our analysis of the raw data for embryos revealed a very similar Broad enrichment peak (MACS_peak_790, 2L:15,113,012..15,113,899).
Using several databases, we predicted TFBSs in the regulatory region of the stc gene. Since predictions from a single algorithm or application are usually less reliable, we have prioritized the TFBSs simultaneously predicted by different approaches. We used the JASPAR 2022 prediction for the Drosophila genome along with the JASPAR 2022 CORE insects collection, the LASAGNA 2.0 application with the Transfac Public database, and Tomtom v.5.5.0 software with Combined Drosophila Databases, all with their default settings, to find the major transcription factors likely to be located in the stc regulatory region (Figure 1a; Supplementary Materials, List S6). LASAGNA and JASPAR predict TFBSs in the entire selected region of the genome, while Tomtom predicts TFBSs within a specified frame of a certain size (11nt or 21nt) around the SNPs in question. This combination of approaches allows us to consider the most likely motifs within the entire area and provide a reasonably accurate prediction of motifs associated specifically with the SNP in question.
Among the transcription factors potentially regulating stc transcription are key proteins involved in the control of early embryogenesis (http://flybase.orgDsx, Hb, Cad, and others), as well as those affecting the development of the nervous system (http://flybase.orgKr, Dl, Gt, Pnr, Br, Nub, Da, Slp1, Slp2, FoxP, Gsb, and others). In total, 14 transcription factors related to the development and function of the nervous system, which can potentially bind to the stc regulatory region, were revealed (Figure 1a; Supplementary Materials, List S6). Both JASPAR 2022 and Tomtom predicted Kr TFBS at M2 and Slp1 TFBS at M11. However, the JASPAR 2022 prediction score for Slp1 was slightly below the threshold level (Supplementary Materials, List S6). Similarly, at M6, both Tomtom and JASPAR2022 predicted TFBSs for Slp1 and Slp2, although the JASPAR2022 score was slightly below the threshold level (Supplementary Materials, List S6). Given their known similar expression patterns, particularly in the embryonic head [50], and their tendency to form functional complexes during neuronal cell specification [51], the simultaneous prediction of Slp1 and Slp2 in the same area makes their cooperative presence appear more likely. Also, at M6, a TFBS for the Broad transcription factor was predicted by both JASPAR 2022 and LASAGNA. The JASPAR 2020 prediction specifically associates the predicted motif matching M6 with Br (var.4), suggested to be involved in the development of certain groups of neurons [52]. Several TFBSs are predicted for transcription factors belonging to the Fork head box family: Fkh, Croc, Bin, Slp1, Slp2, and FoxP. Forkhead TFBS at M6 is predicted by both JASPAR 2022 and Tomtom. The fact that the DNA sequences surrounding M6 are enriched with predicted binding sites of various transcription factors (Figure 1a) reinforces the assumption that this site may be involved in the regulation of transcription. Of all the transcription factors for which binding sites in the stc regulatory region were predicted, only Cad, Dl, and Br were found there experimentally, according to the modENCODE project data [49].
The 11-nucleotide insulator was detected in the stc 5′ regulatory region (https://flybase.org/jbrowse/?data=data%2Fjson%2Fdmel&loc=2L%3A15110854..15122423&tracks=Gene_span&highlight= (accessed on 20 August 2026)). Interestingly, the putative binding site of the CTCF, a ubiquitous transcription factor that binds to insulators and domain boundaries, was found nearby (Figure 1a). Also, three overlapping target sites for regulatory RNAs (Dme-mir-1010, Dme-mir-1012, Dme-mir-303) were found in the stc 5′ UTR (http://www.flymine.org/query/ (accessed on 20 August 2026)). However, no polymorphic sites were detected within these sequences (Figure 1a).
Overall, this brief analysis showed that the stc 5′regulatory region has good regulatory potential, and nucleotide substitutions revealed in populations might well affect gene transcription and, as a result, a complex phenotype and lifespan. Notably, the M6 marker associated with stc transcription and lifespan is located in the DNA region most rich in potential TFBSs.

3. Discussion

In this paper, we demonstrated that naturally occurring polymorphism in two sites located in the 5′ regulatory region of the stc gene was associated with variation in a complex quantitative trait, lifespan, and the level of stc transcription. It remains to be elucidated whether these results are characteristic of this particular population or if they will be reproduced in other populations, and if yes, whether it would depend on their habitat or not. Work in this direction is currently in progress, but we already have reason to believe that the trends identified are universal, since both population studies and laboratory experiments demonstrated that it is the reduction in the stc transcription level at the embryonic stage that leads to an increase in longevity. We believe that analysis of the natural variation in gene regulatory regions followed by laboratory tests has several advantages for studying molecular mechanisms controlling gene expression compared to purely laboratory studies. The population approach allows us to find precisely those fragments of the regulatory region of a gene that effectively influence transcription and phenotype in vivo and to assess the subtle effects of changes in individual nucleotides on these traits using both genome-wide [19] and individual gene [30] analyses.
To prove the causative role of a particular naturally occurring variation in the control of gene expression and phenotype and to exclude hitchhiking effects, in several recent publications, the study of genotype-transcription associations in natural populations has been supplemented by direct experimental verification of the effects identified. For example, it has been demonstrated that three closely linked SNPs located in the regulatory sequences controlling the expression of the pigmentation gene tan and associated with pigmentation variation in natural D. melanogaster populations [53] affected abdominal and thoracic pigmentation in transgenic females expressing tan under the regulation of the cloned sequences containing candidate SNPs [54,55]. The impact of SNPs on gene expression has been confirmed by analyzing their effect on reporter gene expression in cell cultures and different tissues of transgenic flies. Five of the six cloned genetically variable upstream regulatory regions of P450 genes demonstrated different gene expression patterns in the renal tissues of transgenic flies [20]. We have explored in detail the role of variation in the regulatory region of the Lim3 gene in controlling reporter gene expression in embryos and various larval and adult tissues [30]. The effects of three SNPs and various parts of the core and distal promoter, including putative binding sites of regulatory proteins, were first evaluated in transfected cell cultures and then confirmed in transgenic flies.
Here, we evaluated the effects of two SNPs located in the stc 5′ regulatory region on gene expression. While the effect of single substitutions in the Lim3 regulatory region on gene expression in cell culture has not been detected [30], the effect of SNPs located in the stc 5′ regulatory region, although small, was significant. The modest impact on reporter gene expression was anticipated, because it was caused by changing just two nucleotides in the DNA sequence. The direction of the effect in experiments with cell culture was opposite to the direction of the effect initially observed in ILs. This directional discrepancy, combined with a non-significant pooled average across the biological replicates, highlights a clear limitation of our in vitro assay. Thus, the reporter construct should be interpreted as evidence of regulatory capacity rather than a direct confirmation of endogenous in vivo expression mechanics. Even though the expression was measured in embryos and in the S2 cells derived from embryos, one obvious explanation for this fact may be attributed to different regulatory signals in living organisms compared to a particular cell culture strain. In particular, the S2 cells are commonly believed to have the characteristics of hemocytes [56], while at least some of the stc lifespan effects can be attributed to the changes in its expression in the nervous system [2]. Additionally, given that significant SNPs were in strong LD with each other and several surrounding SNPs in our samples, and could potentially be linked to some distant polymorphisms, it is also possible that the observed discrepancy is due to background effects present in ILs but absent in the reporter constructs. Indeed, background effects have been found to be widespread [11]. Furthermore, it has been demonstrated that most expression variation found in D. melanogaster strains from different populations can be attributed to trans-regulation [28]. A plausible hypothesis is that at least several linked markers (M1, M3, M5, and M6) may form a functional haplotype block involved in lifespan regulation and possibly correspond to blocks believed to represent joint targets for selection and adaptation [57]. On the whole, we found our results to be informative and therefore limited the study to cell culture. Despite some inconsistency and regardless of possible background effects, nucleotide substitutions in the M5 and M6 polymorphic sites located in the stc 5′ regulatory region were demonstrated to influence gene expression. We believe that further studies should prioritize the analysis of the effects on gene expression of newly identified SNPs in other populations, along with their combinations. This approach would allow us to experimentally address background effects.

3.1. Temperature Adaptation

One of the main adaptations associated with moving from south to north is temperature adaptation. Many other factors, such as the influence of environmental humidity and the speed and specificity of animal metabolism, are largely modulated by the ambient temperature, and these factors together pose one of the main challenges for the geographic invasion of species from geographically southern regions to the north. This issue is relevant not only for insects; it is equally important in the long-term adaptation process for higher mammals and humans [58].
Given the observed geographic dependence of the variant frequency distribution of our polymorphism sites, particularly M6, we may speculate that it is also associated with transcription factor motifs regulating stc expression, which is also under the pressure of ecological selection. It is known that divergent selection between neighboring thermal environments is often strong enough to maintain a bimodal distribution of genotypes [59].
Since we observe the strongest dependence of our polymorphism site M6 on latitude, with the ‘T’ variant frequency reaching 100% in southern populations, and we assume that this site is part of the predicted binding motif for several Forkhead family TFs (in particular, Fkh and Croc), it is important to understand the possible pathways of their involvement in the overall regulation of temperature adaptation, particularly to cold. Indeed, it is known that the transcriptional regulator FOXC2 of the Forkhead family, homologs of which are known in many mammals, including mice and humans, is involved in cold adaptation regulation [60]. This regulation is believed to be associated with both triglyceride synthesis regulated by the insulin pathway and stimulation of non-shivering thermogenesis through uncoupling of ATP synthesis. Another transcription factor from the Forkhead family, Foxo, is also known to be involved in Drosophila’s clinal adaptation through the insulin/insulin-like growth factor signaling pathway, regulating overall fitness [61]. Although Croc is known to have TF-TF interactions with FOXO [62], its known developmental functions lie in head morphogenesis [63], so the greater significance may lie not in the general protein homology but in the specific properties of the Forkhead domain of other TFs, also predicted to bind the motif containing M6, particularly Forkhead, which is known to be involved in more diverse physiological processes, including growth control through the Tor pathway [64], fatty acid metabolism, hormone-regulated signaling pathways [65], and lifespan determination when expressed in adult nerve cells. The same lifespan-controlling effects were reported for glial foxo expression [66]. Taking this into account, we may suggest Stc to be another important target of Forkhead lifespan-prolonging regulation in the nervous system.
An alternative mechanism of temperature adaptation in insects is the seasonal regulation of diapause under unfavorable conditions, which is functionally similar to hibernation in other animals. Protein regulators of the Forkhead family may also participate in the regulation of this process [67]. Interestingly, the 5′ regulatory region of stc is expected to contain many binding sites for the Br protein, which regulates the response to ecdysone. Its binding sites coincide, including with the M5 SNP, detected near the possible Forkhead-binding M6. Since both proteins have a common partner, Ada2b, similar to Stc, it can be hypothesized that they may mutually regulate each other’s functions and jointly participate in temperature adaptation, alternatively through the regulation of developmental arrest and diapause processes.
Given these possible mechanisms contributing to climatic adaptation, the regulation of stc expression, important for latitudinal variability, may be carried out jointly by proteins of the Br and Forkhead families and may be involved in thermogenesis mechanisms (possibly through the regulation of SERCA expression being a putative Stc target), as well as through the temporal regulation of organism development processes related to developmental rate, diapause, and developmental arrest.
Studying the role of latitudinal variability in the regulatory region of the stc gene (likely associated with cold adaptation), it is also interesting to realize that this evolutionary process likely correlates with changes in lifespan, which, as we have shown, is influenced by stc expression. The role of metabolic shifts associated with this adaptation, as well as changes in developmental stage boundaries, is evident, and all these processes may participate in regulating the balance between metabolism rate and aging [68].
Given the potential role of Stc in thermogenesis, another possible function of this protein, in addition to its role in neurogenesis, could be of importance too. It is known that the human homolog of Stc, NF-X1, regulates inflammation [69], and Stc itself may be involved in the Imd pathway signaling through interaction with Tab2 [70]. Thermogenesis and fever are known to be induced in the brain through pro-inflammatory factors [71], so this conservative pathway may also explain the potential role of Stc in regulating thermogenesis.

3.2. TFBSs in the stc Regulatory Region

Several potential TFBSs were identified in the vicinity of the M5 and M6 markers. However, not all of these sites may be functional due to the limitations of prediction algorithms and relatively poor ability of eukaryotic transcription factors to specifically recognize target DNA sequences [72]. Given the known functions of endogenous Stc expression during 14–20 h of embryo in neuronal formation and particularly axon guidance [36], it would be reasonable to focus on the motifs for regulatory proteins potentially involved in these processes. The M5 and M6 markers colocalize with the putative binding sites of transcription factors involved in neurogenesis. For example, Dl regulates the development of the dorsoventral axis of the embryo, including the laying down of the ventral nerve circuit [73] and development of the peripheral nervous system [74]. Another important transcription factor, D, also regulates the development of the dorsoventral axis of the embryo, brain development, and the direction of axon and dendrite growth [75]. Br is known to lengthen the Drosophila lifespan [76]. Recognition sites for other transcription factors important for nervous system development were also predicted in the stc 5′ regulatory region, including H (peripheral neurogenesis), Disco (brain development), Da (neurogenesis) and others (Figure 1). The known functions of Twi, which is potentially capable of binding to the stc regulatory region, do not align with those of Stc. Nevertheless, experimental evidence has demonstrated functional interactions between Twist and Daughterless [77,78] and Twi and Dl [79,80] supporting their involvement in shared regulatory complexes. TFs from the Forkhead box (FOX) family are of special interest. FoxP was predicted to participate in the control of locomotion and various forms of learning and behaviour (http://flybase.org/reports/FBgn0262477 (accessed on 20 August 2026)), while Fkh was predicted to impact ageing [81]. TFs regulating other processes also potentially bind to the stc regulatory region. Cad, for instance, could be associated with the regulation of another potential function of stc related to the control of innate immunity (https://www.kegg.jp/dbget-bin/www_bget?dme:Dmel_CG3647 (accessed on 20 August 2026)).
The colocalization of recognition sites for various TFs within the regulatory region of the stc gene indirectly confirms the functional importance of the entire putative TFBSs located in this region. Broad and Forkhead were reported to form complexes with Ada2b, one of the few known protein partners of Stc (according to Flybase data, processed by esyN v.2.1 [82] (Figure 1c). It can be assumed that various factors forming common regulatory protein complexes jointly control Stc participation in transcriptional cascades and nervous system development. Further experiments are required to demonstrate which regulatory proteins indeed bind to the stc 5′ regulatory region and whether this binding is dependent on SNPs located in this region. Importantly, the question of how changes in gene expression at the embryonic stage can affect the lifespan of the adult fly remains open. We suggested that the long-term effects of the early-life changes in transcription might be epigenetically inherited in cell lineages. Alternatively, the Stc transcription factor might participate in transcriptional cascades, predetermining structural and therefore functional properties of the adult fly [2]. Testing these assumptions is part of our plans, and the first results certify that, at least at the larval stage, the structure of neurons is altered due to a change in the functional status of the stc gene in embryos.

4. Materials and Methods

4.1. Drosophila Melanogaster

D. melanogaster females were captured from a private apple garden in a small hamlet, devoid of supermarkets or fruit markets, situated several kilometers from Alexandrov, Russia, at the coordinates (56.41° N, 38.72° E). Flies were manually collected from the surface of apple heaps, spanning late August to early October in the years 2010, 2011, 2012, and 2014.
Each year, we initiated between 40 and 60 isofemale lines from females captured in nature. The phenotype of males in their progeny was examined to prevent possible contamination by Drosophila simulans. Although wild-caught D. simulans are rare at this locality, caught females were sorted in the lab using the broad pigmentation band on the 5th abdominal segment, and line purity was verified in the F1 generation using male genital traits and diagnostic genetic crosses. Each line underwent 20–22 generations of brother × sister inbreeding, effectively minimizing their genetic heterogeneity. The resulting inbred lines (ILs) were then used for experiments.

4.2. Tests for Wolbachia

As detailed earlier [83], prior to the experiments, all ILs underwent qPCR screening for the presence of Wolbachia, a symbiont known to affect life history traits in D. melanogaster [84]. Detection was performed using the MiniOpticon Real-Time PCR System (Bio-Rad, Hercules, CA, USA) with primers targeting the Wolbachia 16S rRNA gene, 5′-CATACCTATTCGAAGGGATAG-3′ and 5′-AGCTTCGAGTGAAACCAATTC-3′ [85]. In the Alexandrov population infection rates for 2010, 2011, 2012, and 2014 were observed at 80%, 82.2%, 67.9%, and 50.7%, respectively [86]. Wolbachia-positive lines were treated with tetracycline in laboratory food (0.25 mg/mL [87]) for three generations, followed by three generations of recovery before being utilized in lifespan assays.

4.3. PCR and Sequencing

DNA was extracted from batches of 20 flies of each genotype using a standard phenol-chloroform procedure [88]. DNA was used in PCR reactions with primers s15m, 5′-ACCCTTCTCAGCAATCTCAGGA-3′ and pstc2-3m, 5′-CGCCCAGGGAGAAGTTAGTGTA-3′. PCR products were purified with acrylamide gel electrophoresis and sequenced on the ABI PRIZM 310 Genetic Analyzer (Applied Biosystems, Waltham, MA, USA) using the sequencing primers s0, 5′-CAAAGTGCAGTACTTCCACTGTT-3′ and as0, 5′-CTGCCATGGCGGATGACTCA-3′ and the Big Dye Terminator V. 3.1. Kit (Applied Biosystems, Waltham, MA, USA), according to the manufacturer’s protocol. DNA sequences were deposited in GenBank; accession numbers will be provided during review.

4.4. Lifespan Assay

Lifespan was measured following the protocol detailed in [2]. Five virgin flies of the same genotype and sex, all collected on the same day from cultures with moderate density, were placed in replicate vials. Flies were transferred to vials with fresh food containing approximately 5 mL of standard medium weekly. The number of dead flies was recorded daily. The ILs from Alexandrov in 2010 and 2011 were organized into two groups of 25 lines each. Lifespan measurements were conducted sequentially for each group in turn, with several reference lines included in each experiment. The sample size comprised 25 flies per sex per genotype. Subsequently, the lines were redistributed into groups, and the lifespan measurements were repeated following the same protocol. In two lines the lifespan was measured only once because they died after that. The lifespan measurements for the ILs of Alexandrov 2014 followed the same protocol three years later. The total sample sizes amounted to 50 to 80 flies per line/sex. Lifespan, calculated as the number of days from eclosion to death for each fly, was used to estimate mean lifespans, serving as the primary characterization of longevity in this study.

4.5. Real-Time RT-qPCR

As detailed in [83], total RNA for the real-time reverse transcription quantitative PCR (RT-qPCR) was extracted from 50–100 μL of embryos aged 12–24 h. Embryos were collected in PBS buffer on ice, and the extractions were performed using the TRIzol reagent (Invitrogen, Carlsbad, CA, USA) and DNase I (Sigma-Aldrich, St. Louis, MO, USA), following the manufacturers’ instructions.
First-strand cDNA was synthesized from approximately 1 μg of the total RNA using SuperScript II Reverse Transcriptase (Invitrogen, Carlsbad, CA, USA) with oligo(dT)15 primers, following the manufacturer’s instructions. The amounts of cDNA were determined by RT-qPCR with SYBR Green I in the MiniOpticon real-time PCR detection system (Bio-Rad, Hercules, CA, USA).
The housekeeping genes gdh (glutamate dehydrogenase) and adh (alcohol dehydrogenase), characterized by relatively low expression levels comparable to that of stc, were used as reference genes to normalize for differences in total cDNA quantity between the samples. The forward and reverse primer sequences used were as follows:
For stc:
stc-rt1, 5′-AACAGGCACAGCAACAACAA-3′
stc-rt2, 5′-CCAGGGAGAAGTTAGTGTAGC-3′
For gdh:
Gdh1 5′-TATGCCACCGAGCACCAGATTCC-3′
Gdh2 5′-GGATGCCCTTCACCTTCTGCTTCTT-3′
For adh:
Adhd3: 5′-CGGCATCTAAGAAGTGATACTCCCAAAA-3′
Adhr3: 5′-TGAGTGTGCATCGAATCAGCCTTATT-3′.
The relative gene expression was evaluated using CFX Manager v. 3.1 software (Bio-Rad, Hercules, CA, USA, 2013). Independent inbred lines (ILs) were treated as the true independent biological units of observation. For each unique IL, three to four independent RNA extractions were performed to serve as biological sub-replicates. Finally, three technical qPCR replicates were executed for each individual RNA extraction. The averaged results of technical replicates were used for further analysis.

4.6. Vector Construction for the Dual Luciferase Expression Assay

The 1100 bp fragment located upstream of the structural part of the stc gene was PCR-amplified using DNA of the IL originating from the Alexandrov population and the following primers: fw1, 5′-ACCCTTCTCAGCAATCTCAGGA-3′; rev1, 5′-CTGACGTTGCCTCCAGTGCT-3′.
At Evrogen (https://evrogen.ru, Moscow, Russia), the initial CT combination of nucleotides at markers M5 and M6 was changed for the TC combination using site-directed mutagenesis, and the 928 bp fragments, including the stc 5′ regulatory region and 5′ UTR with CT or TC combinations of nucleotides at markers M5 and M6 were cloned into the polylinker of the pGL3-Basic vector (Promega, Madison, WI, USA, https://www.addgene.org/vector-database/2929/ (accessed on 20 August 2026)), which contained cDNA encoding firefly luciferase without any eukaryotic promoter or enhancer sequences. As a result, the stc 5′ regulatory sequences were located next to the luciferase gene so that they could regulate its expression. Several plasmids of each type were sequenced, and only plasmids with the correct sequences were used in subsequent experiments.

4.7. Transient Transfection and Dual Luciferase Expression Assay

Drosophila Schneider S2 cells obtained from the collection of NRC “Kurchatov Institute”—IMG were grown at 25 °C in Schneider’s Drosophila Medium (Thermo Fisher Scientific Inc., Waltham, MA, USA) supplemented with 10% heat-inactivated fetal bovine serum (FBS, Thermo Fisher Scientific Inc., Waltham, MA, USA), 50 units/mL penicillin, and 50 µg/mL streptomycin. One milliliter of 2 × 10⁶ cells/mL was seeded per well and rinsed with serum-free medium two hours before transfection. Transient transfection was performed using FuGENE® HD (Roche, Basel, Switzerland) according to the manufacturer’s instructions.
Cells were co-transfected with each of the two vector constructions described above and the pAcRL vector [89] kindly provided by O. G. Maksimenko (1.0 and 0.1 μg per well, respectively). The pAcRL vector expressing Renilla luciferase under the actin promoter was used as a reference to normalize the activity of the experimental reporters.
Transfected cells were analyzed using a Dual-Luciferase Reporter Assay System (Promega, Madison, WI, USA), following the manufacturer’s instructions. Luminescence was measured with a Modulus Microplate Luminometer (Turner BioSystems Inc., Sunnyvale, CA, USA). The relative luciferase activity was determined by calculating the ratio of firefly luciferase luminescence to Renilla luciferase luminescence. The background level of firefly luciferase activity was estimated as the ratio of the luminescence of the pGL3-Basic vector to the luminescence of the pAcRL vector. Four independent plasmid isolations were performed, followed by three cell transformation replicates in each case.

4.8. Bioinformatics Assays

The evolutionary conservation of the stc 5′ regulatory region was estimated using PhastCons and phastConsElements prediction tracks in the UCSC Genome Browser (https://genome.ucsc.edu/).
Embryonic TFBS hotspots across the entire stc 5′ regulatory region were assessed using the modENCODE project analysis [49]. Specific TFBS motifs within the analyzed sequences were predicted using the LASAGNA-search tool [90] with the Transfac 8.3 database and JASPAR 2022 in the UCSC Genome browser with a default score >400, equivalent to p = 10 × 10−4 (https://genome.ucsc.edu/cgi-bin/hgTracks?db=dm6&hubUrl=http://expdata.cmmt.ubc.ca/JASPAR/UCSC_tracks/hub.txt (accessed on 20 August 2026), [91]) with their respective databases. Additional analysis of TFBS motifs matching SNPs was performed using a 21 nt frame centered on the SNP in question using Tomtom v.5.5.0 with the Combined Drosophila Databases at default settings (E < 10, motifs found for both strands) [92].

4.9. Statistical Analyses

Parameters characterizing LD, nucleotide diversity (π, θ), and selection (Tajima’s D, Fu and Li’s D* and F*) in the 5′ regulatory region and 5′ UTR of the stc gene were calculated using DnaSP 6.12.03 software [93,94]. LD was considered significant if both the Fisher test and the Chi-square test for a pairwise comparison survived Bonferroni correction.
Standard descriptive statistical analysis of lifespan [95,96] was performed to determine the mean lifespan and its accompanying variances, standard deviations, and standard errors; the median, minimum, and maximum lifespans, as well as the lifespans of the lower and upper quartiles and the 10 and 90 percentiles using OASIS 2: Online Application for Survival Analysis 2 [97]. We estimated survival curves using the Kaplan–Meier procedure. SAS Studio v.3.8 University Edition (SAS Institute Inc., Cary, NC, USA) was used to compare frequencies of polymorphic markers (the ANOVA procedure), to analyze the association between polymorphic markers and lifespan, and between polymorphic markers and stc transcript amounts (the GLM procedure), to compare lifespans and stc transcript amounts in ILs and transfected cells with different polymorphisms (the GLM [means line/Tukey], TTEST and NPAR1WAY [Wilcoxon] procedures), as well as to estimate correlations between mean lifespans and mean stc transcript amounts in ILs (the CORR [Spearman] procedure).

Supplementary Materials

The following supporting information can be downloaded at: https://www.mdpi.com/article/10.3390/ijms27188343/s1.

Author Contributions

Conceptualization, A.V.S. and E.G.P.; methodology, A.V.S., N.V.R., O.Y.R., E.A.M., A.V.K., D.V.M. and E.G.P.; formal analysis, A.V.S., A.V.K. and E.G.P.; investigation, A.V.S., E.A.T., N.V.R., O.Y.R., E.A.M., V.E.A. and D.V.M., data curation, A.V.S.; writing—original draft preparation, E.G.P.; writing—review and editing, A.V.S., E.A.T., N.V.R., O.Y.R., E.A.M., A.V.K., V.E.A., D.V.M. and E.G.P.; visualization, A.V.S., A.V.K. and E.G.P.; supervision, E.G.P.; funding acquisition, E.G.P. All authors have read and agreed to the published version of the manuscript.

Funding

This research was carried out within the state assignment of the National Research Centre “Kurchatov Institute” (bioinformatics analysis, sequencing and phenotyping) and partly funded by the Russian Foundation for Basic Research grant #18-04-01127-a for E.G.P. (initial round of sequencing and phenotype assessment).

Institutional Review Board Statement

Not applicable.

Informed Consent Statement

Not applicable.

Data Availability Statement

The original contributions presented in this study are included in the article/Supplementary Materials. Further inquiries can be directed to the corresponding author. The nucleotide sequence data characterized in this study for the Alexandrov population have been deposited in the GenBank database under the accession numbers QB015958–QB016068.

Acknowledgments

We are grateful to members of the DrosEU Consortium for fruitful discussions.

Conflicts of Interest

The authors declare no conflicts of interest.

Abbreviations

The following abbreviations are used in this manuscript:
D. melanogasterDrosophila melanogaster
ILInbred line
LDLinkage disequilibrium
stcshuttle craft
TFTranscription factor
TFBSTranscription factor binding site
TSSTranscription start site

Appendix A

Table A1. Parameters characterizing nucleotide diversity and selection at the 5′ regulatory region and 5′ UTR of the stc gene.
PopulationLocationYear
No. of Sequences
Gene Region (Nucleotide Position)Number of SNPsπ (s.d.) 4D 4
Alexandrov (Russia)56.41 N;
38.72 E;
189 m 1
2010
19
1–868190.00604 (0.00064)−0.13865
1–7110.00741 (0.00056)1.54705
72–45890.00734 (0.00094)0.36185
459–86890.00455 (0.00067)−0.95337
2011
40
1–868180.00520 (0.00056)0.21592
1–7110.00693 (0.00050)1.56204
72–458100.00657 (0.00078)0.24272
459–86870.00360 (0.00044)−0.28395
2012
18
1–868150.00553 (0.00089)0.37841
1–7110.00598 (0.00140)0.86950
72–45880.00723 (0.00121)0.70455
459–86860.00384 (0.00074)−0.31945
2014
32
1–868170.00518 (0.00056)0.21987
1–7110.00656 (0.00079)1.33679
72–45890.00677 (0.00077)0.52933
459–86870.00344 (0.00049)−0.55060
Chernobyl (Ukraine)51.28 N
30.21 E
118 m 1
2012
33
1–868220.00506 (0.00048)−0.65472
1–7110.00710 (0.00047)1.57953
72–458100.00531 (0.00072)−0.51261
459–868110.00447 (0.00048)−1.02050
Varva (Ukraine)50.50 N
32.72 E
128 m 1
2012
28
1–868190.00476 (0.00034)−0.54166
1–7130.00917 (0.00139)−0.37405
72–45870.00472 (0.00045)0.04440
459–86890.00403 (0.00045)−0.90011
Uman (Ukraine)48.75 N
30.22 E
215 m 1
2012
35
1–868210.00548 (0.00061)−0.22670
1–7120.00805 (0.00082)0.34592
72–458120.00664 (0.00096)−0.37513
459–86870.00395 (0.00046)−0.13351
Lyon (France) 245.77 N
4.86 E
175 m 1
2010
32
1–868180.00494 (0.00047)−0.13640
1–7120.00894 (0.00116)0.56027
72–45880.00508 (0.00066)−0.02822
459–86880.00412 (0.00046)−0.45048
Fiche (Ethiopia) 39.81 N
38.63 E
3070 m 1
2011
15
1–868200.00778 (0.00100)−0.35358
1–7110.00741 (0.00056)1.54705
72–458120.00972 (0.00123)0.07534
459–86870.00400 (0.00102)−0.86102
Gikongoro (Rwanda) 22.49 S
28.92 E
1927 m 1
2008
25
1–868230.00570 (0.00079)−0.81502
1–7130.01296 (0.00327)0.39230
72–458140.00820 (0.00106)−0.50021
459–86860.00208 (0.00071)−1.38476
Siavonga (Zambia) 216.54 S
28.72 E
530 m 1
2010
137
1–868570.00874 (0.00021)−0.98729
1–7150.01483 (0.00115)0.31768
72–458340.01165 (0.00037)−0.80875
459–868180.00495 (0.00031)−1.04531
Nucleotide positions start from the first nucleotide of the sequenced region and are continued according to the reference sequence (conventional sequence coordinates are 2L:15,113,022..15,113,888 using the D. melanogaster genome assembly Release 6 plus ISO1 MT (dm6, RefSeq accession: GCF_000001215.4), regardless indel variation in the natural populations. Nucleotide positions from 1 to 71 correspond to the CG15269 3′UTR; nucleotide positions from 72 to 458 correspond to the 5′ regulatory region of stc; nucleotide positions from 459 to 868 correspond to the 5′ UTR of stc. 1 Meters above the sea level. 2 http://dpgp.org, [31]. 3 http://dpgp.org, [31,32]. 4 Parameters were calculated using DnaSP 6.12.03 software [93,94].

References

  1. Levine, M.; Cattoglio, C.; Tjian, R. Looping back to leap forward: Transcription enters a new era. Cell 2014, 157, 13–25. [Google Scholar] [CrossRef] [Scilit] [PubMed]
  2. Roshina, N.V.; Symonenko, A.V.; Krementsova, A.V.; Trostnikov, M.V.; Pasyukova, E.G. Embryonic expression of shuttle craft, a Drosophila gene involved in neuron development, is associated with adult lifespan. Aging 2014, 6, 1076–1093. [Google Scholar] [CrossRef] [Scilit] [PubMed]
  3. Symonenko, A.V.; Roshina, N.V.; Krementsova, A.V.; Rybina, O.Y.; Pasyukova, E.G. Shuttle craft Gene Affects Lifespan of Drosophila melanogaster by Controlling Early Development and Modifying Aging Program. Biochemistry 2022, 87, 1611–1621. [Google Scholar] [CrossRef] [Scilit] [PubMed]
  4. Mateo, L.; Rech, G.E.; Gonzalez, J. Genome-wide patterns of local adaptation in Western European Drosophila melanogaster natural populations. Sci. Rep. 2018, 8, 16143. [Google Scholar] [CrossRef] [Scilit] [PubMed]
  5. Lerat, E.; Goubert, C.; Guirao-Rico, S.; Merenciano, M.; Dufour, A.B.; Vieira, C.; Gonzalez, J. Population-specific dynamics and selection patterns of transposable element insertions in European natural populations. Mol. Ecol. 2019, 28, 1506–1522. [Google Scholar] [CrossRef] [Scilit] [PubMed]
  6. Chapman, J.R.; Hill, T.; Unckless, R.L. Balancing Selection Drives the Maintenance of Genetic Variation in Drosophila Antimicrobial Peptides. Genome Biol. Evol. 2019, 11, 2691–2701. [Google Scholar] [CrossRef] [Scilit] [PubMed]
  7. Erickson, P.A.; Weller, C.A.; Song, D.Y.; Bangerter, A.S.; Schmidt, P.; Bergland, A.O. Unique genetic signatures of local adaptation over space and time for diapause, an ecologically relevant complex trait, in Drosophila melanogaster. PLoS Genet. 2020, 16, e1009110. [Google Scholar] [CrossRef] [Scilit] [PubMed]
  8. Kapun, M.; Barron, M.G.; Staubach, F.; Obbard, D.J.; Wiberg, R.A.W.; Vieira, J.; Goubert, C.; Rota-Stabelli, O.; Kankare, M.; Bogaerts-Marquez, M.; et al. Genomic Analysis of European Drosophila melanogaster Populations Reveals Longitudinal Structure, Continent-Wide Selection, and Previously Unknown DNA Viruses. Mol. Biol. Evol. 2020, 37, 2661–2678. [Google Scholar] [CrossRef] [Scilit] [PubMed]
  9. Pegoraro, M.; Sayegh Rezek, E.; Fishman, B.; Tauber, E. Nucleotide Variation in Drosophila cryptochrome Is Linked to Circadian Clock Function: An Association Analysis. Front. Physiol. 2022, 13, 781380. [Google Scholar] [CrossRef] [Scilit] [PubMed]
  10. Akhund-Zade, J.; Bergland, A.O.; Crowe, S.O.; Unckless, R.L. The Genetic Basis of Natural Variation in Drosophila (Diptera: Drosophilidae) Virgin Egg Retention. J. Insect Sci. 2017, 17, 5. [Google Scholar] [CrossRef] [Scilit] [PubMed]
  11. Baath, S.; Merritt, T.J.S. Biological Effects of Single-Nucleotide Polymorphisms in the Drosophila melanogaster Malic Enzyme Locus. Biochem. Genet. 2020, 58, 129–156. [Google Scholar] [CrossRef] [Scilit] [PubMed]
  12. Huang, W.; Campbell, T.; Carbone, M.A.; Jones, W.E.; Unselt, D.; Anholt, R.R.H.; Mackay, T.F.C. Context-dependent genetic architecture of Drosophila life span. PLoS Biol. 2020, 18, e3000645. [Google Scholar] [CrossRef] [Scilit] [PubMed]
  13. Wilson, K.A.; Beck, J.N.; Nelson, C.S.; Hilsabeck, T.A.; Promislow, D.; Brem, R.B.; Kapahi, P. GWAS for Lifespan and Decline in Climbing Ability in Flies upon Dietary Restriction Reveal decima as a Mediator of Insulin-like Peptide Production. Curr. Biol. 2020, 30, 2749–2760.e3. [Google Scholar] [CrossRef] [Scilit] [PubMed]
  14. Zhang, W.; Reeves, G.R.; Tautz, D. Identification of a genetic network for an ecologically relevant behavioural phenotype in Drosophila melanogaster. Mol. Ecol. 2020, 29, 502–518. [Google Scholar] [CrossRef] [Scilit] [PubMed]
  15. Li, F.; Rane, R.V.; Luria, V.; Xiong, Z.; Chen, J.; Li, Z.; Catullo, R.A.; Griffin, P.C.; Schiffer, M.; Pearce, S.; et al. Phylogenomic analyses of the genus Drosophila reveals genomic signals of climate adaptation. Mol. Ecol. Resour. 2022, 22, 1559–1581. [Google Scholar] [CrossRef] [Scilit] [PubMed]
  16. Layh, S.; Nagarajan-Radha, V.; Lemos, B.; Dowling, D.K. Y chromosome-linked variation affects locomotor activity in male Drosophila melanogaster and is robust to differences in thermal environment. Heredity 2023, 130, 312–319. [Google Scholar] [CrossRef] [Scilit] [PubMed]
  17. Pallares, L.F.; Lea, A.J.; Han, C.; Filippova, E.V.; Andolfatto, P.; Ayroles, J.F. Dietary stress remodels the genetic architecture of lifespan variation in outbred Drosophila. Nat. Genet. 2023, 55, 123–129. [Google Scholar] [CrossRef] [Scilit] [PubMed]
  18. Flatt, T. Life-History Evolution and the Genetics of Fitness Components in Drosophila melanogaster. Genetics 2020, 214, 3–48. [Google Scholar] [CrossRef] [Scilit] [PubMed]
  19. Sato, M.P.; Makino, T.; Kawata, M. Natural selection in a population of Drosophila melanogaster explained by changes in gene expression caused by sequence variation in core promoter regions. BMC Evol. Biol. 2016, 16, 35. [Google Scholar] [CrossRef] [Scilit] [PubMed]
  20. Glaser-Schmitt, A.; Zecic, A.; Parsch, J. Gene Regulatory Variation in Drosophila melanogaster Renal Tissue. Genetics 2018, 210, 287–301. [Google Scholar] [CrossRef] [Scilit] [PubMed]
  21. Everett, L.J.; Huang, W.; Zhou, S.; Carbone, M.A.; Lyman, R.F.; Arya, G.H.; Geisz, M.S.; Ma, J.; Morgante, F.; Armour, G.; et al. Gene expression networks in the Drosophila Genetic Reference Panel. Genome Res. 2020, 30, 485–496. [Google Scholar] [CrossRef] [Scilit] [PubMed]
  22. Harrison, B.R.; Wang, L.; Gajda, E.; Hoffman, E.V.; Chung, B.Y.; Pletcher, S.D.; Raftery, D.; Promislow, D.E.L. The metabolome as a link in the genotype-phenotype map for peroxide resistance in the fruit fly, Drosophila melanogaster. BMC Genom. 2020, 21, 341. [Google Scholar] [CrossRef] [Scilit] [PubMed]
  23. Phillips, M.A.; Arnold, K.R.; Vue, Z.; Beasley, H.K.; Garza-Lopez, E.; Marshall, A.G.; Morton, D.J.; McReynolds, M.R.; Barter, T.T.; Hinton, A., Jr. Combining Metabolomics and Experimental Evolution Reveals Key Mechanisms Underlying Longevity Differences in Laboratory Evolved Drosophila melanogaster Populations. Int. J. Mol. Sci. 2022, 23, 1067. [Google Scholar] [CrossRef] [Scilit] [PubMed]
  24. Garcia, J.F.; Carbone, M.A.; Mackay, T.F.C.; Anholt, R.R.H. Regulation of Drosophila Lifespan by bellwether Promoter Alleles. Sci. Rep. 2017, 7, 4109. [Google Scholar] [CrossRef] [Scilit] [PubMed]
  25. Catalan, A.; Glaser-Schmitt, A.; Argyridou, E.; Duchen, P.; Parsch, J. An Indel Polymorphism in the MtnA 3’ Untranslated Region Is Associated with Gene Expression Variation and Local Adaptation in Drosophila melanogaster. PLoS Genet. 2016, 12, e1005987. [Google Scholar] [CrossRef] [Scilit] [PubMed]
  26. Ramnarine, T.J.S.; Glaser-Schmitt, A.; Catalan, A.; Parsch, J. Population Genetic and Functional Analysis of a cis-Regulatory Polymorphism in the Drosophila melanogaster Metallothionein A gene. Genes 2019, 10, 147. [Google Scholar] [CrossRef] [Scilit] [PubMed]
  27. Ramnarine, T.J.S.; Grath, S.; Parsch, J. Natural variation in the transcriptional response of Drosophila melanogaster to oxidative stress. G3 2022, 12, jkab366. [Google Scholar] [CrossRef] [Scilit] [PubMed]
  28. Glaser-Schmitt, A.; Parsch, J. Functional characterization of adaptive variation within a cis-regulatory element influencing Drosophila melanogaster growth. PLoS Biol. 2018, 16, e2004538. [Google Scholar] [CrossRef] [Scilit] [PubMed]
  29. Rybina, O.Y.; Pasyukova, E.G. A naturally occurring polymorphism at Drosophila melanogaster Lim3 Locus, a homolog of human LHX3/4, affects Lim3 transcription and fly lifespan. PLoS ONE 2010, 5, e12621. [Google Scholar] [CrossRef] [Scilit] [PubMed]
  30. Rybina, O.Y.; Rozovsky, Y.M.; Veselkina, E.R.; Pasyukova, E.G. Polycomb/Trithorax group-dependent regulation of the neuronal gene Lim3 involved in Drosophila lifespan control. Biochim. Biophys. Acta Gene Regul. Mech. 2018, 1861, 451–462. [Google Scholar] [CrossRef] [Scilit] [PubMed]
  31. Pool, J.E.; Corbett-Detig, R.B.; Sugino, R.P.; Stevens, K.A.; Cardeno, C.M.; Crepeau, M.W.; Duchen, P.; Emerson, J.J.; Saelao, P.; Begun, D.J.; et al. Population Genomics of sub-saharan Drosophila melanogaster: African diversity and non-African admixture. PLoS Genet. 2012, 8, e1003080. [Google Scholar] [CrossRef] [Scilit] [PubMed]
  32. Lack, J.B.; Cardeno, C.M.; Crepeau, M.W.; Taylor, W.; Corbett-Detig, R.B.; Stevens, K.A.; Langley, C.H.; Pool, J.E. The Drosophila genome nexus: A population genomic resource of 623 Drosophila melanogaster genomes, including 197 from a single ancestral range population. Genetics 2015, 199, 1229–1241. [Google Scholar] [CrossRef] [Scilit] [PubMed]
  33. Luca, M.; Roshina, N.V.; Geiger-Thornsberry, G.L.; Lyman, R.F.; Pasyukova, E.G.; Mackay, T.F. Dopa decarboxylase (Ddc) affects variation in Drosophila longevity. Nat. Genet. 2003, 34, 429–433. [Google Scholar] [CrossRef] [Scilit] [PubMed]
  34. Mackay, T.F.; Richards, S.; Stone, E.A.; Barbadilla, A.; Ayroles, J.F.; Zhu, D.; Casillas, S.; Han, Y.; Magwire, M.M.; Cridland, J.M.; et al. The Drosophila melanogaster Genetic Reference Panel. Nature 2012, 482, 173–178. [Google Scholar] [CrossRef] [Scilit] [PubMed]
  35. Falconer, D.S.; Mackay, T.F. Introduction to Quantitative Genetics; Longman: Harlow, UK, 1996. [Google Scholar]
  36. Stroumbakis, N.D.; Li, Z.; Tolias, P.P. A homolog of human transcription factor NF-X1 encoded by the Drosophila shuttle craft gene is required in the embryonic central nervous system. Mol. Cell. Biol. 1996, 16, 192–201. [Google Scholar] [CrossRef] [Scilit] [PubMed]
  37. Ohler, U.; Liao, G.C.; Niemann, H.; Rubin, G.M. Computational analysis of core promoters in the Drosophila genome. Genome Biol. 2002, 3, research0087.1. [Google Scholar] [CrossRef] [Scilit] [PubMed]
  38. Nei, M.; Tajima, F. DNA polymorphism detectable by restriction endonucleases. Genetics 1981, 97, 145–163. [Google Scholar] [CrossRef] [Scilit] [PubMed]
  39. Watterson, G.A. On the number of segregating sites in genetical models without recombination. Theor. Popul. Biol. 1975, 7, 256–276. [Google Scholar] [CrossRef] [Scilit] [PubMed]
  40. Moriyama, E.N.; Powell, J.R. Intraspecific nuclear DNA variation in Drosophila. Mol. Biol. Evol. 1996, 13, 261–277. [Google Scholar] [CrossRef] [Scilit] [PubMed]
  41. Tajima, F. Statistical method for testing the neutral mutation hypothesis by DNA polymorphism. Genetics 1989, 123, 585–595. [Google Scholar] [CrossRef] [Scilit] [PubMed]
  42. Fu, Y.X.; Li, W.H. Statistical tests of neutrality of mutations. Genetics 1993, 133, 693–709. [Google Scholar] [CrossRef] [Scilit] [PubMed]
  43. Kapun, M.; Nunez, J.C.B.; Bogaerts-Marquez, M.; Murga-Moreno, J.; Paris, M.; Outten, J.; Coronado-Zamora, M.; Tern, C.; Rota-Stabelli, O.; Guerreiro, M.P.G.; et al. Drosophila Evolution over Space and Time (DEST): A New Population Genomics Resource. Mol. Biol. Evol. 2021, 38, 5782–5805, Correction in Mol. Biol. Evol. 2022, 39, msab337. [Google Scholar] [CrossRef] [Scilit] [PubMed]
  44. Larracuente, A.M.; Clark, A.G. Surprising differences in the variability of Y chromosomes in African and cosmopolitan populations of Drosophila melanogaster. Genetics 2013, 193, 201–214. [Google Scholar] [CrossRef] [Scilit] [PubMed]
  45. Endler, L.; Betancourt, A.J.; Nolte, V.; Schlotterer, C. Reconciling Differences in Pool-GWAS Between Populations: A Case Study of Female Abdominal Pigmentation in Drosophila melanogaster. Genetics 2016, 202, 843–855. [Google Scholar] [CrossRef] [Scilit] [PubMed]
  46. Tolias, P.P.; Stroumbakis, N.D. The Drosophila zygotic lethal gene shuttle craft is required maternally for proper embryonic development. Dev. Genes Evol. 1998, 208, 274–282. [Google Scholar] [CrossRef] [Scilit] [PubMed]
  47. Rennie, S.; Dalby, M.; Lloret-Llinares, M.; Bakoulis, S.; Dalager Vaagenso, C.; Heick Jensen, T.; Andersson, R. Transcription start site analysis reveals widespread divergent transcription in D. melanogaster and core promoter-encoded enhancer activities. Nucleic Acids Res. 2018, 46, 5455–5469. [Google Scholar] [CrossRef] [Scilit] [PubMed]
  48. Grant, C.E.; Bailey, T.L.; Noble, W.S. FIMO: Scanning for occurrences of a given motif. Bioinformatics 2011, 27, 1017–1018. [Google Scholar] [CrossRef] [Scilit] [PubMed]
  49. The modENCODE Consortium; Roy, S.; Ernst, J.; Kharchenko, P.V.; Kheradpour, P.; Negre, N.; Eaton, M.L.; Landolin, J.M.; Bristow, C.A.; Ma, L.; et al. Identification of functional elements and regulatory circuits by Drosophila modENCODE. Science 2010, 330, 1787–1797. [Google Scholar] [CrossRef] [Scilit] [PubMed]
  50. Grossniklaus, U.; Cadigan, K.M.; Gehring, W.J. Three maternal coordinate systems cooperate in the patterning of the Drosophila head. Development 1994, 120, 3155–3171. [Google Scholar] [CrossRef] [Scilit] [PubMed]
  51. Bhat, K.M.; Beers, E.H.; Bhat, P. Sloppy paired acts as the downstream target of wingless in the Drosophila CNS and interaction between sloppy paired and gooseberry inhibits sloppy paired during neurogenesis. Development 2000, 127, 655–665. [Google Scholar] [CrossRef] [Scilit] [PubMed]
  52. Spokony, R.F.; Restifo, L.L. Broad Complex isoforms have unique distributions during central nervous system metamorphosis in Drosophila melanogaster. J. Comp. Neurol. 2009, 517, 15–36. [Google Scholar] [CrossRef] [Scilit] [PubMed]
  53. Bastide, H.; Betancourt, A.; Nolte, V.; Tobler, R.; Stobe, P.; Futschik, A.; Schlotterer, C. A genome-wide, fine-scale map of natural pigmentation variation in Drosophila melanogaster. PLoS Genet. 2013, 9, e1003534. [Google Scholar] [CrossRef] [Scilit] [PubMed]
  54. Gibert, J.M.; Blanco, J.; Dolezal, M.; Nolte, V.; Peronnet, F.; Schlotterer, C. Strong epistatic and additive effects of linked candidate SNPs for Drosophila pigmentation have implications for analysis of genome-wide association studies results. Genome Biol. 2017, 18, 126. [Google Scholar] [CrossRef] [Scilit] [PubMed]
  55. Endler, L.; Gibert, J.M.; Nolte, V.; Schlotterer, C. Pleiotropic effects of regulatory variation in tan result in correlation of two pigmentation traits in Drosophila melanogaster. Mol. Ecol. 2018, 27, 3207–3218. [Google Scholar] [CrossRef] [Scilit] [PubMed]
  56. Luce-Fedrow, A.; Ohlen, T.; Boyle, D.; Ganta, R.R.; Chapes, S.K. Use of Drosophila S2 cells as a model for studying Ehrlichia chaffeensis infections. Appl. Environ. Microbiol. 2008, 74, 1886–1891. [Google Scholar] [CrossRef] [Scilit] [PubMed]
  57. Barghi, N.; Schlotterer, C. Shifting the paradigm in Evolve and Resequence studies: From analysis of single nucleotide polymorphisms to selected haplotype blocks. Mol. Ecol. 2019, 28, 521–524. [Google Scholar] [CrossRef] [Scilit] [PubMed]
  58. Daanen, H.A.; Marken Lichtenbelt, W.D. Human whole body cold adaptation. Temperature 2016, 3, 104–118. [Google Scholar] [CrossRef] [Scilit] [PubMed]
  59. Keller, I.; Seehausen, O. Thermal adaptation and ecological speciation. Mol. Ecol. 2012, 21, 782–799. [Google Scholar] [CrossRef] [Scilit] [PubMed]
  60. Cederberg, A.; Gronning, L.M.; Ahren, B.; Tasken, K.; Carlsson, P.; Enerback, S. FOXC2 is a winged helix gene that counteracts obesity, hypertriglyceridemia, and diet-induced insulin resistance. Cell 2001, 106, 563–573. [Google Scholar] [CrossRef] [Scilit] [PubMed]
  61. Durmaz, E.; Rajpurohit, S.; Betancourt, N.; Fabian, D.K.; Kapun, M.; Schmidt, P.; Flatt, T. A clinal polymorphism in the insulin signaling transcription factor foxo contributes to life-history adaptation in Drosophila. Evolution 2019, 73, 1774–1792. [Google Scholar] [CrossRef] [Scilit] [PubMed]
  62. Shokri, L.; Inukai, S.; Hafner, A.; Weinand, K.; Hens, K.; Vedenko, A.; Gisselbrecht, S.S.; Dainese, R.; Bischof, J.; Furger, E.; et al. A Comprehensive Drosophila melanogaster Transcription Factor Interactome. Cell Rep. 2019, 27, 955–970.e7. [Google Scholar] [CrossRef] [Scilit] [PubMed]
  63. Hacker, U.; Kaufmann, E.; Hartmann, C.; Jurgens, G.; Knochel, W.; Jackle, H. The Drosophila fork head domain protein crocodile is required for the establishment of head structures. EMBO J. 1995, 14, 5306–5317. [Google Scholar] [CrossRef] [Scilit] [PubMed]
  64. Bulow, M.H.; Aebersold, R.; Pankratz, M.J.; Junger, M.A. The Drosophila FoxA ortholog Fork head regulates growth and gene expression downstream of Target of rapamycin. PLoS ONE 2010, 5, e15171. [Google Scholar] [CrossRef] [Scilit] [PubMed]
  65. Liu, Y.; Lehmann, M. Genes and biological processes controlled by the Drosophila FOXA orthologue Fork head. Insect Mol. Biol. 2008, 17, 91–101. [Google Scholar] [CrossRef] [Scilit] [PubMed]
  66. Bolukbasi, E.; Woodling, N.S.; Ivanov, D.K.; Adcott, J.; Foley, A.; Rajasingam, A.; Gittings, L.M.; Aleyakpo, B.; Niccoli, T.; Thornton, J.M.; et al. Cell type-specific modulation of healthspan by Forkhead family transcription factors in the nervous system. Proc. Natl. Acad. Sci. USA 2021, 118, e2011491118. [Google Scholar] [CrossRef] [Scilit] [PubMed]
  67. Bao, B.; Hong, B.; Feng, Q.L.; Xu, W.H. Transcription factor fork head regulates the promoter of diapause hormone gene in the cotton bollworm, Helicoverpa armigera, and the modification of SUMOylation. Insect Biochem. Mol. Biol. 2011, 41, 670–679. [Google Scholar] [CrossRef] [Scilit] [PubMed]
  68. Keil, G.; Cummings, E.; Magalhaes, J.P. Being cool: How body temperature influences ageing and longevity. Biogerontology 2015, 16, 383–397. [Google Scholar] [CrossRef] [Scilit] [PubMed]
  69. Chintala, S.; Katzenellenbogen, R.A. NFX1, Its Isoforms and Roles in Biology, Disease and Cancer. Biology 2021, 10, 279. [Google Scholar] [CrossRef] [Scilit] [PubMed]
  70. Fukuyama, H.; Verdier, Y.; Guan, Y.; Makino-Okamura, C.; Shilova, V.; Liu, X.; Maksoud, E.; Matsubayashi, J.; Haddad, I.; Spirohn, K.; et al. Landscape of protein-protein interactions in Drosophila immune deficiency signaling during bacterial challenge. Proc. Natl. Acad. Sci. USA 2013, 110, 10717–10722. [Google Scholar] [CrossRef] [Scilit] [PubMed]
  71. Busbridge, N.J.; Dascombe, M.J.; Tilders, F.J.; van Oers, J.W.; Linton, E.A.; Rothwell, N.J. Central activation of thermogenesis and fever by interleukin-1β and interleukin-1α involves different mechanisms. Biochem. Biophys. Res. Commun. 1989, 162, 591–596. [Google Scholar] [CrossRef] [Scilit] [PubMed]
  72. Smith, N.C.; Matthews, J.M. Mechanisms of DNA-binding specificity and functional gene regulation by transcription factors. Curr. Opin. Struct. Biol. 2016, 38, 68–74. [Google Scholar] [CrossRef] [Scilit] [PubMed]
  73. Stathopoulos, A.; Levine, M. Linear signaling in the Toll-Dorsal pathway of Drosophila: Activated Pelle kinase specifies all threshold outputs of gene expression while the bHLH protein Twist specifies a subset. Development 2002, 129, 3411–3419. [Google Scholar] [CrossRef] [Scilit] [PubMed]
  74. Ayyar, S.; Pistillo, D.; Calleja, M.; Brookfield, A.; Gittins, K.; Goldstone, C.; Simpson, P. NF-κB/Rel-mediated regulation of the neural fate in Drosophila. PLoS ONE 2007, 2, e1178. [Google Scholar] [CrossRef] [Scilit] [PubMed]
  75. Melnattur, K.V.; Berdnik, D.; Rusan, Z.; Ferreira, C.J.; Nambu, J.R. The sox gene Dichaete is expressed in local interneurons and functions in development of the Drosophila adult olfactory circuit. Dev. Neurobiol. 2013, 73, 107–126. [Google Scholar] [CrossRef] [Scilit] [PubMed]
  76. Ali, A.; Bovilla, V.R.; Mysarla, D.K.; Siripurapu, P.; Pathak, R.U.; Basu, B.; Mamillapalli, A.; Bhattacharya, S. Knockdown of Broad-Complex Gene Expression of Bombyx mori by Oligopyrrole Carboxamides Enhances Silk Production. Sci. Rep. 2017, 7, 805. [Google Scholar] [CrossRef] [Scilit] [PubMed]
  77. Castanon, I.; Stetina, S.; Kass, J.; Baylies, M.K. Dimerization partners determine the activity of the Twist bHLH protein during Drosophila mesoderm development. Development 2001, 128, 3145–3159. [Google Scholar] [CrossRef] [Scilit] [PubMed]
  78. Nowak, S.J.; Aihara, H.; Gonzalez, K.; Nibu, Y.; Baylies, M.K. Akirin links twist-regulated transcription with the Brahma chromatin remodeling complex during embryogenesis. PLoS Genet. 2012, 8, e1002547. [Google Scholar] [CrossRef] [Scilit] [PubMed]
  79. Shirokawa, J.M.; Courey, A.J. A direct contact between the dorsal rel homology domain and Twist may mediate transcriptional synergy. Mol. Cell. Biol. 1997, 17, 3345–3355. [Google Scholar] [CrossRef] [Scilit] [PubMed]
  80. Bhaskar, V.; Valentine, S.A.; Courey, A.J. A functional interaction between dorsal and components of the Smt3 conjugation machinery. J. Biol. Chem. 2000, 275, 4033–4040. [Google Scholar] [CrossRef] [Scilit] [PubMed]
  81. Partridge, L.; Bruning, J.C. Forkhead transcription factors and ageing. Oncogene 2008, 27, 2351–2363. [Google Scholar] [CrossRef] [Scilit] [PubMed]
  82. Bean, D.M.; Heimbach, J.; Ficorella, L.; Micklem, G.; Oliver, S.G.; Favrin, G. EsyN: Network building, sharing and publishing. PLoS ONE 2014, 9, e106035, Correction in PLoS ONE 2019, 14, e0204058. [Google Scholar] [CrossRef] [Scilit] [PubMed]
  83. Symonenko, A.V.; Roshina, N.V.; Krementsova, A.V.; Pasyukova, E.G. Reduced Neuronal Transcription of Escargot, the Drosophila Gene Encoding a Snail-Type Transcription Factor, Promotes Longevity. Front. Genet. 2018, 9, 151. [Google Scholar] [CrossRef] [Scilit] [PubMed]
  84. McGraw, E.A.; O’Neill, S.L. Wolbachia pipientis: Intracellular infection and pathogenesis in Drosophila. Curr. Opin. Microbiol. 2004, 7, 67–70. [Google Scholar] [CrossRef] [Scilit] [PubMed]
  85. Werren, J.H.; Windsor, D.M. Wolbachia infection frequencies in insects: Evidence of a global equilibrium? Proc. R. Soc. B Biol. Sci. 2000, 267, 1277–1285. [Google Scholar] [CrossRef] [Scilit] [PubMed]
  86. Roshina, N.V.; Symonenko, A.V.; Krementsova, A.V.; Tsybul’ko, E.A.; Alatortsev, V.E.; Pasyukova, E.G.; Mukha, D.V. Drosophila melanogaster inhabiting northern regions of European Russia are infected with Wolbachia which adversely affects their life span. Vavilov J. Genet. Breed. 2018, 22, 568–573. [Google Scholar] [CrossRef] [Scilit]
  87. Holden, P.R.; Jones, P.; Brookfield, J.F. Evidence for a Wolbachia symbiont in Drosophila melanogaster. Genet. Res. 1993, 62, 23–29. [Google Scholar] [CrossRef] [Scilit] [PubMed]
  88. Sambrook, J.; Fritsch, E.F.; Maniatis, T. Molecular Cloning: A Laboratory Manual; Cold Spring Harbor Laboratory Press: Plainview, NY, USA, 1989. [Google Scholar]
  89. Chetverina, D.; Savitskaya, E.; Maksimenko, O.; Melnikova, L.; Zaytseva, O.; Parshikov, A.; Galkin, A.V.; Georgiev, P. Red flag on the white reporter: A versatile insulator abuts the white gene in Drosophila and is omnipresent in mini-white constructs. Nucleic Acids Res. 2008, 36, 929–937. [Google Scholar] [CrossRef] [Scilit] [PubMed]
  90. Lee, C.; Huang, C.H. LASAGNA-Search: An integrated web tool for transcription factor binding site search and visualization. Biotechniques 2013, 54, 141–153. [Google Scholar] [CrossRef] [Scilit] [PubMed]
  91. Castro-Mondragon, J.A.; Riudavets-Puig, R.; Rauluseviciute, I.; Lemma, R.B.; Turchi, L.; Blanc-Mathieu, R.; Lucas, J.; Boddie, P.; Khan, A.; Manosalva Perez, N.; et al. JASPAR 2022: The 9th release of the open-access database of transcription factor binding profiles. Nucleic Acids Res. 2022, 50, D165–D173. [Google Scholar] [CrossRef] [Scilit] [PubMed]
  92. Gupta, S.; Stamatoyannopoulos, J.A.; Bailey, T.L.; Noble, W.S. Quantifying similarity between motifs. Genome Biol. 2007, 8, R24. [Google Scholar] [CrossRef] [Scilit] [PubMed]
  93. Rozas, J.; Rozas, R. DnaSP, DNA sequence polymorphism: An interactive program for estimating population genetics parameters from DNA sequence data. Bioinformatics 1995, 11, 621–625. [Google Scholar] [CrossRef] [Scilit] [PubMed]
  94. Rozas, J.; Ferrer-Mata, A.; Sanchez-DelBarrio, J.C.; Guirao-Rico, S.; Librado, P.; Ramos-Onsins, S.E.; Sanchez-Gracia, A. DnaSP 6: DNA Sequence Polymorphism Analysis of Large Data Sets. Mol. Biol. Evol. 2017, 34, 3299–3302. [Google Scholar] [CrossRef] [Scilit] [PubMed]
  95. Wilmoth, J.R.; Horiuchi, S. Rectangularization revisited: Variability of age at death within human populations*. Demography 1999, 36, 475–495. [Google Scholar] [CrossRef] [Scilit]
  96. Carey, J.R. Longevity: The Biology and Demography of Life Span; Princeton University Press: Princeton, NT, USA, 2003. [Google Scholar]
  97. Han, S.K.; Lee, D.; Lee, H.; Kim, D.; Son, H.G.; Yang, J.S.; Lee, S.V.; Kim, S. OASIS 2: Online application for survival analysis 2 with features for the analysis of maximal lifespan and healthspan in aging research. Oncotarget 2016, 7, 56147–56152. [Google Scholar] [CrossRef] [Scilit] [PubMed]
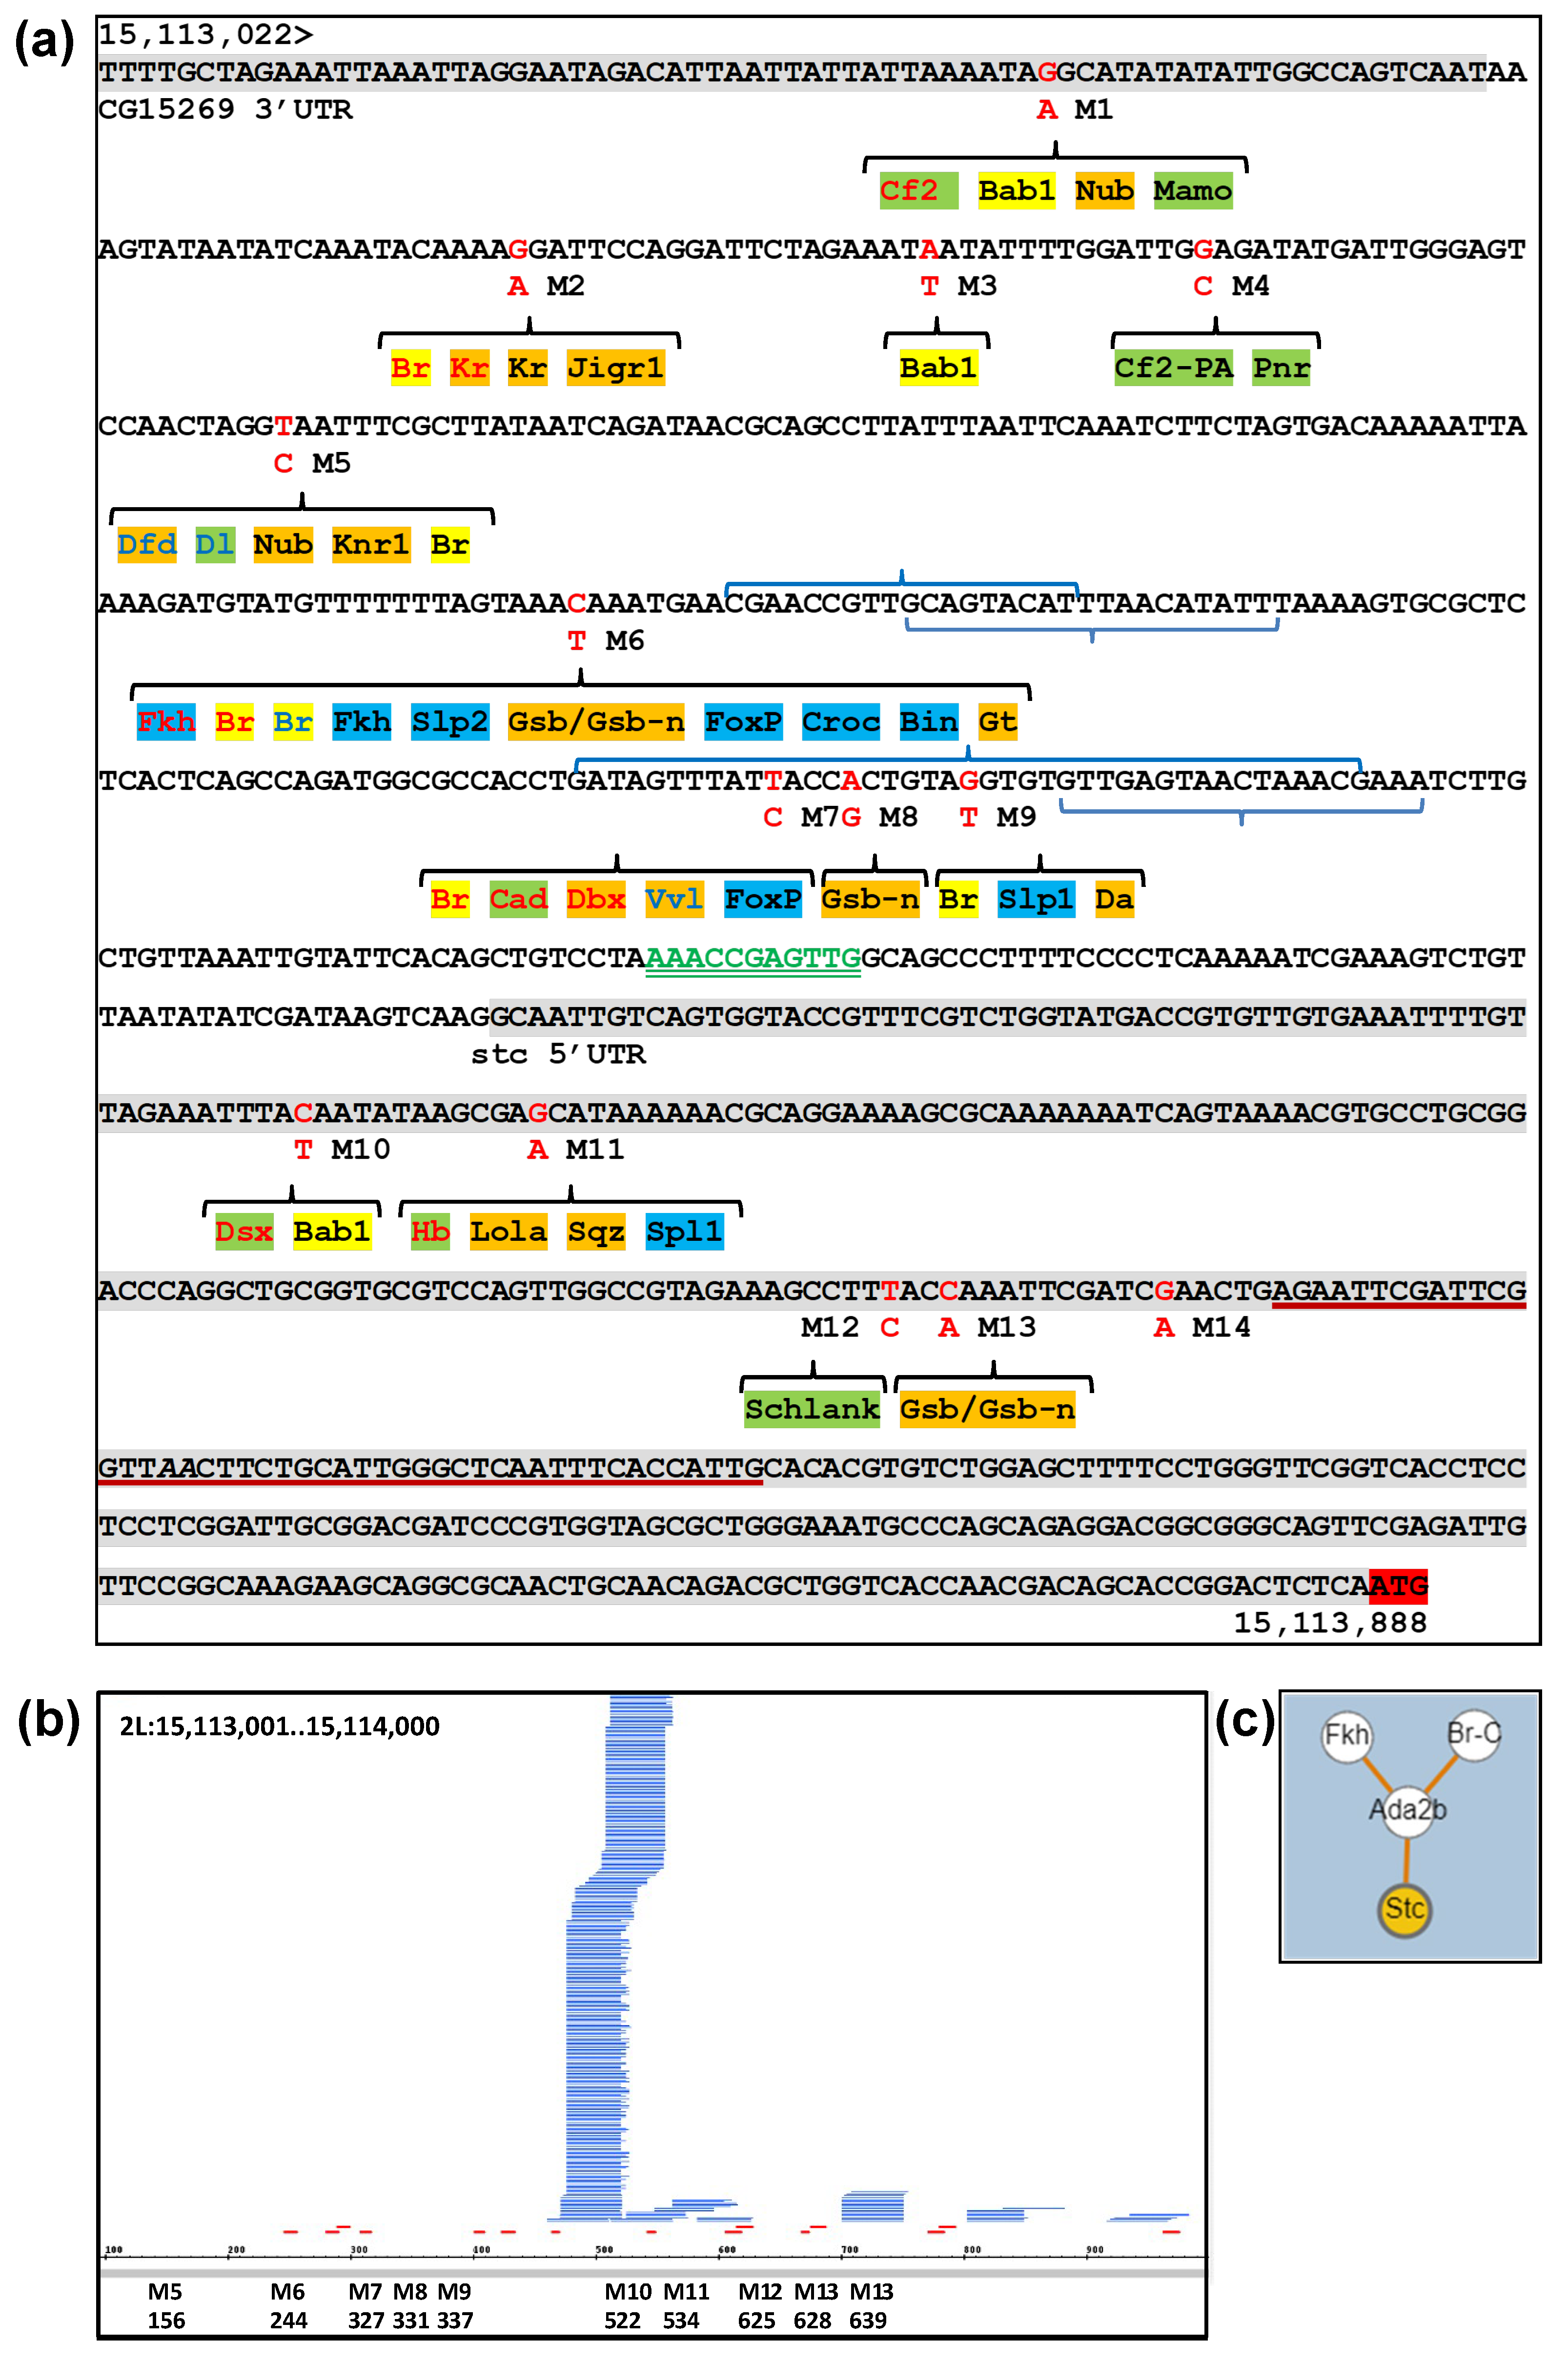
Figure 1. Structure of the stc 5′ regulatory region. (a) The sequence of the regulatory region and the locations of the polymorphic markers. Polymorphic markers (M1–M14) are highlighted in bold red letters. The 3′ UTR of the CG15269 gene and the 5′ UTR of the stc gene are shaded in light grey, with the stc translation start site marked in red. Transcription factors predicted to bind to polymorphic sites, as identified by JASPAR, LASAGNE and Tomtom (see Section 4 for details), are denoted in red, blue, and black letters, respectively, and are highlighted in different colors: yellow for BTB family transcription factors; orange for neuronal transcription factors; blue for Forkhead family transcription factors; and green for other transcription factors. The insulator is indicated in green letters and underlined with a double line, while regulatory RNA-binding sites are underlined with a thick red line. The full names of the genes/proteins can be found at http://flybase.org. (b) The positions of core promoter elements and the region of dispersed transcription start sites. The 5′-ends of mRNAs (red) and possible elements of the stc gene promoter (blue) are found using FIMO (https://meme-suite.org/meme/doc/fimo.html (accessed on 20 August 2026)) based on [37] as described in Section 4. (c) Possible Stc interactions with factors with predicted regulatory motifs at M5 and M6 (visualized by esyN after http://flybase.org).
Ijms 27 08343 g001
Figure 2. Natural variation in the stc 5′ regulatory region. (A) Marker frequencies in the Alexandrov population in different years; (B) LD in the Alexandrov population in 2011. Different colors represent nominal linkage groups maintained for consistency across figures and tables, with dark teal explicitly highlighting the linkage group containing markers most significantly associated with adult lifespan. Exact LD numerical values are detailed in Appendix A Table A1; (C) Marker frequencies in European populations, utilizing data from [8]; (D) Marker frequencies in African populations, utilizing data from [31,32]; (E) Averaged marker frequencies in Alexandrov, European, and African populations. Frequencies for the Raleigh and Beijing populations [31,32] are included for comparison. M5 was represented by three nucleotides in African populations, and was consequently removed from the graph. ***—p < 0.001, ANOVA; (F) Marker frequencies in northern and southern European populations, utilizing data from [8]. *—p < 0.05, ANOVA.
Ijms 27 08343 g002aIjms 27 08343 g002b
Figure 3. Lifespan in ILs with different naturally occurring polymorphisms. (a,b) Survival curves for males and females of ILs obtained from the Alexandrov population in 2011 (individual lines are colored arbitrarily for visual differentiation); (c,d) Frequencies of dead flies from ILs obtained from the Aleksandrov population at different time intervals; (e,f) The mean lifespans of flies from ILs with C and T alleles in markers M5 and M6.
Ijms 27 08343 g003
Figure 4. stc transcript amounts in ILs with different naturally occurring polymorphisms. (a) stc transcript amounts determined by RT qPCR in selected ILs obtained from the Alexandrov population. Individual bars represent technical replicates for each specific IL, arranged in a sequential descending order that corresponds directly to the data matrix in (b); (b) polymorphic markers, stc transcript amounts, and lifespan in selected ILs obtained from the Alexandrov population. Pink and blue highlighted markers are significantly associated with lifespan. The red arrow indicates a decrease in the stc transcript amounts; (c) mean stc transcript amounts in ILs with different haplotypes in the stc 5′ regulatory region. True biological sample size is determined by the number of independent inbred lines (N = 3 for TC lines, N = 4 for CT lines). ***—p < 0.001, Kruskal–Wallis test; (d) correlation between stc transcript amounts and lifespan in selected ILs obtained from the Alexandrov population. (Pearson’s r = −0.7839, R2 = 0.6145, p = 0.0213). ***—p < 0.001; (e,f) luciferase expression controlled by CT or TC combinations of markers M5 and M6 averaged over four experiments and shown per experiment, respectively. Error bars represent the Standard Error of the Mean (SEM). *—p < 0.05, Kruskal–Wallis test.
Ijms 27 08343 g004
Table 1. Association between the polymorphic markers and lifespan in the Alexandrov population.
MarkerANOVA, p-Values for Association Between the Marker Allele and LifespanNumber of ILsLifespan
(Standard Error of the Mean)
Kruskal–Wallis Test, p Values for Differences in Lifespan Between the ILs with Different Marker Alleles
M1 A/G0.014649/4556.1(0.9)/52.7(1.1)0.0274
M3 A/T0.014645/48 *52.7(1.1)/56.1(1.0)0.0281
M5 C/T0.002340/5456.8(1.1)/52.7(1.0)0.0067
M6 C/T0.004957/3752.9(1.0)/56.9(1.2)0.0126
Haplotype GATC/ATCT/ATTC/ATCC/ATTT0.046645/37/8/2/1 152.7(1.1) */57.1(1.1) */53.6(2.2)/45.0(4.0)/53.3(7.4)0.0533
1 Data for one IL were excluded. p values that survived Bonferroni correction (p = 0.05/9 = 0.0056) are in bold. * p < 0.05 for multiple comparison of means.
Disclaimer/Publisher’s Note: The statements, opinions and data contained in all publications are solely those of the individual author(s) and contributor(s) and not of MDPI and/or the editor(s). MDPI and/or the editor(s) disclaim responsibility for any injury to people or property resulting from any ideas, methods, instructions or products referred to in the content.