Article

Aortic Single-Cell Transcriptome Analysis Reveals ApoE-Isoform-Specific Influences on Vascular Disease

1
Department of Pathology and Laboratory Medicine, University of Cincinnati College of Medicine, Cincinnati, OH 45237, USA
2
Department of Biostatistics, Health Informatics, and Data Sciences, University of Cincinnati College of Medicine, Cincinnati, OH 45267, USA
*
Author to whom correspondence should be addressed.
Int. J. Mol. Sci. 2026, 27(12), 5619; https://doi.org/10.3390/ijms27125619
Submission received: 30 April 2026 / Revised: 15 June 2026 / Accepted: 16 June 2026 / Published: 22 June 2026

Abstract

The human APOE gene is polymorphic with three major alleles that encode apolipoprotein (apo) E2, apoE3, and apoE4. Both apoE2 and apoE4 are associated with increased atherosclerosis risk. This study utilized human APOE2, APOE3, and APOE4 gene replacement mice and single-cell RNA sequencing approach to delineate the mechanisms underlying this association. The human APOE2, APOE3, and APOE4 mice were fed a Western-type high fat–cholesterol diet for 16 weeks. Hyperlipidemia and significant atherosclerosis were observed in APOE2 mice but not in APOE3 or APOE4 mice. However, increased vascular inflammation was observed in both APOE2 and APOE4 mice. Single-cell RNA sequencing followed by cluster analysis identified 25 major cell types in the aorta that include various immune cell types, endothelial cells, and various vascular mural cell subsets. Results showed that cells from the APOE2 mice were enriched with genes associated with intracellular lipid accumulation and inflammation, whereas cells from the APOE4 mice displayed elevated oxidative- and/or endoplasmic reticulum-stress and inflammatory response. Thus, apoE2 accelerates atherosclerosis by inducing diet-induced hyperlipidemia and inflammation, while apoE4 does not induce hyperlipidemia but enhances inflammation that may prime the vasculature for atherosclerosis development. The distinct mechanisms by which apoE2 and apoE4 promote atherosclerosis underscore the importance of including apoE genotype information in the design of therapeutics for atherosclerosis intervention.

1. Introduction

The human APOE gene is polymorphic with three major allelic variants, ε2, ε3, and ε4, encoding apolipoprotein (apo) E2, apoE3, and apoE4, respectively. These apoE isoforms differ from each other by single amino acid substitutions, with the most common isoform apoE3 containing cysteine at residue 112 and arginine at residue 158 of the 299-residue protein. The apoE2 isoform contains cysteine residues at both position 112 and 158 whereas the apoE4 isoform contains arginine residues at both positions. These amino acid substitutions in the primary sequence lead to differences in structural conformation that alters its functional properties. In particular, the R158C substitution in apoE2 results in a protein that is defective in binding to the LDL receptor. In contrast, the C112R substitution in apoE4 alters interaction between the 22-kDa N-terminal domain and the 10-kDa C-terminal domain of the protein, leading to a misfolded protein conformation that causes oxidative stress [1]. The dysfunctional apoE2 increases the risk and severity of coronary artery disease in diabetes as well as the risk of peripheral vascular disease in non-diabetes [2,3,4,5,6]. The dysfunction in apoE4 also increases the overall risk of cardiovascular disease [7,8]. Interestingly, while the ε4 allele is associated with significant increase in risk of Alzheimer’s disease [9], the ε2 allele is associated with lower Alzheimer’s disease risk compared to subjects with the ε3/3 genotype [10,11,12,13].
The association of apoE polymorphism with a plethora of disease risks is due to its expression in a wide spectrum of tissues and cell types. In the central nervous system, apoE is expressed and secreted by glia cells and astrocytes to activate signaling pathways in neurons in an isoform-dependent manner [14,15]. The high potency of apoE4 to stimulate neuronal signaling and amyloid precursor protein synthesis, whereas apoE2 is the least potent isoform, may be one mechanism underlying the differential Alzheimer’s disease risk associated with these apoE variants [15]. Additionally, single-cell transcriptome profiling studies revealed that apoE variants expressed endogenously in cells within the central nervous system also have direct autonomous effects in cell activation and functions that influence Alzheimer’s disease pathology. In particular, apoE3 expressed in microglia and central nervous system-associated macrophages promotes antigen presentation and interferon pathways to reduce amyloid pathology and associated toxicity, whereas apoE4 expression in these cell types downregulates complement and lysosomal pathways to promote stress-related responses [16].
In addition to cells in the central nervous system, apoE is also expressed in hepatocytes, adipocytes, myeloid-lineage immune cells, hormone-producing cells, and vascular smooth muscle cells. ApoE expressed in these cell types also has direct cell autonomous influence as well as indirect influence on cardiometabolic disease risk (reviewed in [17]). ApoE synthesized in the liver is secreted into the plasma circulation in association with lipoproteins where it mediates lipid transport to other tissues and clearance by the liver. Defective apoE expression exemplified in ApoE-/- mice results in overt hyperlipidemia that leads to robust atherosclerosis [18]. The R158C mutation in apoE2 reduces LDL receptor binding avidity and often leads to dyslipoproteinemia, which increases vascular disease risk [19]. Interestingly, although the C112R mutation in apoE4 has minimal effect on its receptor binding activity, apoE4 binding to cognate apoE receptors does not activate endothelial nitric oxide synthase and impedes endothelial repair after injury to promote vascular disease [20]. In macrophages, apoE synthesized endogenously has autonomous effects on cell functions, including the promotion of cholesterol efflux and limitation of inflammatory responses [21,22]. The importance of macrophage-derived apoE in atherosclerosis protection was demonstrated in bone marrow transplantation experiments in which reconstitution of macrophage apoE expression prevented atherosclerosis in ApoE-/- mice, and transplantation of bone marrow from ApoE-/- mice exacerbated atherosclerosis in wild-type mice [23,24]. The role of macrophage apoE in atherosclerosis protection is also isoform-dependent. Whereas apoE3 expressed in macrophages is protective against atherosclerosis, macrophages expressing either apoE2 or apoE4 are not atheroprotective [25]. The inability of macrophage apoE2 and apoE4 to protect against atherosclerosis is due to the autonomous pro-inflammatory properties of these apoE variants [25]. Interestingly, apoE2 and apoE4 promote macrophage inflammation via different mechanisms: whereas apoE2 promotes inflammation due to reduced cholesterol efflux from macrophages, apoE4 exacerbates macrophage inflammation by increasing oxidative stress [25,26].
ApoE is also expressed in smooth muscle cells in the vessel wall. Earlier studies showed that apoE is expressed primarily in quiescent contractile smooth muscle cells but minimally in proliferating smooth muscle cells with a synthetic phenotype [27]. Additional studies revealed that apoE directly influences smooth muscle cell proliferation [28,29], thus suggesting that apoE expression in vascular smooth muscle cells may also influence atherogenesis. However, whether apoE variants have differential autonomous influence on vascular smooth muscle cells in vascular disease protection remains unknown. In the current study, we first compared human APOE gene replacement mice, expressing either human APOE2, APOE3, or APOE4 in place of the mouse ApoE gene at the same locus, for their susceptibility to Western diet-induced atherosclerosis. Aortic cells were also prepared from Western diet-fed human APOE2, APOE3, and APOE4 gene replacement mice for single-cell transcriptome profiling to ascertain whether apoE variants differentially modulate immune cell infiltration and smooth muscle cell phenotype subsets in influencing atherosclerosis.

2. Results

2.1. Human apoE Polymorphism Differentially Impacts Western Diet-Induced Atherosclerosis in Mice

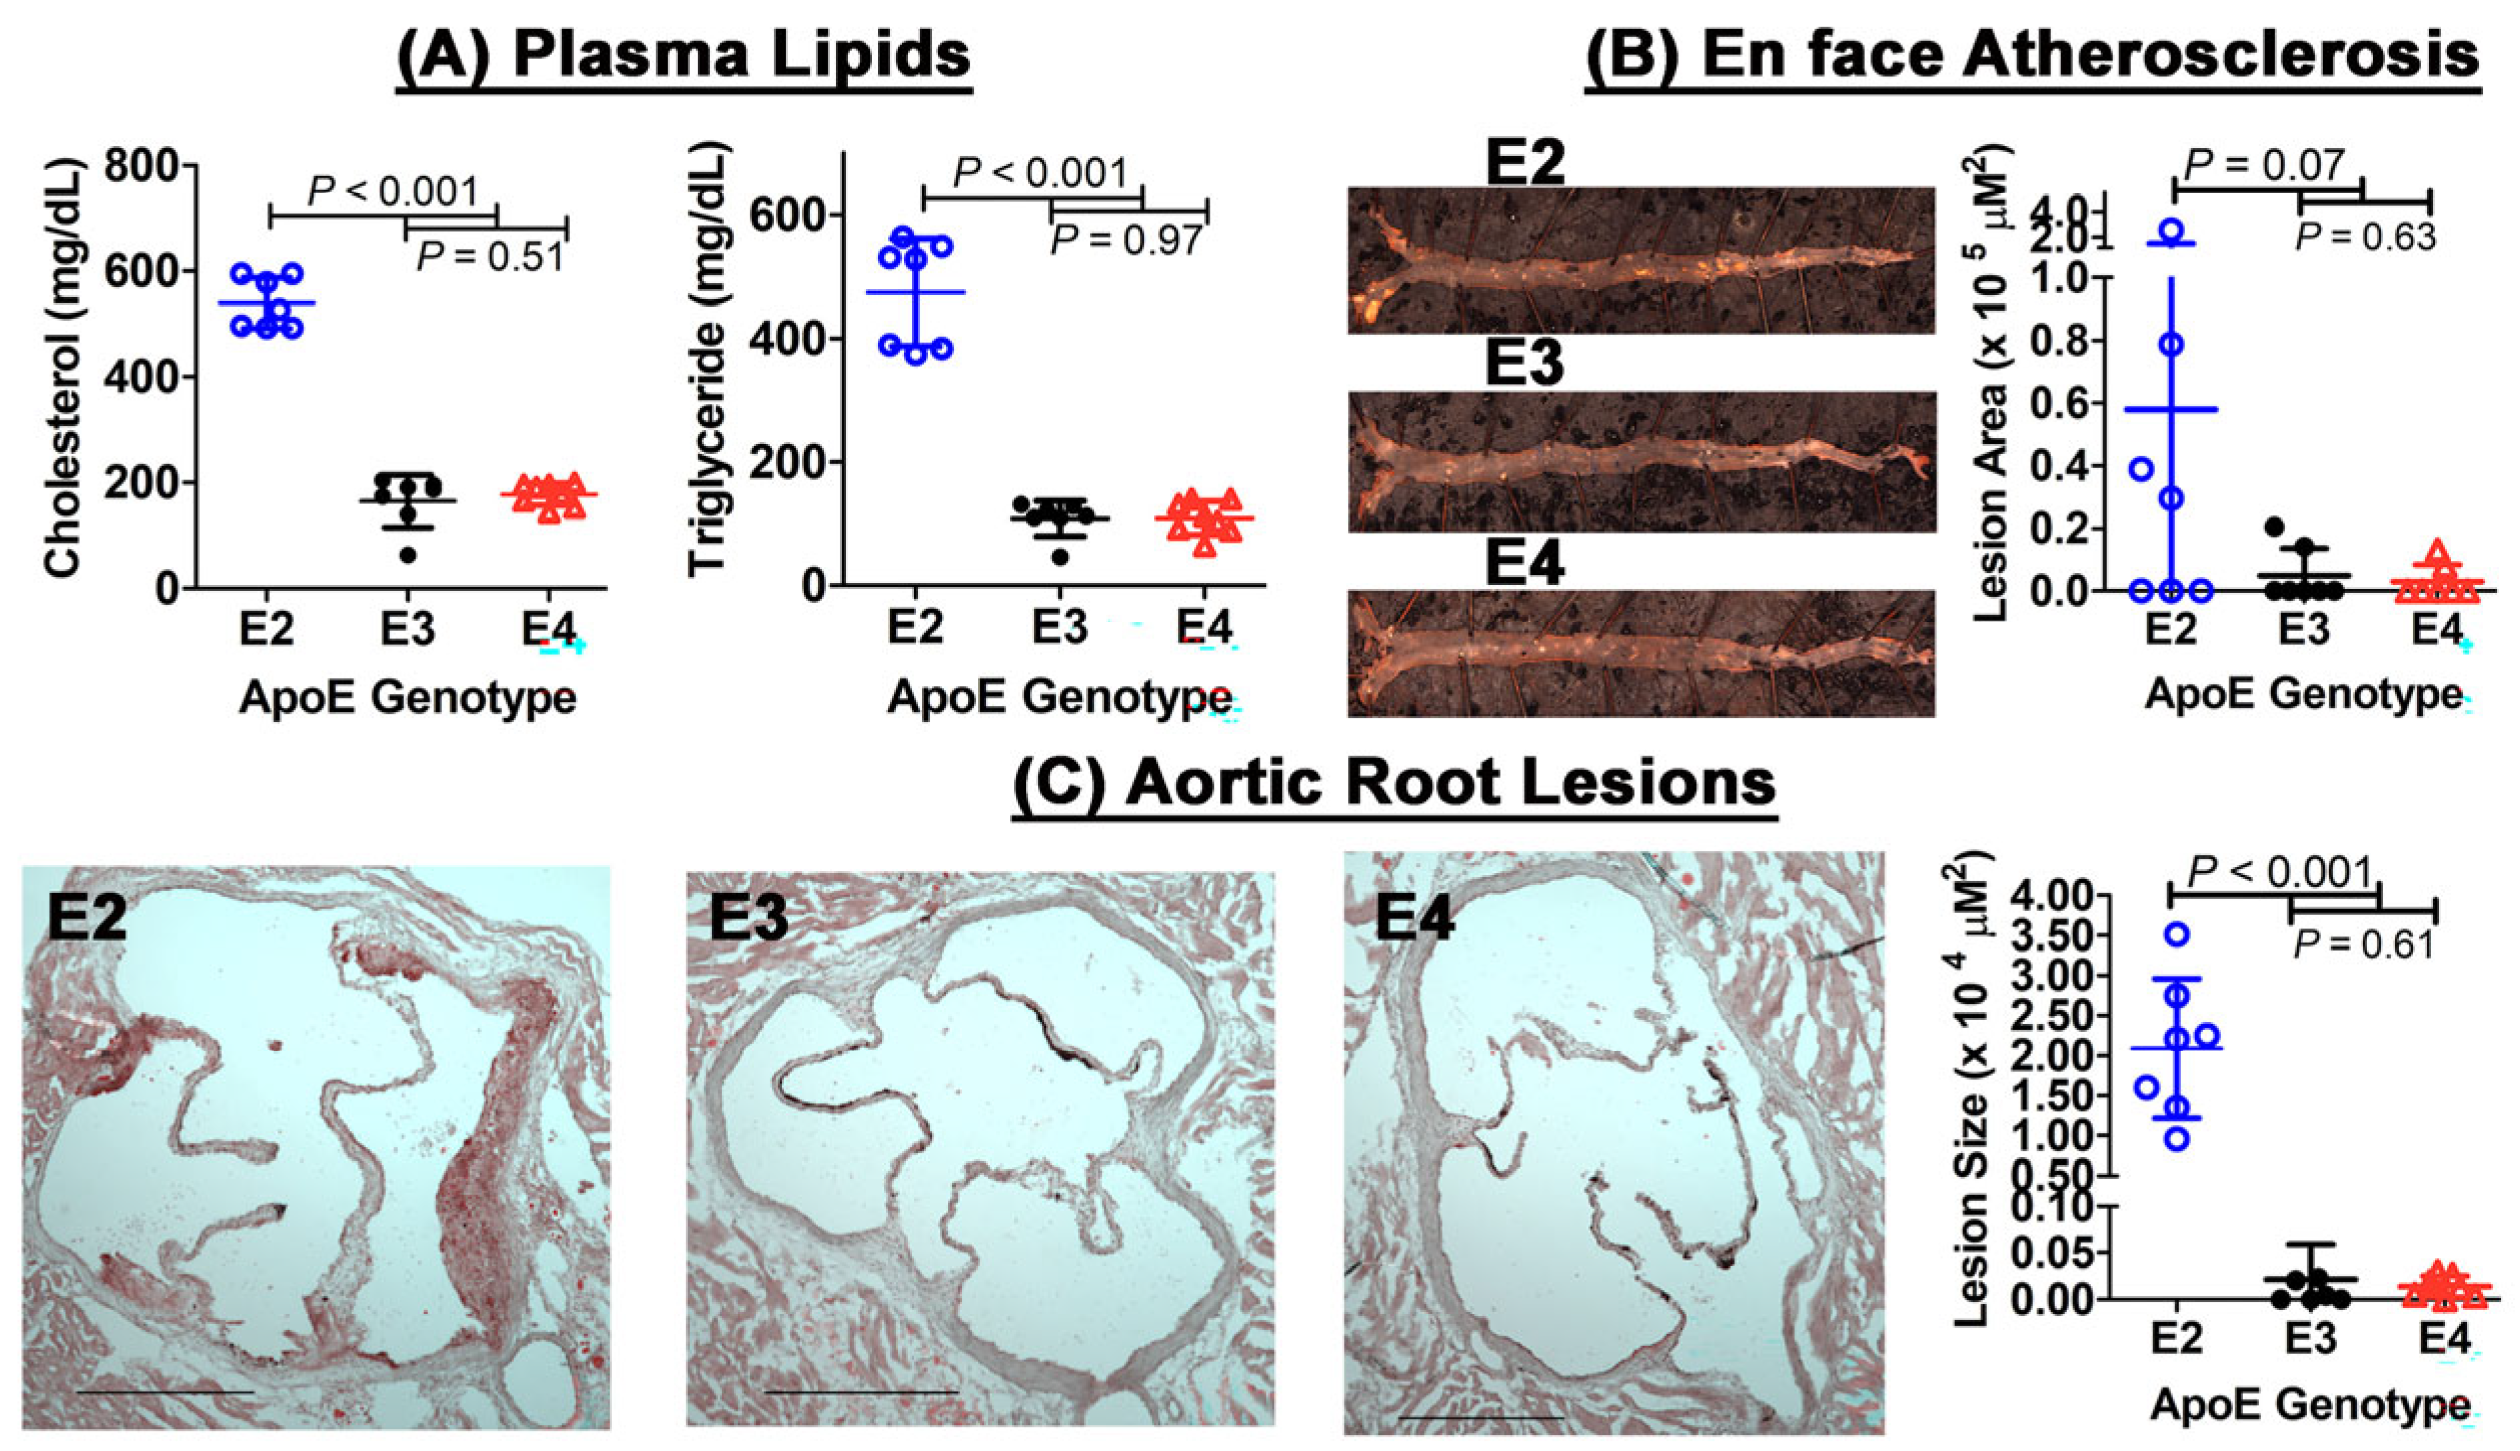
Previous studies have reported that, in comparison to APOE3 mice, APOE2 mice displayed increased atherosclerosis and xanthomas while APOE4 mice also showed a trend toward more atherosclerosis when these animals were fed an atherogenic diet containing very high cholesterol content and sodium cholate [30,31]. In the current study, the APOE2, APOE3, and APOE4 mice were fed a Western-type high-fat diet with 0.2% cholesterol that mimics the typical diet consumed by the human population in industrialized society. Although this diet caused only moderate elevation of plasma cholesterol level without noticeable atherosclerotic lesions in the vessel wall of C57BL/6J wild-type mice, plasma cholesterol and triglyceride levels were significantly higher in APOE2 mice compared to APOE3 and APOE4 mice after 12 weeks (Figure 1A). When the animals were sacrificed after 16 weeks on a Western diet, en face analysis of the whole aorta revealed a trend toward increased atherosclerosis lesion area in APOE2 mice compared to APOE3 and APOE4 mice, but the difference did not reach statistical significance (Figure 1B). However, analysis of cross-sections of the aortic roots revealed significant increase in lesion size indicative of thicker lesions in APOE2 mice compared to APOE3 and APOE4 mice (Figure 1C). These observations suggest that the human APOE gene replacement mice are suitable models to explore the impact of apoE polymorphism on the early phase of Western diet-induced atherogenesis.

2.2. ApoE Isoform-Specific Differences in Vascular Gene Expression in Response to Western Diet Feeding

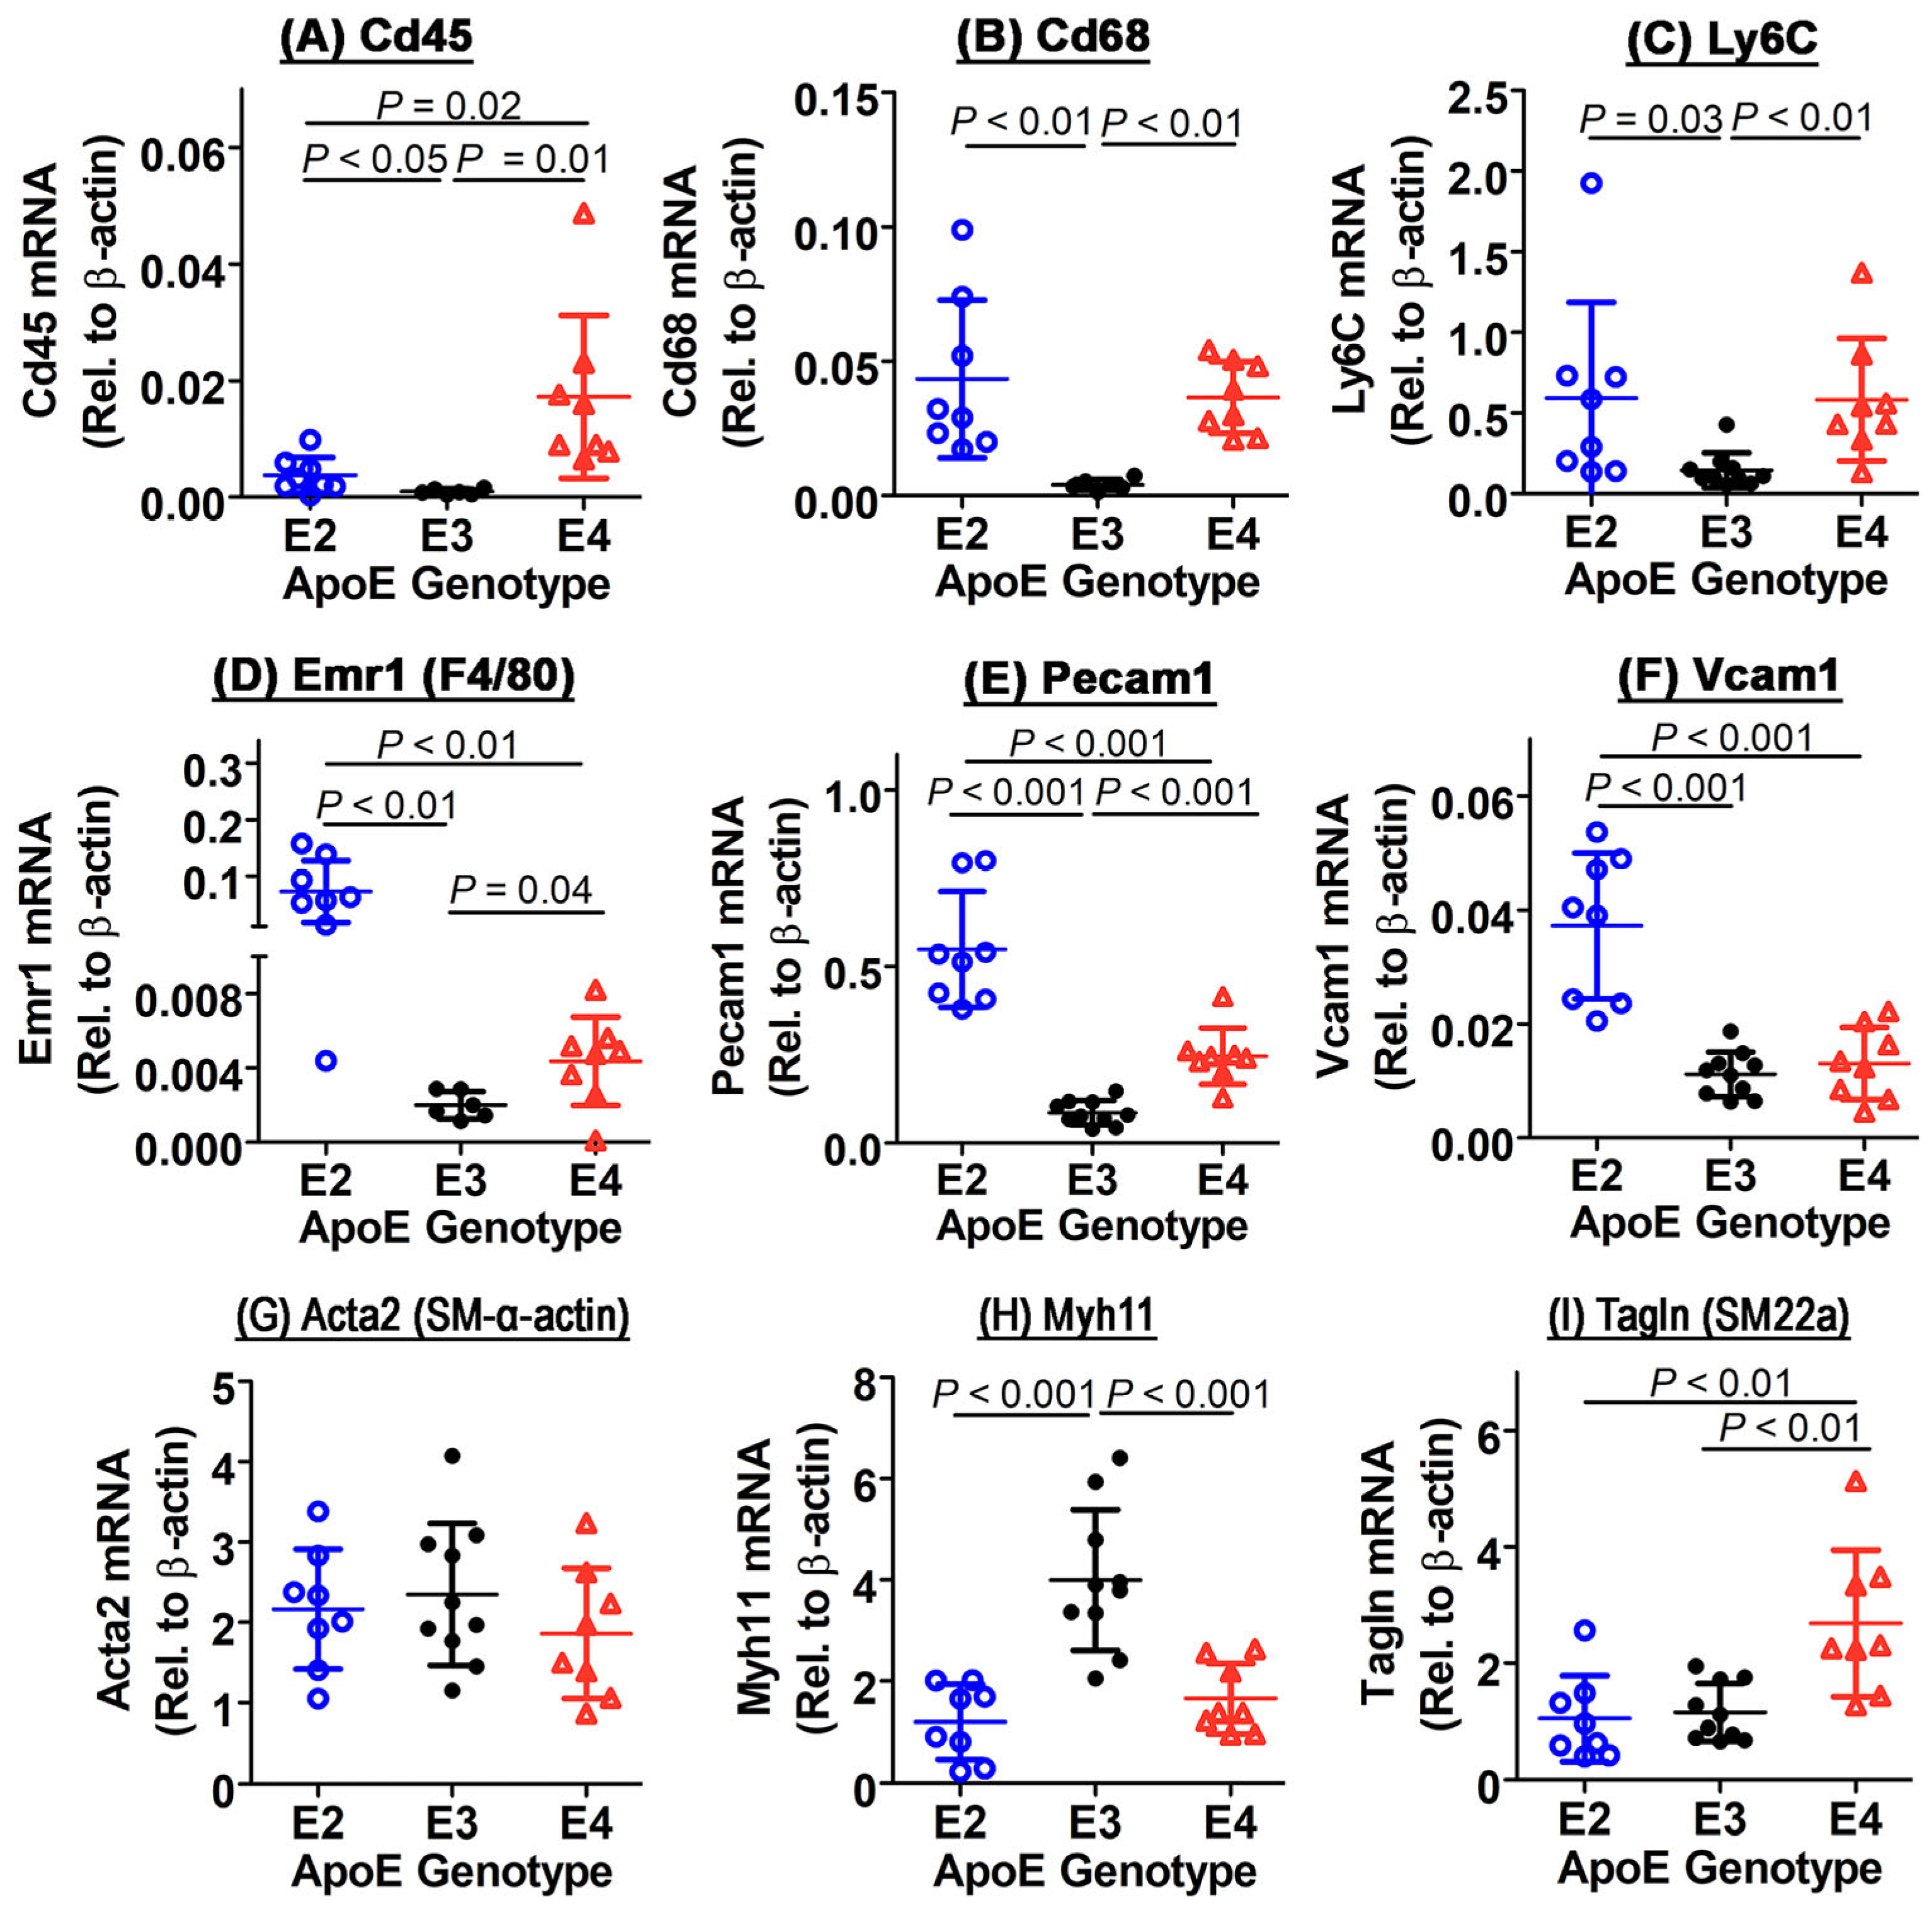
In addition to differences in plasma lipid levels that may influence atherosclerosis susceptibility, we have also reported previously that Western diet-fed APOE2 mice displayed elevated levels of leukocytes, including monocytes and neutrophils but not lymphocytes, in blood compared to APOE3 and APOE4 mice [25]. Thus, the increased atherosclerosis observed in APOE2 mice may be due to both hyperlipidemia and increased inflammation in these animals. The impact of hyperlipidemia and inflammation on the vasculature was explored initially by examining gene expression in the whole aortas of Western diet-fed APOE2, APOE3, and APOE4 mice. Results showed that in comparison to APOE3 mice, the aortas in APOE2 mice also displayed elevated levels of Cd45 expression, suggesting that the higher levels of circulating leukocytes in APOE2 mice led to their infiltration into the vessel wall (Figure 2A). Interestingly, despite the similarity in leukocyte blood counts between Western diet-fed APOE3 and APOE4 mice [25], the aortas of APOE4 mice also showed higher expression levels of Cd45 compared to both APOE2 and APOE3 mice (Figure 2A), suggesting that the aortas of Western diet-fed APOE4 mice were also inflamed. Additional analysis revealed increased expression of Cd68, Ly6c, and Emr1 (also known as F4/80) genes indicative of elevated presence of inflammatory monocytes and macrophages in the aortas of APOE2 and APOE4 mice compared to APOE3 mice (Figure 2B–D). The increase in leukocyte infiltration into the vessel wall was likely due to higher expression levels of Pecam1 and Vcam1, two endothelial cell surface proteins that mediate monocyte adhesion and migration [32], in the aortas of APOE2 mice as well as elevated expression of Pecam1 in APOE4 mice (Figure 2E,F). These data indicated that the aortas of both Western diet-fed APOE2 and APOE4 mice were highly inflamed in comparison to APOE3 mouse aortas. In addition to differences in expression of inflammatory genes in the aortas of Western diet-fed APOE2, APOE3, and APOE4 mice, expression of smooth muscle-specific genes was also found to be different between these animals. In particular, whereas expression levels of the smooth muscle cytoskeleton protein gene Acta2 (also known as smooth muscle α-actin) were comparable among all three groups of mice, expression levels of the smooth muscle contractile protein myosin heavy chain 11 (Myh11) were reduced in APOE2 and APOE4 mice (Figure 2G,H), coinciding with their increase in leukocyte adhesion gene expression. In contrast, expression levels of another contractile protein, transgelin (Tgln, also known as SM22α), were found to be elevated in APOE4 mice compared to APOE2 and APOE3 mice (Figure 2I). Taken together, we interpret these data to indicate apoE isoform-specific influence on vascular inflammation as well as the modulation of vascular cell phenotype in response to Western diet feeding.

2.3. ApoE Isoform-Dependent Differences in Cell Composition in the Aorta of Western Diet-Fed Mice

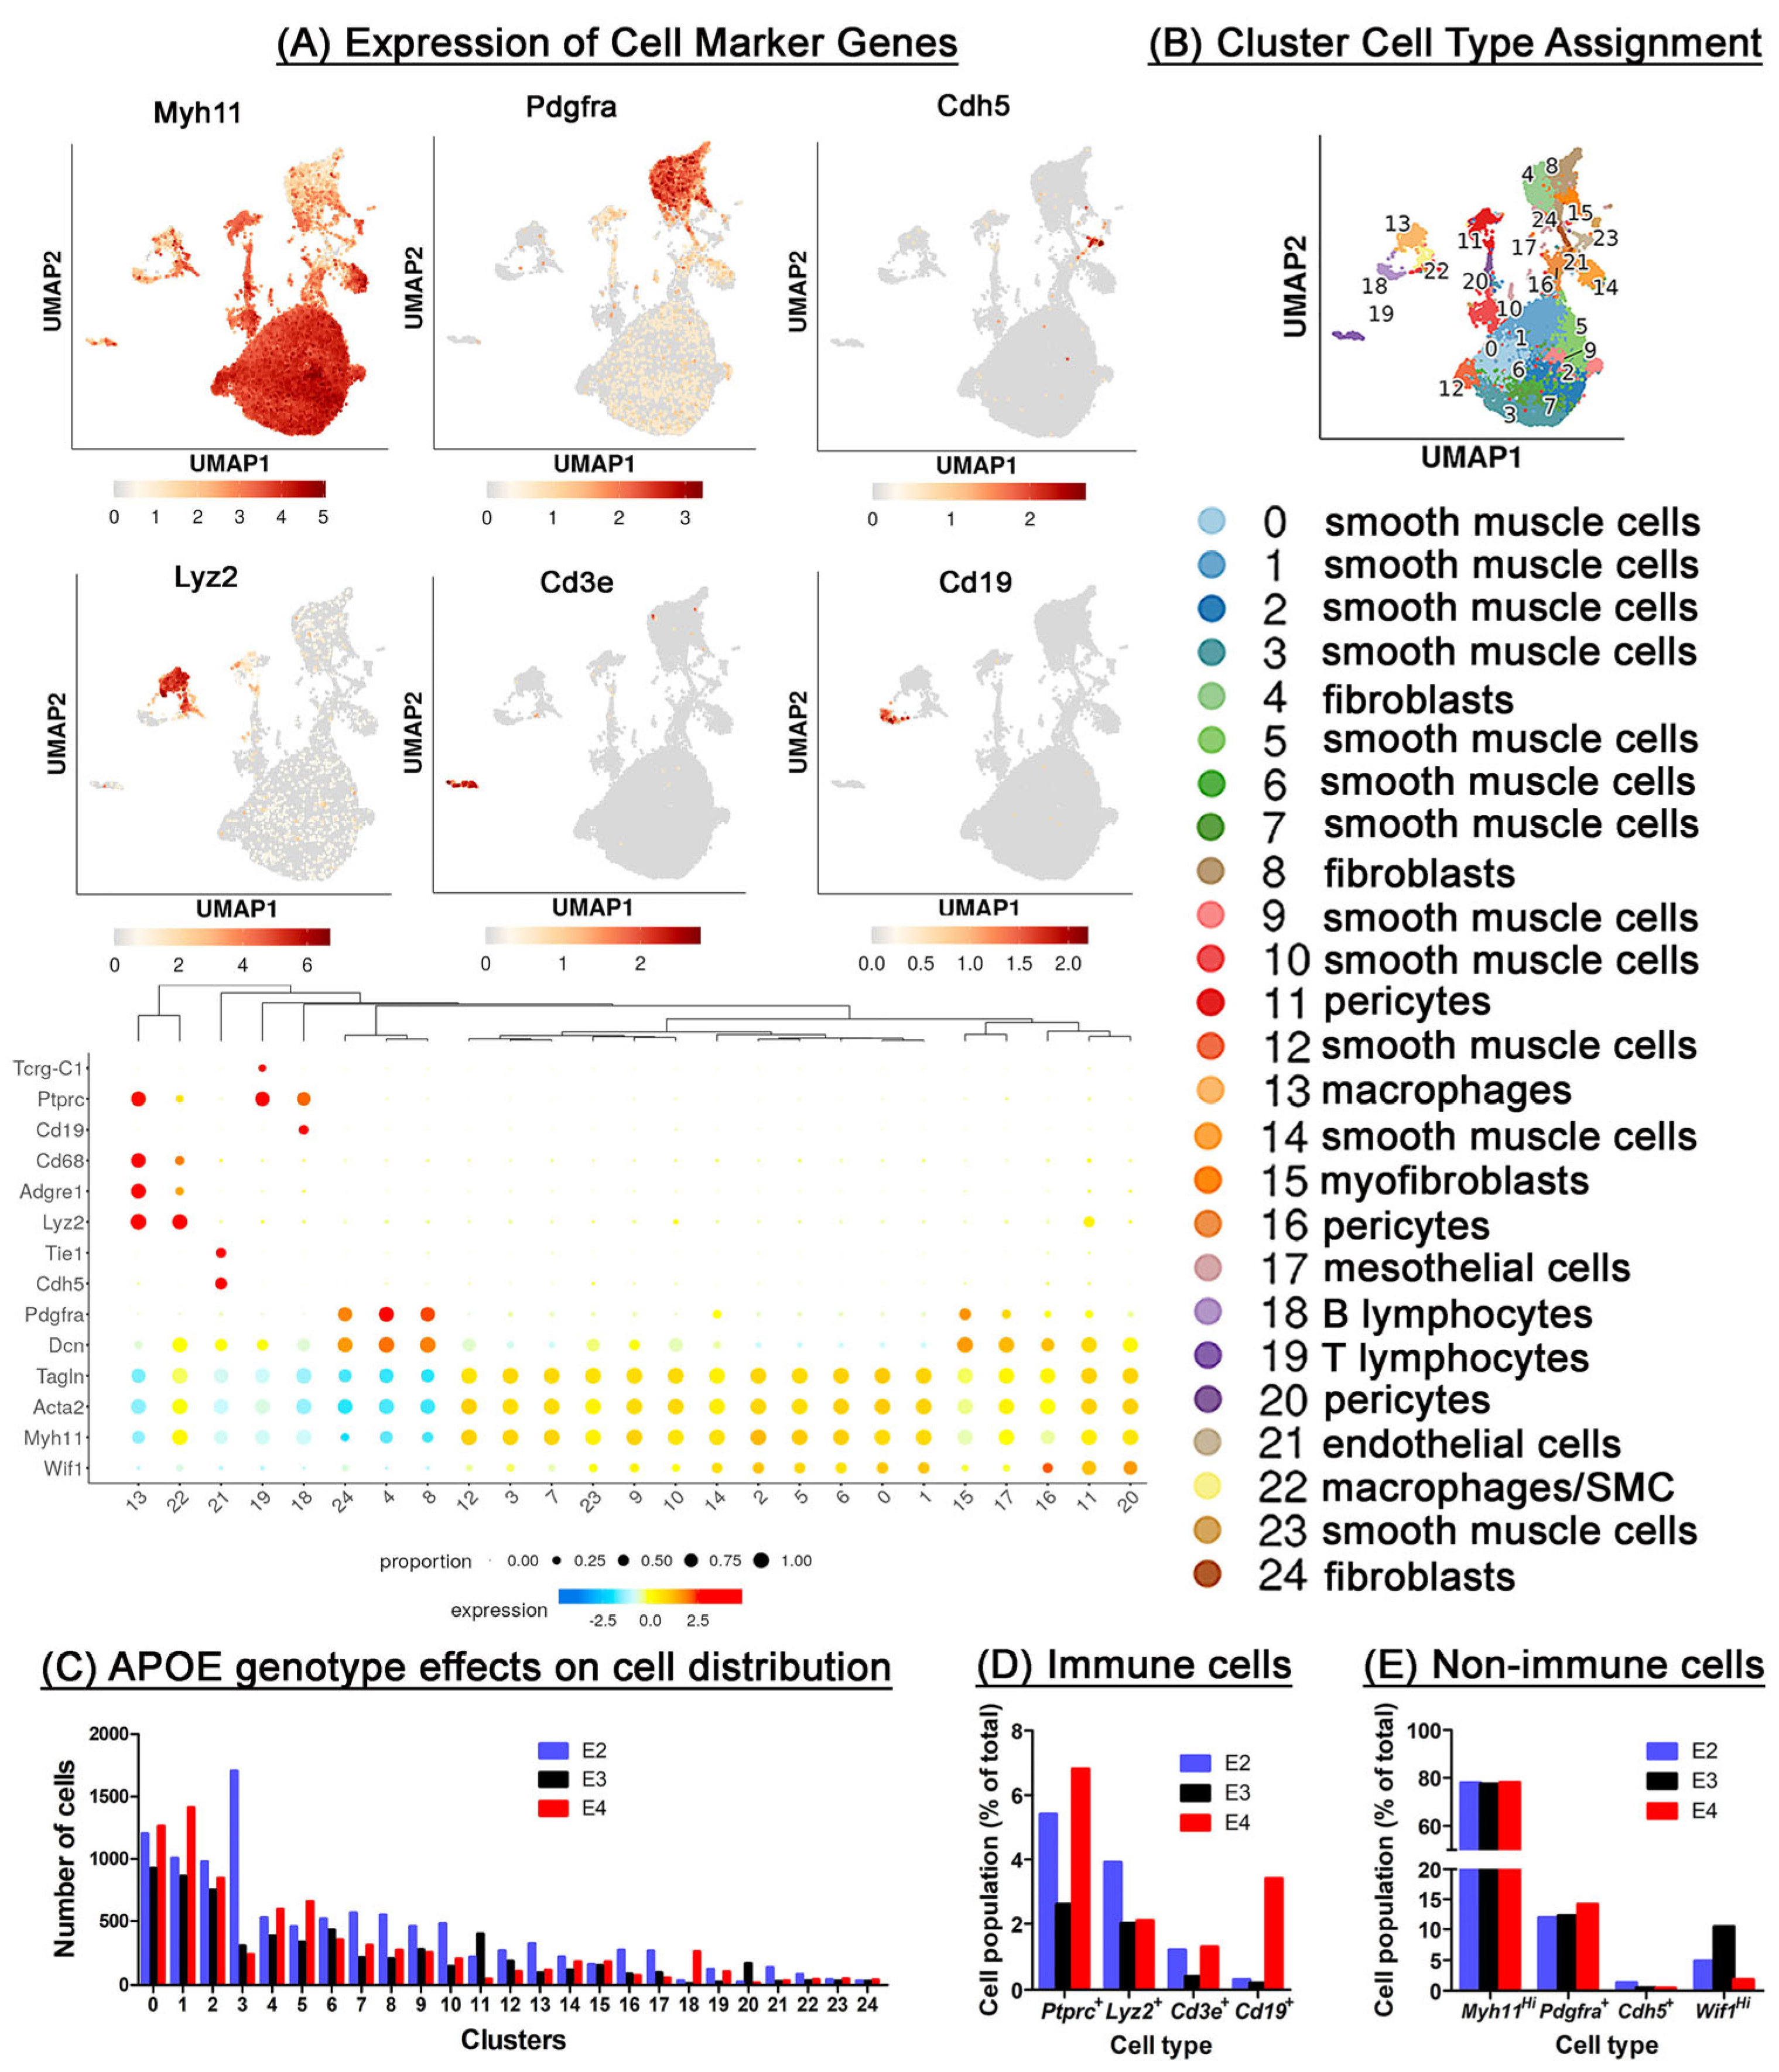
The influence of the various apoE isoforms on vascular cell composition and atherosclerosis development was examined in more detail by generating single-cell RNA-seq data from the aortas of male APOE2, APOE3, and APOE4 mice after feeding them the Western diet for 16 weeks. A total of 10,500 cells from APOE2 mice, 6264 cells from APOE3 mice, and 7680 cells from APOE4 mice were analyzed. Unbiased cluster analysis revealed 25 clusters of cells. The cell clusters were further classified based on expression of canonical cell type-specific genes, such as Ptprc/Cd45 as marker for immune cells, including the Lyz2-expressing macrophages and macrophage-like cells, Cd3e-expressing T lymphocytes, and Cd19-expressing B lymphocytes, as well as Myh11 as a marker for smooth muscle cells, Pdgfra for fibroblasts, Cdh5 for endothelial cells, and Wif1hi for pericytes or pericyte-like cells (Figure 3A). These cluster analyses identified one B lymphocyte cluster, a T lymphocyte cluster, and two clusters of cells expressing Lyz2, Cd68, and Adgre1/Emr1 (F4/80) genes that are typical in macrophages. One of these macrophage clusters, cluster 22, also expressed smooth muscle cell marker genes such as Acta2, Tagln, and Myh11, which are likely smooth muscle cell-derived macrophage-like cells. In addition to these immune cell clusters, we also identified one endothelial cell cluster based on expression of Cdh5 and Tie1 genes, three clusters of cells that can be identified as fibroblasts with high expression of Pdgfra and Dcn, as well as three clusters of pericytes or pericyte-like cells with high expression of Wif1. All other gene clusters displayed high expression levels of Acta2, Tagln, and Myh11 and were thus classified as various smooth muscle subsets or transitional smooth muscle cells from fibroblasts, pericytes, or endothelial cells (Figure 3B).
The proportions of cells within each cluster differed according to the APOE genotype. Consistent with the global gene expression data that showed increased Cd45 expression in the aortas of APOE2 and APOE4 mice compared to APOE3 mice, the scRNA-seq data also revealed more immune cells in the aortas of both APOE2 and APOE4 mice compared to APOE3 mice (Figure 3C). Specifically, both APOE2 and APOE4 mice displayed an increased number of Cd3e+ T lymphocytes in their aortas compared to APOE3 mice. However, more Lyz2+ macrophages were present in the APOE2 mouse aorta, whereas the APOE4 mouse aorta displayed more Cd19+ B lymphocytes (Figure 3D). Within the non-immune vascular cell population, a higher percentage of Wif1Hi pericytes was present in APOE3 mouse aorta, but the APOE2 mice contained a higher percentage of Cdh5+ endothelial cells compared to APOE3 and APOE4 mice (Figure 3E).

2.4. Macrophage Repertoire Differences in the Aortas of Western Diet-Fed APOE Gene Replacement Mice

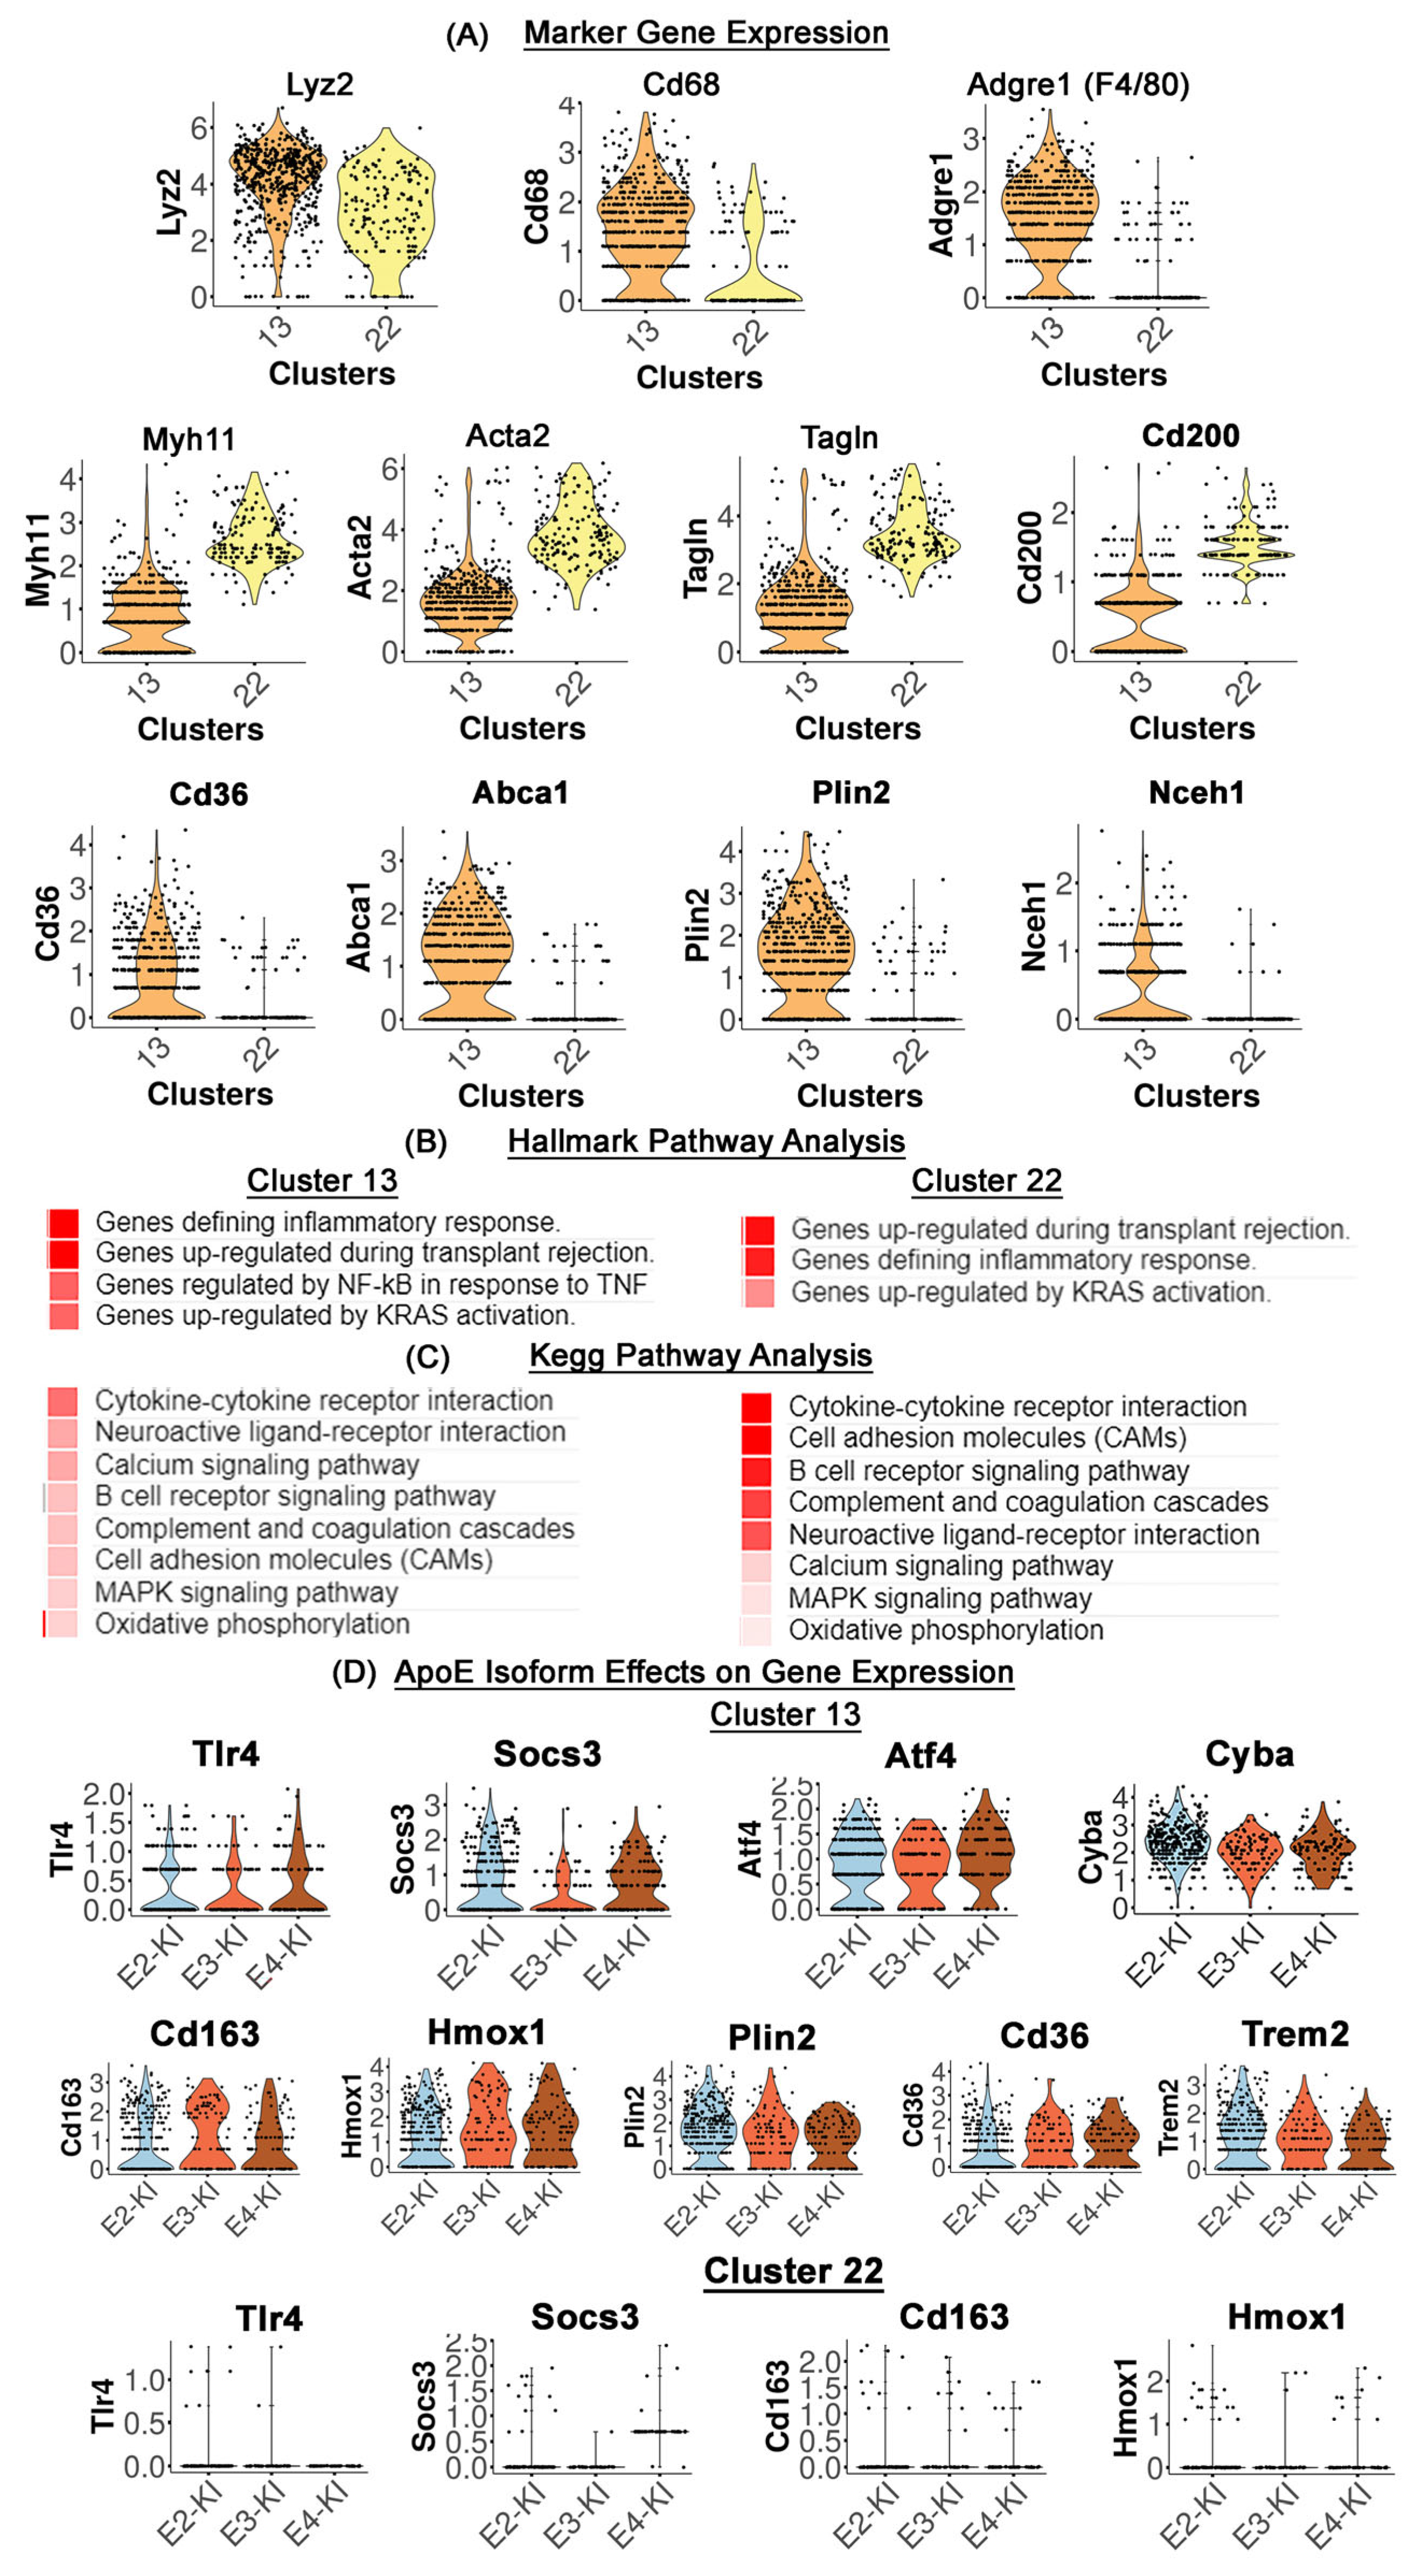
Two clusters of cells, clusters 13 and 22, displaying high Lyz2 and Cd68 expression, were classified as macrophages or macrophage-like cells (Figure 3A). Cells in cluster 13 also showed higher expression of Adgre1 (also known as EMR1 or F4/80) but relatively low expression of smooth muscle cell-specific genes Myh11, Acta2, and Tagln (Figure 3A and Figure 4A). Therefore, cells in this cluster were likely classical macrophages derived from monocytes infiltrated into the aortas in response to Western diet feeding. In contrast, cells in cluster 22 showed very low Adgre1 expression but displayed high expression levels of smooth muscle marker genes such as Acta2 and Tagln (Figure 3A and Figure 4A). These characteristics are similar to those described for smooth muscle-derived macrophage-like foam cells in atherosclerotic lesions [33]. The identification of cluster 22 cells as smooth muscle-derived macrophage-like foam cells was further supported by expression of Cd200 (Figure 4A), a cell surface lineage marker of vascular smooth muscle cells [34], as well as their relatively low expression of genes responsible for lipid and cholesterol droplet turnover such as Cd36, Abca1, Plin2, and Nceh1 compared to macrophages in cluster 13 (Figure 4A). Therefore, cells in cluster 22 were likely smooth muscle-derived macrophage-like foam cells in response to the Western diet. Hallmark and Kegg Pathway analyses revealed high expression of inflammatory genes in cells within both clusters, including the enrichment of genes responsible for KRAS activation, cytokine–cytokine receptor interaction, cell adhesion molecules, complement and coagulation activation cascades, and mitogen-activated protein (MAP) signaling (Figure 4B,C). Both cluster 13 and cluster 22 cells were also enriched with genes responsible for oxidative phosphorylation (Figure 4B,C), suggesting the presence of alternatively activated or anti-inflammatory macrophages. However, the enrichment of oxidative phosphorylation genes may also reflect high lipid handling activity of pro-inflammatory macrophages in response to Western diet feeding [35,36].
The scRNA-seq data from clusters 13 and 22 macrophage-like cells were further analyzed based on APOE genotype of the samples. Consistent with pathway analysis of the data revealing enrichment of inflammatory response genes in cluster 13 cells, the pro-inflammatory genes such as Tlr4 and Socs3 were highly expressed in cluster 13 cells from Western diet-fed APOE2, APOE3, and APOE4 mice (Figure 4D). However, these genes were expressed at higher levels in APOE2 and APOE4 mice compared to that in APOE3 mice (Figure 4D). Expression levels of the endoplasmic reticulum-stress marker Atf4 and the oxidative stress-marker Cyba were also higher in APOE2 and APOE4 cells compared to APOE3 cells, whereas expression levels of anti-inflammatory and anti-oxidative stress-related Cd163 and Hmox1 were higher in cluster 13 cells from APOE3 mice compared to APOE2 and APOE4 mice (Figure 4D). Although cluster 13 cells in both APOE2 and APOE4 mice exhibited characteristics of endoplasmic and oxidative stress, expression levels of the lipid metabolism genes such as Cd36 and Plin2 were higher in cluster 13 cells from APOE2 mice but lower in APOE4 mice compared to APOE3 mice (Figure 4D). The difference in Plin2 expression between APOE2 and APOE4 mice suggested that the endoplasmic- and oxidative stress in cluster 13 cells of APOE2 mice was most likely due to increased lipid accumulation, whereas the stress in APOE4 cluster 13 cells was independent of lipid storage but a direct effect of apoE4 on endoplasmic reticulum and oxidative stress [26]. This conclusion was further supported by the observation of high expression of the foam cell-promoting lipid receptor Trem2 [37] in APOE2 but not APOE3 or APOE4 cluster 13 cells (Figure 4D). It is of note that high Trem2 expression is generally associated with anti-inflammatory response and oxidative phosphorylation [38]. Thus, the elevated oxidative phosphorylation pathway identified in cluster 13 cells may be related to Trem2-expressing cells. However, increased lipid-induced Trem2 expression has also been shown to activate macrophage signaling pathways that enhance foam cell formation, pro-inflammatory cytokine production, and atherosclerosis progression [39,40]. Thus, the abundance of cluster 13 cells in APOE2 mice may be responsible at least in part to the atherosclerosis observed in these animals.
In contrast to cluster 13 cells, Tlr4, Socs3, Cd163, and Hmox1 levels were minimally detected in cluster 22 macrophage-like cells regardless of the APOE genotype (Figure 4D). The nearly absent expression of these classical macrophage inflammatory marker genes further distinguished cluster 22 cells from classical macrophages, which supported their identification as Cd200-expressing smooth muscle cell-derived macrophage-like foam cells. Analysis of the data revealed a higher number of cluster 22 cells in the aortas of APOE2 mice compared to those from APOE3 and APOE4 mice, thus indicating increased proliferation and/or differentiation of smooth muscle cells to foamy macrophage-like cells after lipid accumulation (Figure 3C). Taken together, these results indicate that the APOE genotype has distinct influence on aortic macrophage inflammation, with APOE2 and APOE4 increasing polarization of the classical macrophages toward the M1 pro-inflammatory phenotype while reducing M2 anti-inflammatory polarization compared to APOE3. Moreover, these analyses also revealed that inflammation in macrophage-like cells derived from smooth muscle cells proceeded via mechanism independent of classical M1 and M2 polarization pathways.

2.5. Lymphocyte Subset Differences in Aortas of Western Diet-Fed APOE Gene Replacement Mice

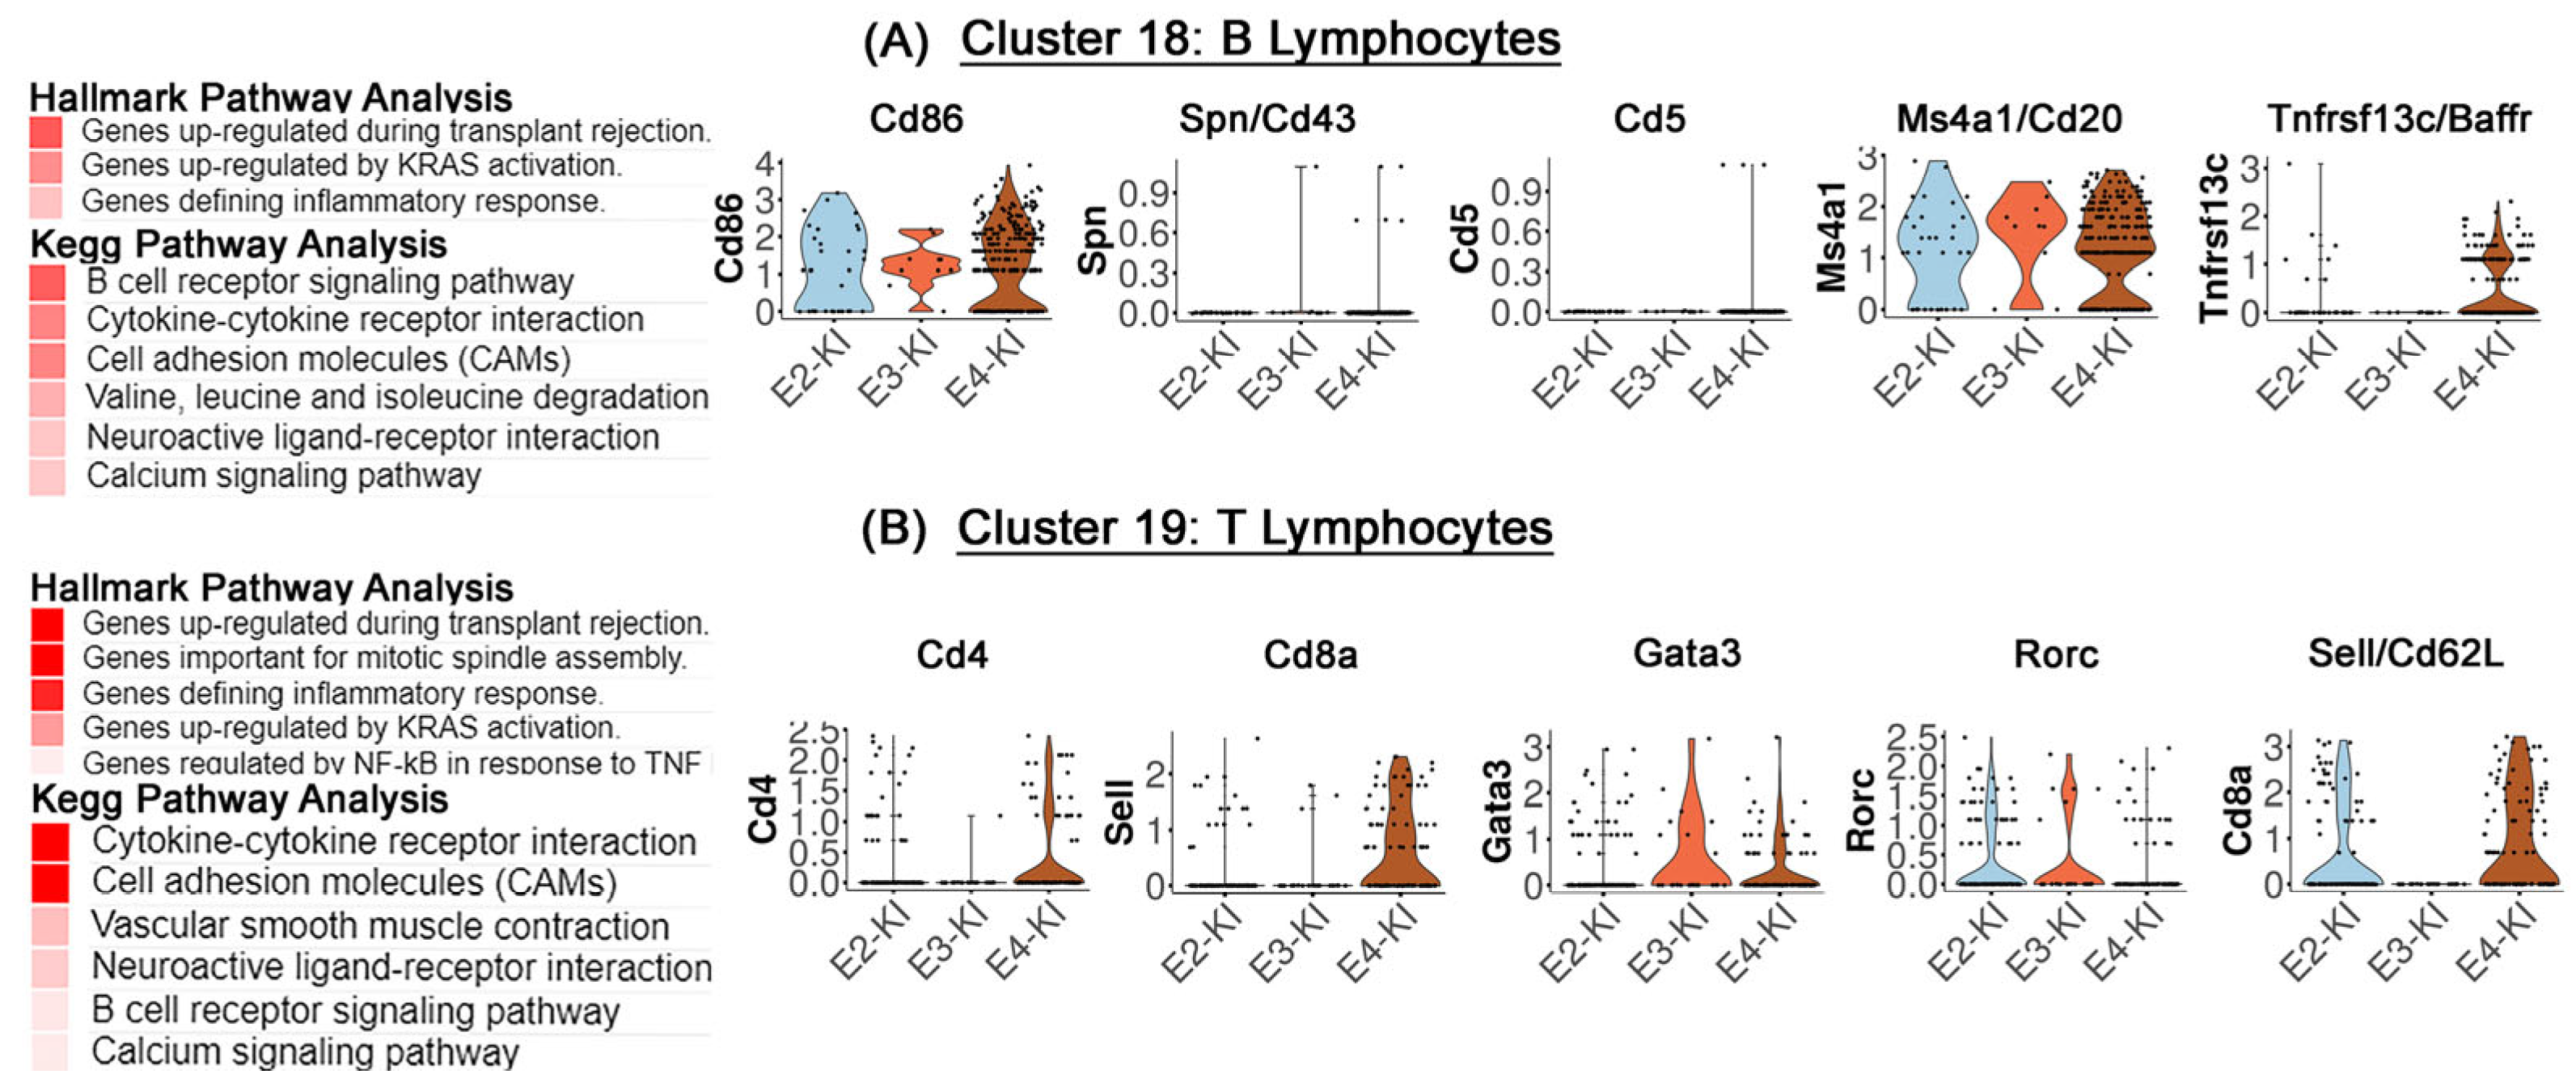
Cells in cluster 18 were identified as B lymphocytes based on Cd19 expression (Figure 2A). While Cd19+ cells represent only a small population of cells in the aortas of these Western diet-fed mice, the number of cluster 18 cells in APOE4 mice exceeded those in APOE2 and APOE3 mice by ~10-fold (Figure 3C). Hallmark and Kegg Pathway analyses revealed enrichment of inflammatory response genes in cluster 18 cells from these Western diet-fed mice (Figure 5A). Additional data mining revealed high level Cd86 expression in APOE2 and APOE4 mice compared to APOE3 mice, suggesting the elevated presence of activated B lymphocytes in the aortas of both APOE2 and APOE4 mice (Figure 5A). Cells in this cluster displayed high expression levels of Ms4a1/Cd20, a marker of B-2 lymphocytes, but expression of the B-1 lymphocyte markers Spn/Cd43 and Cd5 were minimally detected in all cluster 18 cells (Figure 5A). Thus, most of the B lymphocytes in the aorta were the pro-atherogenic B-2 lymphocyte subtype after Western diet feeding [41]. The level of Ms4a1/Cd20 expression was more prevalent in cluster 18 cells from APOE2 and APOE4 mice compared to APOE3 mice (Figure 5A), suggesting that apoE2 and apoE4 may also promote atherogenesis via increased B-2 cells in the aorta. Unexpectedly, expression of Tnfrs13c/Baffr gene, encoding the B cell-activating factor receptor BAFFR, was found to be higher only in APOE4 mice but not in APOE2 mice (Figure 5A). Although the significance of the APOE genotype-dependent difference in BAFFR expression in B-2 lymphocytes remains unclear, these findings suggest that apoE2 and apoE4 expression may promote B-2 lymphocyte accumulation in aortas via different mechanisms.
In contrast to cluster 18 B lymphocytes, cluster 19 cells were identified as T lymphocytes based on high Cd3e gene expression (Figure 3). These cells were likely infiltrated into the aortas in response to inflammation after Western diet feeding. Indeed, Hallmark and Kegg Pathway analyses revealed high expression of inflammatory response genes in cluster 19 cells (Figure 5B). However, cluster 19 cells accounted for only a small percentage of cells in the aortas, which reflects the minimal atherosclerotic lesions detected in these animals under the experimental conditions of the current study. Nevertheless, detailed analysis of gene markers for T cell subsets revealed important differences in the T lymphocyte composition in the aortas of Western diet-fed APOE2, APOE3, and APOE4 mice. In particular, Cd4+ T helper cells were present in the aortas of APOE4 mice but were minimally present in APOE2 and APOE3 mice. In contrast, Cd8+ cytotoxic T cells were present in both APOE2 and APOE4 mice (Figure 5B). The near absence of Cd4+ and Cd8+ lymphocytes in the aortas of APOE3 mice were consistent with 5-fold less cluster 19 cells and the resistance to vascular inflammation and atherosclerosis in these animals. Differences in atherosclerosis and inflammation in the aortas of these animals were likely not related to differences in inflammation suppression as the regulatory T cell transcription factor FoxP3 was not detected in cluster 19 cells regardless of ApoE genotype. However, despite the detection of a low number of Cd4+ T helper cells, the Th2-defining transcription factor Gata3 [42] was found to be expressed at higher levels in cluster 19 cells from APOE3 and APOE4 mice compared to APOE2 mice (Figure 5B). In contrast, the Th17-defining transcription factor Rorc [43] was higher in cells from APOE2 and APOE3 mice with minimal expression in APOE4 mice. Likewise, the memory T cell marker Sell encoding Cd62L (also known as L-selectin) was detected only in cluster 19 cells from APOE4 mice and was minimally expressed in cells from APOE2 and APOE3 mice (Figure 5B). Since apoE is not expressed in lymphocytes [44,45], differences in apoE isoform signaling in the vessel wall are likely responsible for the different lymphocyte subset composition in the aortas of Western diet-fed APOE2, APOE3, and APOE4 mice. The differences in lymphocyte subset composition in the aortas may at least in part contribute to differences in inflammation and atherosclerosis susceptibility between APOE2, APOE3, and APOE4 mice.

2.6. Endothelial Cell Differences in the Aortas of APOE2, APOE3, and APOE4 Mice

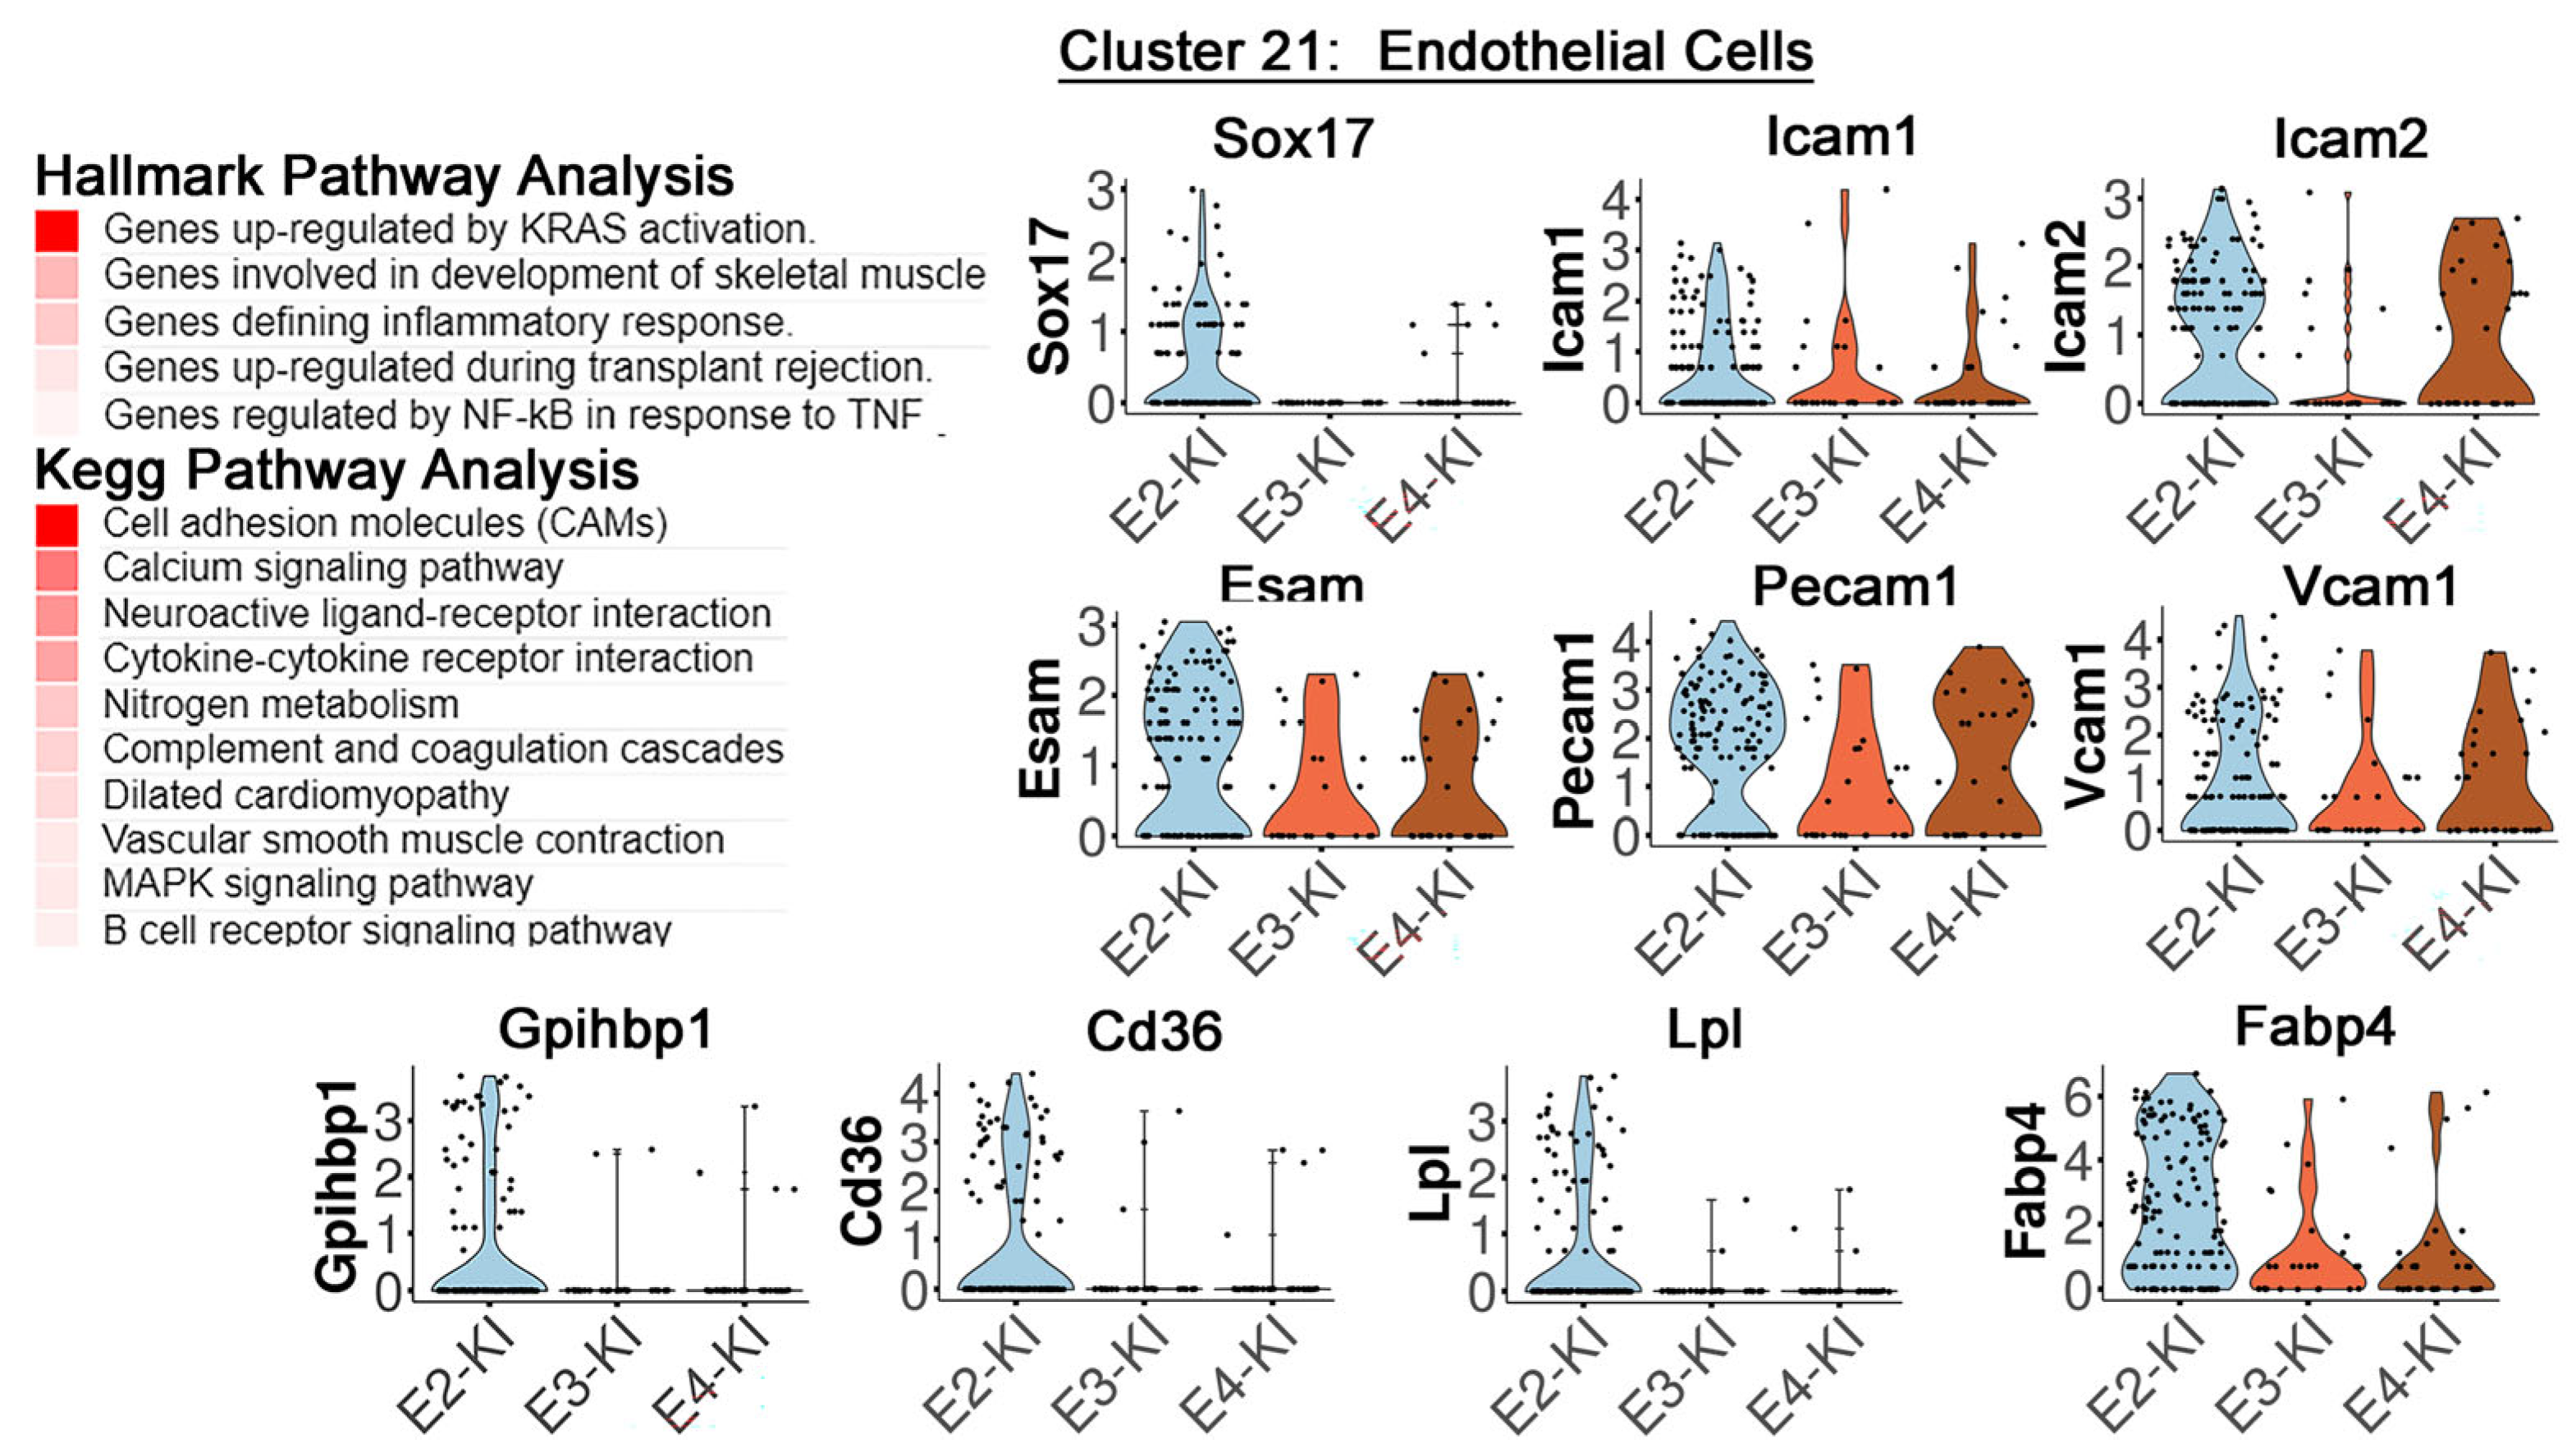
Cells in cluster 21 were identified as endothelial cells based on Cdh5 and Tie1 gene expression (Figure 3A). While cell recovery was relatively low, approximately 5-fold more cluster 21 cells were recovered from aortas of APOE2 mice compared to APOE3 mice and 4-fold more than those obtained from APOE4 mice. The higher number of cluster 21 endothelial cells in the aortas of APOE2 mice was consistent with the higher expression levels of Sox17 (Figure 6), a protein that plays an important role in endothelial adaptation to hemodynamic changes in response to fluid shear stress as well as vascular remodeling and vasculogenesis [46,47]. Hallmark and Kegg Pathway analyses revealed enrichment of inflammation genes that reflect vascular inflammation in response to Western diet feeding (Figure 6). In particular, high expression levels of Icam1, Icam2, and Esam which are responsible for leukocyte adhesion [48,49], Pecam1 which facilitates leukocyte transmigration through the vessel wall [50], and Vcam1 which promotes monocyte accumulation [51] were detected in cluster 21 endothelial cells from the aortas of APOE2, APOE3, and APOE4 mice (Figure 6). Importantly, higher expression of these adhesion molecules was observed in endothelial cells from APOE2 mice compared to APOE3 and APOE4 mice (Figure 6). The increased inflammatory gene expression in the endothelial cells of APOE2 mice may be due to the high expression levels of lipid uptake genes such as GPIHBP1, CD36, and LPL as well as the intracellular fatty acid transporter gene Fabp4 (Figure 6). The increased lipid uptake as well as expression of adhesion molecules in APOE2 mouse endothelial cells may be a contributing factor to the higher percentage of macrophages and increased atherosclerotic lesions observed in APOE2 mice.

2.7. APOE Genotype Differentially Affects Fibroblast and Fibroblast-like Cell Composition in Mouse Aorta

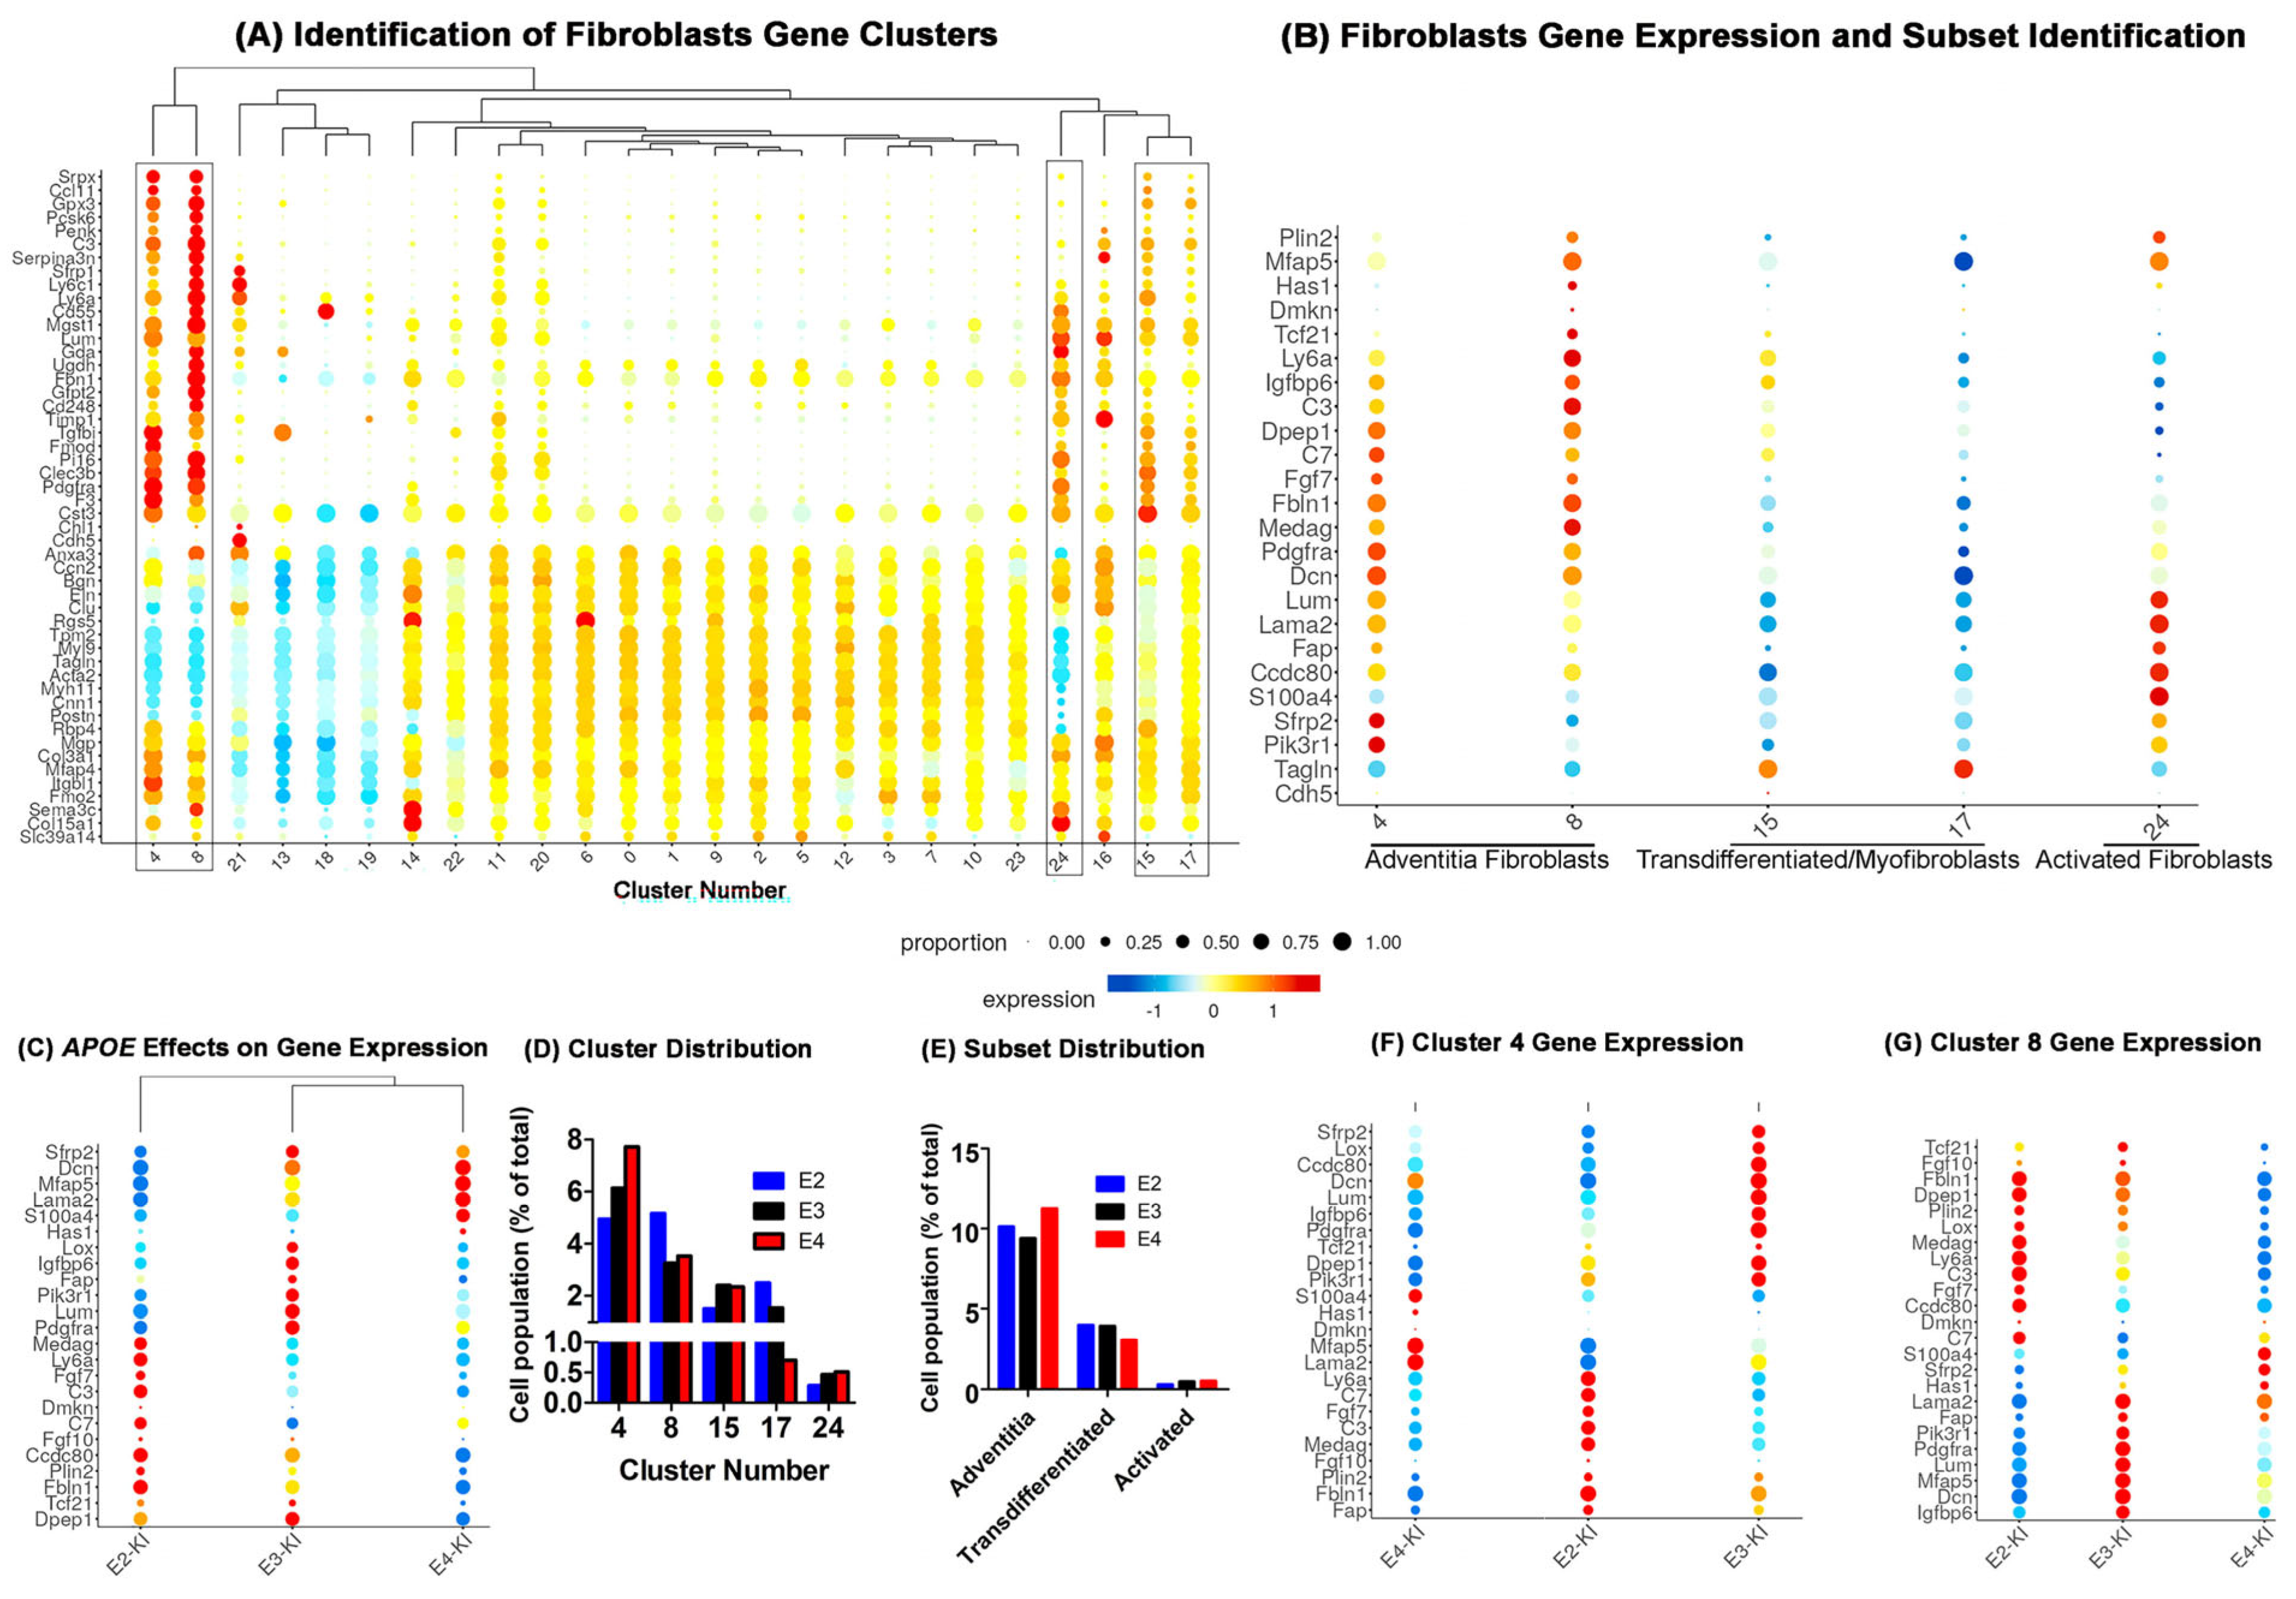
Five clusters of cells, namely clusters 4, 8, 15, 17, and 24, displayed relatively high Pdgfra and Dcn expression levels compared to cells in other clusters, suggesting that cells in these clusters may be classified as fibroblasts or fibroblast-like cells (Figure 7A). Additional analysis focusing on the expression of fibroblast gene markers, published previously [52,53,54,55], identified cells in clusters 4 and 8 which were closely related with high expression of fibroblast gene markers such as Pdgfra, Dcn, and Ly6a with low or minimal expression of smooth muscle-specific genes Tagln, Acta2, and Myh11 or the endothelial-specific gene Cdh5 (Figure 7B). Therefore, cells in clusters 4 and 8 were identified as subsets of adventitia fibroblasts. In contrast, cells in clusters 15 and 17 were related but distinct from the classical fibroblasts due to their high expression levels of gene markers for both fibroblasts and smooth muscle cells. Accordingly, cells in clusters 15 and 17 likely originated as smooth muscle cells and obtained fibroblastic characteristics as a result of transdifferentiation [56]. Alternatively, these cells may also be myofibroblasts that gained smooth muscle cell characteristics with Western diet feeding [52,53,55]. Finally, cluster 24 cells also expressed fibroblast gene markers with minimal expression of smooth muscle genes (Figure 7B). However, cluster 24 cells expressed higher levels of S100A4 and FAP with relatively low level expression of Dcn. Thus, cells in cluster 24 were probably activated fibroblasts in transition to myofibroblasts (Figure 7B). Unfortunately, cluster 24 cells cannot be definitively characterized due to their low cell number (<1% of the total cell population) in the aortas.
It is interesting to note that APOE genotype also influences the expression of genes responsible for fibroblast activation. In comparison to fibroblasts and fibroblast-like cells in the aorta of APOE3 mice, which expressed high levels of Lum, Igfbp6, and Fap genes, fibroblastic cells in APOE4 mice displayed high expression levels of Mfap5, Lama2, Dcn, and S100a4 (Figure 7C). The fibroblasts and fibroblast-like cells in APOE2 mouse aorta were different from cells in APOE3 and APOE4 mice and displayed high expression levels of genes that are expressed in lipofibroblasts such as Plin2, Ly6a, Medag, Fbln1, Fgf7, and C3 (Figure 7C). Additionally, APOE genotype also influences cell distribution among the various fibroblast and fibroblast-like subsets. Despite similar percentage of fibroblasts and fibroblast-like cells in the aortas of Western diet-fed APOE2, APOE3, and APOE4 mice, the aortas of APOE4 mice contained a higher percentage, whereas the aortas of APOE2 mice displayed a lower percentage of cluster 4 adventitia fibroblasts compared to the aortas of APOE3 mice (Figure 7D,E). In contrast, a higher percentage of clusters 8 adventitia fibroblasts and cluster 17 transitional fibroblasts, but lower percentage of clusters 4 and 15 cells, were observed in APOE2 mice compared to APOE3 and APOE4 mice (Figure 7D). Taken together, both APOE2 and APOE4 mice contained a higher percentage of adventitia fibroblasts compared to APOE3 mice, and less transdifferentiated fibroblasts were observed in the aortas of APOE4 mice (Figure 7E).
APOE genotype also appeared to affect gene expression profile within each cluster, particularly in the typical fibroblasts within clusters 4 and 8. Specifically, cluster 4 cells from APOE2 mouse aorta were more related to those from APOE3 mouse aorta, except for the high expression levels of genes that participate in intracellular lipid accumulation, whereas cells from APOE4 mice were more distantly related due to preponderance of cells with high S100a4, Mfap5, and Lama2 expression levels (Figure 7F). In contrast, whereas genes related to intracellular lipid accumulation were also highly expressed and prevalent in cluster 8 cells from APOE2 mice, cluster 8 cells from APOE3 mice were more similar to those from APOE4 mice compared to those from APOE2 mice (Figure 7G). For example, cluster 8 cells in both APOE3 and APOE4 mice displayed high expression levels of the fibroblasts activating factor gene Fap, whereas Fap was expressed at low levels in cluster 8 cells from APOE2 mice. Interestingly, elevated expression of the pro-inflammatory and pro-fibrotic gene S100a4 was only observed in cluster 8 cells from APOE4 mice but not in APOE3 and APOE4 mice. We interpret these observations to indicate that cluster 8 cells in APOE3 and APOE4 mice were both activated fibroblasts, but their activation appeared to proceed via distinct mechanisms.

2.8. APOE Genotype Influence on Aortic Smooth Muscle Cell Phenotype Composition

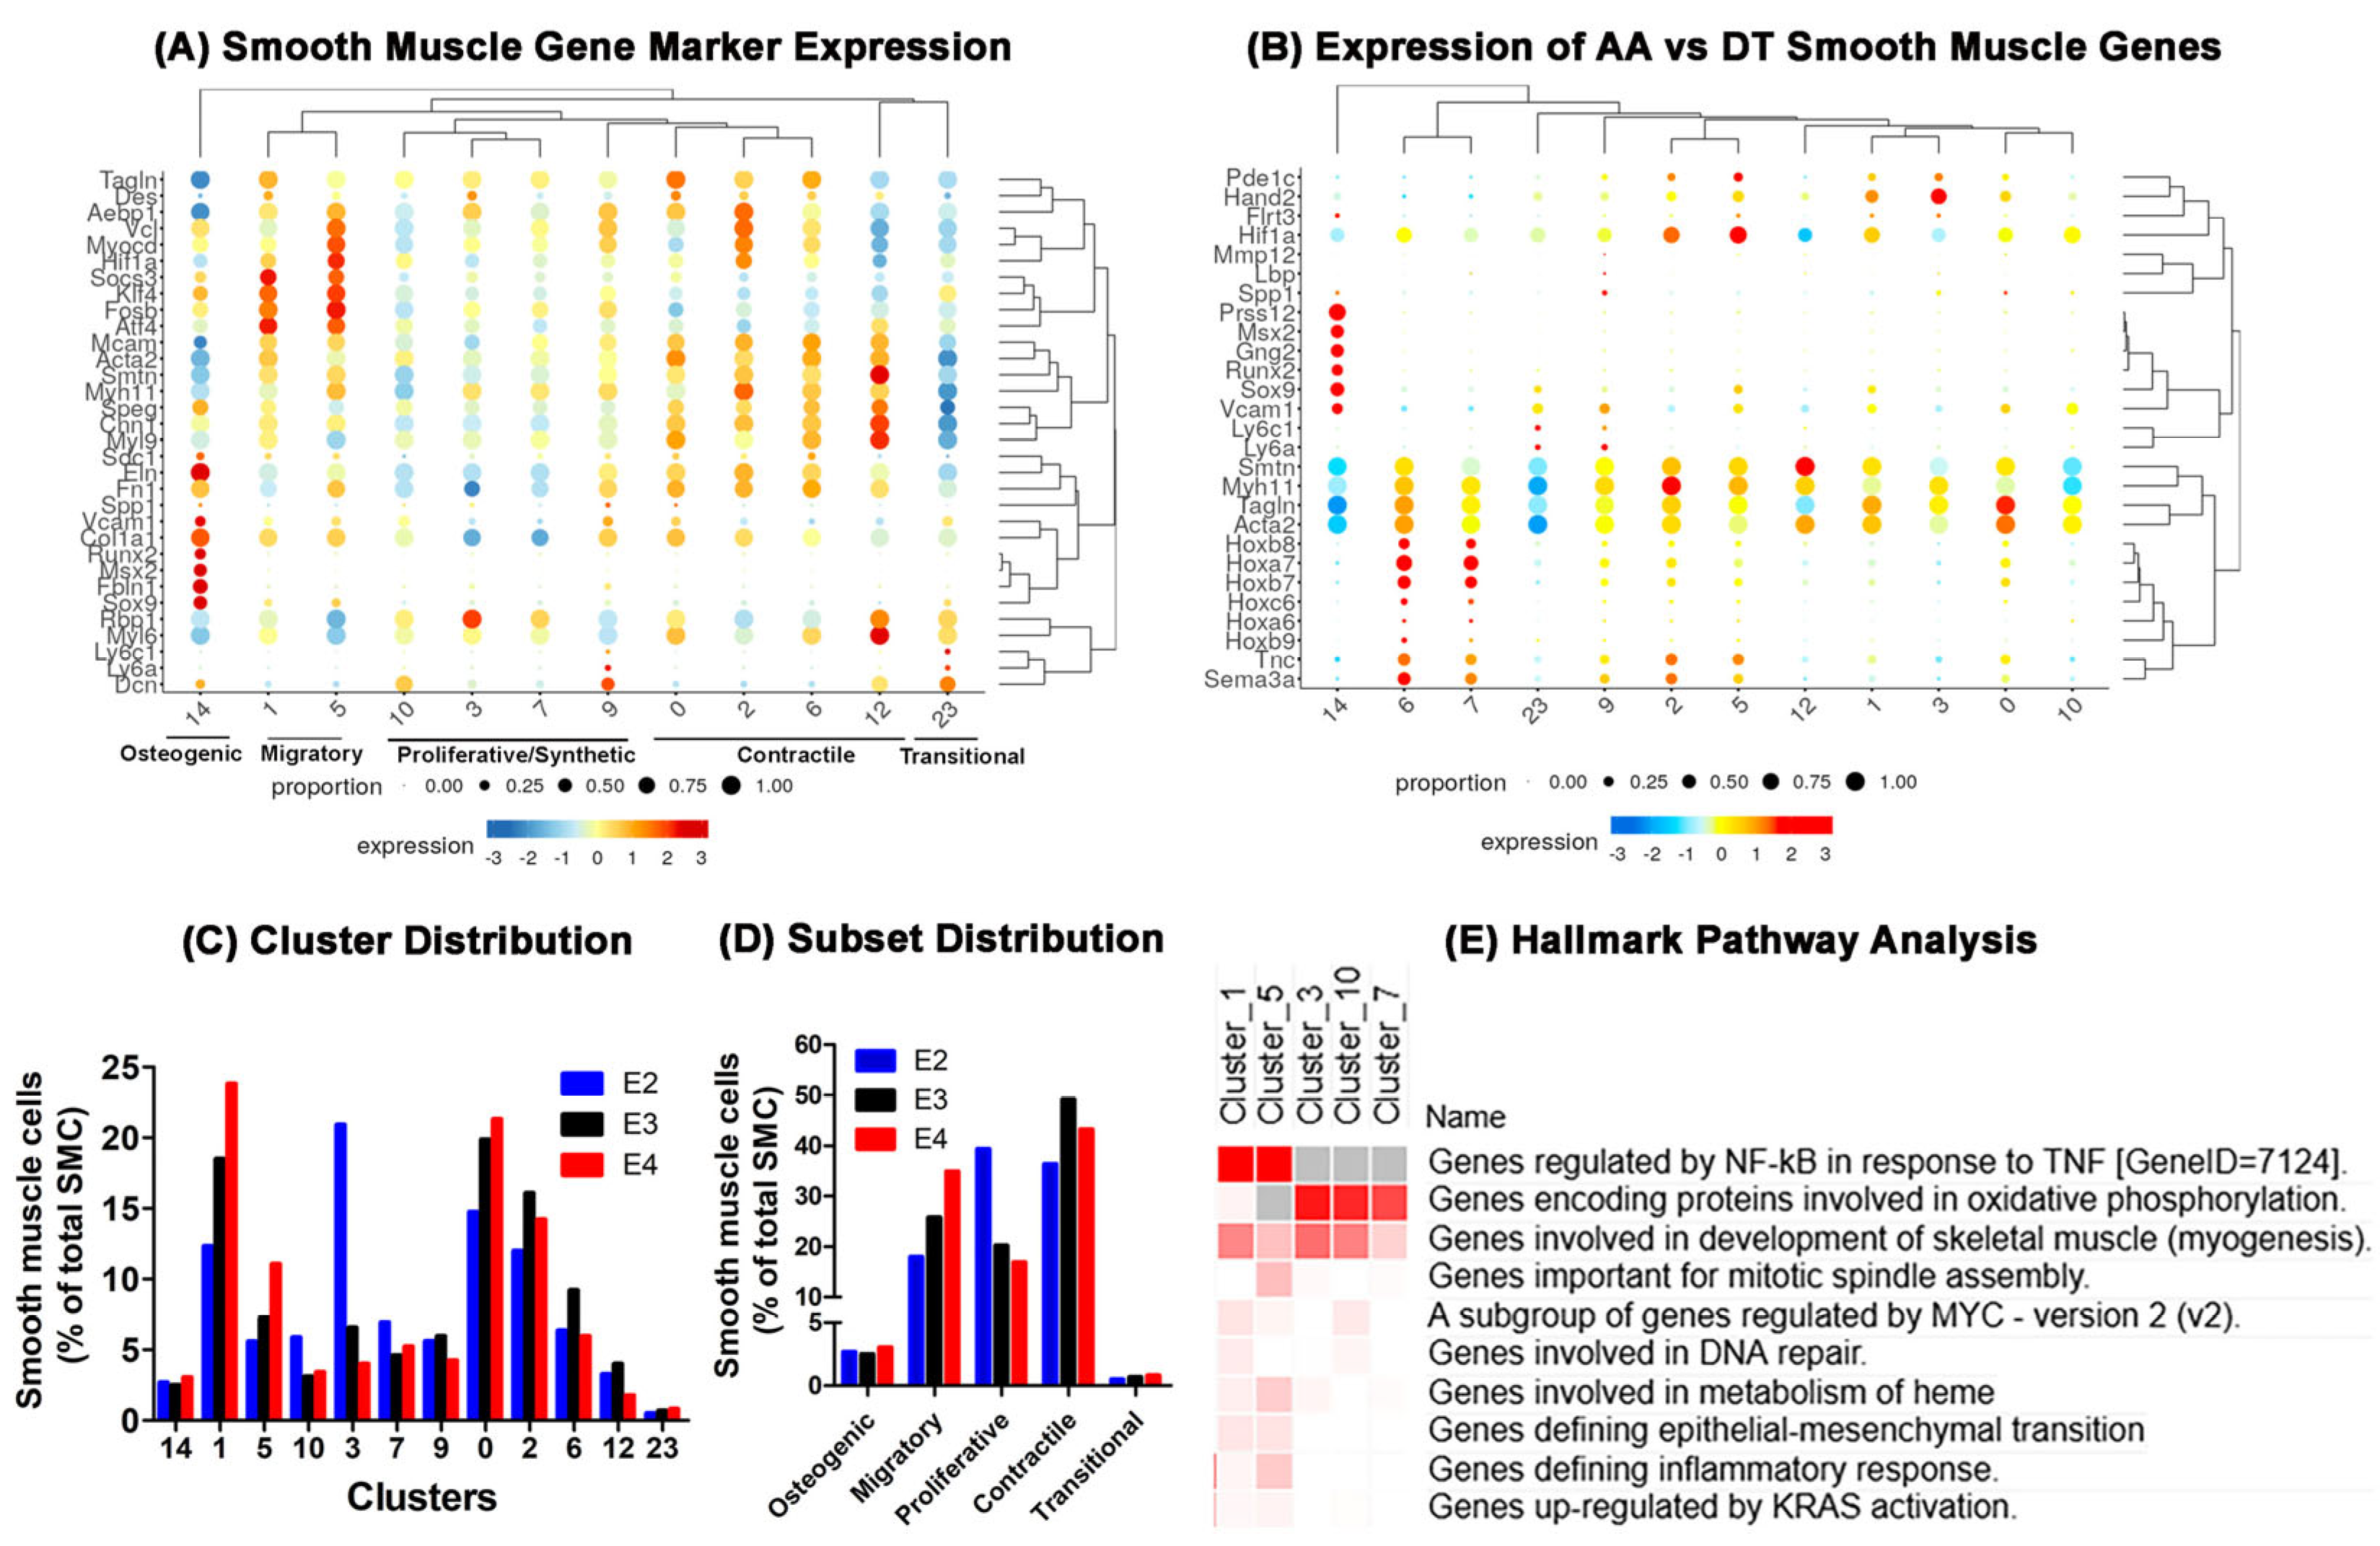
Fourteen cell clusters were initially identified as smooth muscle cells in the mouse aorta based on high expression of Myh11, Tagln, and Acta2 genes with minimal expression of marker genes for lymphocytes, monocytes/macrophages, and fibroblasts (Figure 3A). However, cells in clusters 13 and 20 also displayed high Wif1 expression level and were therefore re-classified as pericytes. Of the remaining 12 cell clusters, the high expression levels of Runx2, Msx2, and Sox9 identified cluster 14 as osteogenic smooth muscle cells [57], whereas high expression levels of Hif1a and Klf4 in clusters 1 and 5 identified these cells as highly migratory smooth muscle cells [58]. The other smooth muscle cell clusters were identified as either proliferative/synthetic smooth muscle cells (clusters 10, 3, 7, and 9) or contractile smooth muscle cells (clusters 0, 2, 6, and 12) based on expression levels of the classical smooth muscle genes such as Acta2, Smtn, Myh11, Speg, Cnn1, Myl9, and Smtn (Figure 8A). Cells in cluster 12 also displayed high expression of Rbp1, indicative of a transitional smooth muscle cell type that appeared transiently with endothelial injury [59]. Cluster 23 was another unique subset of smooth muscle cells with high Rbp1 expression level. However, cells in cluster 23 also displayed high Dcn expression levels but with low expression levels of the classical smooth muscle cells. Thus, cluster 23 cells were likely in a smooth muscle–myofibroblast transition state.
Additional analysis based on expression of genes localized to the aortic arch such as Pde1c, Prss12, Gng2, Hand2, Flrt3, Lbp, Mmp12, and Spp1, or genes expressed in the descending aorta such as the homeobox genes Hoxb7, Hoxa7, Hoxb8, Hoxb9, Hoxa6, Hoxc6 as well as Sema3a and Tnc [60], revealed that cell clusters displaying similar phenotypes identified above were different subsets due to their anatomic location in the vascular bed. For example, the highly migratory smooth muscle cells in cluster 1 were derived mainly from the aortic arch, whereas similar cells in cluster 5 were a mixture of smooth muscle cells from the aortic arch and descending aorta (Figure 8B). Likewise, different cluster identification for the proliferative/synthetic smooth muscle cells was likely due to cell origin with cluster 3 cells derived from the aortic arch and clusters 7 and 9 cells derived from the descending aorta (Figure 8B). Similar analysis revealed that the contractile smooth muscle cell clusters were derived from mixed cell origin (clusters 0, 2) or were predominantly descending aorta smooth muscle cells (clusters 6, 12).
The aortas of APOE4 mice contained a higher percentage of highly migratory smooth muscle cells regardless of whether the cells were derived from the aortic arch or the descending aorta (clusters 1 and 5). In contrast, both the aortic arch and descending aortas of APOE2 mice displayed a high percentage of proliferative/synthetic smooth muscle cells (clusters 10, 3, 7). The APOE2 aortas also contained less cells in clusters 0 and 2 compared to aortas from APOE3 and APOE4 mice, whereas both APOE2 and APOE4 aortas contained lower percentage of cluster 6 smooth muscle cells compared to that found in APOE3 aortas (Figure 8C). Since cells in clusters 0, 2, and 6 were identified as normal contractile smooth muscle cells, these results indicated that apoE2 and apoE4 expression increased de-differentiation of smooth muscle cells with reduced presence of normal contractile smooth muscle cells in the aorta (Figure 8D). Whereas apoE2 expression increased presence of proliferative/synthetic smooth muscle cells in the aorta, apoE4 expression elevated the presence migratory smooth muscle cells (Figure 8D). Consistent with this interpretation is that Hallmark Pathway analysis revealed increased expression of muscle development genes in clusters 1, 5, 3, 10, and 7 that were enriched in either APOE2 or APOE4 mice (Figure 8E). Hallmark Pathway analysis also revealed that cluster 1 and 5 cells enriched in APOE4 mice displayed high expression levels of NFĸB-responsive genes as well as elevated expression of pro-oxidation and inflammatory genes (Figure 8E). In contrast, cluster 3, 10, and 7 cells enriched in APOE2 mice were cells with high expression of genes in the oxidative phosphorylation pathway (Figure 8E). These include both mitochondrial-encoded genes as well as nuclear-encoded respiratory chain genes. A complete list showing changes of oxidative phosphorylation genes across all smooth muscle cell clusters is shown in Supplemental Materials (Table S1), while significant changes based on GSEA are shown in Supplemental Materials (Table S2). The summary of these results for the oxidative phosphorylation pathway across all smooth muscle cell clusters is shown in Table S3. Of particular interest was the enrichment of genes coding for NADH:ubiquinone oxidoreductase subunits that form mitochondria complex 1, such as Ndufa6, Ndufb7, Ndufs1, Ndufs6, Ndufa9, and Ndufs3, which were highly expressed in these clusters (Tables S1 and S2). The increased expression of these mitochondria complex 1 proteins may result in electron transport chain leakage and reactive oxygen species generation to promote smooth muscle cell dedifferentiation to a proliferative/synthetic phenotype [61,62]. Taken together, different cell clusters enriched in the aortas of APOE2 and APOE4 mice, each with their unique signaling pathway gene expression, suggested that apoE2 and apoE4 may promote vascular smooth muscle cell remodeling via distinct mechanisms.

3. Discussion

This study used gene replacement mouse models in which the endogenous mouse ApoE gene was replaced at the same locus with either human APOE2, APOE3, or APOE4 genes and showed that human ApoE2 expression promotes hyperlipidemia and atherosclerosis in response to feeding mice a high fat–high cholesterol Western-type diet. These results are consistent with those observed in similar studies when the mice were fed an atherogenic diet containing high cholesterol and cholic acid [30], as well as human studies documenting the association between APOE2 genotype with familial dysbetalipoproteinemia [63]. In contrast, Western diet-fed APOE3 and APOE4 mice did not display hyperlipidemia or atherosclerosis. These results were different from those reported earlier in which APOE3 and APOE4 mice were shown to be hyperlipidemic and developed atherosclerosis when fed the cholesterol-cholate diet [31,64]. The discrepancy between the current and earlier studies may be due to differences in the diet used. The diet used in our study mimics human diets, and the lack of atherosclerosis in APOE3 mice was consistent with human studies, showing that in comparison with APOE2 and APOE4, the APOE3 genotype is associated with the lowest risk of cardiovascular disease. Interestingly, while atherosclerosis was not observed in the APOE4 mice during the course of this 16-week diet study, APOE4 genotype is associated with increased risk of cardiovascular disease in humans [7,8]. However, despite the lack of atherosclerosis in the APOE4 mice, increased inflammation was observed in these animals, thus indicating that the APOE4 mice were prone to developing atherosclerotic lesions with prolonged Western diet feeding. The APOE2 mice also exhibited increased inflammation in addition to hyperlipidemia and atherosclerosis, thus indicating that the elevated inflammation augmented hyperlipidemia to accelerate atherosclerosis in these animals during the course of this study.
The mechanism underlying the increased inflammation in the aortas of APOE2 mice is different from that observed in APOE4 mice. Specifically, the increased inflammation in APOE2 mice was due primarily to hyperlipidemia affecting immune and vascular cells in these animals after Western diet feeding. In particular, elevated presence of classical monocyte-derived macrophages (cluster 13 cells) in the APOE2 mice is consistent with previous reports of hypercholesterolemia-induced monocytosis [65] and myelopoiesis in APOE2 mice [25]. The aortas of Western diet-fed APOE2 mice also exhibited higher numbers of smooth muscle cell-derived macrophage-like foam cells (cluster 22) and aortic fibroblasts with high expression levels of intracellular lipid accumulation genes (cluster 4). The lipid accumulation in these macrophage-like foam cells and lipofibroblasts resulted in a pro-inflammatory phenotype that caused a higher number of activated smooth muscle cells with proliferative/synthetic characteristics that promote atherosclerosis. Additionally, the aortas of Western diet-fed APOE2 mice also displayed a higher number of inflamed endothelial cells with elevated expression levels of adhesion molecules that facilitate leukocyte transmigration. The increased levels of adhesion molecules coincided with high expression of lipid uptake genes in the endothelial cells, thereby supporting the concept that lipid accumulation in endothelial cells also promotes vascular inflammation to accelerate atherosclerosis [66]. The increased lipid uptake by endothelial cells in the vessel wall of APOE2 mice is likely due to impaired liver clearance and plasma accumulation of triglyceride- and cholesterol-rich atherogenic lipoproteins. Interestingly, the aortas of Western diet-fed APOE2 mice also showed the presence of activated B-2 lymphocytes that promote atherosclerosis. However, despite their presence and indication of inflammation, the number of these B-2 cells in APOE2 mice was significantly less than that observed in APOE4 mice. The lower number of these B-2 cells in APOE2 mice is likely due to impaired lipid antigen presentation that requires avid apoE-LDL receptor interaction [67].
In contrast to the APOE2 mice, the elevated inflammation observed in APOE4 mice was not related to hyperlipidemia and aberrant lipid storage in immune and vascular cells. For example, Western diet-fed APOE4 mice displayed a similar number of classical monocyte-derived macrophages (cluster 13) as APOE3 mice, thus indicating that apoE4 expression did not promote monocytosis and myelopoiesis, a hallmark of hyperlipidemia-induced inflammatory response. Moreover, cluster 13 cells in APOE4 mice also exhibited lower levels of Plin2 expression compared to cells from APOE2 and APOE3 mice, thus further indicating that cluster 13 cells in APOE4 mice were not lipid-loaded. These results are in striking contrast to the APOE4 effects in microglia, where lipid accumulation and a lipogenic program were observed [68,69]. While the cell type-specific differences remained unresolved, APOE4 has been shown to reduce lipoprotein uptake in microglia but not in bone marrow-derived macrophages [68,70]. Regardless, despite the lack of lipid loading or an increase in cell number, cluster 13 macrophages in APOE4 mice also exhibited a pro-inflammatory phenotype with increased expression of endoplasmic reticulum- and oxidative-stress genes compared to that observed in cluster 13 cells from APOE3 mice. This observation is consistent with previous reports that showed oxidative stress-induced inflammatory response in apoE4-expressing myeloid cells [25]. Oxidative stress-induced inflammatory response in APOE4 mice was also evident by the minimal expression of Rorc gene with elevated Cd62L expression, and thus low levels of Th17 cells, in the T lymphocyte population [71]. These T lymphocyte characteristics were not observed in APOE2 and APOE3 mice. Interestingly, although the aortas in both Western diet-fed APOE2 and APOE4 mice exhibited an increased number of Cd8+ T lymphocytes compared to that observed in APOE3 mice, the increased number of Cd8+ cells in APOE2 mice cannot be attributed to oxidative stress but likely a result of hyperlipidemia [72]. Taken together, these results support the concept that apoE2 and apoE4 promote innate and adaptive immune responses via distinct mechanisms.
Analysis of fibroblasts and fibroblast-like cells in the aortas of Western diet-fed mice provided additional evidence that the various apoE isoforms activate these cells via distinct mechanisms. In particular, the data presented in Figure 7 reveals that APOE2 activates adventitial fibroblasts and their transition to lipofibroblasts with increased inflammation via elevated intracellular lipid storage as a consequence of hyperlipidemia. In contrast, APOE4 does not cause lipid accumulation in aortic fibroblasts but elevates fibroblasts inflammation that favors fibrosis and negative remodeling, which also influences smooth muscle cell inflammation and differentiation. In contrast, APOE3 activates fibroblasts with increased Fap expression without the corresponding increase in S100a4, thus providing an activated myofibroblast phenotype that favors atheroprotection [73,74]. These differences by which each apoE isoform activates vascular fibroblasts underscore additional mechanisms of how specific apoE isoform may influence atherosclerosis in response to the Western diet.
The smooth muscle cell subsets in the aortas were also influenced by expression of specific apoE isoforms. Regardless of whether the smooth muscle cells were derived from the aortic arch, which were neural crest-derived, or the descending aorta, which originated from the somites formed from the paraxial mesoderm, the predominant smooth muscle cell subsets in Western diet-fed APOE3 mice were the quiescent contractile phenotype (clusters 0, 2, 6) with a population of de-differentiated smooth muscle cells with enhanced migratory characteristics (cluster 1). In contrast, these smooth muscle cells were less prominent in APOE2 mice and were replaced with cells in clusters 3, 7 and 10, displaying high expression levels of genes associated with a proliferative/synthetic phenotype. The smooth muscle cell composition in the aortas of APOE4 mice differed from that in APOE2 and APOE3 mice with enrichment of clusters 1 and 5 cells, which highly expressed genes involved with DNA synthesis, oxidative stress (heme metabolism), and inflammatory response. The differences in smooth muscle cell repertoire in these animals further illustrated distinct mechanisms by which apoE2, apoE3, and apoE4 modulate vascular remodeling and sensitivity to atherosclerosis in response to Western diet feeding. Nevertheless, this study with scRNA-seq analysis did not shed light on whether the effects on smooth muscle cell subset composition were due to apoE expressed intrinsically in the smooth muscle cells or whether the effects were influenced by circulating apoE or indirectly through apoE isoform influence on cytokine/chemokine secretion by other cells in the vasculature. In this regard, earlier in vitro studies have shown that exogenous apoE2 was less effective than apoE3, and apoE4 was ineffective in inhibiting smooth muscle cell proliferation [75]. Thus, the differences in smooth muscle cell subsets in APOE2, APOE3, and APOE4 mice may be due at least in part to extracellular apoE in the plasma circulation. Whether apoE isoforms expressed endogenously in smooth muscle cells also influence cell phenotype characteristics remains to be determined.

4. Materials and Methods

4.1. Animals and Diets

Gene replacement mice, in which the endogenous mouse ApoE gene was replaced with the human APOE2, APOE3, or APOE4 gene at the same locus, were obtained from the Maeda Laboratory at the University of North Carolina, USA [31,64] and backcrossed to C57BL/6J background. The mice were maintained on a 12 h light/dark cycle in our institutional pathogen-free animal care facility with free access to normal chow diet (Purina PicoLab Rodent Irradiated Diet 5053; Cincinnati Lab Supply, Cincinnati, OH, USA) and water. Age-matched (12-week-old) male mice were fed a Western diet containing 42% fat and 0.2% cholesterol (TD88137; Teklad Custom Diets, Madison, WI, USA) for 16 weeks. Blood and tissue samples were collected at the end of the experimental period for plasma lipid measurements, atherosclerosis assessment, and single-cell RNA sequencing analysis. All animal experiments were conducted in compliance with the U.S. National Institutes of Health guidelines) and were reviewed and approved by the University of Cincinnati Institutional Animal Care and Use Committee of the University of Cincinnati, in accordance with National Institutes of Health guidelines.

4.2. Plasma Lipid Measurement

Blood samples were collected from the tail vein after an overnight fast into EDTA-containing tubes. Plasma was prepared by centrifugation at 1500× g for 10 min at 4 °C. Plasma cholesterol and triglyceride levels were quantified by Infinity colorimetric assay kits (TR22421 and TR13421, Thermo Fisher Scientific, Cincinnati, OH, USA).

4.3. Atherosclerotic Lesion Analysis

Atherosclerosis was assessed in the whole aorta by en face analysis and cryosections of the aortic roots [76]. Briefly, mice were anesthetized and then perfused with phosphate-buffered saline containing 10% formalin prior to harvesting the heart and the entire aorta to the ileac bifurcation. The whole aortas were opened longitudinally from the bifurcation of the subclavian and carotid arteries to the iliac bifurcation and then stained with Oil Red O for 30 min for en face analysis. For analysis of the aortic roots, the hearts were fixed in 4% paraformaldehyde and embedded in Scigen Tissue-PlusTM OCT compound (Thermo Fisher Scientific, Cincinnati, OH, USA). Cryosections of 5 μm thickness were performed, starting at the valve nubs and the appearance of the coronary artery branch throughout the aortic sinus until the valve separates at the base of the heart. The cryosections were mounted on microscope slides and then stained with Oil Red O and counterstained with hematoxylin. All images were taken using an Olympus BX61 microscope and were subsequently quantified using ImageJ software, version 1.52 (National Institutes of Health, Bethesda, MD, USA).

4.4. Aortic mRNA Expression Analysis

Gene expression in the aorta was analyzed by quantitative real-time PCR. RNA was isolated from the whole aorta using TRIzol reagent (Invitrogen, Carlsbad, CA, USA), followed by cDNA synthesis using the qScript cDNA Synthesis Kit (QuantaBio, Beverley, MA, USA). Quantitative real-time PCR was performed with a StepOnePlus Thermocycler using FastSYBR Green Master Mix (Applied Biosystems, Carlsbad, CA, USA). Sequence-specific primers are listed in Table 1. Expression levels of mRNA were normalized to β-actin using the ΔΔCT analysis method.

4.5. Single-Cell RNA Sequencing

Mice were anesthetized and then perfused with phosphate-buffered saline. The whole aorta from the aortic arch to the ileac bifurcation was isolated and trimmed of excess fat tissues surrounding the aorta. The entire aorta was minced into small pieces in phosphate-buffered saline containing 2% BSA and then incubated for 1 h at 37 °C with gentle shaking in the same buffer containing 450 U/mL collagen-1, 120 U/mL collagen XI, 60 U/mL DNase 1, 60 U/mL hyaluronidase, 1.5 mM CaCl2, and 1.25 mg/mL elastase. The resulting cell suspension was filtered through 70 μm filters and washed several times to obtain single-cell suspension. Quality control was assessed by live/dead cell staining with trypan blue staining. Cell suspensions obtained from six APOE2, five APOE3, and seven APOE4 mice after 16 weeks of Western diet feeding were pooled according to their genotype for single-cell RNA-seq analysis. Approximately 10,000 cells recovered from each pooled cell suspension were loaded onto a 10× Genomics Chromium instrument (Pleasanton, CA, USA) to generate single-cell gel beads in emulsion and preparation of a bar-coded cDNA library for single-cell RNA-sequencing. Quality of the cDNA library was confirmed using an Agilent Bioanalyzer (Agilent Technologies, Santa Clara, CA, USA). Full-length sequencing was performed on two paired-end 75 bp flow cells using NovaSeq S4 platform (Illumina, San Diego, CA, USA) with an overall sequencing depth of approximately 400 million read pairs per sample.

4.6. Single-Cell RNA Sequencing Data Analysis

The 10× genomic single cell transcriptome sequencing data were processed using the Cell Ranger version 841 Single Cell software available from 10× Genomics (Pleasanton, CA, USA). The raw data was de-multiplexed, aligned to the Mus musculus (mm10) reference genome, and quantified using the Cell Ranger processing pipelines [77]. Further quality control filtering, normalization, integration and clustering were performed using the Seurat package (version 5.4.0; https://www.rdocumentation.org/) [78]. Quality control metrics for the overall scRNA-seq analysis, including nFeature, nCount, and percent mitochondrial reads are shown in Supplemental Figure (Figure S1). Cells with low count depth, few detected genes and high fraction of mitochondrial gene counts were removed. The data was normalized using regularized negative binomial regression as implemented in the latest version (version 2) of sctransform [79], integrated using the Seurat integration protocol based on anchoring and canonical correlation [78,80], clustered using the Louvain–Jaccard graph community detection algorithm [81,82], and visualized in two dimensions by UMAP dimensionality reduction [83]. Cluster-specific gene expression analysis was performed by aggregating regularized counts for each cluster and then performing single-tailed Limma-voom analysis [84] for up-regulated genes in the cluster of interest as compared to all other clusters. The pathway analysis of genes up-regulated in each cluster was performed by Gene Set Enrichment Analysis (GSEA) [85] as implemented in the R package fgsea (version 4.6, https://bioconductor.posit.co/packages/3.23/bioc/html/fgsea.html (accessed on 1 June 2026)) [86]. Pathway libraries used in GSEA included Kyoto Encyclopedia of Genes and Genomes (KEGG) pathways [87,88] and hallmark gene sets in MSigDb [89]. Additional analyses and visualizations were performed using ShinyCell (https://gihub.com/the-ouyang-lab/ShinyCell2 (accessed on 1 June 2026)) [90].

4.7. Statistics

All data were expressed as mean ± SD. Statistical analysis was performed using GraphPad Prism version 5.0 software (San Diego, CA, USA). All data passed the Shapiro–Wilk test for normality and were analyzed by one-way ANOVA with Student–Newman–Keuls post hoc analysis for multiple group comparisons. Differences at p < 0.05 were considered statistically significant.

5. Conclusions

In summary, while apoE-deficient mice has been shown to display an altered cellular landscape of the vessel wall with elevation of immune cells and progenitor cell-like smooth muscle cells compared to wild-type mice [91], this study documented for the first time that apoE also modulates vascular cell landscape in an isoform-specific manner. In particular, the data revealed that in comparison to apoE3 expression, apoE2 expression exacerbates diet-induced inflammation of infiltrating leukocytes, vascular endothelium, fibroblasts, and smooth muscle cells via mechanisms related to intracellular lipid accumulation, whereas apoE4 expression promotes vascular inflammation primarily through elevated oxidative and endoplasmic reticulum stress. The significance of this study is that the APOE genotype should be considered in designing intervention strategies to reduce the progression of atherosclerosis in cardiovascular disease.

Limitations of the Study

It is important to note that there are several limitations of this study. Firstly, the entire aorta was used to characterize cell composition in the vessel wall in response to diet-induced atherosclerosis. Since atherosclerotic lesions in rodent models were typically observed only in the aortic roots with fatty lesions present in the thoracic aorta, the cellular repertoire within the atherosclerotic lesion may be different. Moreover, human atherosclerotic lesions can be present in several different arteries including coronary arteries, cerebral arteries, and renal arteries; future studies comparing cell composition and different cellular subsets in human atherosclerosis in various vascular regions may be worthwhile. Secondly, only mRNA expression level was assessed in the whole aorta and in scRNA-seq experiments. Future studies examining protein expression levels are necessary to validate these results. Finally, only male APOE gene replacement mice were examined in this study. In view of a recent study showing that APOE genetic variation impacts hepatic metabolism and mitochondrial activities in a sex-specific manner [92], additional studies with female mice may dissect potential sex-specific differences in the apoE isoform effect on vascular cell composition in the vessel wall.

Supplementary Materials

The following supporting information can be downloaded at: https://www.mdpi.com/article/10.3390/ijms27125619/s1.

Author Contributions

Conceptualization, D.Y.H. and A.J.; methodology, J.A., A.H. and A.J.; validation, D.Y.H., J.A., A.H. and A.J.; formal analysis, D.Y.H., A.H., M.M. and A.J.; investigation, J.A., A.H. and A.J.; resources, D.Y.H.; data curation, D.Y.H., J.A., A.H., M.M. and A.J.; writing—original draft preparation, D.Y.H. and M.M.; writing—review and editing, —D.Y.H., J.A., A.H., M.M. and A.J.; visualization, A.H. and J.A.; supervision, D.Y.H.; project administration, D.Y.H.; funding acquisition, D.Y.H. All authors have read and agreed to the published version of the manuscript.

Funding

This research was funded by the National Heart and Blood Institute of the National Institutes of Health (USA), grant number RO1HL156954.

Institutional Review Board Statement

The animal study protocol was approved by the Institutional Review Board of the University of Cincinnati (protocol #23-07-20-01, Approval date 13 October 2023).

Informed Consent Statement

Not applicable.

Data Availability Statement

The data supporting this study are available in the article and are available from the corresponding author upon request. All single-cell RNA sequencing data have been deposited in the Gene Expression Ominbus (GSE314969) and are publicly available.

Acknowledgments

The authors acknowledge the University of Cincinnati Genomics, Epigenomics, and Sequencing Core Facility for performing the single-cell RNA sequencing analysis.

Conflicts of Interest

The authors declare no conflicts of interest.

Abbreviations

The following abbreviations are used in this manuscript:
ApoApolipoprotein
ACTA2Smooth muscle α-actin
BAFFRB cell-activating factor receptor
CD36Cluster of differentiation 36
CD45Cluster of differenetiation 45
ESAMEndothelial cell-selective adhesion molecule
FABP4Fatty acid binding protein 4
GPIHBP1Glycosylphosphatidylinositol anchored HDL binding protein 1
ICAM1/2Intercellular adhesion molecule ½
LDLLow density lipoprotein
LPLLipoprotein lipase
MAPMitogen-activated protein
MYH11Myosin heavy chain 11
PECAM1Platelet endothelial cell adhesion molecule 1
scRNA-seqSingle cell RNA-sequencing
SOX17SRY-box transcription factor
TAGLNTransgelin/SM22a
UMAPUniform manifold approximation and projection
VCAM1Vascular cell adhesion protein 1

References

  1. Mahley, R.W.; Weisgraber, K.H.; Huang, Y. Apolipoprotein E: Structure determines function, from atherosclerosis to Alzheimer’s disease to AIDS. J. Lipid Res. 2009, 50, S183–S188. [Google Scholar] [CrossRef] [PubMed]
  2. Blazejewska-Hyzorek, B.; Gromadzka, G.; Skowronska, M.; Czlonkowska, A. APOE ε2 allele is an independent risk factor for vulnerable carotid plaque in ischemic stroke patients. Neurol. Res. 2014, 36, 950–954. [Google Scholar] [CrossRef] [PubMed]
  3. Couderc, R.; Mahieux, F.; Bailleul, S.; Fenelon, G.; Mary, R.; Fermanian, J. Prevalence of apolipoprotein E phenotypes in ischemic cerebrovascular disease. A case-control study. Stroke 1993, 24, 661–664. [Google Scholar] [CrossRef] [PubMed]
  4. de Andrade, M.; Thandi, I.; Brown, S.; Gotto, A., Jr.; Patsch, W.; Boerwinkle, E. Relationship of the apolipoprotein E polymorphism with carotid artery atherosclerosis. Am. J. Hum. Genet. 1995, 56, 1379–1390. [Google Scholar] [PubMed]
  5. Kalix, B.; Meynet, M.C.; Garin, M.C.; James, R.W. The apolipoprotein epsilon2 allele and the severity of coronary artery disease in Type 2 diabetic patients. Diabet. Med. 2001, 18, 445–450. [Google Scholar] [CrossRef] [PubMed]
  6. Vaisi-Raygani, A.; Rahimi, Z.; Nomani, H.; Tavilani, H.; Pourmotabbed, T. The presence of apolipoprotein epsilon4 and epsilon2 alleles augments the risk of coronary artery disease in type 2 diabetic patients. Clin. Biochem. 2007, 40, 1150–1156. [Google Scholar] [CrossRef] [PubMed]
  7. Song, Y.; Stampfer, M.J.; Liu, S. Meta-analysis: Apolipoprotein E genotypes and risk for coronary heart disease. Ann. Intern. Med. 2004, 141, 137–147. [Google Scholar] [CrossRef] [PubMed]
  8. Lahoz, C.; Schaefer, E.J.; Cupples, L.A.; Wilson, P.W.F.; Levy, D.; Osgood, D.; Parpos, S.; Pedro-Botet, J.; Daly, J.A.; Ordovas, J.M. Apolipoprotein E genotype and cardiovascular disease in the Framingham Heart Study. Atherosclerosis 2001, 154, 529–537. [Google Scholar] [CrossRef] [PubMed]
  9. Strittmatter, W.J.; Roses, A.D. Apolipoprotein E and Alzheimer’s disease. Annu. Rev. Neurosci. 1996, 19, 53–77. [Google Scholar] [CrossRef]
  10. Suri, S.; Heise, V.; Trachtenberg, A.J.; Mackay, C.E. The forgotten APOE allele: A review of the evidence and suggested mechanisms for the protective effect of apoE ε2. Neurosci. Biobehav. Rev. 2013, 37, 2878–2886. [Google Scholar] [CrossRef] [PubMed]
  11. Genin, E.; Hannequin, D.; Wallon, D.; Sleegers, K.; Hiltunen, M.; Combarros, O.; Bullido, M.J.; Engelborghs, S.; De Deyn, P.; Berr, C.; et al. APOE and Alzheimer disease: A major gene with semi-dominant inheritance. Mol. Psychiatry 2011, 16, 903–907. [Google Scholar] [CrossRef] [PubMed]
  12. Farrer, L.A.; Cupples, L.A.; Haines, J.L.; Hyman, B.; Kukull, W.A.; Mayeux, R.; Myers, R.H.; Pericak-Vance, M.A.; Risch, N.; van Duijn, C.M. Effects of age, sex, and ethnicity on the association between apolipoprotein E genotype and Alzheimer disease. A meta-analysis. APOE and Alzheimer Disease. Meta Analysis. Consortium. JAMA 1997, 278, 1349–1356. [Google Scholar] [CrossRef]
  13. Rebeck, G.W.; Kindy, M.; LaDu, M.J. Apolipoprotein E and Alzheimer’s disease: The protective effects of apoE2 and E3. J. Alzheimers Dis. 2002, 4, 145–154. [Google Scholar] [CrossRef] [PubMed]
  14. Huang, Y.; Zhou, B.; Wernig, M.; Sudhof, T.C. ApoE2, apoE3, and apoE4 differentially stimulae APP transcription and Abeta secretion. Cell 2017, 168, 427–441.e21. [Google Scholar] [CrossRef] [PubMed]
  15. Huang, Y.-W.A.; Zhou, B.; Nabet, A.M.; Wernig, M.; Sudhof, T.C. Differential signaling mediated by apoE2, apoE3, and apoE4 in human neurons parallels Alzheimer’s disease risk. J. Neurosci. 2019, 39, 7408–7427. [Google Scholar] [CrossRef] [PubMed]
  16. Liu, C.-C.; Wang, N.; Chen, Y.; Inoue, Y.; Shue, F.; Ren, Y.; Wang, M.; Qiao, W.; Ikezu, T.C.; Li, Z.; et al. Cell-autonomous effects of APOE4 in restricting microglial response in brain homeostasis and Alzheimer’s disease. Nat. Immunol. 2023, 24, 1854–1866. [Google Scholar] [CrossRef] [PubMed]
  17. Alagarsamy, J.; Jaeschke, A.; Hui, D.Y. Apolipoprotein E in cardiometabolic and neurological health and diseases. Int. J. Mol. Sci. 2022, 23, 9892. [Google Scholar] [CrossRef] [PubMed]
  18. Pendse, A.A.; Arbones-Mainar, J.M.; Johnson, L.A.; Altenburg, M.K.; Maeda, N. Apolipoprotein E knock-out and knock-in mice: Atherosclerosis, metabolic syndrome, and beyond. J. Lipid Res. 2009, 50, S178–S182. [Google Scholar] [CrossRef] [PubMed]
  19. Mahley, R.W.; Huang, Y.; Rall, S.C. Pathogenesis of type III hyperlipoproteinemia (dysbetalipoproteinemia): Questions, quandaries, and paradoxes. J. Lipid Res. 1999, 40, 1933–1949. [Google Scholar] [CrossRef]
  20. Ulrich, V.; Konaniah, E.S.; Herz, J.; Gerard, R.D.; Jung, E.; Yuhanna, I.S.; Ahmed, M.; Hui, D.Y.; Mineo, C.; Shaul, P.W. Genetic variants of apoE and apoER2 differentially modulate endothelial function. Proc. Natl. Acad. Sci. USA 2014, 111, 13493–13498. [Google Scholar] [CrossRef] [PubMed]
  21. Zanotti, I.; Pedrelli, M.; Poti, F.; Stomeo, G.; Gomaraschi, M.; Calabresi, L.; Bernini, F. Macrophage, but not systemic, apolipoprotein E is necessary for macrophage reverse cholesterol transport in vivo. Arterioscler. Thromb. Vasc. Biol. 2011, 31, 74–80. [Google Scholar] [CrossRef] [PubMed]
  22. Murphy, A.J.; Akhtari, M.; Tolani, S.; Pagler, T.A.; Bijl, N.; Kuo, C.-L.; Wang, M.; Sanson, M.; Abramowicz, S.; Welch, C.; et al. ApoE regulates hematopoietic stem cell proliferation, monocytosis, and monocyte accumulation in atherosclerotic lesions in mice. J. Clin. Investig. 2011, 121, 4138–4149. [Google Scholar] [CrossRef] [PubMed]
  23. Linton, M.F.; Atkinson, J.B.; Fazio, S. Prevention of atherosclerosis in apolipoprotein E-deficient mice by bone marrow transplantation. Science 1995, 267, 1034–1037. [Google Scholar] [CrossRef] [PubMed]
  24. van Eck, M.; Herijgers, N.; Vidgeon-Hart, M.; Pearce, N.J.; Hoogerbrugge, P.M.; Groot, P.H.E.; Van Berkel, T.J.C. Accelerated atherosclerosis in C57BL/6 mice transplanted with apoE-deficient bone marrow. Atherosclerosis 2000, 150, 71–80. [Google Scholar] [CrossRef] [PubMed]
  25. Igel, E.; Haller, A.; Wolfkiel, P.R.; Orr-Asman, M.; Jaeschke, A.; Hui, D.Y. Distinct pro-inflammatory properties of myeloid cell-derived apolipoprotein E2 and E4 in atherosclerosis promotion. J. Biol. Chem. 2021, 297, 101106. [Google Scholar] [CrossRef] [PubMed]
  26. Cash, J.G.; Kuhel, D.G.; Basford, J.E.; Jaeschke, A.; Chatterjee, T.K.; Weintraub, N.L.; Hui, D.Y. Apolipoprotein E4 impairs macrophage efferocytosis and potentiates apoptosis by accelerating endoplasmic reticulum stress. J. Biol. Chem. 2012, 287, 27876–27884. [Google Scholar] [CrossRef] [PubMed]
  27. Majack, R.A.; Castle, C.K.; Goodman, L.V.; Weisgraber, K.H.; Mahley, R.W.; Shooter, E.M.; Gebicke-Haerter, P.J. Expression of apolipoprotein E by cultured vascular smooth muscle cells is controlled by growth state. J. Cell Biol. 1988, 107, 1207–1213. [Google Scholar] [CrossRef] [PubMed]
  28. Ishigami, M.; Swertfeger, D.K.; Granholm, N.A.; Hui, D.Y. Apolipoprotein E inhibits platelet-derived growth factor-induced vascular smooth muscle cell migration and proliferation by suppressing signal transduction and preventing cell entry to G1 phase. J. Biol. Chem. 1998, 273, 20156–20161. [Google Scholar] [CrossRef] [PubMed]
  29. Ishigami, M.; Swertfeger, D.K.; Hui, M.S.; Granholm, N.A.; Hui, D.Y. Apolipoprotein E inhibition of vascular smooth muscle cell proliferation but not the inhibition of migration is mediated through activation of inducible nitric oxide synthase. Arterioscler. Thromb. Vasc. Biol. 2000, 20, 1020–1026. [Google Scholar] [CrossRef] [PubMed]
  30. Sullivan, P.M.; Mezdour, H.; Quarfordt, S.H.; Maeda, N. Type III hyperlipoproteinemia and spontaneous atherosclerosis in mice resulting from gene replacement of mouse apoE with human apoE*2. J. Clin. Investig. 1998, 102, 130–135. [Google Scholar] [CrossRef] [PubMed]
  31. Knouff, C.; Hinsdale, M.E.; Mezdour, H.; Altenburg, M.K.; Watanabe, M.; Quarfordt, S.H.; Sullivan, P.M.; Maeda, N. ApoE structure determines VLDL clearance and atherosclerosis risk in mice. J. Clin. Investig. 1999, 103, 1579–1586. [Google Scholar] [CrossRef] [PubMed]
  32. Galkina, E.; Ley, K. Vascular adhesion molecules in atherosclerosis. Arterioscler. Thromb. Vasc. Biol. 2007, 27, 2292–2301. [Google Scholar] [CrossRef] [PubMed]
  33. Rong, J.X.; Shapiro, M.; Trogan, E.; Fisher, E.A. Transdifferentiation of mouse aortic smooth muscle cells to a macrophage-like state after cholesterol loading. Proc. Natl. Acad. Sci. USA 2003, 100, 13531–13536. [Google Scholar] [CrossRef] [PubMed]
  34. Bashore, A.C.; Chung, A.; Ibikunle, C.; Yan, H.; Xue, C.; Li, M.; Bauer, R.C.; Reilly, M.P. Single-cell multimodal profiling of atherosclerosis identifies CD200 as a cell surface lineage marker of vascular smooth muscle cells and their derived cells. Circulation 2024, 149, 1231–1233. [Google Scholar] [CrossRef] [PubMed]
  35. Wculek, S.K.; Heras-Murillo, I.; Mastrangelo, A.; Mananes, D.; Galan, M.; Miguel, V.; Curtabbi, A.; Barbas, C.; Chandel, N.S.; Enriquez, J.A.; et al. Oxidative phosphorylation selectively orchestrates tissue macrophage homeostasis. Immunity 2023, 56, 516–530.e9. [Google Scholar] [CrossRef] [PubMed]
  36. Liu, Y.; Xu, R.; Gu, H.; Zhang, E.; Qu, J.; Cao, W.; Huang, X.; Yan, H.; He, J.; Cai, Z. Metabolic reprogramming in macrophage responses. Biomark. Res. 2021, 9, 1. [Google Scholar] [CrossRef] [PubMed]
  37. Guo, X.; Li, B.; Wen, C.; Zhang, F.; Xiang, X.; Nie, L.; Chen, J.; Mao, L. TREM2 promotes cholesterol uptake and foam cell formation in atherosclerosis. Cell. Mol. Life Sci. 2023, 80, 137. [Google Scholar] [CrossRef] [PubMed]
  38. Bain, J.-H.; Yuan, C.-Z.; Gu, J.-X.; Lin, W.-F.; Xiong, J.-Q.; Tang, Z.-W.; Li, A.; Shao, Y.-F. TREM2 modulates macrophage pyroptosis and inflammatory responses to ameliorate aortic valve calcification. Int. Immunopharmacol. 2025, 149, 114161. [Google Scholar] [CrossRef] [PubMed]
  39. Patterson, M.T.; Firulyova, M.M.; Xu, Y.; Hillman, H.; Bishop, C.; Zhu, A.; Hickok, G.H.; Schrank, P.R.; Ronayne, C.E.; Caillot, Z.; et al. Trem2 promotes foamy macrophage lipid uptake and survival in atherosclerosis. Nat. Cardiovasc. Res. 2023, 2, 1015–1031. [Google Scholar] [CrossRef] [PubMed]
  40. Wang, X.; Jiang, M.; Bao, H.; Huang, R.; Chen, B.; Wu, C.; Wang, H.; Luo, Z.; Li, W. Exendin-4 prevents oxLDL-induced upregulation of TREM2 and attenuates foam cell formation and inflammation in macrophages. Biochem. Pharmacol. 2025, 242, 117306. [Google Scholar] [CrossRef] [PubMed]
  41. Perry, H.M.; Bender, T.P.; McNamara, C.A. B cell subsets in atherosclerosis. Front. Immunol. 2012, 3, 373. [Google Scholar] [CrossRef] [PubMed]
  42. Winkels, H.; Ehinger, E.; Vassallo, M.; Buscher, K.; Dinh, H.Q.; Kobiyama, K.; Hamers, A.A.J.; Cochain, C.; Vafadarnejad, E.; Saliba, A.-E.; et al. Atlas of the immune cell repertoire in mouse atherosclerosis defined by single-cell RNA-sequencing and mass cytometry. Circ. Res. 2018, 122, 1675–1688. [Google Scholar] [CrossRef] [PubMed]
  43. Muranski, P.; Restifo, N.P. Essentials of Th17 cell commitment and plasticity. Blood 2013, 121, 2402–2414. [Google Scholar] [CrossRef] [PubMed]
  44. Li, K.; Ching, D.; Luk, F.S.; Raffai, R.L. Apolipoprotein E enhances microRNA-146a in monocytes and macrophages to suppress nuclear factor-κB-driven inflammation and atherosclerosis. Circ. Res. 2015, 117, e1–e11. [Google Scholar] [CrossRef] [PubMed]
  45. Bonacina, F.; Coe, D.; Wang, G.; Longhi, M.P.; Baragetti, A.; Moregola, A.; Garlaschelli, K.; Uboldi, P.; Pellegatta, F.; Grigore, L.; et al. Myeloid apolipoprotein E controls dendritic cell antigen presentation and T cell activation. Nat. Commun. 2018, 9, 3083. [Google Scholar] [CrossRef] [PubMed]
  46. Kim, D.; Grath, A.; Lu, Y.W.; Chung, K.; Winkelman, M.; Schwarz, J.J.; Dai, G. Sox17 mediates adult arterial endothelial cell adaptation to hemodynamics. Biomaterials 2023, 293, 121946. [Google Scholar] [CrossRef] [PubMed]
  47. Gonzalez-Hernandez, S.; Gomez, M.J.; Sanchez-Cabo, F.; Mendez-Ferrer, S.; Munoz-Canoves, P.; Isern, J. Sox17 controls emergence and remodeling of nestin-expressing coronary vessels. Circ. Res. 2020, 127, e252–e270. [Google Scholar] [CrossRef] [PubMed]
  48. Kitagawa, K.; Matsumoto, M.; Sasaki, T.; Hashimoto, H.; Kuwabara, K.; Ohtsuki, T.; Hori, M. Involvement of ICAM-1 in the progression of atherosclerosis in ApoE-knockout mice. Atherosclerosis 2002, 160, 305–310. [Google Scholar] [CrossRef] [PubMed]
  49. Schenkel, A.R.; Mamdouh, Z.; Muller, W.A. Locomotion of monocytes on endothelium is a critical step during extravasation. Nat. Immunol. 2004, 5, 393–400. [Google Scholar] [CrossRef] [PubMed]
  50. Woodfin, A.; Voisin, M.-B.; Nourshargh, S. PECAM-1: A multi-functional molecule in inflammation and vascular biology. Arterioscler. Thromb. Vasc. Biol. 2007, 27, 2514–2523. [Google Scholar] [CrossRef] [PubMed]
  51. Ley, K.; Huo, Y. VCAM-1 is critical in atherosclerosis. J. Clin. Investig. 2001, 107, 1209–1210. [Google Scholar] [CrossRef] [PubMed]
  52. Muhl, L.; Genove, G.; Leptidis, S.; Liu, J.; He, L.; Mocci, G.; Sun, Y.; Gustafsson, S.; Buyandelger, B.; Chivukula, I.V.; et al. Single-cell analysis uncovers fibroblast heterogeneity and criteria for fibroblast and mural cell identification and discrimination. Nat. Commun. 2020, 11, 3953, Correction in Nat. Commun. 2020, 11, 4493. https://doi.org/10.1038/s41467-020-18511-8. [Google Scholar] [CrossRef] [PubMed]
  53. van Kuijk, K.; McCracken, I.R.; Tillie, R.J.H.A.; Asselberghs, S.E.J.; Kheder, D.A.; Muitjens, S.; Jin, H.; Taylor, R.S.; Schreur, R.W.; Kuppe, C.; et al. Human and murine fibroblast single-cell transcriptomics reveals fibroblast clusters are differentially affected by ageing and serum cholesterol. Cardiovasc. Res. 2023, 119, 1509–1523. [Google Scholar] [CrossRef] [PubMed]
  54. Wang, Z.; Wang, M.; Lu, Y.; Ji, Y.; Simal-Candara, J.; Xiao, F.; Liu, Y.; Zhang, L.; Battino, M.; Li, P.; et al. Single-cell transcriptomics reveals the difference of aortic atherosclerosis response to phytosterols and oxidation products of sterols. Mol. Nutr. Food Res. 2023, 67, 2200811. [Google Scholar] [CrossRef] [PubMed]
  55. Gauthier, V.; Kyriazi, M.; Nefla, M.; Pucino, V.; Raza, K.; Buckley, C.D.; Alsaleh, G. Fibroblast heterogeneity: Keystone of tissue homeostasis and pathology in inflammation and ageing. Front. Immunol. 2023, 14, 1137659. [Google Scholar] [CrossRef] [PubMed]
  56. Pan, H.; Reilly, M.P. A protective smooth muscle cell transition in atherosclerosis. Nat. Med. 2019, 25, 1194–1195. [Google Scholar] [CrossRef] [PubMed]
  57. Yap, C.; Mieremet, A.; de Vries, C.J.; Micha, D.; de Waard, V. Six shades of vascular smooth muscle cells illuminated by KLF4 (Kruppel-like factor 4). Arterioscler. Thromb. Vasc. Biol. 2021, 41, 2693–2707. [Google Scholar] [CrossRef] [PubMed]
  58. Shan, F.; Huang, Z.; Xiong, R.; Huang, Q.-Y.; Li, J. HIF1α induced upregulation of KLF4 promotes migration of human vascular smooth muscle cells under hypoxia. J. Cell. Physiol. 2020, 235, 141–150. [Google Scholar] [CrossRef] [PubMed]
  59. Neuville, P.; Geinoz, A.; Benzonana, G.; Redard, M.; Gabbiani, F.; Ropraz, P.; Gabbiani, G. Cellular retinol binding protein-1 is expressed by distinct subsets of rat arterial smooth muscle cell sin vitro and in vivo. Am. J. Pathol. 1997, 150, 509–521. [Google Scholar] [PubMed]
  60. Dobnikar, L.; Taylor, A.L.; Chappell, J.; Oldach, P.; Harman, J.L.; Oerton, E.; Dzierzak, E.; Bennett, M.R.; Spivakov, M.; Jorgensen, H.F. Disease-relevant transcriptional signatures identified in individual smooth muscle cells from healthy mouse vessels. Nat. Commun. 2018, 9, 4567, Correction in Nat. Commun. 2018, 9, 5401. https://doi.org/10.1038/s41467-018-07887-3. [Google Scholar] [CrossRef] [PubMed]
  61. Scheede-Bergdahl, C.; Bergdahl, A. Adaptation of mitochondrial expression and ATP production in dedifferentiating vascular smooth muscle cells. Can. J. Physiol. Pharmacol. 2017, 95, 1473–1479. [Google Scholar] [CrossRef] [PubMed]
  62. Yin, J.; Xia, W.; Wu, M.; Zhang, Y.; Huang, S.; Zhang, A.; Jia, Z. Inhibition of mitochondrial complex I activity attenuates neointimal hyperplasia by inhibiting smooth muscle cell proliferation and migration. Chem. Biol. Interact. 2019, 304, 73–82. [Google Scholar] [CrossRef] [PubMed]
  63. Mahley, R.W.; Angelin, B. Type III hyperlipoproteinemia: Recent insights into the genetic defect of familial dysbetalipoproteinemia. Adv. Intern. Med. 1984, 29, 385–411. [Google Scholar] [PubMed]
  64. Sullivan, P.M.; Mezdour, H.; Aratani, Y.; Knouff, C.; Najib, J.; Reddick, R.L.; Quarfordt, S.H.; Maeda, N. Targeted replacement of the mouse apolipoprotein E gene with the common human apoE3 allele enhances diet-induced hypercholesterolemia and atherosclerosis. J. Biol. Chem. 1997, 272, 17972–17980. [Google Scholar] [CrossRef] [PubMed]
  65. Swirski, F.K.; Libby, P.; Aikawa, E.; Alcaide, P.; Luscinskas, F.W.; Weissleder, R.; Pittet, M.J. Ly-6Chi monocytes dominate hypercholesterolemia-associated monocytosis and give rise to macrophages in atheromata. J. Clin. Investig. 2007, 117, 195–205. [Google Scholar] [CrossRef] [PubMed]
  66. Jaffe, I.Z.; Karumanchi, S.A. Lipid droplets in the endothelium: The missing link between metabolic syndrome and cardiovascular disease. J. Clin. Investig. 2024, 134, e176347. [Google Scholar] [CrossRef] [PubMed]
  67. Allan, L.L.; Hoefl, K.; Zheng, D.-J.; Chung, B.K.; Kozak, F.K.; Tan, R.; van den Elzen, P. Apolipoprotein-mediated lipid antigen presentation in B cells provides a pathway for innate help by NKT cells. Blood 2009, 114, 2411–2416. [Google Scholar] [CrossRef] [PubMed]
  68. Victor, M.B.; Leary, N.; Luna, X.; Meharena, H.S.; Scannail, A.N.; Bozzelli, P.L.; Samaan, G.; Murdock, M.H.; von Maydell, D.; Effenberger, A.H.; et al. Lipid accumulation induced by APOE4 impairs microglial surveillance of neuronal-network activity. Cell Stem Cell 2022, 29, 1197–1212.e8. [Google Scholar] [CrossRef] [PubMed]
  69. Chen, J.; Zhao, S.; Zhou, Y.; Wang, L.; Chen, Q.; Zheng, K. APOE4 reprograms microglial lipid metabolism in Alzheimer’s disease: Mechanisms and therapeutic implications. Biosci. Trends 2026, 19, 641–658. [Google Scholar] [CrossRef] [PubMed]
  70. Altenburg, M.; Johnson, L.; Wilder, J.; Maeda, N. Apolipoprotein E4 in macrophages enhances atherogenesis in a low density lipoprotein receptor-dependent manner. J. Biol. Chem. 2007, 282, 7817–7824. [Google Scholar] [CrossRef] [PubMed]
  71. Abimannan, T.; Peroumal, D.; Parida, J.R.; Bark, P.K.; Padhan, P.; Devadas, S. Oxidative sterss modulates the cytokine response of differentiated Th17 and Th1 cells. Free Radic. Biol. Med. 2016, 99, 352–363. [Google Scholar] [CrossRef] [PubMed]
  72. Muldoon, M.F.; Marsland, A.; Flory, J.D.; Rabin, B.S.; Whiteside, T.L.; Manuck, S.B. Immune system differences in men with hypo- or hypercholesterolemia. Clin. Immunol. Immunopathol. 1997, 84, 145–149. [Google Scholar] [CrossRef] [PubMed]
  73. Tillmanns, J.; Widera, C.; Habbaba, Y.; Paolo, G.; Kempf, T.; Wollert, K.C.; Bauersachs, J. Circulating concentrations of fibroblast activation protein α in apparently healthy individuals and patients with acute coronary syndrome as assessed by sandwich ELISA. Int. J. Cardiol. 2013, 168, 3926–3931. [Google Scholar] [CrossRef] [PubMed]
  74. Sieweke, J.-T.; Grosse, G.M.; Weissenborn, K.; Derda, A.A.; Biber, S.; Bauersachs, J.; Bovendiek, U.; Tillmanns, J. Circulating fibroblast activation protein α is reduced in acute ischemic stroke. Front. Cardiovasc. Med. 2022, 9, 1064157. [Google Scholar] [CrossRef] [PubMed]
  75. Zeleny, M.; Swertfeger, D.K.; Weisgraber, K.H.; Hui, D.Y. Distinct apolipoprotein E isoform preference for inhibition of smooth muscle cell migration and proliferation. Biochemistry 2002, 41, 11820–11823. [Google Scholar] [CrossRef] [PubMed]
  76. Turkson, V.; Haller, A.; Jaeschke, A.; Hui, D.Y. ApoE receptor-2 R952Q variant in macrophages elevates soluble LRP1 to potentiate hyperlipidemia and accelerate atherosclerosis in mice. Arterioscler. Thromb. Vasc. Biol. 2025, 45, 37–48. [Google Scholar] [CrossRef] [PubMed]
  77. Zheng, G.X.; Terry, J.M.; Belgrader, P.; Ryvkin, P.; Bent, Z.W.; Wilson, R.; Ziraldo, S.B.; Wheeler, T.D.; McDermott, G.P.; Zhu, J.; et al. Massively parallel digital transcriptional profiling of single cells. Nat. Commun. 2017, 8, 14049. [Google Scholar] [CrossRef] [PubMed]
  78. Hao, Y.; Hao, S.; Andersen-Nissen, E.; Mauck, W.M., 3rd; Zheng, S.; Butler, A.; Lee, M.J.; Wilk, A.J.; Darby, C.; Zager, M.; et al. Integrated analysis of multimodal single-cell data. Cell 2021, 184, 3573–3587e29. [Google Scholar] [CrossRef] [PubMed]
  79. Choudhary, S.; Satija, R. Comparison and evaluation of statistical error models for scRNA-seq. Genome Biol. 2022, 23, 27. [Google Scholar] [CrossRef] [PubMed]
  80. Stuart, T.; Butler, A.; Hoffman, P.; Hafemeister, C.; Papalexi, E.; Mauck, W.M., 3rd; Hao, Y.; Stoeckius, M.; Smibert, P.; Satija, R. Comprehensive Integration of Single-Cell Data. Cell 2019, 177, 1888–1902 e21. [Google Scholar] [CrossRef] [PubMed]
  81. Blondel, V.D.; Guillaume, J.-L.; Lambiotte, R.; Lefebvre, E. Fast unfolding of communities in large networks. J. Stat. Mech. 2008, P10008. [Google Scholar] [CrossRef]
  82. Levine, J.H.; Simonds, E.F.; Bendall, S.C.; Davis, K.L.; Amir, E.A.D.; Tadmor, M.D.; Litvin, O.; Fienberg, H.G.; Jager, A.; Zunder, E.R.; et al. Data-Driven Phenotypic Dissection of AML Reveals Progenitor-like Cells that Correlate with Prognosis. Cell 2015, 162, 184–197. [Google Scholar] [CrossRef] [PubMed]
  83. Becht, E.; McInnes, L.; Healy, J.; Dutertre, C.A.; Kwok, I.W.H.; Ng, L.G.; Ginhoux, F.; Newell, E.W. Dimensionality reduction for visualizing single-cell data using UMAP. Nat. Biotechnol. 2018, 37, 38–44. [Google Scholar] [CrossRef] [PubMed]
  84. Law, C.W.; Chen, Y.; Shi, W.; Smyth, G.K. voom: Precision weights unlock linear model analysis tools for RNA-seq read counts. Genome Biol. 2014, 15, R29. [Google Scholar] [CrossRef] [PubMed]
  85. Subramanian, A.; Tamayo, P.; Mootha, V.K.; Mukherjee, S.; Ebert, B.L.; Gillette, M.A.; Paulovich, A.; Pomeroy, S.L.; Golub, T.R.; Lander, E.S.; et al. Gene set enrichment analysis: A knowledge-based approach for interpreting genome-wide expression profiles. Proc. Natl. Acad. Sci. USA 2005, 102, 15545–15550. [Google Scholar] [CrossRef] [PubMed]
  86. Korotkevich, G.; Sukhov, V.; Budin, N.; Shpak, B.; Artyomov, M.N.; Sergushichev, A. Fast gene set enrichment analysis. bioRxiv 2021, 060012. [Google Scholar] [CrossRef]
  87. Kanehisa, M.; Furumichi, M.; Tanabe, M.; Sato, Y.; Morishima, K. KEGG: New perspectives on genomes, pathways, diseases and drugs. Nucleic Acids Res. 2017, 45, D353–D361. [Google Scholar] [CrossRef] [PubMed]
  88. Mitrea, C.; Taghavi, Z.; Bokanizad, B.; Hanoudi, S.; Tagett, R.; Donato, M.; Voichita, C.; Draghici, S. Methods and approaches in the topology-based analysis of biological pathways. Front. Physiol. 2013, 4, 278. [Google Scholar] [CrossRef] [PubMed]
  89. Liberzon, A.; Birger, C.; Thorvaldsdottir, H.; Ghandi, M.; Mesirov, J.P.; Tamayo, P. The Molecular Signatures Database (MSigDB) hallmark gene set collection. Cell Syst. 2015, 1, 417–425. [Google Scholar] [CrossRef] [PubMed]
  90. Ouyang, J.F.; Kamaraj, U.S.; Cao, E.Y.; Rackham, O.J.L. ShinyCell: Simple and sharable visualization of single-cell gene expression data. Bioinformatics 2021, 37, 3374–3376. [Google Scholar] [CrossRef] [PubMed]
  91. Gu, W.; Ni, Z.; Tan, Y.-Q.; Deng, J.; Zhang, S.-J.; Lv, Z.-C.; Wang, X.-J.; Chen, T.; Zhang, Z.; Hu, Y.; et al. Adventitial cell atlas of wt (wild type) and apoE (apolipoprotien E)-deficient mice defined by single-cell RNA sequencing. Arterioscler. Thromb. Vasc. Biol. 2019, 39, 1055–1071. [Google Scholar] [CrossRef] [PubMed]
  92. Lysaker, C.R.; Johnson, C.N.; Csikos, V.; Franczak, E.; Tetlow, A.L.; Benson, M.; Thyfault, J.P.; Geiger, P.C.; Morris, J.K.; Wilkins, H.M. APOE4 drives widespread changes to the hepatic proteome and alters metabolic function. iScience 2026, 29, 115035. [Google Scholar] [CrossRef] [PubMed]
Figure 1. ApoE isoform-specific modulation of plasma lipids and atherosclerosis. Human APOE2, APOE3, and APOE4 gene replacement mice (n = 7 per group) were fed Western diet for 26 weeks. (A) Plasma cholesterol and triglyceride levels were measured from fasted mice. (B) Representative images and quantification of Oil Red O-stained atherosclerotic lesions in the whole aorta. (C) Representative images and quantification of lesion sizes in the aortic roots. The scale bars represent 500 µm. All plasma lipids and morphometric data passed the Shapiro–Wilk test for normality and were analyzed by one-way ANOVA with Student–Newman–Keuls post hoc analysis with p values as shown.
Ijms 27 05619 g001
Figure 2. ApoE isoform-specific effects on vascular gene expression. Total RNA was prepared from the whole aorta of Western diet-fed APOE2 (n = 8), APOE3 (n = 6), and APOE4 (n = 8) mice for quantitative RT-PCR to analyze expression of (A) Cd45, (B) Cd68, (C) Ly6c, (D) Emr1, (E) Pecam1, (F) Vcam1, (G) Acta2, (H) Myh11, and (I) Tgln. The data were evaluated by one-way ANOVA with Student–Newman–Keuls post hoc analysis and are presented as mean ± SD. Groups that are statistically different are shown with p values as indicated.
Ijms 27 05619 g002
Figure 3. ApoE isoform-specific effects on vascular cell composition. Single cells were isolated from the whole aortas of Western diet-fed APOE2, APOE3, and APOE4 mice. Cells from each genotype were pooled and subjected to single-cell RNA-seq analysis. (A) Uniform Manifold Approximation and Projection (UMAP) plots of cell-specific marker genes, revealing 25 different cell types and subsets identified in (B). (C) Bar graph showing the number of cells in each cell population of APOE2, APOE3, and APOE4 mice. (D) Bar graph showing the percentage of all leukocytes (Ptprc+), including Lyz2+ macrophages, Cd3e+ T lymphocytes, and Cd19+ lymphocytes in the aortas of APOE2, APOE3, and APOE4 mice. (E) Bar graph showing the percentage of smooth muscle cells (Myh11Hi), fibroblasts (Pdgfa+), endothelial cells (Cdh5+), and pericytes (Wif1Hi) in the aortas of APOE2, APOE3, and APOE4 mice.
Ijms 27 05619 g003
Figure 4. ApoE isoform-specific effects on macrophage subsets in aorta. (A) Violin plots with data points showing marker genes used to annotate various macrophage subtypes. (B) Hallmark Pathway analysis and (C) Kegg Pathway analysis of cluster 13 and cluster 22 macrophage subsets. The intensity of the color gradient depicts prevalence of activated genes in each pathway. (D) ApoE isoform effects on expression of specific genes in cluster 13 and cluster 22 cells in the aortas of Western diet-fed APOE2, APOE3, and APOE4 mice.
Ijms 27 05619 g004
Figure 5. ApoE isoform-specific effects on lymphocyte composition in the aorta. Violin plots with data points showing apoE isoform-specific effects on expression of marker genes used to identify cluster 18 cells as B lymphocytes (A) and cluster 19 as T lymphocytes (B) in the aortas of APOE2, APOE3, and APOE4 mice. High expression genes in each cluster were profiled and analyzed by Hallmark and Kegg Pathway analyses.
Ijms 27 05619 g005
Figure 6. ApoE isoform-specific effects on aortic endothelial cells. Single-cell RNA-seq analysis revealed cluster 21 as endothelial cells. Hallmark and Kegg Pathway analyses revealed high expression of cell activation and inflammatory genes. The endothelial cell activation genes (Sox17, Icam1, Icam2, Esam, Pecam1, and Vcam1) and intracellular lipid uptake and processing genes (Gpihbp1, Cd36, Lpl, and Fabp4) were expressed in an apoE isoform-dependent manner.
Ijms 27 05619 g006
Figure 7. ApoE isoform-specific influence on aortic fibroblasts subsets and gene expression. (A) Expression of gene markers for fibroblasts, fibroblast-like cells, and smooth muscle cells in all 25 aortic cell clusters. The clusters identified as fibroblasts are boxed. (B) Expression of fibroblasts genes in the five fibroblasts subsets. (C) Expression of fibroblasts and fibroblast-related genes in the aortas of Western diet-fed APOE2, APOE3, and APOE4 mice. (D) Bar graph showing the percentage of total aortic cells in fibroblasts and fibroblast-like cell clusters in APOE2, APOE3, and APOE4 mice. (E) Bar graph showing the percentage of various fibroblasts subsets in APOE2, APOE3, and APOE4 mice. (F) Expression levels of selected fibroblast gene markers in cluster 4 cells from APOE2, APOE3, and APOE4 mice. (G) Expression levels of selected fibroblast gene markers in cluster 8 cells from APOE2, APOE3, and APOE4 mice.
Ijms 27 05619 g007
Figure 8. ApoE isoform-specific effects on aortic smooth muscle cells. (A) Expression profile of smooth muscle cell gene markers in 12 different smooth muscle cell subsets. (B) Expression profile of gene markers for aortic arch (AA) and descending thoracic aorta (DT) smooth muscle cells. (C) apoE isoform-specific effects on smooth muscle cell distribution among the 12 smooth muscle cell subsets. (D) ApoE isoform-specific effects on smooth muscle cell subset composition. (E) Hallmark Pathway analysis of gene expression in the five cell clusters displaying apoE isoform-specific differences. Intensity of the color gradients indicates prevalence of activated genes in each pathway.
Ijms 27 05619 g008
Table 1. Primer sequences used for PCR analysis.
NameForward PrimerReverse Primer
β-actinACGGCCAGGTCATCACTATTGCAAGAAGGAAGGCTGGAAAAGA
Cd45GAGCATTCCACGGGTATTCAGACACGGTTATAATCATAGGGAAGAATGT
Cd68TTTCTCCAGCTGTTCACCTTGACCCGAAGTGTCCCTTGTCA
Ly6cTGCTATGGAGTGCCAATTGAGAGAGCAATGCAGAATCCATCAGA
Emr1 (F4/80)TGTCTGACAATTGGGATCTGCCCTATACGTTCCGAGAGTGTTGTGGCA
Pecam1TGCGGTGGTTGTCATTGGTGTTTGGCCTTGGCTTTCC
Vcam1ATCTCCCCTGAATACAAAACGATTGCCCGTAGTGCTGCAAGTG
Acta2 (SM-α-actin)TCCCTGGAGAAGAGCTACGAACTAAGCGTTCGTTTCCAATGGT
Myh11TTCGCCCAAGTGACTTTTTTAGTGGGTGCAAATAAGTGTGATTGC
Tagln (SM22a)CACAAACGACCAAGCCTTCTCTCGGCTCATGCCGTAGGA
Disclaimer/Publisher’s Note: The statements, opinions and data contained in all publications are solely those of the individual author(s) and contributor(s) and not of MDPI and/or the editor(s). MDPI and/or the editor(s) disclaim responsibility for any injury to people or property resulting from any ideas, methods, instructions or products referred to in the content.