Article

Optimal Reference Genes for Gene Expression Analysis of Overmating Stress-Induced Aging and Natural Aging in Male Macrobrachium rosenbergii

1
Agriculture Ministry Key Laboratory of Healthy Freshwater Aquaculture, Key Laboratory of Fish Health and Nutrition of Zhejiang Province, Zhejiang Institute of Freshwater Fisheries, Huzhou 313001, China
2
School of Marine Science, Ningbo University, Ningbo 315211, China
3
Hunan Fisheries Science Institute, Changsha 410153, China
4
College of Life Science and Agri-forestry, Southwest University of Science and Technology, Mianyang 621010, China
*
Authors to whom correspondence should be addressed.
Int. J. Mol. Sci. 2025, 26(8), 3465; https://doi.org/10.3390/ijms26083465
Submission received: 23 February 2025 / Revised: 22 March 2025 / Accepted: 5 April 2025 / Published: 8 April 2025
(This article belongs to the Section Molecular Genetics and Genomics)

Abstract

Functional gene expression is closely linked to an organism’s physiology and can be quantified using Real-Time Quantitative Reverse Transcription PCR (RT-qPCR). However, the stability of reference gene expression is not absolute, which may impact the accuracy of RT-qPCR results. In this study, we evaluated the suitability of nine genes including receptor for activated protein kinase c1 (rack1), ribosomal protein L6 (rpl6), ribosomal protein L9 (rpl9), ribosomal protein S2 (rps2), ribosomal protein S18 (rps18), ribosomal protein lateral stalk subunit P0 (rplp0), eukaryotic translation elongation factor 1β (eef1b), eukaryotic translation initiation factor 4a (eif4a), eukaryotic translation initiation factor 5a (eif5a) analyzed from RNA sequencing (RNA-Seq) data in addition to three genes including eukaryotic elongation factor 1α (eef1a), β-actin (actb), and glyceraldehyde 3-phosphate dehydrogenase (gapdh) selected from the literature to obtain the best internal controls in the RT-qPCR analysis of M. rosenbergii under overmating stress and natural aging. RefFinder was used to comprehensively evaluate the stability of the candidate reference genes. The initial results showed that three genes (eif5a, rps18, and rplp0) from the RNA-Seq data had relatively stable expression levels, which were more stable than those of the three commonly used reference genes. Eif5a and rps18 were the best combination for the RT-qPCR analysis of M. rosenbergii under overmating stress and aging. Further analysis indicated that eif5a might be the best reference gene for the study of M. rosenbergii.

1. Introduction

In response to varying conditions and stimuli, the expression and regulation of functional genes in the tissues or cells of organisms exhibit significant variation [1,2]. This variation primarily involves the mechanisms of transcriptional and translational regulation [3,4]. Developing antibodies to detect proteins can be expensive, whereas measuring changes in transcript levels is more cost-effective and straightforward. As a result, transcript level analysis has become widely adopted [2,5]. Quantitative real-time PCR (qPCR) technology is a popular method for detecting gene transcription levels in various samples [1]. However, when comparing different samples, it is essential to standardize the transcript levels of the target genes [6,7]. In this context, the use of stably expressed reference genes as internal controls is crucial [8]. These reference genes, commonly known as housekeeping genes, include β-actin (actb) [9,10], eukaryotic elongation factor 1-α (eef1a) [7], and glyceraldehyde-3-phosphate dehydrogenase (gapdh) [11], amongst others. Nevertheless, it is important to note that no reference gene remains stable under all conditions, and their expression can vary depending on the tissue type, developmental stages, and experimental conditions [7,12]. Therefore, identifying the most stable reference genes for specific experimental conditions is essential.
Several reference genes have been screened and identified in various aquatic species, such as Danio rerio [13], Carassius auratus, Cyprinus carpio [14], Xenopus laevis [15], Penaeus vannabinicus [16], and Macrobrachium nipponense [7]. M. rosenbergii, freshwater shrimps with considerable economic value, is known for the significant growth advantages of the male individuals [17]. Research on M. rosenbergii spans multiple domains, including reproduction, nutrition, sex control, and disease [17,18,19,20]. In addition to stressors such as fighting, hypoxia, poor water quality, and bacterial and viral infections, male M. rosenbergii also experience senescence during normal breeding cycles. These aging males, nearing the end of their life span, exhibit a darkened body coloration, a red tail fan, reduced feeding, and slow movement. In practical breeding operations, the female-to-male ratio in the mating groups is typically greater for males at 3:1 [21,22,23]. Consequently, male attrition is often much higher than that of females after multiple breeding cycles, leading to an increased mating burden on the surviving males. Overmated males undergo noticeable changes, including a color shift from blue to orange, and their tails may even turn orange-red. While a few may survive for a short period after ceasing mating, most, resembling aged individuals, succumb soon thereafter. As mentioned above, compared to the normal male shrimp, these dying males have a lot in common. Therefore, this overmating behavior may lead to premature male senescence. Further study of the molecular regulation mechanism requires the detection of the gene transcription level. Generally, eef1a, actb, and gapdh are used as the reference genes in M. rosenbergii [11]. Nevertheless, the suitability of the reference genes can be affected by experimental conditions [7,12]. Because of this, it is essential to identify and validate the most stable internal reference genes across the three distinct physiological conditions in male M. rosenbergii.
In this study, four tissues and 36 transcriptome datasets from three types of male M. rosenbergii were used to screen candidate reference genes. Nine candidate reference genes were used (including receptor for activated protein kinase c1 (rack1), ribosomal protein L6 (rpl6), ribosomal protein L9 (rpl9), ribosomal protein S2 (rps2), ribosomal protein S18 (rps18), ribosomal protein lateral stalk subunit P0 (rplp0), eukaryotic translation elongation factor 1β (eef1b), eukaryotic translation initiation factor 4a (eif4a), eukaryotic translation initiation factor 5a (eif5a), and three reported reference genes (eef1a, gapdh, and actb). The Cq (Quantitative Cycle) values were analyzed using RefFinder [8,24], and the stability of the reference genes was assessed using geNorm [25], Normfinder [26], BestKeeper [27], and the comparative Δ-Ct method [28]. The results showed that the candidate genes were more stable than the commonly used reference genes and could provide better reference genes for the qRT-PCR standardized analysis of M. rosenbergii under mating stress.

2. Results

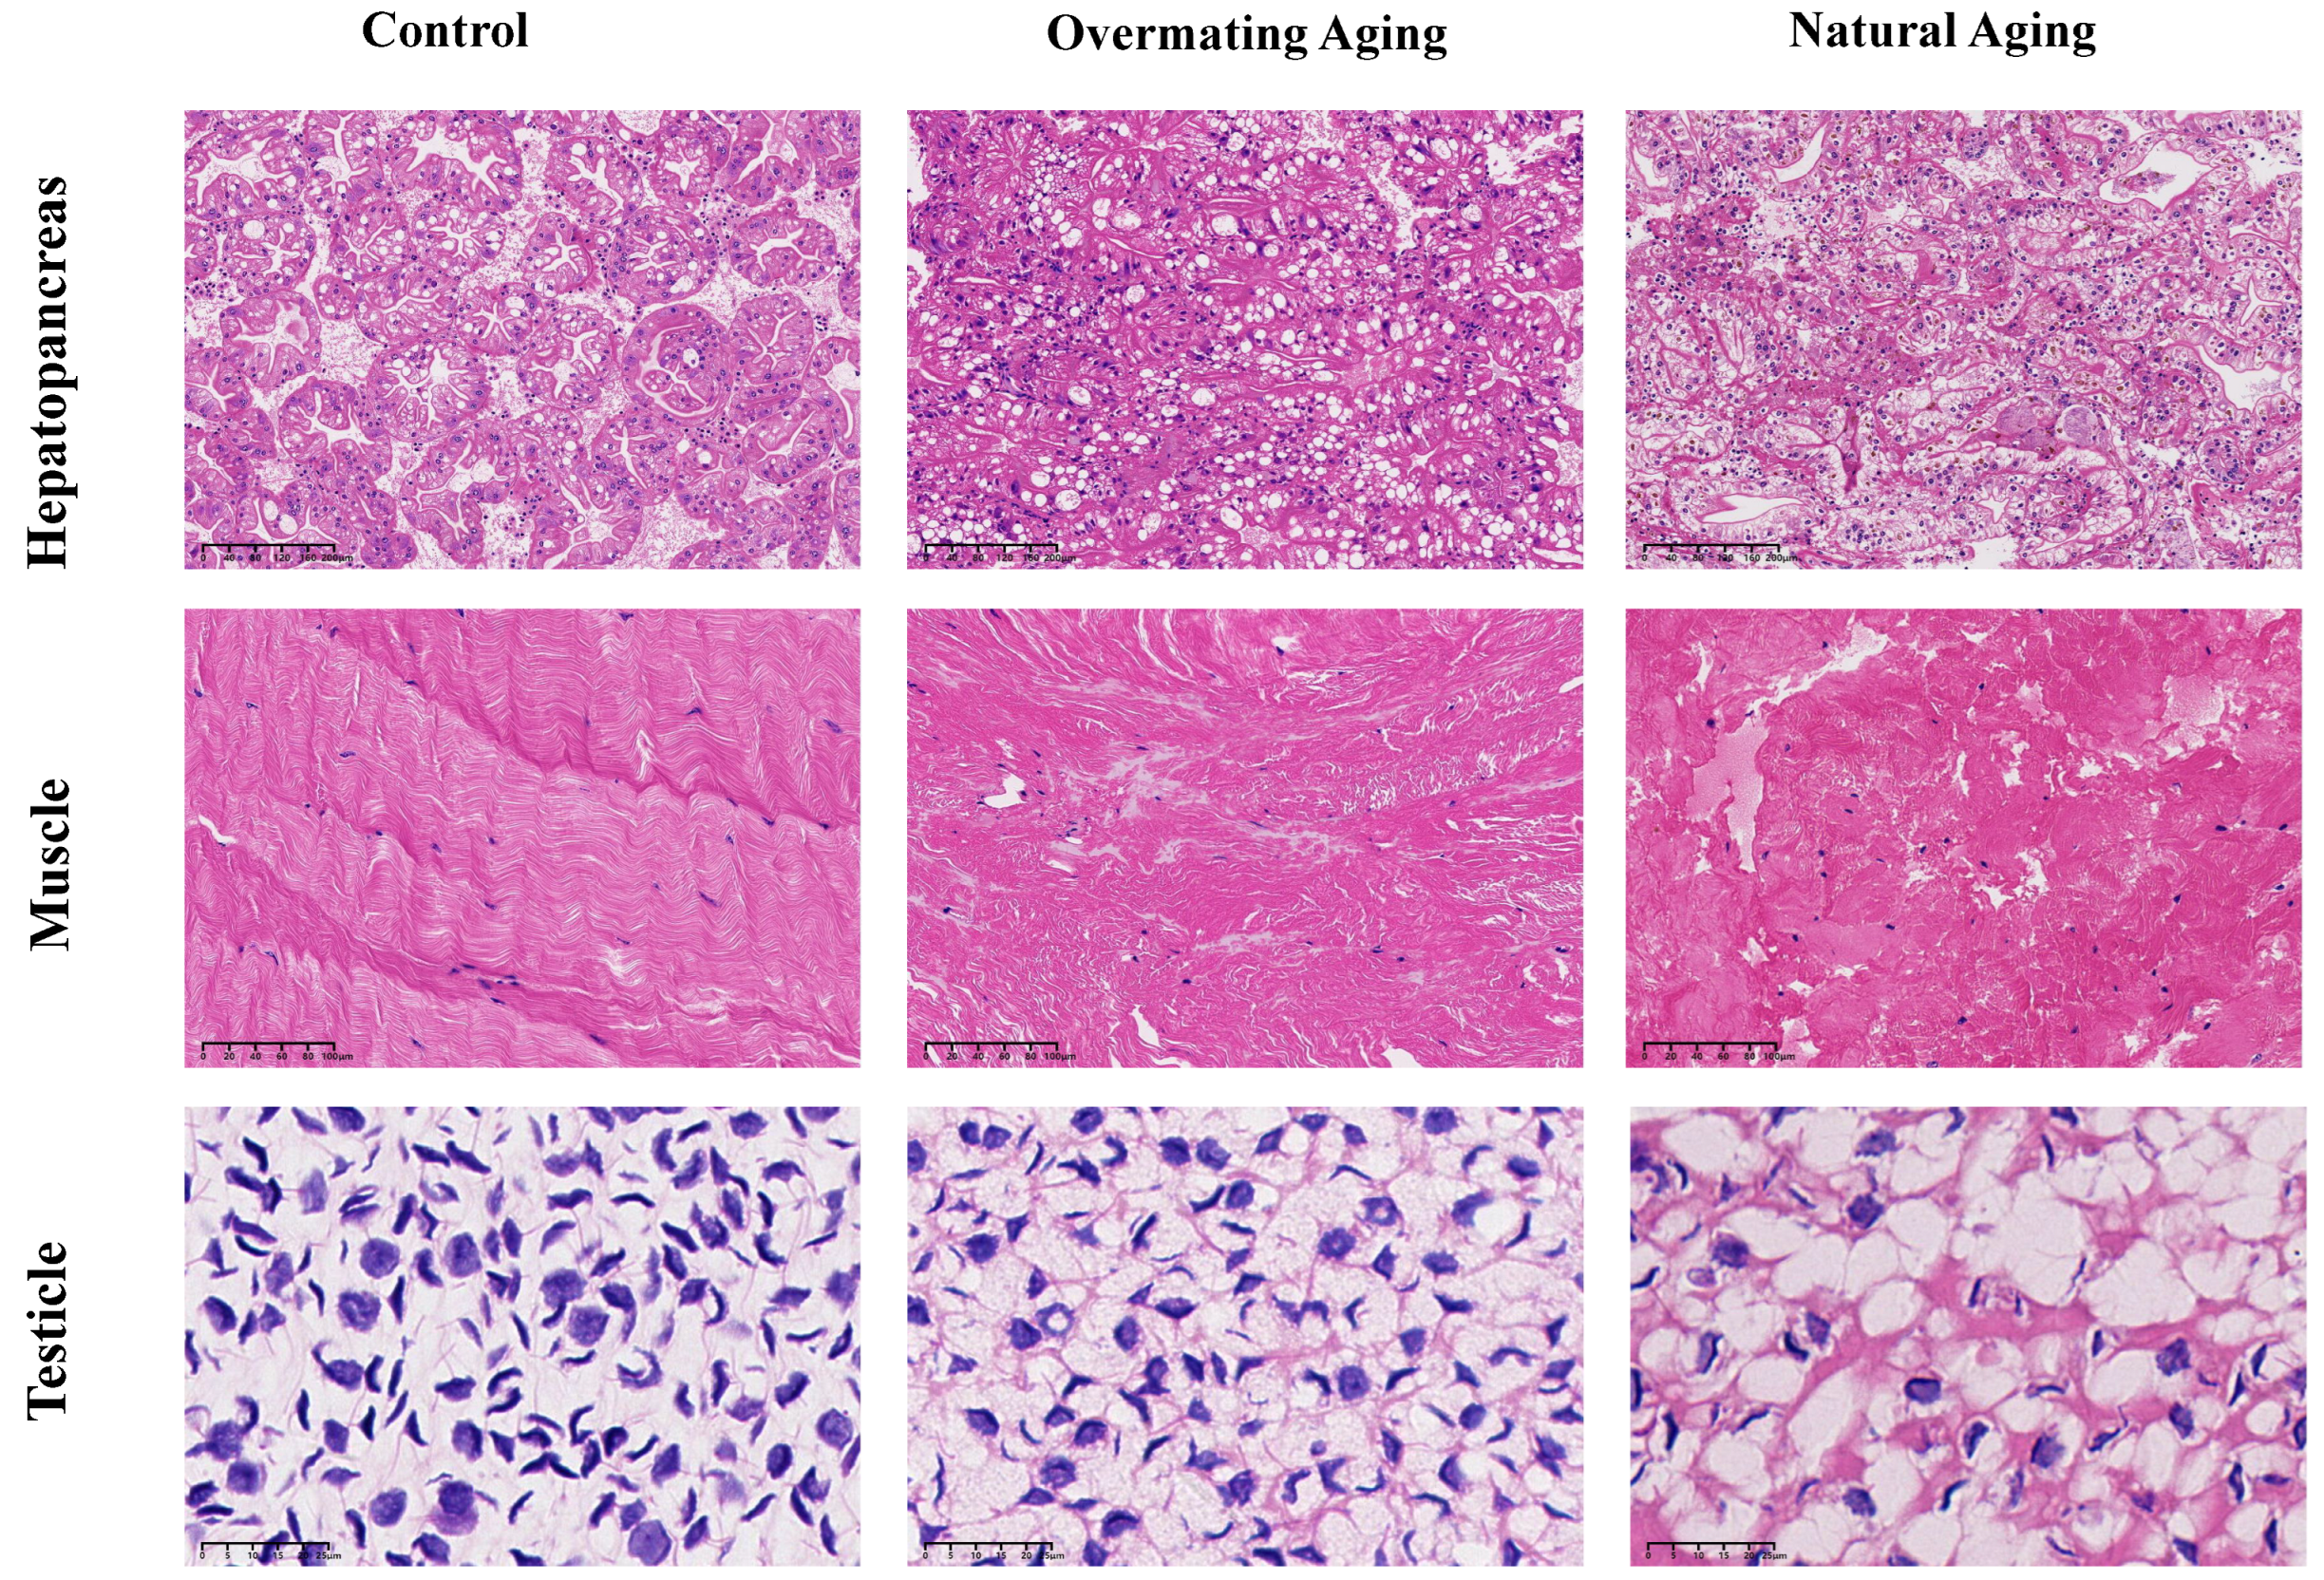
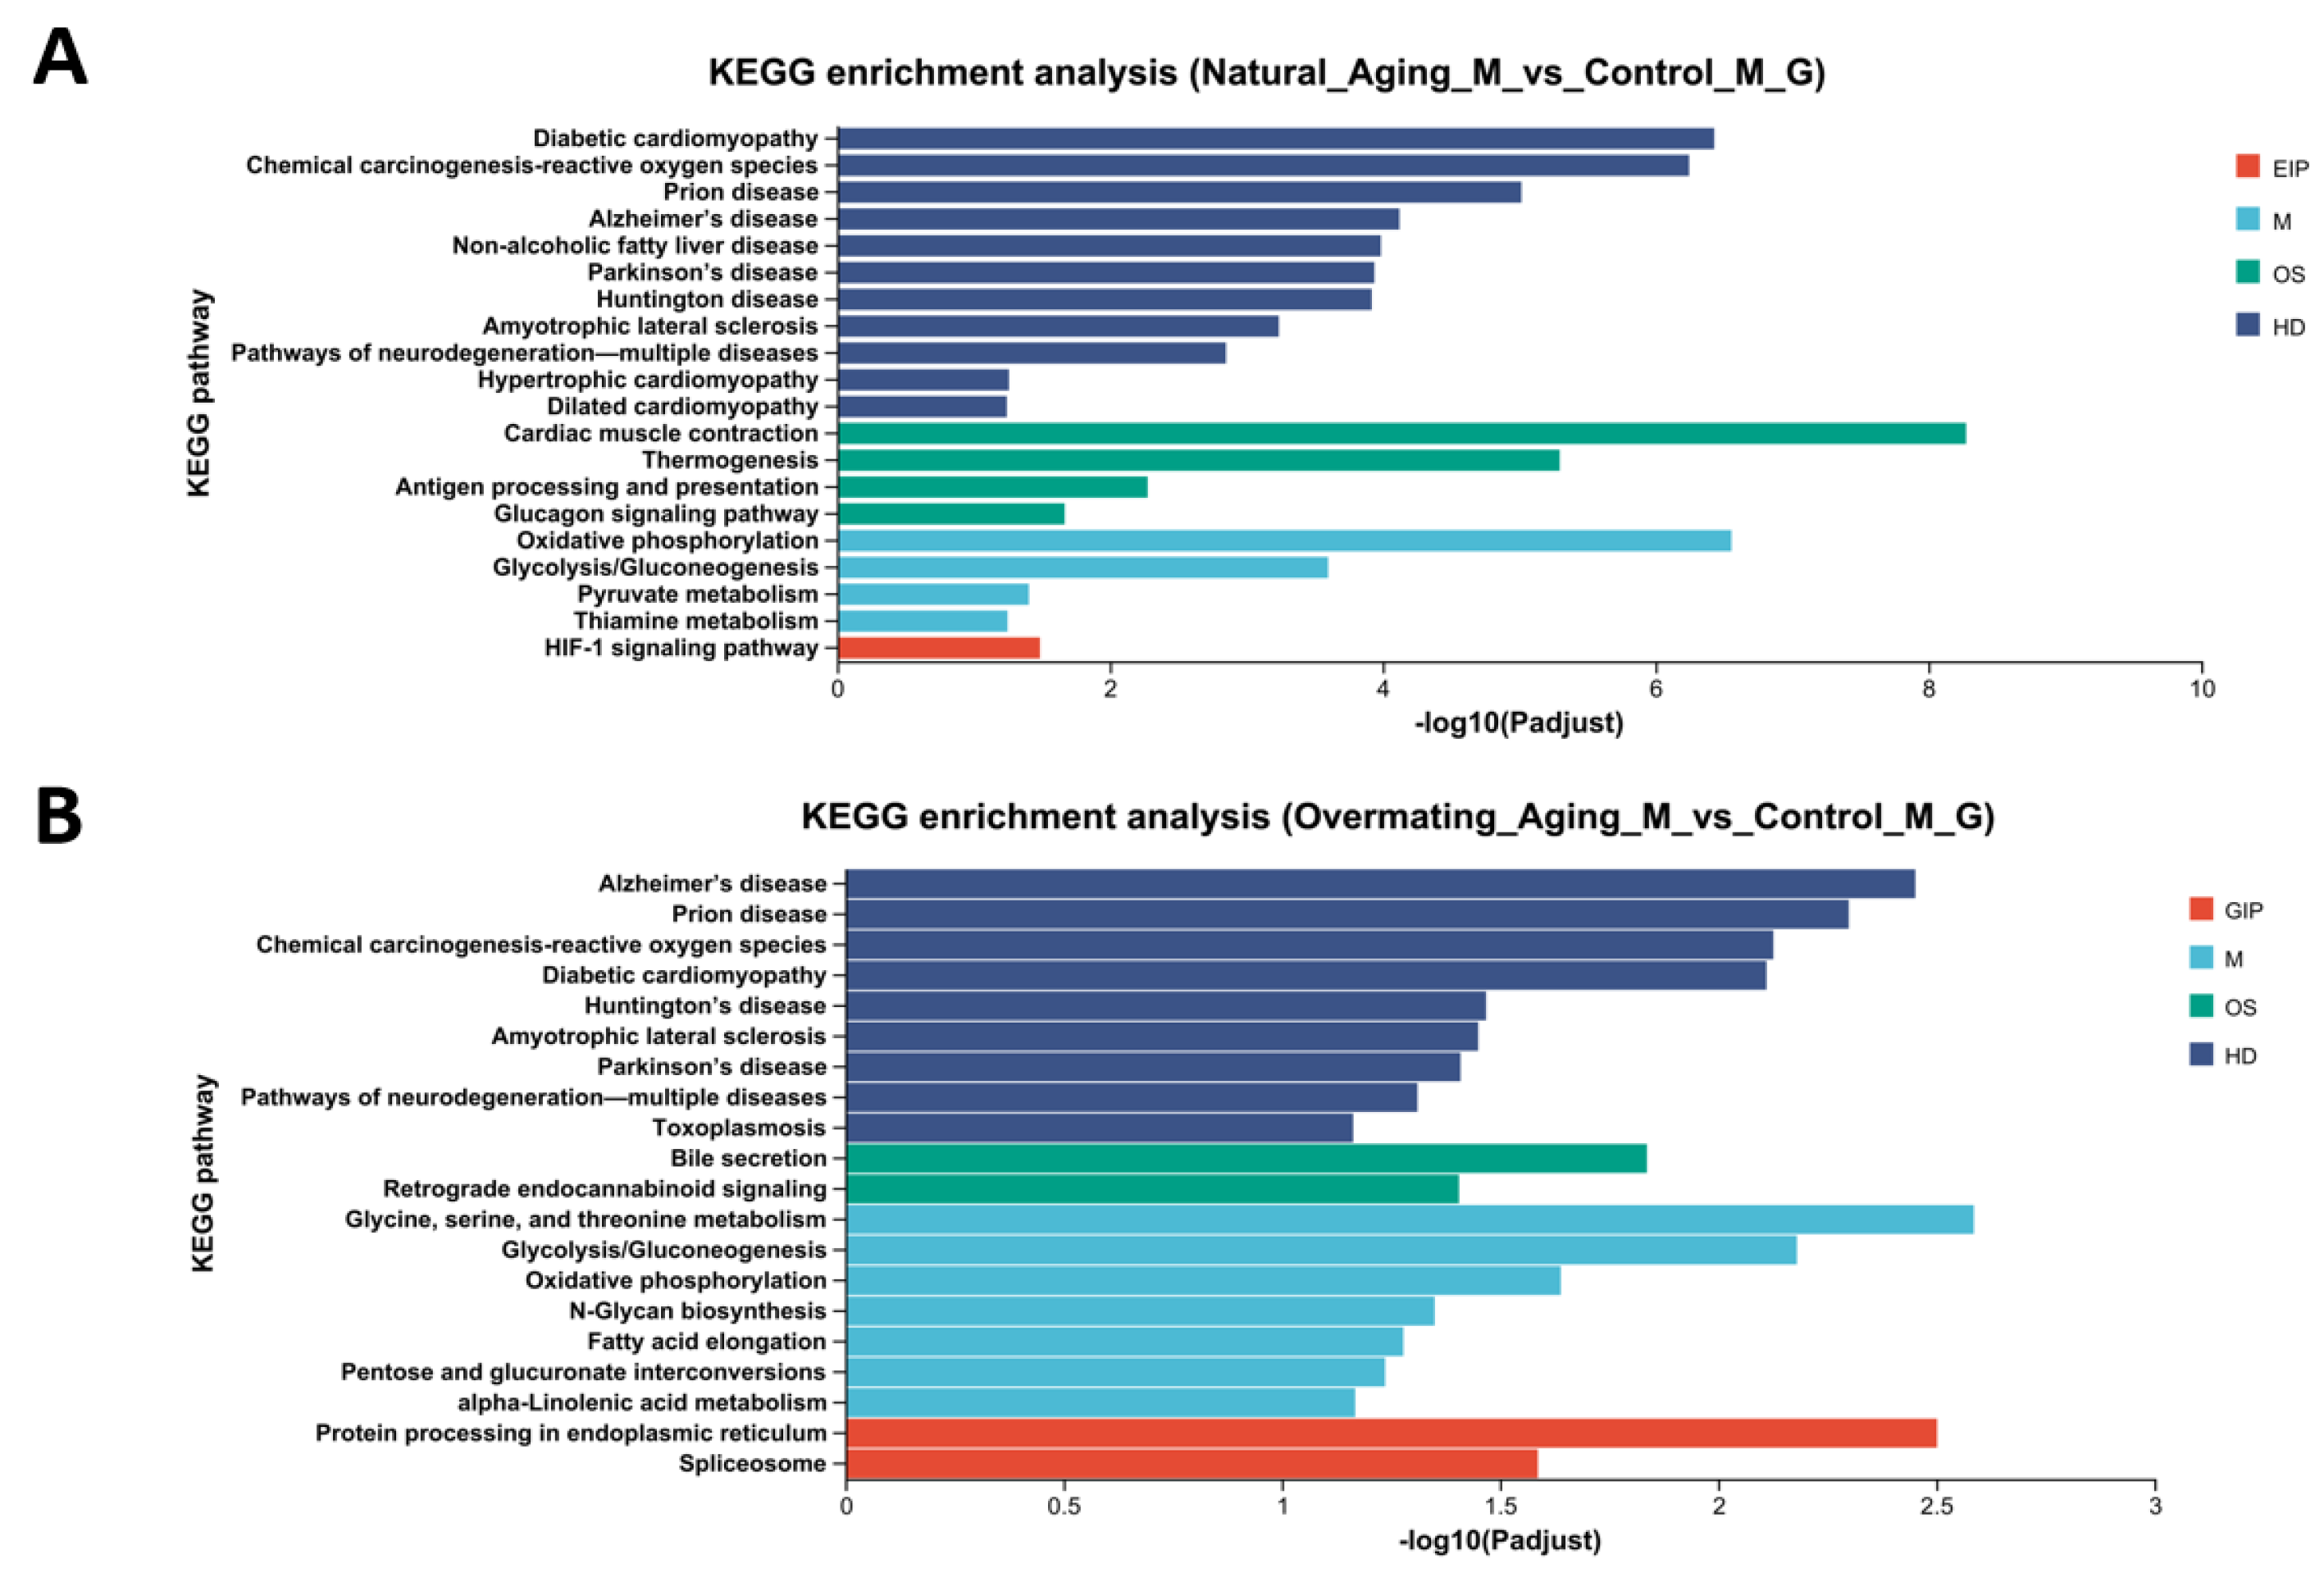
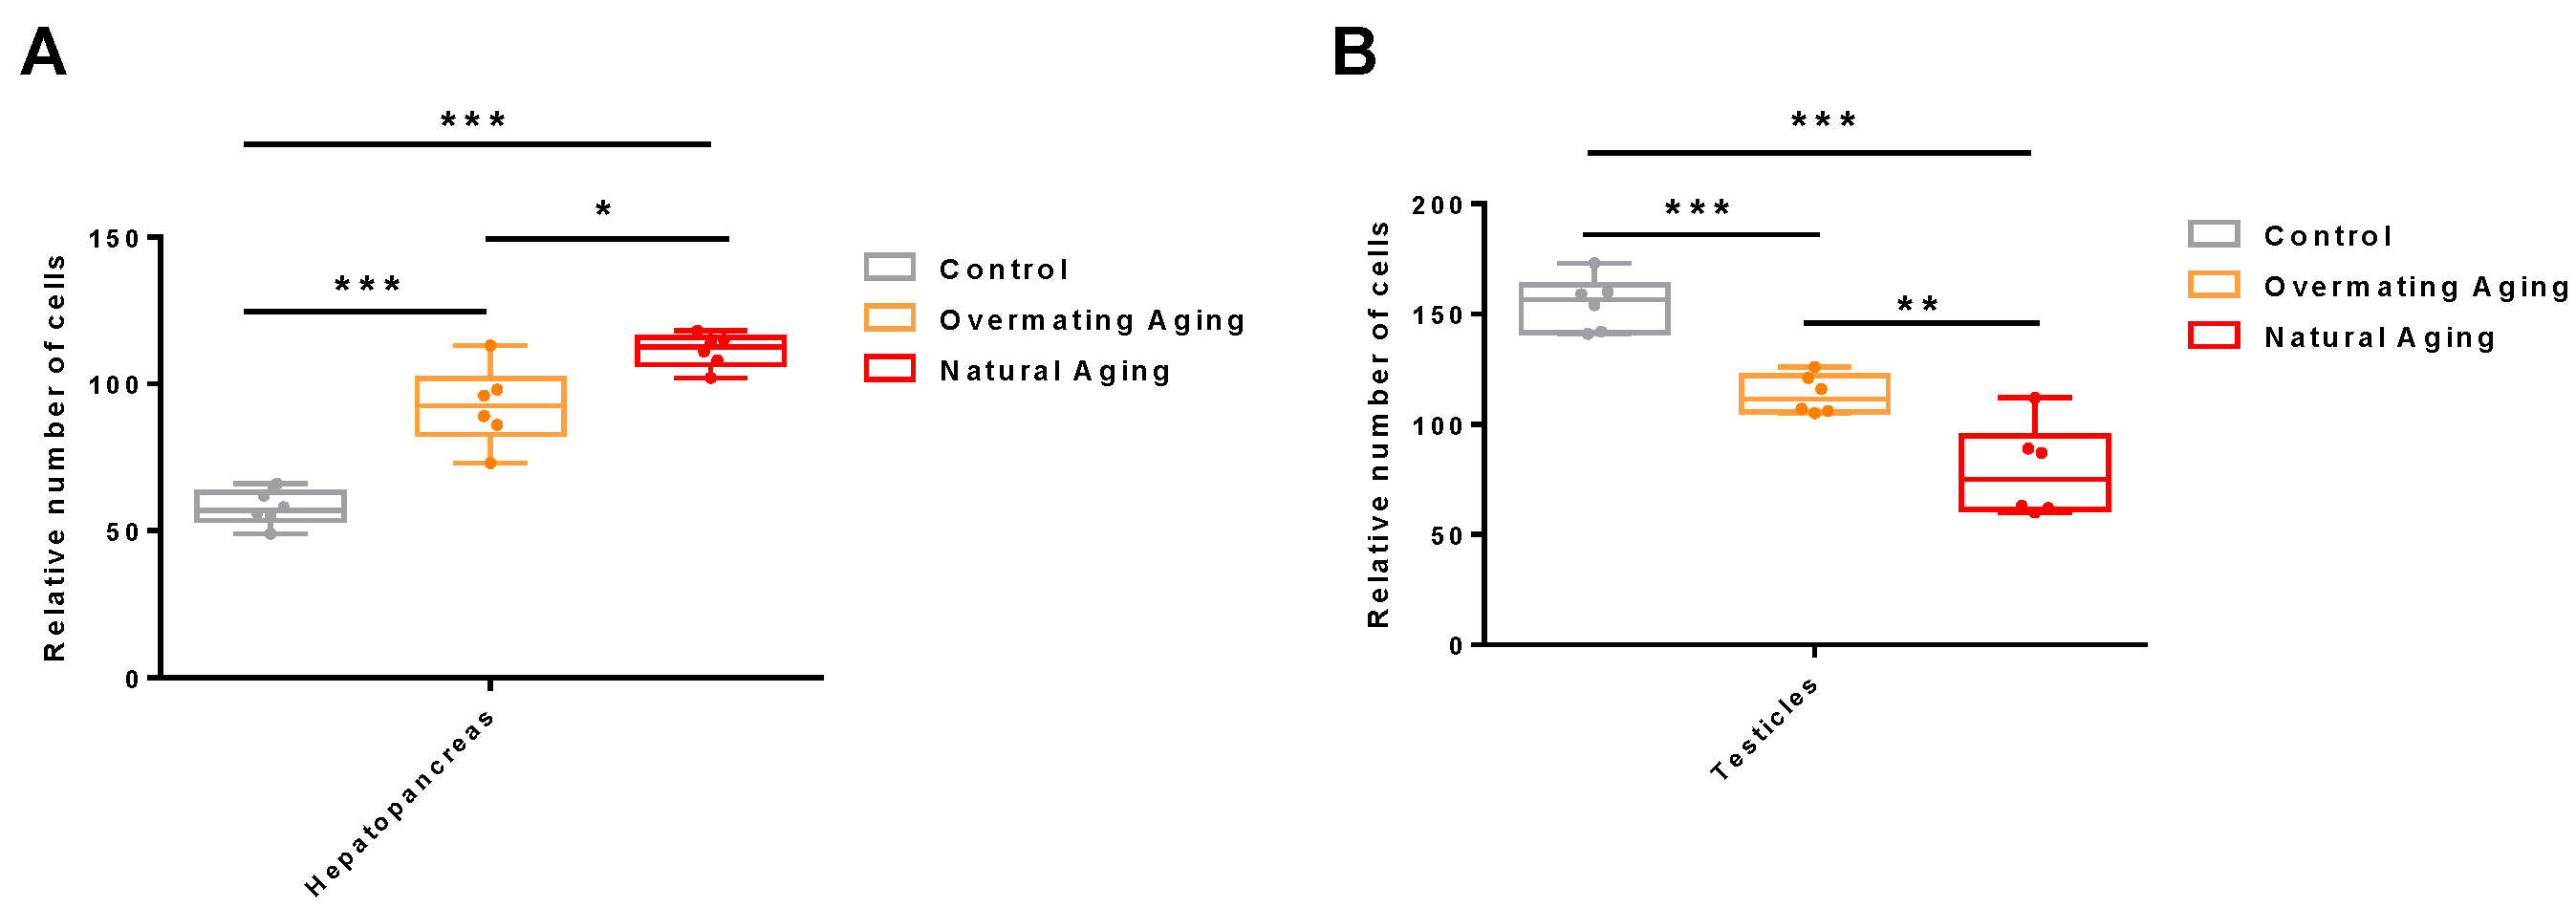
2.1. Analysis of Male M. rosenbergii in Three Different Physiological States

To determine whether the two moribund states of M. rosenbergii were in an ‘ageing’ state, histological observations were made on their hepatopancreas and their muscle and testicle tissues (Figure 1), and differential gene enrichment analysis was performed on the muscle tissue (Figure 2). Hematoxylin and eosin (HE) staining revealed that both the liver and muscle tissues were severely damaged compared to those of the healthy male M. rosenbergii, characterized primarily by the destruction of the hepatopancreatic tubule structure, muscle fiber rupture, and blurred texture. Significant differences in the number of cell nuclei in the hepatopancreas were observed within the same field of view as follows: Control Group (57.67 ± 5.37) < Overmating Aging Group (92.50 ± 12.23) < Natural Aging Group (111.33 ± 5.22) (Figure 3A). Similarly, significant differences were found in the number of sperm within the same field of view as follows: Control Group (154.83 ± 11.04) > Overmating Aging Group (113.50 ± 8.06) > Natural Aging Group (78.83 ± 18.97) (Figure 3B). Significantly differentially expressed genes in the muscle tissue were enriched in age-related pathways, including Alzheimer’s disease, Parkinson’s disease, Huntington’s disease, amyotrophic lateral sclerosis, diabetic cardiomyopathy, chemical carcinogenesis-reactive oxygen species, and neurodegenerative pathways (multiple diseases). Together with other characteristics observed in the two types of M. rosenbergii, such as reduced feeding, decreased activity, and reduced molting frequency, it can be concluded that they are in an aging phase, with excessive mating contributing to the progression of aging in males.

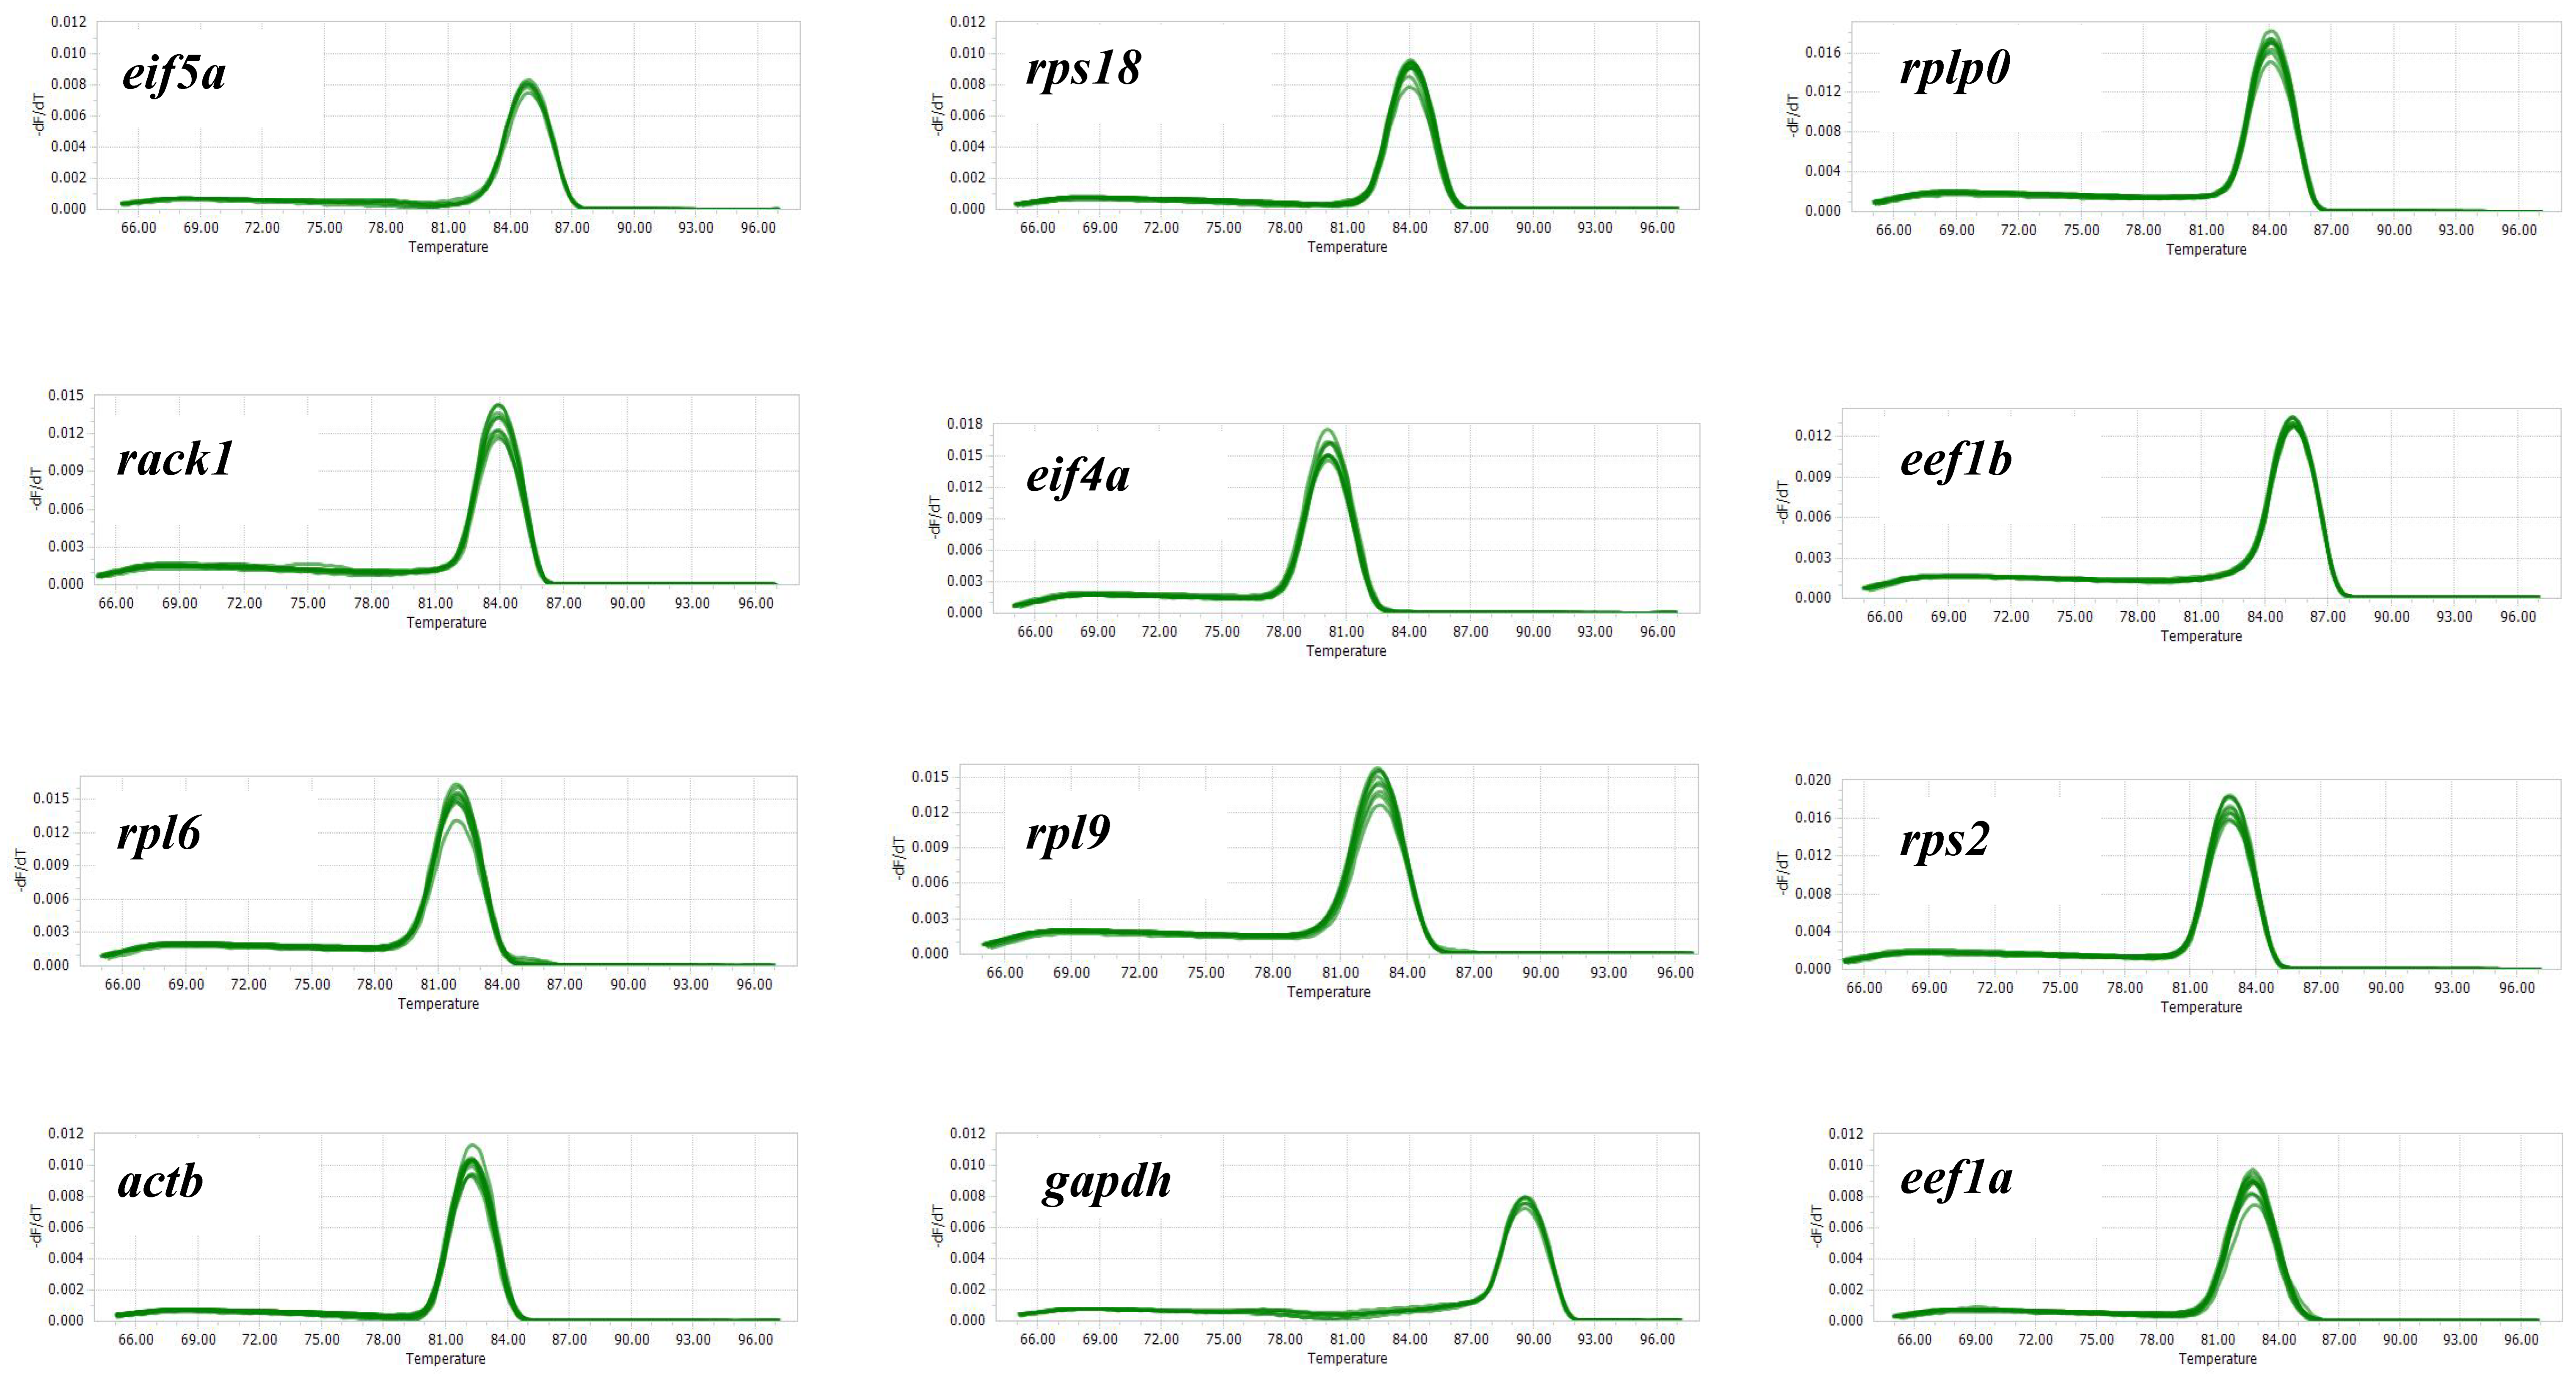
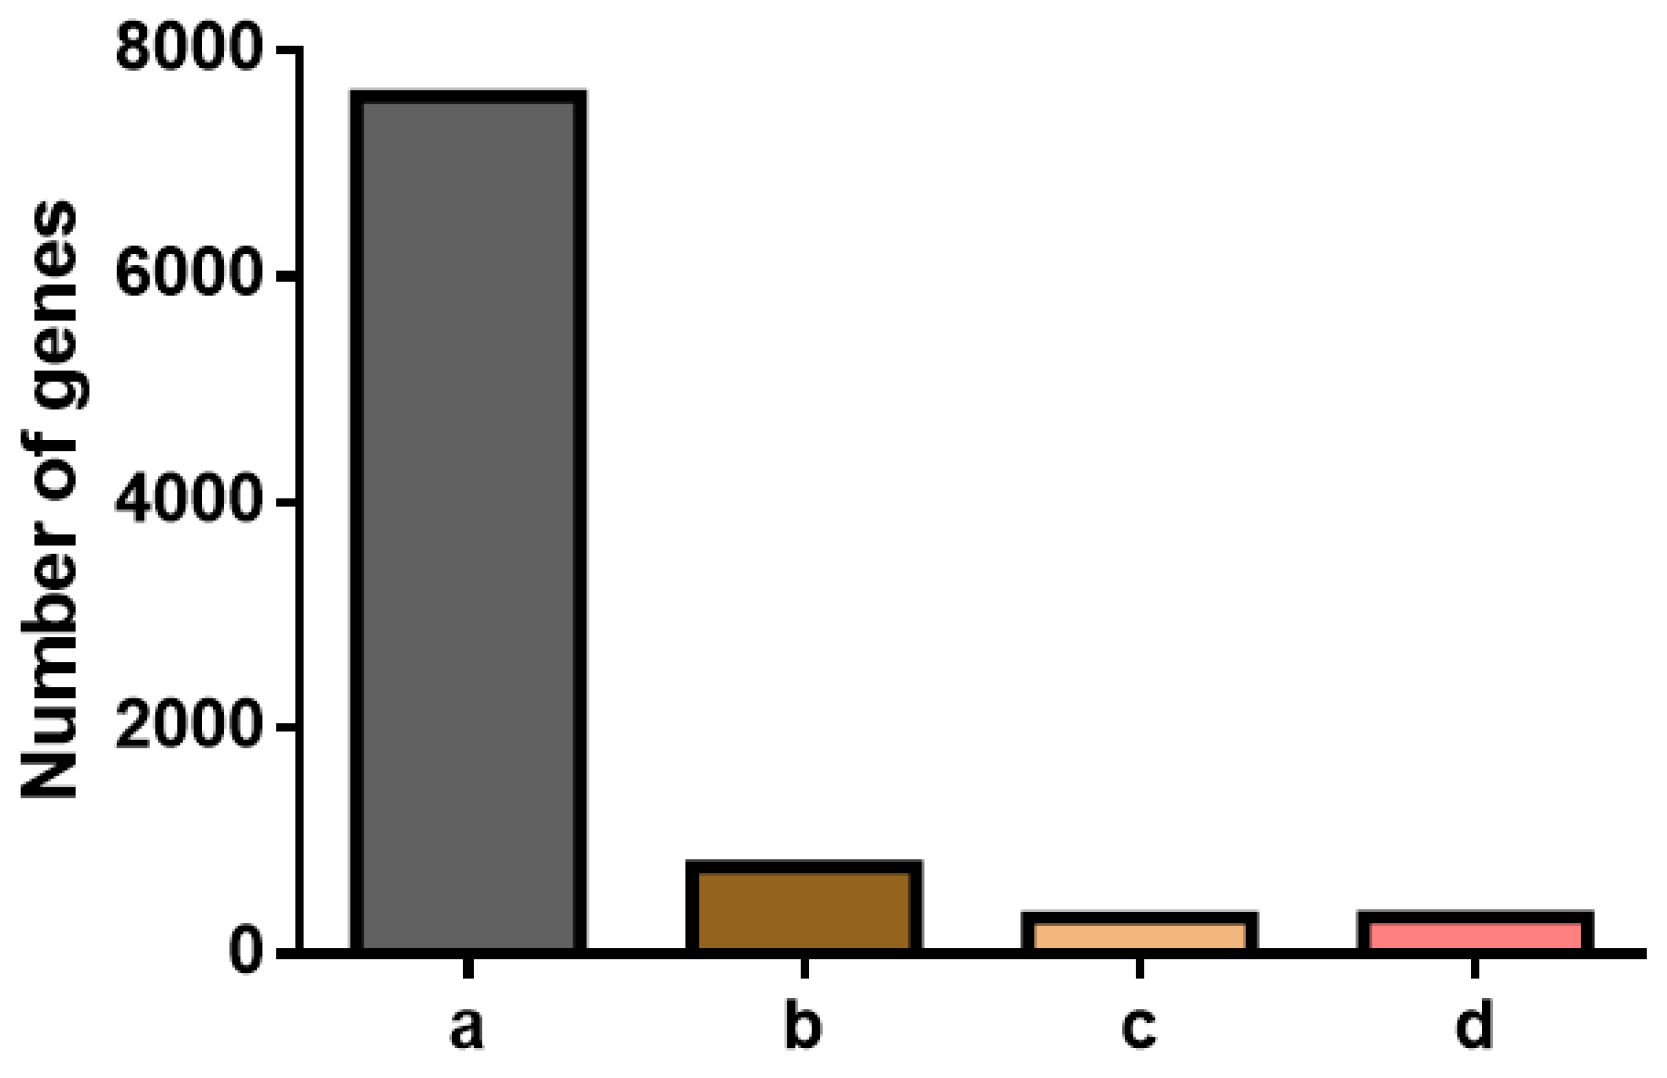
2.2. Selection of Candidate Reference Genes

In 36 RNA-seq datasets, 3 candidate reference genes for male M. rosenbergii under different physiological conditions were selected from a total of 43,155 genes. Based on the four criteria mentioned above, 7598 (17.61%), 776 (1.80%), 320 (0.74%), and 328 (0.76%) genes were identified (Figure 4). The further estimation and selection of candidate reference genes were performed using the coefficient of variation (CV) values, ultimately identifying nine genes with a CV value less than 0.1 (Table 1). These candidate reference genes exhibited high expression levels, with an average log2(TPM) range from 6.02 to 9.20 and low CV values ranging from 0.062 to 0.099.
The log2(TPM) values from RNA-seq were utilized to assess the stability of the candidate genes (rack1, rpl6, rpl9, rps2, rps18, rplp0, eef1b, eif4a, and eif5a) and the reported reference genes (eef1a, actb, and gapdh). As demonstrated in Figure 5, actb exhibited the most significant variation, ranging from 4.49 to 14.43, while the gapdh gene demonstrated a substantial amount of variation, ranging from 4.41 to 12.39. The fluctuation of eef1a was minimal (4.53–7.32). In contrast, the log2(TPM) values of the candidate genes identified from the transcriptome exhibited considerably less variation across tissues, with rack1 (6.19–9.35), rpl6 (7.46–10.54), rpl9 (7.42–10.42), and rps2 (7.71–10.21) displaying the most significant fluctuations. The remaining genes showed the following ranges: rps18 (7.54–10.98), rplp0 (5.82–8.82), eef1b (6.53–9.67), eif4a (4.75–7.04), and eif5a (7.59–12.4).

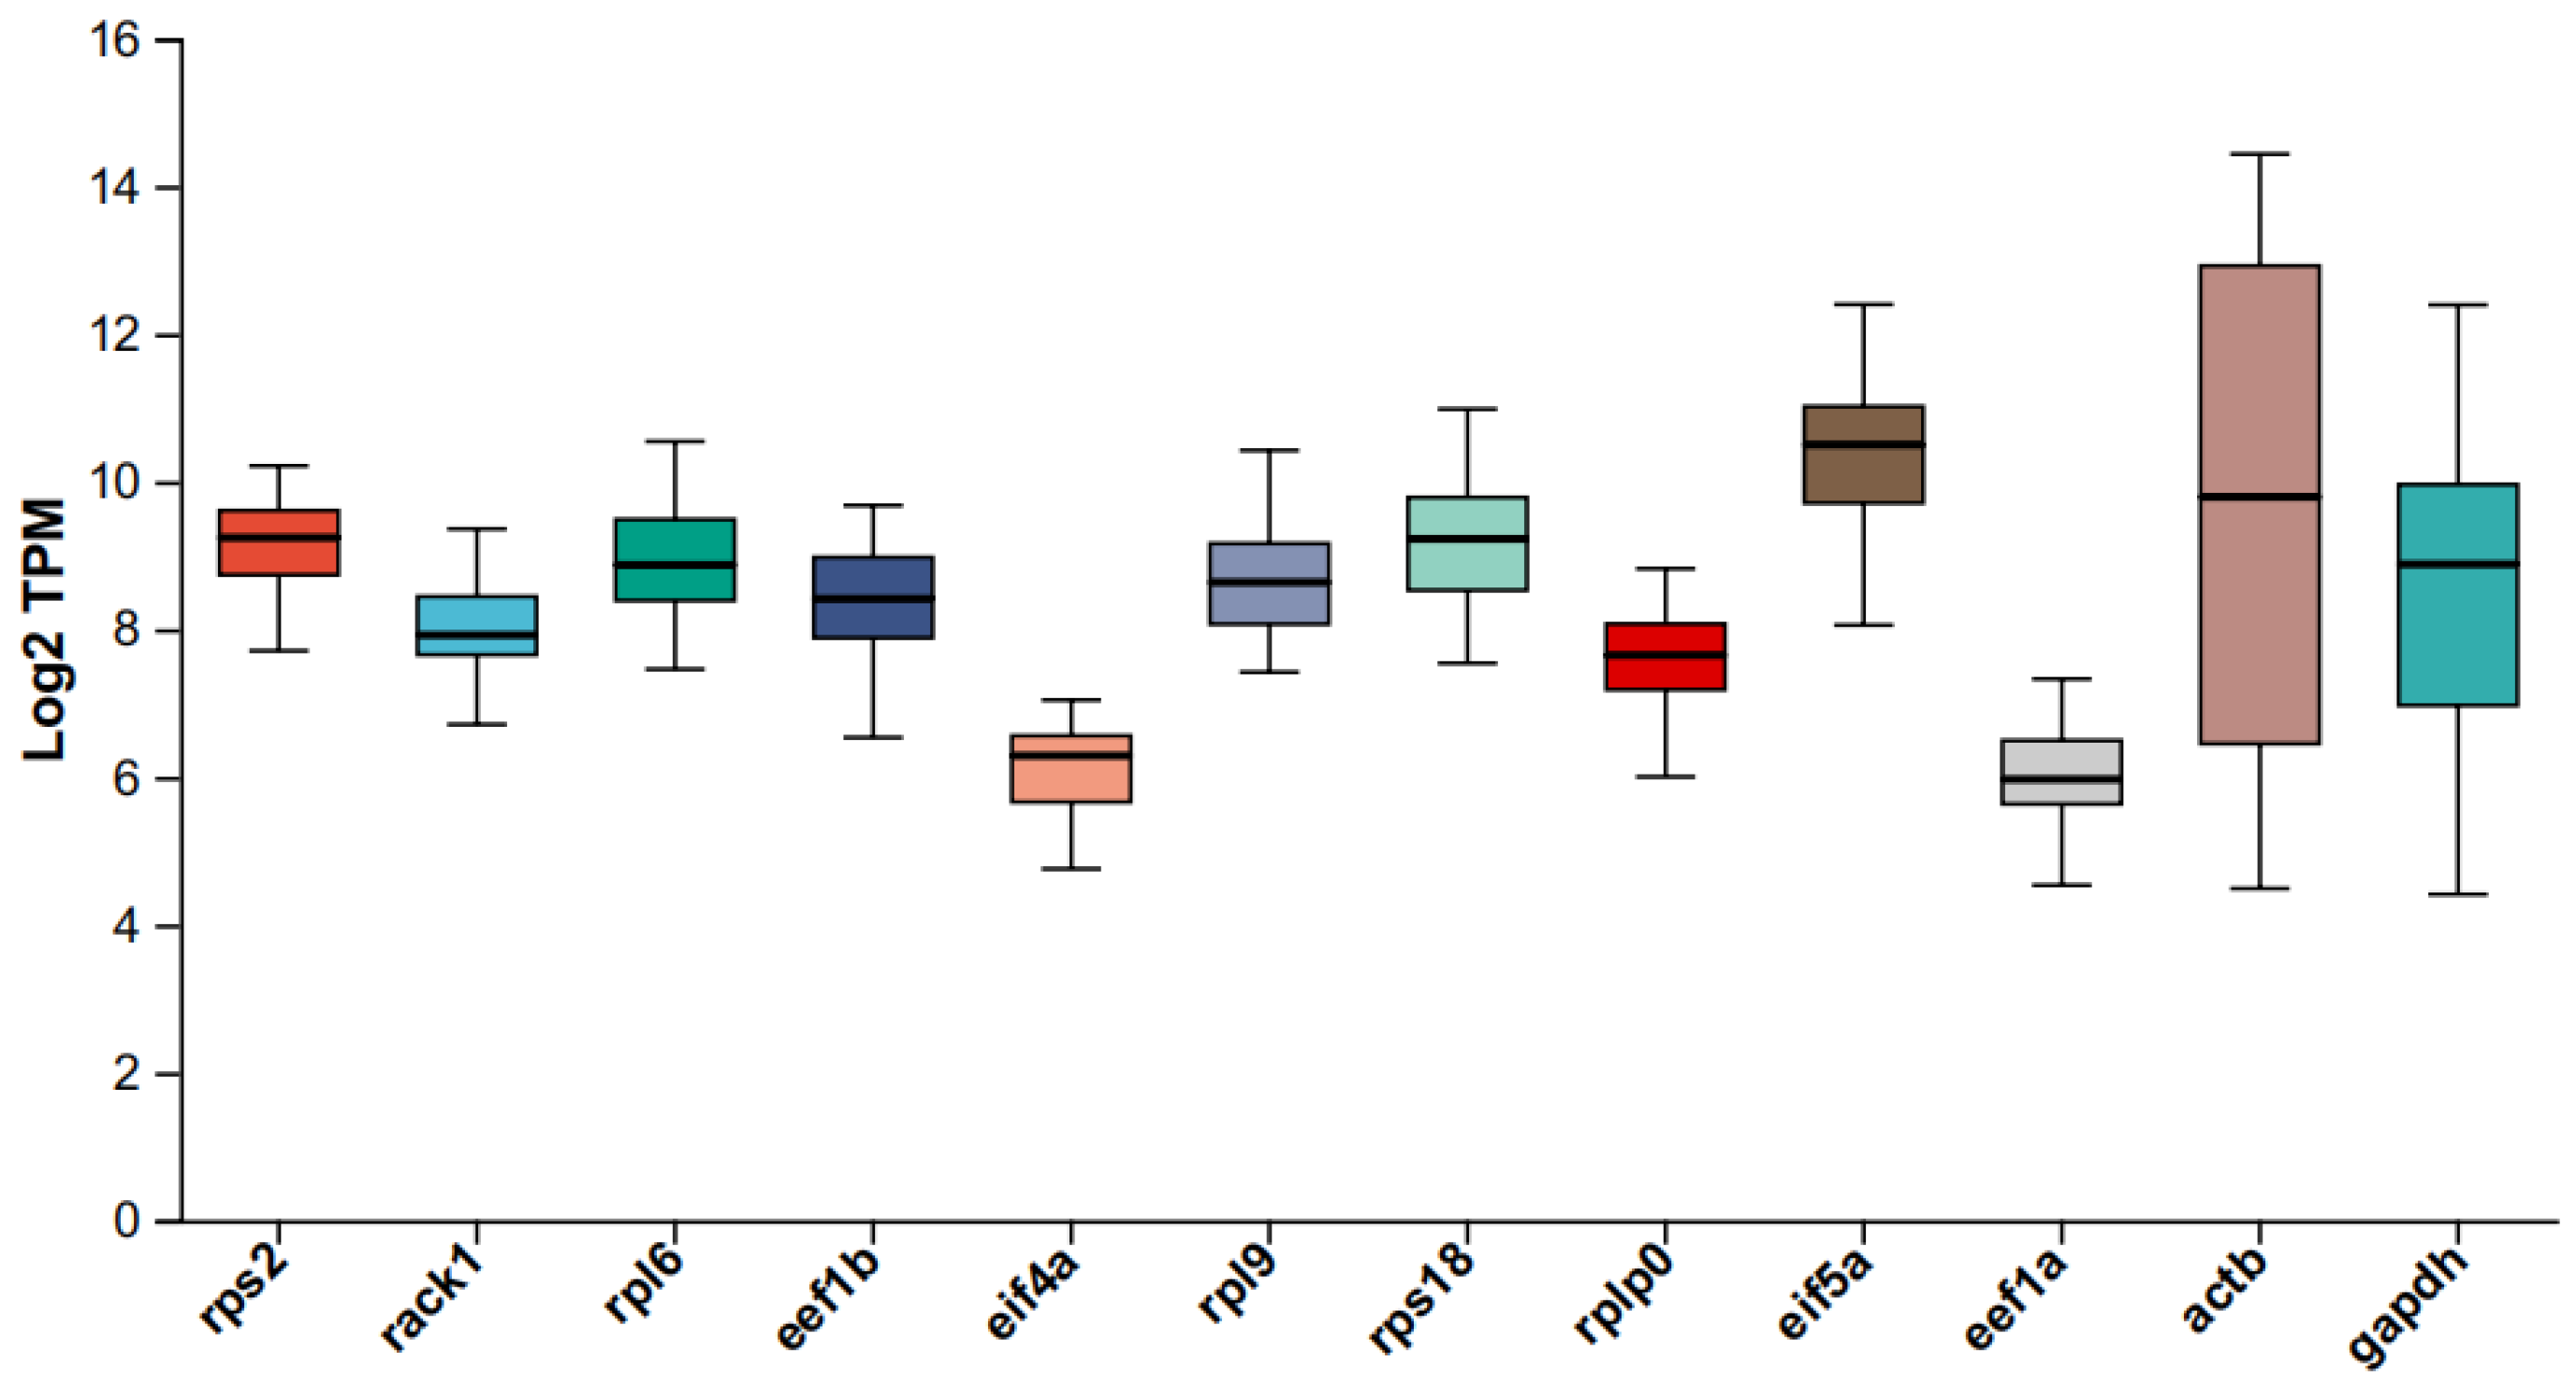
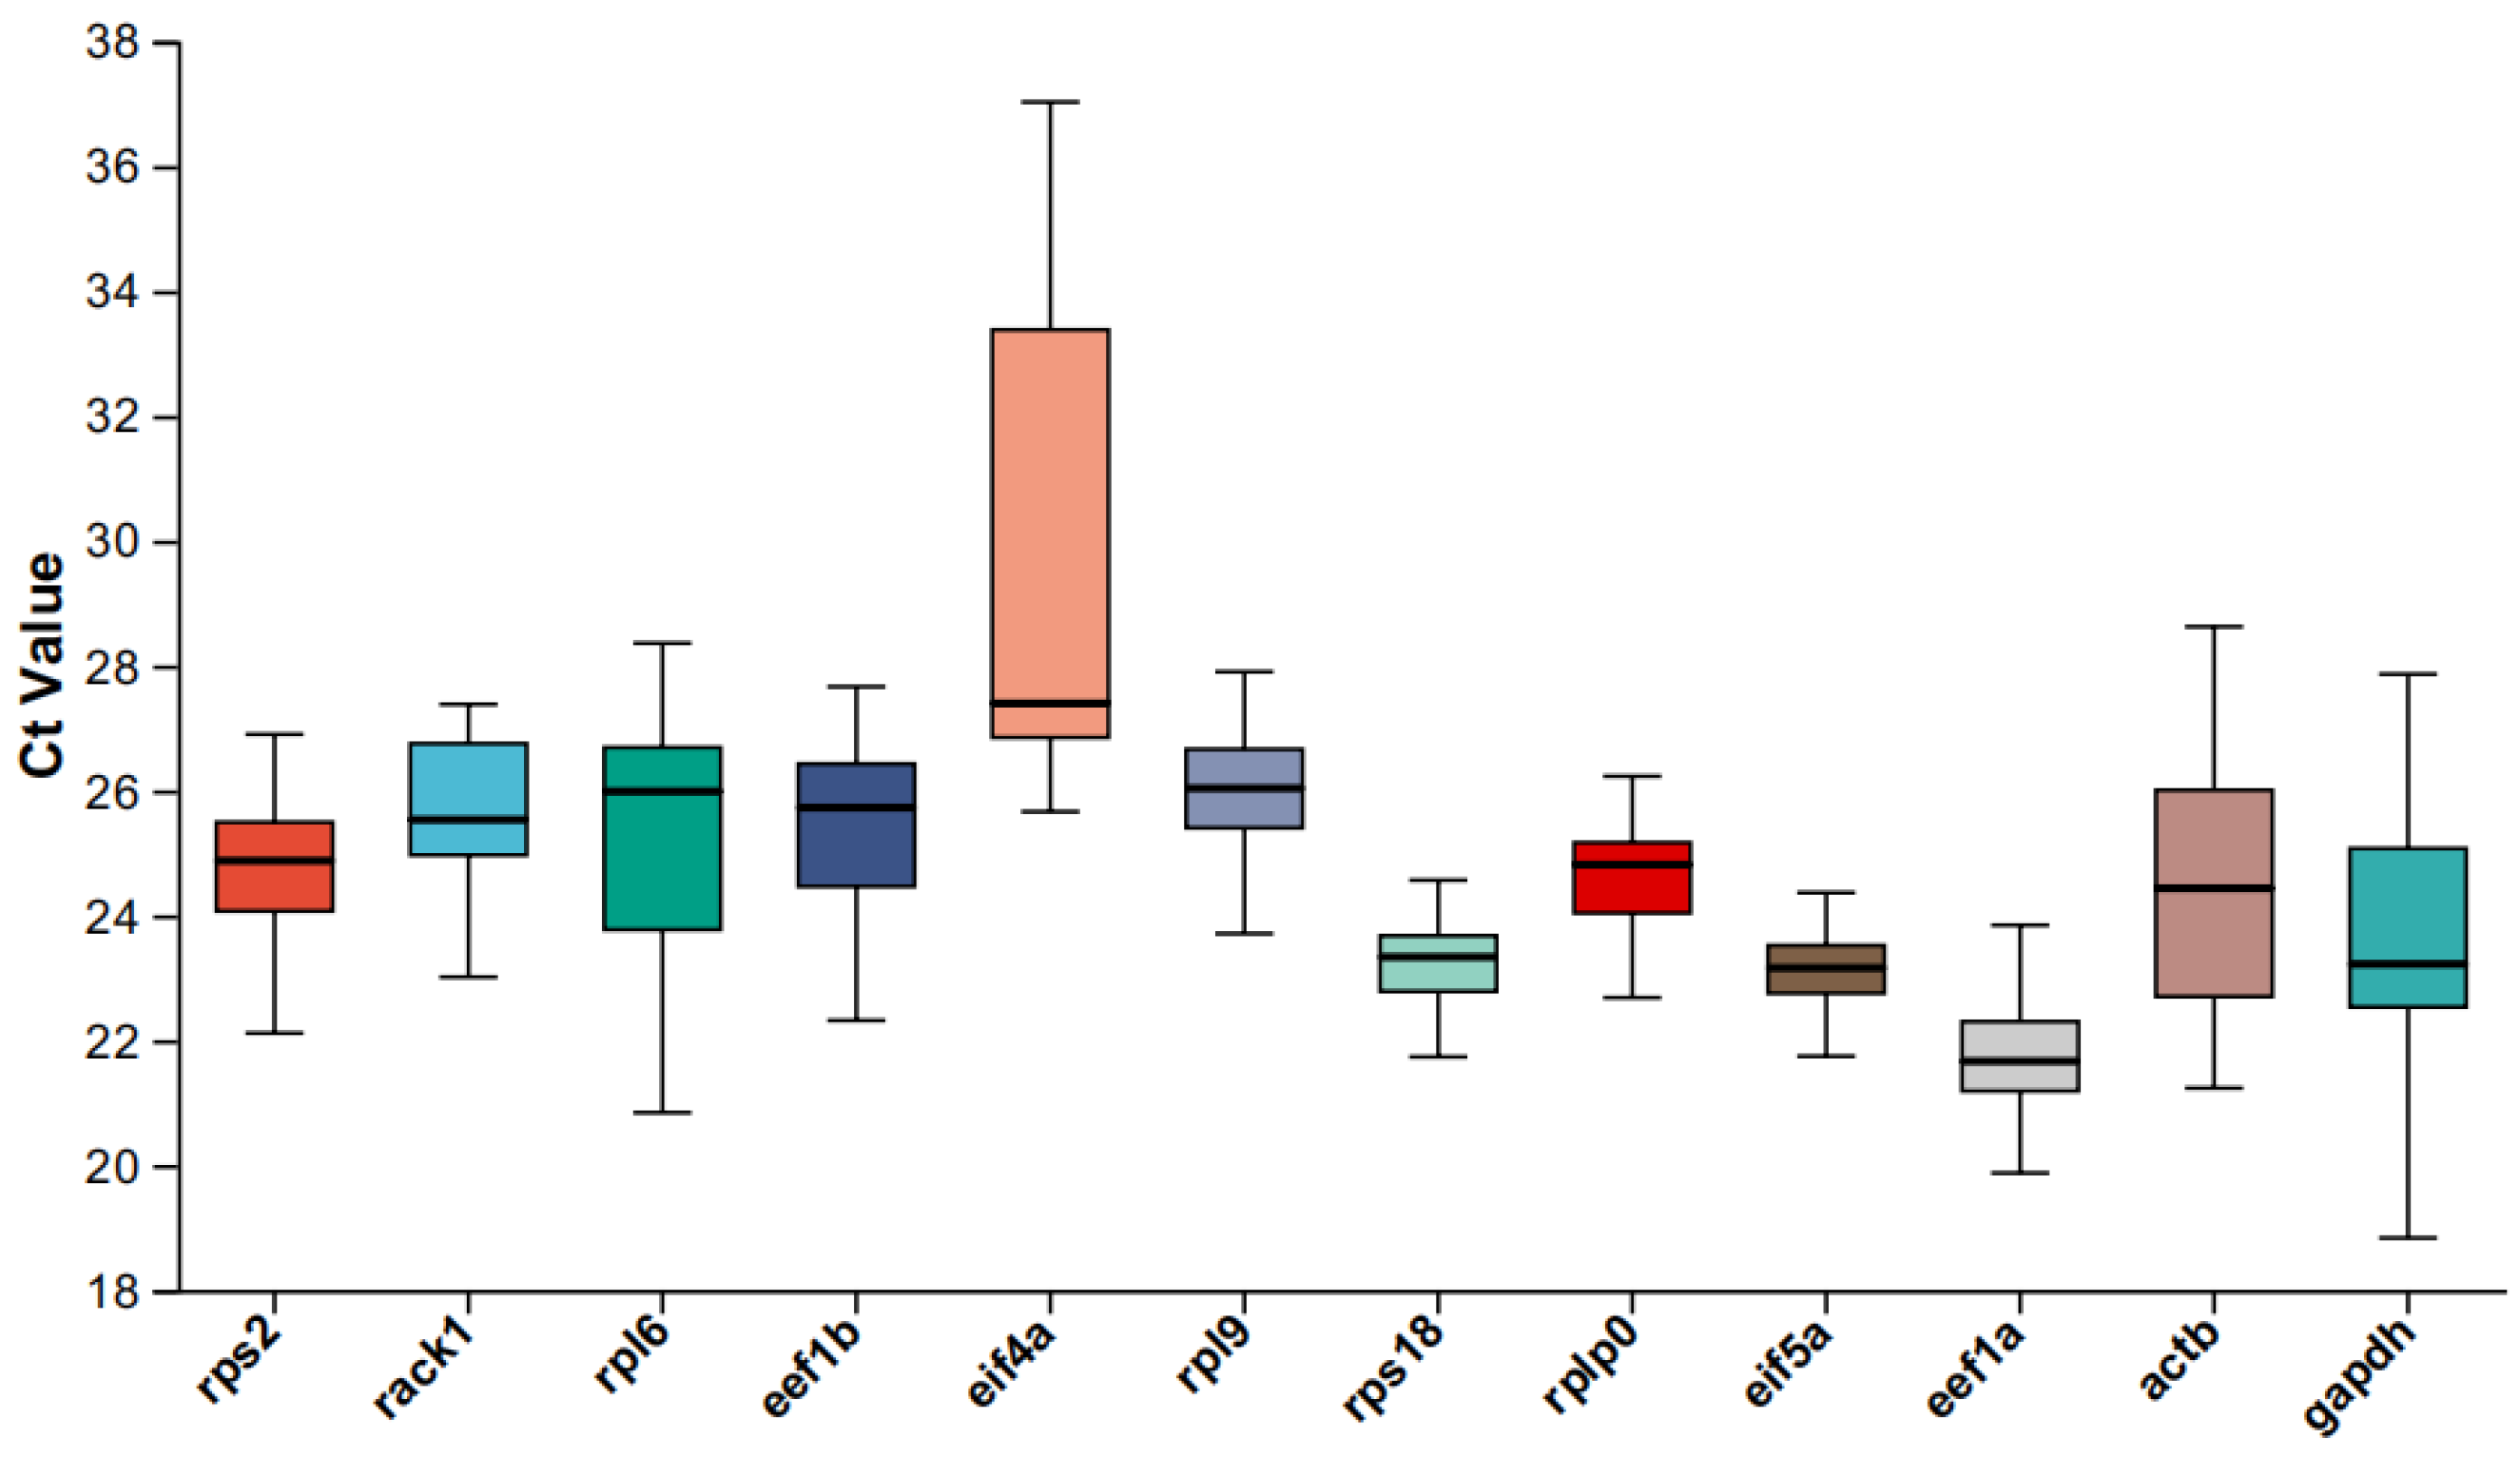
2.3. Distribution of Cycle Threshold (Quantitative Cycle) Values

The qPCR primer pairs for the twelve genes are shown in Table 2. The correlation coefficient of the standard curve was > 0.98, and the amplification efficiency of the primers ranged from 94% to 104% (Table 2). The Ct values reflect the expression level of a gene, with lower values indicating higher abundance. The stability of gene expression can be inferred from the fluctuation range of the Ct values. As shown in Figure 6, the box plots demonstrate the quantitative expression levels of the candidate genes in different tissues. The vast majority of the candidate reference genes had Ct values ranging from 18 to 25 across different tissues, and their expression was stable in different tissues, including rack1 (23.01–27.38), rps2 (22.11–26.90), rplp0 (22.34–26.22), eef1b (22.31–27.66), rpl9 (23.70–27.90), rps18 (21.73–25.29), eif5a (21.74–25.05), and eef1a (29.87–24.07). However, the expression levels of gapdh (18.83–27.86), actb (21.23–28.62), rpl6 (20.84–28.36), and eif4a (25.66–27.02) fluctuated considerably.
The reference genes were evaluated and screened using the RefFinder program, which integrates geNorm, NormFinder, BestKeeper, and the comparative Δ-Ct methods and provides a comprehensive ranking by weighting (Figure 6). According to the NormFinder method, rplp0 was identified as the optimal reference gene. GeNorm, BestKeeper, Δ-Ct, and comprehensive analysis identified eif5a and rps18 as the most stable genes (Figure 7). GeNorm and comprehensive analysis identified these two genes as the most stable. We conclude that eif5a and rps18 represent the optimal reference gene combination for aging-related studies of M. rosenbergii.

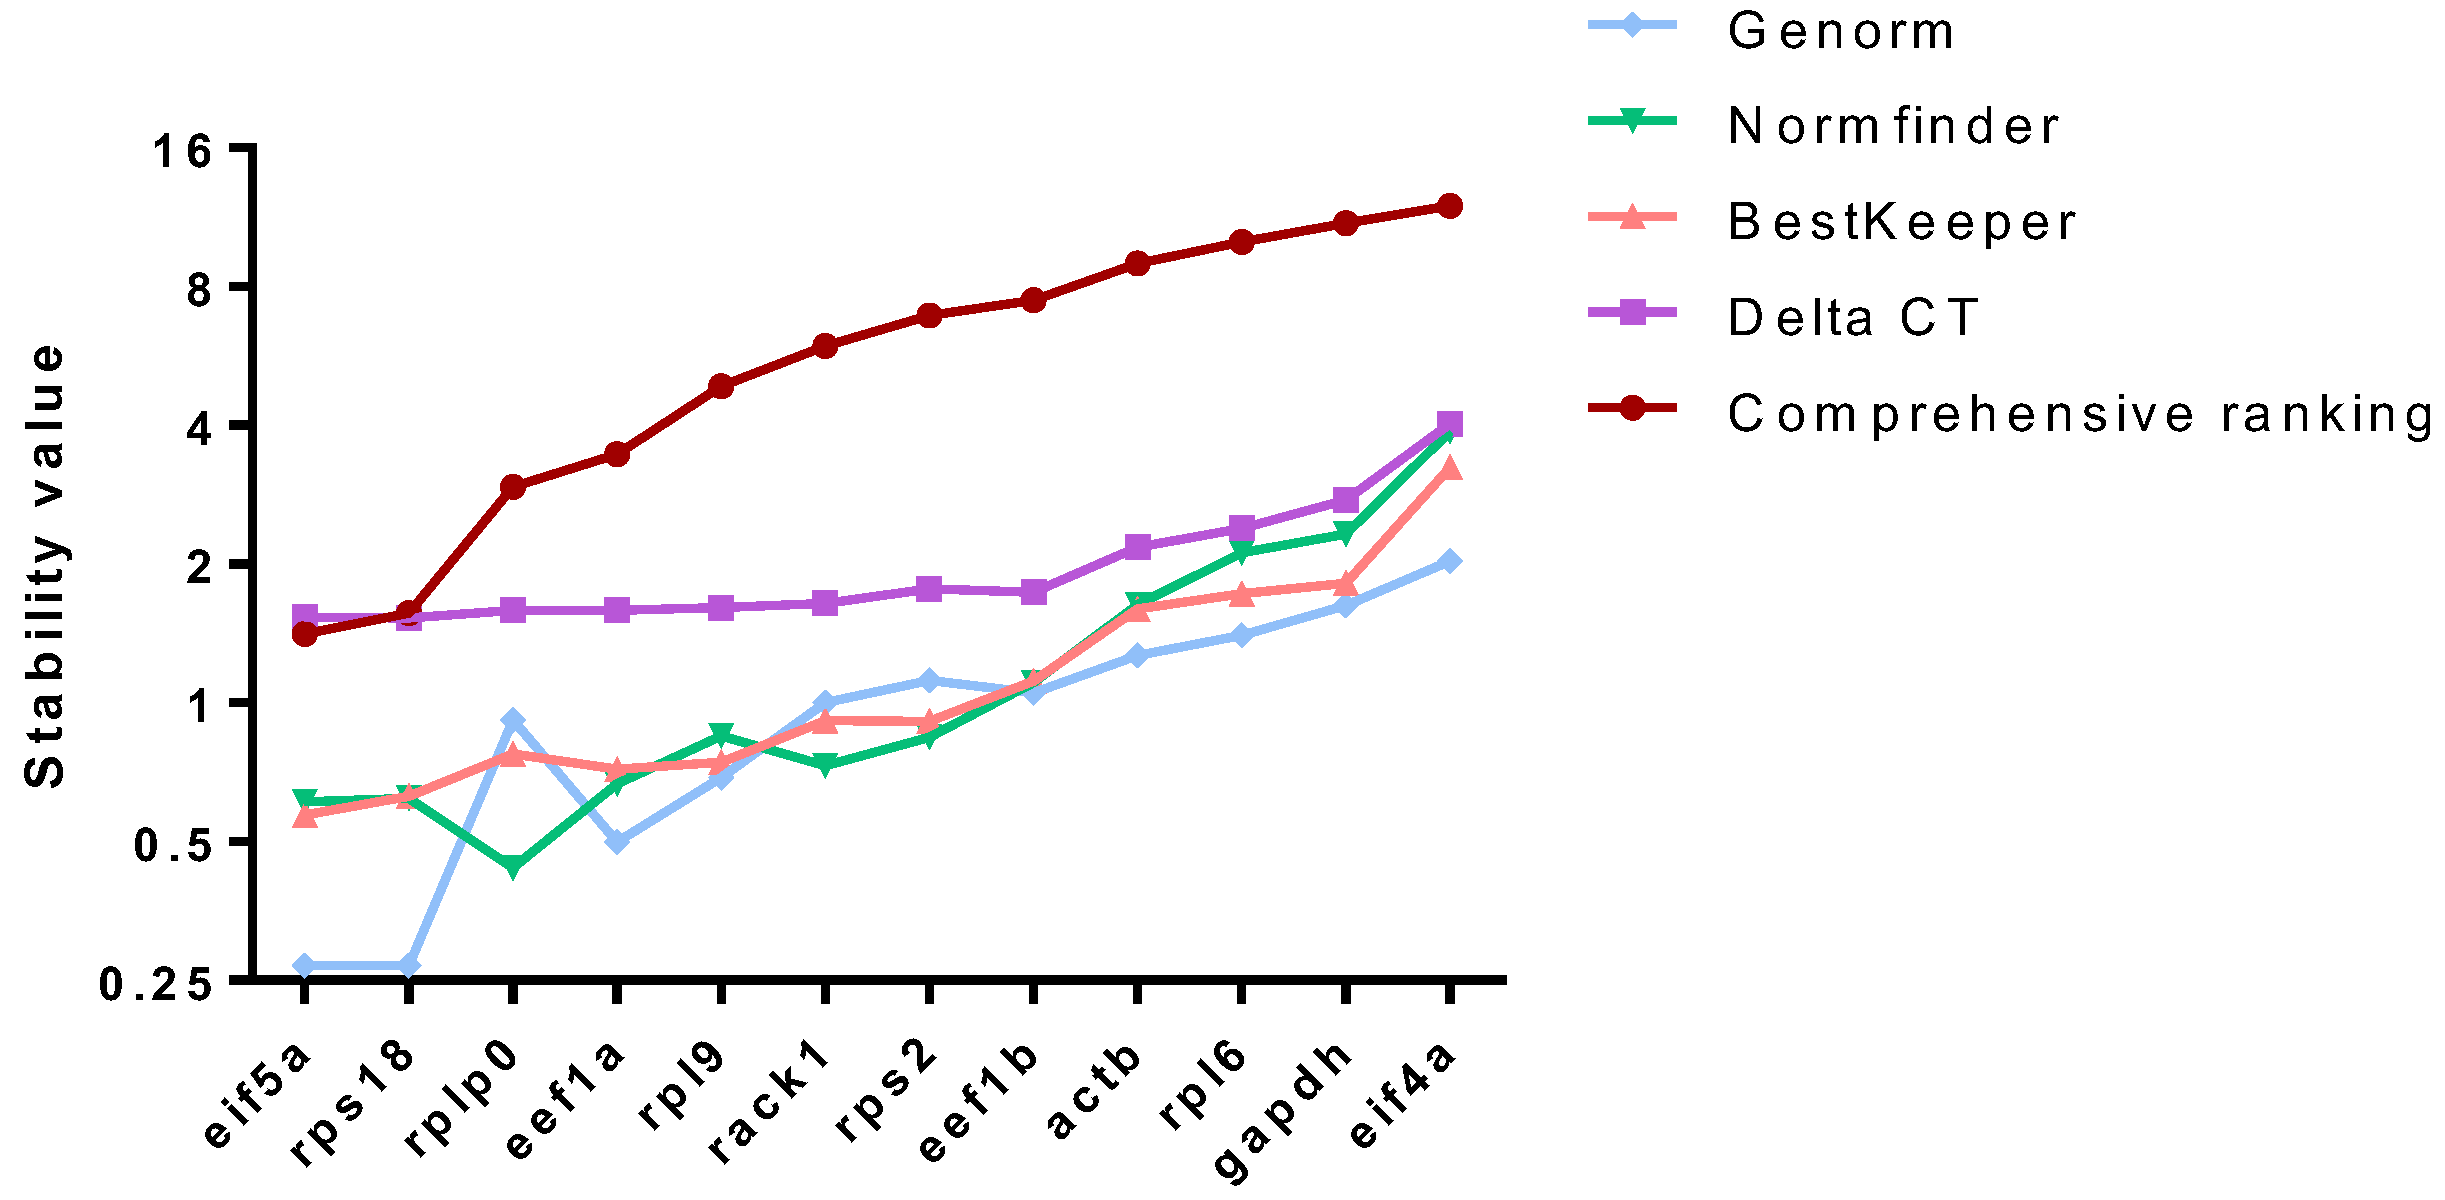
2.4. The Stability of eif5a and rps18 as Internal Controls Under Different Conditions Was Further Evaluated

As shown in Figure 8, the reference genes were evaluated using RefFinder, where a lower score indicates a more stable gene. The best reference gene for muscle tissue under temperature stress is eif5a, which is also the most stable gene during ovarian development. The best reference gene is eef1a in embryonic development and different adult tissues, although eif5a is still relatively stable. The rps18 gene was stable only in adult tissues. Comprehensive evaluation showed that eif5a was a relatively stable reference gene for M. rosenbergii.

3. Discussion

Quantitative real-time PCR (qPCR) is a routine method for gene transcription levels [1]. According to the China National Center for Bioinformation–National Genomics Data Center (CNCB-NGDC, https://ngdc.cncb.ac.cn/icg/gene/list, accessed on 8 December 2023), 345 genes are commonly used for internal RT-qPCR normalization [12]. The names of these genes appeared 2618 times in total, and the top three were actin (246, 9.40%), elongation factor (234, 8.94%), and glyceraldehyde-3-phosphate dehydrogenase (82, 6.95%). In previous studies on M. rosenbergii, the commonly used reference genes (actb, eef1a, and gapdh) were traditional reference genes [11,18]. However, no gene could be stable under all conditions. Therefore, it is crucial to select stably expressed reference genes when comparing different samples [8].
We identified male M. rosenbergii at the senescence stage, one of which was natural and the other due to overmating. Compared with normal male M. rosenbergii, their differentially expressed genes were significantly enriched in aging-related signaling pathways. Additionally, both types of aging showed similar tissue damage, including disrupted tight junctions in the hepatopancreatic cells, muscle fibrolysis, and reduced spermatogenic capacity in the testes. In this study, we used the methods of Li et al. [29] and Han et al. [30]. Nine candidate reference genes (rack1, rpl6, rpl9, rps2, rps18, rplp0, eef1b, eif4a, and eif5a) were selected based on 36 transcriptome datasets, which were widely and stably expressed in a variety of tissues with a low coefficient of variation (CV). Three traditional reference genes (actb, gapdh, and eef1a) were selected from previous studies. Four stability assessment methods—GeNorm [25], NormFinder [26], BestKeeper [27], and the Comparative ∆Ct method [28]—are commonly used for selecting reference genes in both animals [4,6,31,32] and plants [33,34]. The RefFinder program integrates these four methods to provide a comprehensive ranking [8]. We used the RefFinder software to evaluate the stability of these 12 genes based on the Ct values obtained by qRT-PCR. The stability ranking of the candidate genes was eif5a > rps18 > rplp0 > eef1a > rpl9 > rack1> rps2 > eef1b > actb > rpl6 > gapdh > eif4a. The results obtained by the various methods in this study were generally similar, and the vast majority of the candidate reference genes screened from the RNA-Seq data were more stable than the conventional reference genes. The combination of eif5a and rps18 was identified as the best reference gene combination for male M. rosenbergii under aging conditions. Eukaryotic translation initiation factors are crucial protein complexes that play a key role in initiating protein synthesis in eukaryotic organisms [35]. Among them, eif5a is widely distributed in archaea and eukaryotes and has remained highly conserved throughout evolution [36]. This factor is known to facilitate peptide chain elongation during the translation process and is typically present in high concentrations within cells [37]. The ribosomal protein S18, which is encoded by the rps18 gene, is a critical component of the ribosome and plays an active role in protein synthesis [38]. Similarly to the present study, rps18 shows high stability in the different life stages of bees [39].
Since the stability of the eif5a and rps18 genes was significantly higher than that of other 10 reference genes, we further compared them with three traditional reference genes under different conditions. The rps18 and eef1a genes were relatively stable, followed by eif5a, in the different tissues of male and female adults of M. rosenbergii. The health of gonadal development significantly impacts subsequent embryo development and juvenile weight, making it a critical focus of breeding programs [40]. The ovaries exhibit significant morphological and gene expression variations across different stages of development [41,42,43]. For the study of ovarian development regulation, eif5a and gapdh were identified as the most suitable reference genes at five distinct stages of ovarian development. The hatching of fertilized eggs is one of the key links in seedling cultivation, and the two most stable reference genes are eif5a and eef1a at the embryonic development stage. The muscle of M. rosenbergii is highly valued for its taste and nutritional content [18]. Faster growth and higher meat yield have long been key traits in breeding programs [17,44]. Temperature is an important environmental factor that affects growth, and the regulation of genes related to muscle growth changes under temperature stress [45,46]. The results of yjr temperature stress experiment showed that the expression level of eif5a in muscle tissue remained highly stable.
In summary, we conducted a comprehensive evaluation of twelve candidate reference genes using RefFinder. Based on the results presented in this study, we recommend the combination of eif5a, rps18, and ef1a for most experimental studies involving M. rosenbergii and advise avoiding gapdh and actb as reference genes whenever possible. The reference genes identified in this study will serve as valuable resources for gene expression analysis in M. rosenbergii.

4. Materials and Methods

4.1. Animals and Experiment Design

M. rosenbergii were hatched in April 2023 in Changxing, China. After approximately 13 months of rearing, individuals with an average size of 14.7 ± 0.6 cm were obtained. The samples consisted of male M. rosenbergii in three distinct physiological states, with each group comprising six biological replicates. The groups were classified according to the following criteria:
Type 1 (Control Group): Individuals exhibited a light-bluish–blue coloration, a shiny exoskeleton, high reactivity, and normal feeding behavior.
Type 2 (Overmating Aging Group): The female M. rosenbergii with ovaries full of the entire cephalothorax were put in and mated with the male. After the female had eggs, the female with eggs was transferred, and new females were added to achieve the purpose of frequent mating. After 30 to 40 mating times, these individuals showed an orangey-blue body color due to the frequent mating, prolonged guarding of females, reduced foraging activity, and shell fading frequency; a less bright exoskeleton color; and even an orange-red tail fan in some cases.
Type 3 (Natural Aging Group): The outer shell was dark, hard, and dull; the head and chest were dark red; and the tail fan was red. Decreased food intake and slow movement were observed. Death usually occurred within a few days of detection.
The tail fan characteristics of the above three types of prawns are shown in Figure A1.
For the temperature treatment experiment, three groups of 30 shrimp each were kept at 18 °C, 25 °C, and 32 °C for 7 days. At least three biological replicates were guaranteed for all the experimental samples.
Adult M. rosenbergii (10.0 ± 0.5 cm) were sampled in the following order: eyestalk, gill, heart, hepatopancreas, gonads (ovary, testis), and finally muscle. According to the state of oocyte development, the ovary was divided into five stages. Embryo samples at eight different stages were collected based on the characteristics of embryo development.

4.2. Histological Observation

Hematoxylin and eosin staining of the muscle tissue was performed. Briefly, tissues were washed thrice with Phosphate Buffer Saline, fixed in Bouin’s solution for less than 24 h, transferred to 4% paraformaldehyde, embedded in paraffin, cut into 4 µm sections, and then stained with hematoxylin and eosin (H&E). The histological changes in muscle tissue were observed by microscopy. The relative number of hepatopancreas and spermatid cells was calculated according to the number of nuclei, and data were obtained from six different views of histological sections for each group.

4.3. RNA Extraction, Sequencing, and Synthesizing cDNA

Immediately after tissue samples were collected, they were frozen in liquid nitrogen and subsequently transferred to an ultra-low-temperature freezer at −80 °C for storage. Samples were thoroughly ground in the presence of added liquid nitrogen, and total RNA was extracted using the RNA isolator total RNA extraction reagent (Vazyme Biotech Co., Ltd., Nanjing, China). RNA-Seq was performed on M. rosenbergii carapace from different groups from Shanghai Meiji Biomedical Technology Co., Ltd., Shanghai, China. Each sample was tested three times. In total, 1 µg RNA was reverse-transcribed using the HiScript III 1st Strand cDNA Synthesis Kit (+gDNA wiper) (Vazyme Biotech Co., Ltd., Nanjing, China). cDNA was diluted to a 10-fold concentration and subsequently stored at −40 °C.

4.4. Selection of Candidate Reference Genes from Transcriptome Data and Primer Design

We followed the criteria described by Li et al. [29] and Han et al. [30] to identify candidate reference genes. Four standards were employed for the selection of reference genes: (I) the gene expression being detectable in muscle, hepatopancreas, testes, and heart tissues; (II) low tissue variance, with a standard deviation of log2(TPM) < 1; (III) the difference between the log2(TPM) of each sample and the mean log2(TPM) being less than 2; (IV) relatively high gene expression, with an average log2(TPM) > 5. Additionally, the stability of the reference genes was further evaluated using the coefficient of variation (CV) value (stdev/mean). In this study, the CV values of the candidate reference genes screened from the transcriptome were all less than 0.1. The primer design followed MIQE guidelines, and the amplification product of each primer pair yielded a single melting peak (Figure A2), reflecting its stability and specificity.

4.5. Real-Time Quantitative PCR (qPCR) Analysis of Gene Expression

The qPCR in this study followed the MIQE guidelines (Minimum Information for Publication of Quantitative Real-Time PCR Experiments) [47]. The total qPCR reaction system comprised 10 µL, containing 1 µL of cDNA at a concentration of 5 ng/µL, 0.5 µL of each complementary pair of primers, and 5 µL of 2 × ChamQ Blue Universal SYBR qPCR Master Mix (Vazyme Biotech Co., Ltd., Nanjing, China). For each sample, experiments were repeated three times. The aforementioned reaction liquids were added to 0.1 mL of a 96-well plate (NEST Biotechnology Co., Ltd., Wuxi, China) under a low-light strip, and the qPCR reaction was performed after brief centrifugation. The reaction was conducted using a fluorescent quantitative PCR system (Roche LightCycler 96, Roche, Switzerland), with the following conditions: 95 °C for 2 min, followed by 95 °C for 10 s and 60 °C for 30 s, for a total of 45 cycles. The 2−△△Ct method was used to calculate the relative expression ratio of the target genes to the reference genes [48].

4.6. Stability Assessment of Reference Genes

The qPCR data were collated to obtain the Ct values of the candidate internal reference genes in different samples of M. rosenbergii, and the stability of the expression of each gene was analyzed separately using the RefFinder online platform, an algorithm that combines four major computational methods, including geNorm, Normfinder, BestKeeper, and the Δ-Ct comparison method. Based on the rankings provided by the different programs, a relatively scientific overall ranking was derived after weighting [8].

Author Contributions

Y.F., H.Z. and Q.G. designed the experiments. Y.F., H.C., X.L., S.B. and C.K. carried out the experiments. Y.X., H.Y., X.Y., Q.G. and Y.F. conducted the statistical analysis and discussion. Y.F. and H.Z. organized and wrote the manuscript. All authors have read and agreed to the published version of the manuscript.

Funding

This study was jointly supported by the Huzhou Science and Technology Program Project (2024GZ40), National Key Research and Development Program of China (2023YFD2401005), Key Scientific and Technological Grant of Zhejiang for Breeding New Agricultural Varieties (2021C02069-4), and Scientific Research Institutes Special Project of Zhejiang Province (2023YSZX002).

Institutional Review Board Statement

This manuscript involves animal experiments, which were reviewed and approved according to the guidelines of the Animal Experiment Committee, Zhejiang Institute of Freshwater Fishery (ZJIFF20210302, 5 July 2023).

Informed Consent Statement

Not applicable.

Data Availability Statement

All data directly related to this paper can be found in the body, Appendix A, or National Center for Biotechnology Information database. The raw rna-seq data can be accessed from the following url: https://www.ncbi.nlm.nih.gov/sra/PRJNA1239913, SRA ID: SRR32798172-SRR32798207.

Acknowledgments

The authors would like to sincerely thank the anonymous reviewers and editors for their constructive comments and help for this article. The authors thank the workers who are responsible for the daily feeding of M. rosenbergii: Si Cong and Li Bo. The authors also thank LIZhen (Sichuan Academy of Agricultural Characteristic Plants) for contributing the analytical tool: RefFinder (http://blooge.cn/RefFinder/, accessed on 12 November 2024).

Conflicts of Interest

The authors declare no conflicts of interest.

Abbreviations

M. rosenbergiiMacrobrachium rosenbergii
RT-qPCRReal-Time Quantitative Reverse Transcription PCR
CtQuantitative Cycle/cycle threshold
rps2Ribosomal protein S2
rack1Receptor for activated protein kinase c1
rpl6Ribosomal protein L6
eef1bEukaryotic translation elongation factor 1β
eif4aEukaryotic translation initiation factor 4a
rpl9Ribosomal protein L9
rps18Ribosomal protein S18
rplp0Ribosomal protein lateral stalk subunit P0
eif5aEukaryotic translation initiation factor 5a
eef1aEukaryotic elongation factor 1α
actbβ-actin
gapdhGlyceraldehyde-3-phosphate dehydrogenase
TPMTranscripts per million
MIQEMinimum Information for Publication of Quantitative Real-Time PCR Experiments

Appendix A

Figure A1. The tail fan characteristics of three types of M. rosenbergii. Scale bar = 1 cm.
Ijms 26 03465 g0a1
Figure A2. The amplification product of each primer pair that yielded a single melting peak.
Ijms 26 03465 g0a2

References

  1. Bustin, S.A. Absolute quantification of mRNA using real-time reverse transcription polymerase chain reaction assays. J. Mol. Endocrinol. 2000, 25, 169–193. [Google Scholar] [CrossRef]
  2. Legnini, I.; Emmenegger, L.; Zappulo, A.; Rybak-Wolf, A.; Wurmus, R.; Martinez, A.O.; Jara, C.C.; Boltengagen, A.; Hessler, T.; Mastrobuoni, G.; et al. Spatiotemporal, optogenetic control of gene expression in organoids. Nat. Methods 2023, 20, 1544–1552. [Google Scholar]
  3. Fan, Y.; Zhang, G.; Zhao, K.; Fu, W.; Chen, S.; Liu, J.; Liu, W.; Peng, L.; Ren, L.; Liu, S. Characteristics of SP600125 Induced Tetraploid Cells in Comparison With Diploid and Tetraploid Cells of Fish. Front. Genet. 2021, 12, 781007. [Google Scholar]
  4. Chen, X.; Sun, Y.; Zhang, P.; Li, J.; Li, H.; Wei, C.; Cao, Z.; Zhou, Y. Screening of stable internal reference genes by quantitative real-time PCR in humpback grouper Cromileptes altivelis. J. Oceanol. Limnol. 2021, 39, 1985–1999. [Google Scholar]
  5. Kumar, D.; Bansal, G.; Narang, A.; Basak, T.; Abbas, T.; Dash, D. Integrating transcriptome and proteome profiling: Strategies and applications. Proteomics 2016, 16, 2533–2544. [Google Scholar]
  6. Liu, W.; Yuan, X.; Yuan, S.; Dai, L.; Dong, S.; Liu, J.; Peng, L.; Wang, M.; Tang, Y.; Xiao, Y. Optimal reference genes for gene expression analysis in polyploid of Cyprinus carpio and Carassius auratus. BMC Genet. 2020, 21, 107. [Google Scholar] [CrossRef]
  7. Hu, Y.; Fu, H.; Qiao, H.; Sun, S.; Zhang, W.; Jin, S.; Jiang, S.; Gong, Y.; Xiong, Y.; Wu, Y. Validation and evaluation of reference genes for quantitative real-time PCR in Macrobrachium Nipponense. Int. J. Mol. Sci. 2018, 19, 2258. [Google Scholar] [CrossRef]
  8. Xie, F.; Wang, J.; Zhang, B. RefFinder: A web-based tool for comprehensively analyzing and identifying reference genes. Funct. Integr. Genom. 2023, 23, 125. [Google Scholar] [CrossRef]
  9. Dhar, A.K.; Bowers, R.M.; Licon, K.S.; Veazey, G.; Read, B. Validation of reference genes for quantitative measurement of immune gene expression in shrimp. Mol. Immunol. 2009, 46, 1688–1695. [Google Scholar] [CrossRef]
  10. Mo, Y.; Fan, Y.; Fu, W.; Xu, W.; Chen, S.; Wen, Y.; Liu, S.; Peng, L.; Xiao, Y. Acute immune stress improves cell resistance to chemical poison damage in SP600125-induced polyploidy of fish cells in vitro. Fish Shellfish Immunol. 2019, 84, 656–663. [Google Scholar] [CrossRef]
  11. Krishna, G.; Marappan, M.; Chaudhari, A. Characterization and Evaluation of Selected Housekeeping Genes for Quantitative RT-PCR in Macrobrachium rosenbergii Morphotypes. Fish. Technol. 2015, 52, 177–183. [Google Scholar]
  12. Sang, J.; Wang, Z.; Li, M.; Cao, J.; Niu, G.; Xia, L.; Zou, D.; Wang, F.; Xu, X.; Han, X.; et al. ICG: A wiki-driven knowledgebase of internal control genes for RT-qPCR normalization. Nucleic Acids Res. 2017, 46, D121–D126. [Google Scholar] [CrossRef]
  13. Mao, H.; Chen, X.; Zhu, X.; Luo, Q.; Zhao, J.; Li, X.; Wu, H.; Xu, H. Identification of suitable reference genes for quantitative real-time PCR normalization in blotched snakehead Channa maculata. J. Fish Biol. 2017, 90, 2312–2322. [Google Scholar] [CrossRef]
  14. Zhang, G.; Tang, L.; Huang, J.; Wang, Y.; Wang, H.; Fan, Y.; Yuan, X.; Liu, W.; Peng, L.; Liu, J. Formation of asymmetric body color in the caudal fin of common carp (Cyprinus carpio). Aquaculture 2023, 577, 739970. [Google Scholar] [CrossRef]
  15. Hawkins, L.J.; Luu, B.E.; Storey, K.B. Selection of reference genes for accurate RT-qPCR analysis of dehydration tolerance in Xenopus laevis. Gene Rep. 2018, 13, 192–198. [Google Scholar] [CrossRef]
  16. Valenzuela-Castillo, A.; Mendoza-Cano, F.; Enríquez-Espinosa, T.; Grijalva-Chon, J.M.; Sánchez-Paz, A. Selection and validation of candidate reference genes for quantitative real-time PCR studies in the shrimp Penaeus vannamei under viral infection. Mol. Cell. Probes 2017, 33, 42–50. [Google Scholar] [CrossRef]
  17. Pillai, B.R.; Ponzoni, R.W.; Das Mahapatra, K.; Panda, D. Genetic improvement of giant freshwater prawn Macrobrachium rosenbergii: A review of global status. Rev. Aquac. 2022, 14, 1285–1299. [Google Scholar] [CrossRef]
  18. Li, X.; Xu, B.; Shen, P.; Cheng, H.; Fan, Y.; Gao, Q. Regulation and Response Mechanism of Acute Low-Salinity Stress during Larval Stages in Macrobrachium rosenbergii Based on Multi-Omics Analysis. Int. J. Mol. Sci. 2024, 25, 6809. [Google Scholar] [CrossRef]
  19. Hooper, C.; Debnath, P.P.; Stentiford, G.D.; Bateman, K.S.; Salin, K.R.; Bass, D. Diseases of the giant river prawn Macrobrachium rosenbergii: A review for a growing industry. Rev. Aquac. 2023, 15, 738–758. [Google Scholar] [CrossRef]
  20. Zhan, F.; Li, Y.; Shi, F.; Lu, Z.; Yang, M.; Li, Q.; Lin, L.; Qin, Z. Transcriptome analysis of Macrobrachium rosenbergii hemocytes reveals in-depth insights into the immune response to Vibrio parahaemolyticus infection. Fish Shellfish Immunol. 2023, 133, 108533. [Google Scholar] [CrossRef]
  21. Wang, J.; Yang, G.; Kong, J.; Xia, Z.; Sui, J.; Tang, Q.; Luo, K.; Dai, P.; Meng, X.; Chen, L. An analysis on genetic variation of threshold traits of female and male morphotypes in Macrobrachium rosenbergii. Oceanol. Limnol. Sin. 2022, 53, 710–717. [Google Scholar]
  22. Sui, J.; Luan, S.; Yang, G.; Xia, Z.; Tang, Q.; Luo, K.; Meng, X.; Kong, J. Effects of the individual rearing stage on the growth traits of candidate giant freshwater prawns (Macrobrachium rosenbergii). Aquac. Int. 2022, 30, 1659–1673. [Google Scholar] [CrossRef]
  23. Phuc, T.H.; Vu, N.T.; Nga, N.T.K.; Ky, N.T.; Nguyen, N.H. Assessment of a long-term selective breeding program for giant freshwater prawn Macrobrachium rosenbergii since 2007. Aquaculture 2021, 541, 736745. [Google Scholar] [CrossRef]
  24. Xie, F.; Xiao, P.; Chen, D.; Xu, L.; Zhang, B. miRDeepFinder: A miRNA analysis tool for deep sequencing of plant small RNAs. Plant Mol. Biol. 2012, 80, 75–84. [Google Scholar] [CrossRef]
  25. Vandesompele, J.; De Preter, K.; Pattyn, F.; Poppe, B.; Van Roy, N.; De Paepe, A.; Speleman, F. Accurate normalization of real-time quantitative RT-PCR data by geometric averaging of multiple internal control genes. Genome Biol. 2002, 3, research0034.1. [Google Scholar]
  26. Andersen, C.L.; Jensen, J.L.; Ørntoft, T.F. Normalization of real-time quantitative reverse transcription-PCR data: A model-based variance estimation approach to identify genes suited for normalization, applied to bladder and colon cancer data sets. Cancer Res. 2004, 64, 5245–5250. [Google Scholar]
  27. Pfaffl, M.W.; Tichopad, A.; Prgomet, C.; Neuvians, T.P. Determination of stable housekeeping genes, differentially regulated target genes and sample integrity: BestKeeper–Excel-based tool using pair-wise correlations. Biotechnol. Lett. 2004, 26, 509–515. [Google Scholar]
  28. Silver, N.; Best, S.; Jiang, J.; Thein, S.L. Selection of housekeeping genes for gene expression studies in human reticulocytes using real-time PCR. BMC Mol. Biol. 2006, 7, 33. [Google Scholar] [CrossRef]
  29. Li, Y.; Zhang, L.; Li, R.; Zhang, M.; Li, Y.; Wang, H.; Wang, S.; Bao, Z. Systematic identification and validation of the reference genes from 60 RNA-Seq libraries in the scallop Mizuhopecten yessoensis. BMC Genom. 2019, 20, 288. [Google Scholar]
  30. Han, P.; Chen, J.; Sun, Z.; Ren, S.; Wang, X. Evaluation of reference genes for gene expression analysis in Japanese flounder (Paralichthys olivaceus) under temperature stress. BMC Genom. 2025, 26, 117. [Google Scholar] [CrossRef]
  31. Jia, L.; Hui, D.; Tao, L.; Cheng, C.; Ying, Y.; Tianqiang, L.; Lei, L.; Erlong, W. Accurate reflection of hepatopancreas antioxidation and detoxification in Procambarus clarkii during virus infection and drug treatment: Reference gene selection, evaluation and expression analysis. Aquaculture 2022, 556, 738283. [Google Scholar]
  32. Mi, L.Y.; Hayoung, C.; Ok, K.R.; Soyeon, I.; Joo, K.S.; Ji, W.E. Validation of reference genes for quantitative real-time PCR in chemical exposed and at different age’s brackish water flea Diaphanosoma celebensis. Sci. Rep. 2021, 11, 23691. [Google Scholar]
  33. Sonia, T.; Carmen, L.; Lalia, M.; Emmanouil, F.; Carlos, I. Selection and validation of reference genes for quantitative real-time PCR in the green microalgae Tetraselmis chui. PLoS ONE 2021, 16, e0245495. [Google Scholar]
  34. Li, G.; Xu, G.; Lin, Z.; Li, H.; Liu, Z.; Xu, Y.; Zhang, H.; Ji, R.; Luo, W.; Qiu, Y.; et al. Selection of suitable reference genes for RT-qPCR normalisation in sweet potato (Ipomoea batatas L.) under different stresses. J. Hortic. Sci. Biotechnol. 2021, 96, 209–219. [Google Scholar]
  35. Tauc, M.; Cougnon, M.; Carcy, R.; Melis, N.; Hauet, T.; Pellerin, L.; Blondeau, N.; Pisani, D. The eukaryotic initiation factor 5A (eIF5A1), the molecule, mechanisms and recent insights into the pathophysiological roles. Cell Biosci. 2021, 11, 219. [Google Scholar] [CrossRef]
  36. Wolff, E.C.; Kang, K.R.; Kim, Y.S.; Park, M.H. Posttranslational synthesis of hypusine: Evolutionary progression and specificity of the hypusine modification. Amino Acids 2007, 33, 341–350. [Google Scholar] [CrossRef]
  37. Hukelmann, J.L.; Anderson, K.E.; Sinclair, L.V.; Grzes, K.M.; Cantrell, D.A. The cytotoxic T cell proteome and its shaping by the kinase mTOR. Nat. Immunol. 2015, 17, 104. [Google Scholar] [CrossRef]
  38. Moreira, V.S.; Soares, V.L.F.; Silva, R.J.S.; Sousa, A.O.; Otoni, W.C.; Costa, M.G.C. Selection and validation of reference genes for quantitative gene expression analyses in various tissues and seeds at different developmental stages in Bixa orellana L. Physiol. Mol. Biol. Plants 2018, 24, 369–378. [Google Scholar] [CrossRef]
  39. Xu, J.; Welker, D.L.; James, R.R. Variation in Expression of Reference Genes across Life Stages of a Bee, Megachile rotundata. Insects 2021, 12, 36. [Google Scholar] [CrossRef]
  40. Tan, K.; Wang, W. The early life culture and gonadal development of giant freshwater prawn, Macrobrachium rosenbergii: A review. Aquaculture 2022, 559, 738357. [Google Scholar] [CrossRef]
  41. Song, J.; Jian, Y.; Xie, Y.; Liang, J.; Shao, C.; Pan, X.; Chen, Z.; Gao, Q.; Kong, Y.; Xu, Q. The Dietary Lipid Requirement for Ovarian Maturation and Health in Female Giant River Prawn, Macrobrachium rosenbergii Broodstock. Aquac. Nutr. 2024, 2024, 7462841. [Google Scholar] [CrossRef]
  42. Jian, Y.; Song, J.; Chen, Z.; Kong, Y.; Qi, C.; Ding, Z.; Xu, Q. Positive effects of a mixture of fish oil and soybean oil as a dietary lipid source on the ovarian development and health of female giant river prawn, Macrobrachium rosenbergii broodstock. Aquac. Rep. 2024, 39, 102407. [Google Scholar] [CrossRef]
  43. Tinikul, Y.; Tinikul, R.; Engsusophon, A.; Sobhon, P. The effects of short neuropeptide F on ovarian maturation and spawning in female giant freshwater prawn, Macrobrachium rosenbergii, and associated regulatory mechanisms. Aquaculture 2023, 569, 739361. [Google Scholar] [CrossRef]
  44. Pillai, B.R.; Panda, D. Global Status of Giant Prawn, Macrobrachium rosenbergii Farming with Special Reference to India and Measures for Enhancing Production. J. Aquac. 2024, 33, 1–14. [Google Scholar] [CrossRef]
  45. Tu, H.; Peng, X.; Yao, X.; Tang, Q.; Xia, Z.; Li, J.; Yang, G.; Yi, S. Integrated transcriptomic and metabolomic analyses reveal low-temperature tolerance mechanism in giant freshwater prawn Macrobrachium rosenbergii. Animals 2023, 13, 1605. [Google Scholar] [CrossRef]
  46. Xing, Q.; Tu, H.; Yang, M.; Chen, G.; Tang, Q.; Yi, S.; Gao, Q.; Ibrahim, S.; Liu, Y.; Xia, Z. Evaluation of cold tolerance and gene expression patterns associated with low-temperature stress in giant freshwater prawn Macrobrachium rosenbergii. Aquac. Rep. 2022, 24, 101172. [Google Scholar] [CrossRef]
  47. Bustin, S.A.; Benes, V.; Garson, J.A.; Hellemans, J.; Huggett, J.; Kubista, M.; Mueller, R.; Nolan, T.; Pfaffl, M.W.; Shipley, G.L. The MIQE Guidelines: Minimum Information for Publication of Quantitative Real-Time PCR Experiments. Clin. Chem. 2009, 55, 611–622. [Google Scholar] [CrossRef]
  48. Livak, K.J.; Schmittgen, T.D. Analysis of relative gene expression data using real-time quantitative PCR and the 2−ΔΔCT method. Methods 2001, 25, 402–408. [Google Scholar] [CrossRef]
Figure 1. Histological sections of hepatopancreas, muscle, and testicle of male M. rosenbergii in three different physiological states.
Ijms 26 03465 g001
Figure 2. KEGG enrichment pathways of significantly different genes in muscle. (A) Natural Aging Group compared with Control Group. (B) Overmating Aging Group compared with Control Group.
Ijms 26 03465 g002
Figure 3. Statistical analysis was performed based on histological sections of hepatopancreas (40× microscope) and testes (80× microscope). (A) Relative number of hepatopancreatic cells; (B) relative number of spermatids. *: p < 0.05; **: p < 0.01; ***: p < 0.001.
Ijms 26 03465 g003
Figure 4. Gene numbers after applying the four screening criteria to M. rosenbergii transcriptome data: (a) TPM > 0; (b) standard deviation of log2(TPM) < 1; (c) the difference between log2(TPM) and the mean log2(TPM) less than two; (d) mean log2(TPM) > 5.
Ijms 26 03465 g004
Figure 5. The expression stability of nine new candidate genes and three previously reported reference genes in Macrobrachium rosenbergii was assessed based on RNA-seq data. The boxplot illustrates the log2(TPM) values of these genes across 36 transcriptomes.
Ijms 26 03465 g005
Figure 6. The expression stability of the new candidate genes and reported reference genes was evaluated based on the RT-qPCR results. The boxplot displays the Ct values of nine new candidate genes and three previously reported reference genes.
Ijms 26 03465 g006
Figure 7. Based on the cycle threshold (Cq) data obtained from RT-qPCR, stability was evaluated using geNorm, NormFinder, BestKeeper, ΔCt, and a comprehensive ranking. Lower values indicate better gene stability.
Ijms 26 03465 g007
Figure 8. Comprehensive ranking of the reference genes under different conditions by RefFinder.
Ijms 26 03465 g008
Table 1. Detail information on nine selected candidate reference genes and three commonly used reference genes.
Gene NameDescriptionMeanStdevCV Value
rps2ribosomal protein S29.20 0.57 0.062
rack1receptor for activated protein kinase c17.99 0.65 0.081
rpl6ribosomal protein L68.94 0.73 0.082
eef1beukaryotic translation elongation factor 1β8.41 0.71 0.084
eif4aeukaryotic translation initiation factor 4a6.11 0.53 0.087
rpl9ribosomal protein L98.62 0.75 0.087
rps18ribosomal protein S189.17 0.87 0.095
rplp0ribosomal protein lateral stalk subunit P07.57 0.72 0.095
eif5aeukaryotic translation initiation factor 5a6.02 0.60 0.099
eef1aeukaryotic elongation factor 1α10.32 1.06 0.103
actbβ-actin9.77 3.42 0.350
gapdhglyceraldehyde-3-phosphate dehydrogenase8.55 2.10 0.246
Table 2. Primer pairs for qPCR of candidate reference genes.
GenePrimer Sequence (5′–3′)Length (bp)PCR Efficiency (%)Correlation Coefficient
Forward/Reverse
rps18TACCTACGACCCACACCCTT13798.0 0.99
TATCAACGCACCGCCAAGAT
rack1TGTTTGGCCATCTGCAGACC17797.5 1.00
CTTTGCTTCAGTCCCAACCG
rps2GCACGTGTCTGTTTCTGGAC17697.5 1.00
TGGGTGCCAATCACCAAACT
rplp0ACATGTTGAGAAGCGTGGCT16396.0 1.00
CCTGCCCAGAACACTGGATT
eif4aTCACCACAGACTTGCTTGCT11895.0 1.00
AAACGTCCACCACGTCCAAT
eef1bGGCACTTTTCTTTGCAGCGT17894.0 1.00
AGCCGAGAAGTCCAAGTTCC
rpl6CAAGTACGCACGAAGAAGCG10796.5 1.00
AAAGACTTGCGGAGAGGAGC
rpl9AAACCGCAAGGAGGTAGCTG10698.0 1.00
AGCGTATACAGCACGCATCT
eif5aCATGGATGTACCTGTAGTGAAAC179104.0 0.98
CTGTCAGCAGAAGGTCCTCATTA
actbACCACCATGTACCCAGGAATCGCTG133101.5 0.98
CCAAGATTGAACCGCCGATCCAG
eef1aACTGCGCTGTGTTGATTGTAGCTG90101.5 1.00
ACAACAGTACGTGTTCACGGGTCT
gapdhTGAAGCCCGAGAACATTCCATG170104.0 1.00
GTTCACGCCGCAGACGAACATG
Disclaimer/Publisher’s Note: The statements, opinions and data contained in all publications are solely those of the individual author(s) and contributor(s) and not of MDPI and/or the editor(s). MDPI and/or the editor(s) disclaim responsibility for any injury to people or property resulting from any ideas, methods, instructions or products referred to in the content.

