
Peripheral Kynurenine Pathway Metabolites in Patients with Psoriasis

 ,
,  , ,
, ,  and
and 
Abstract
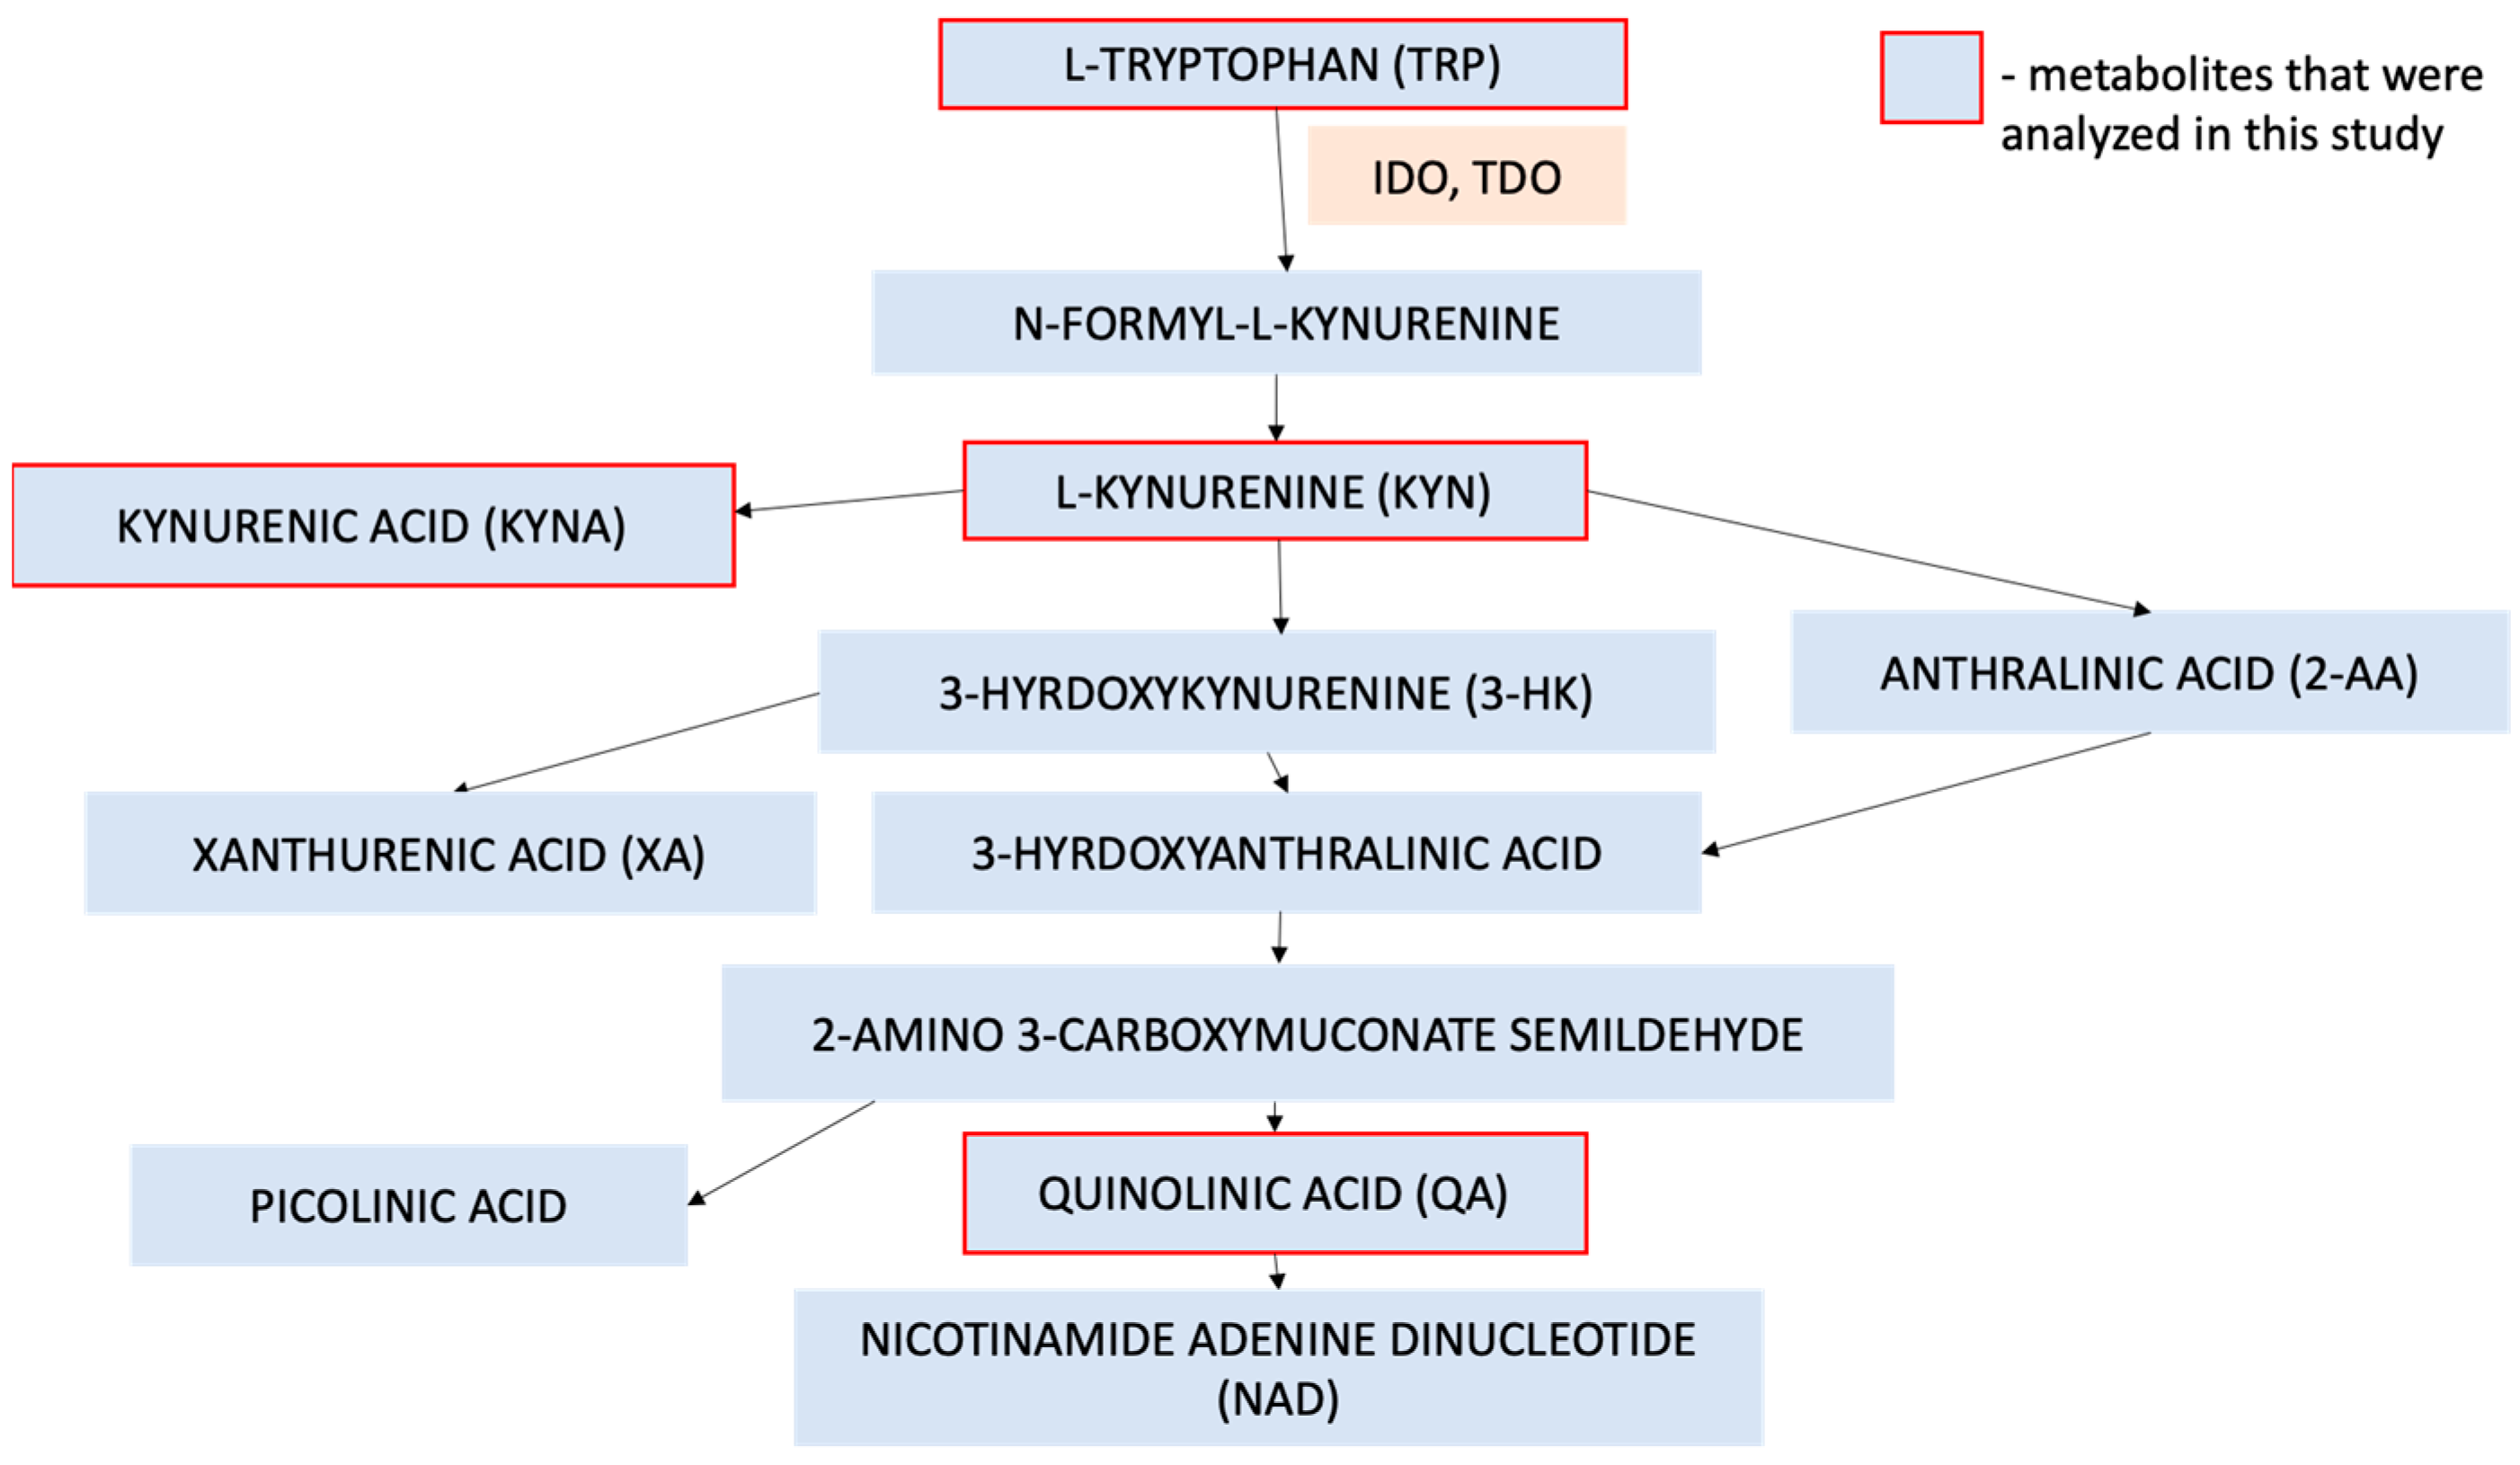
1. Introduction
2. Results
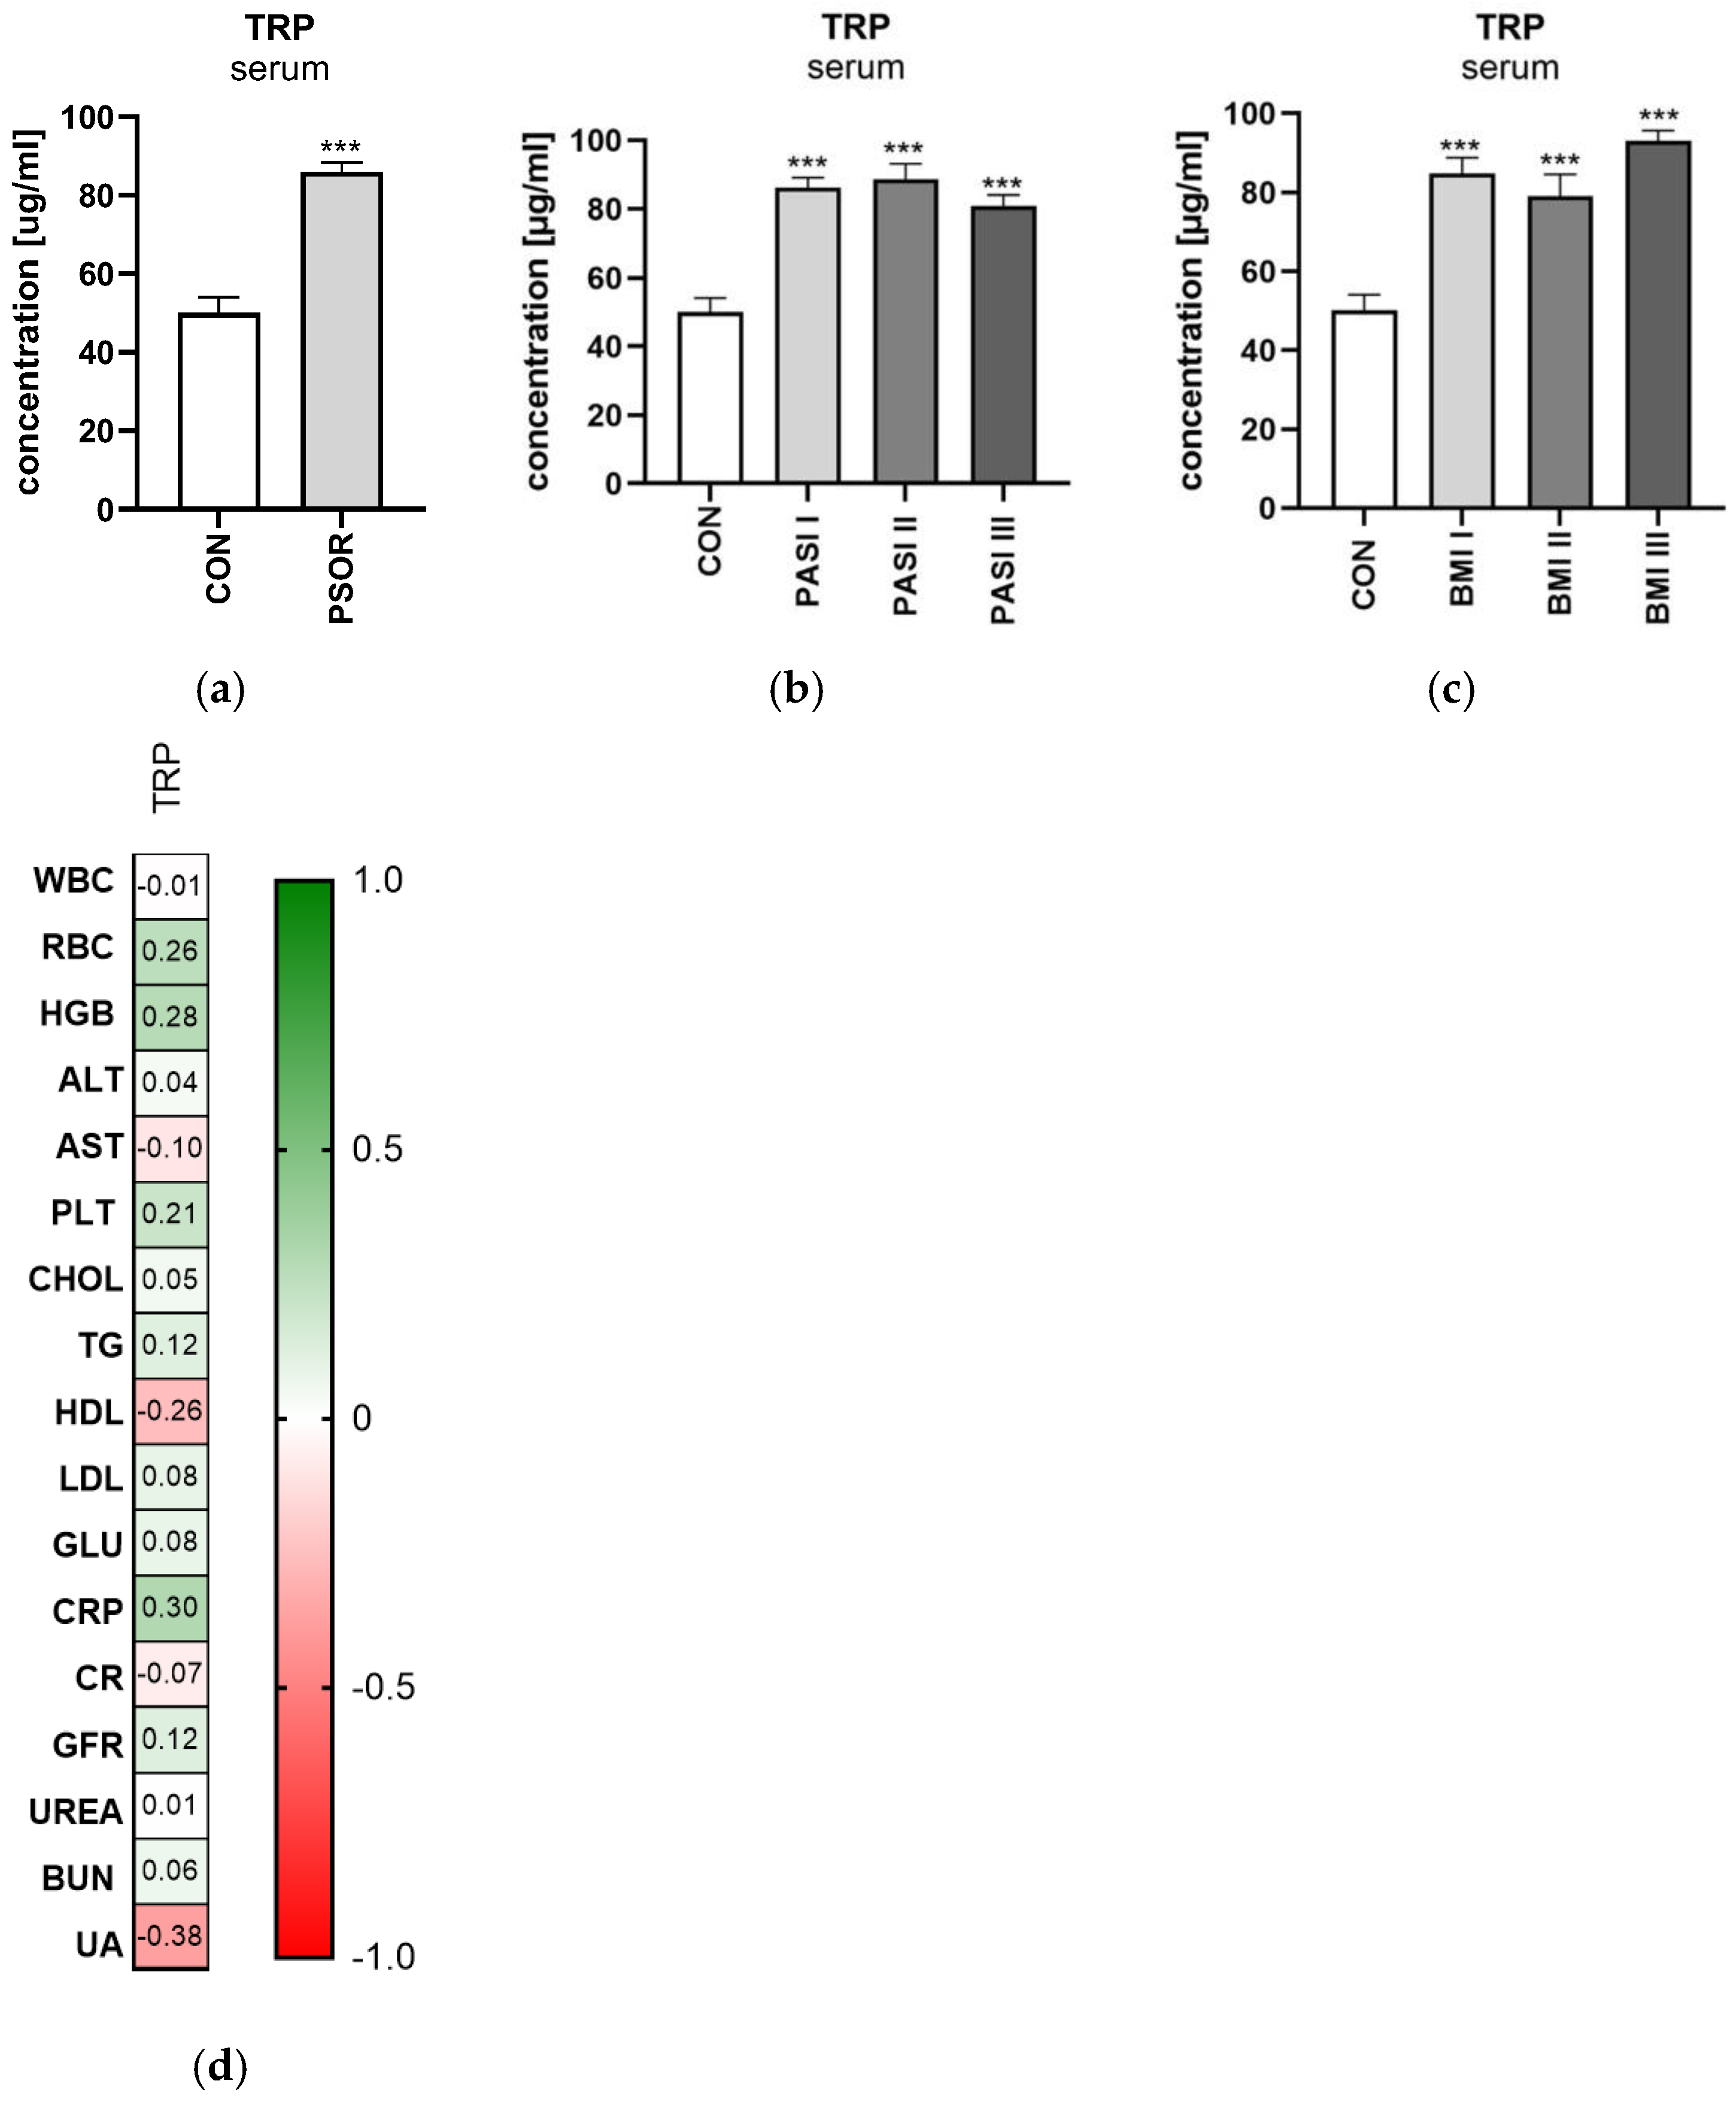
2.1. Tryptophan
2.1.1. Serum Tryptophan
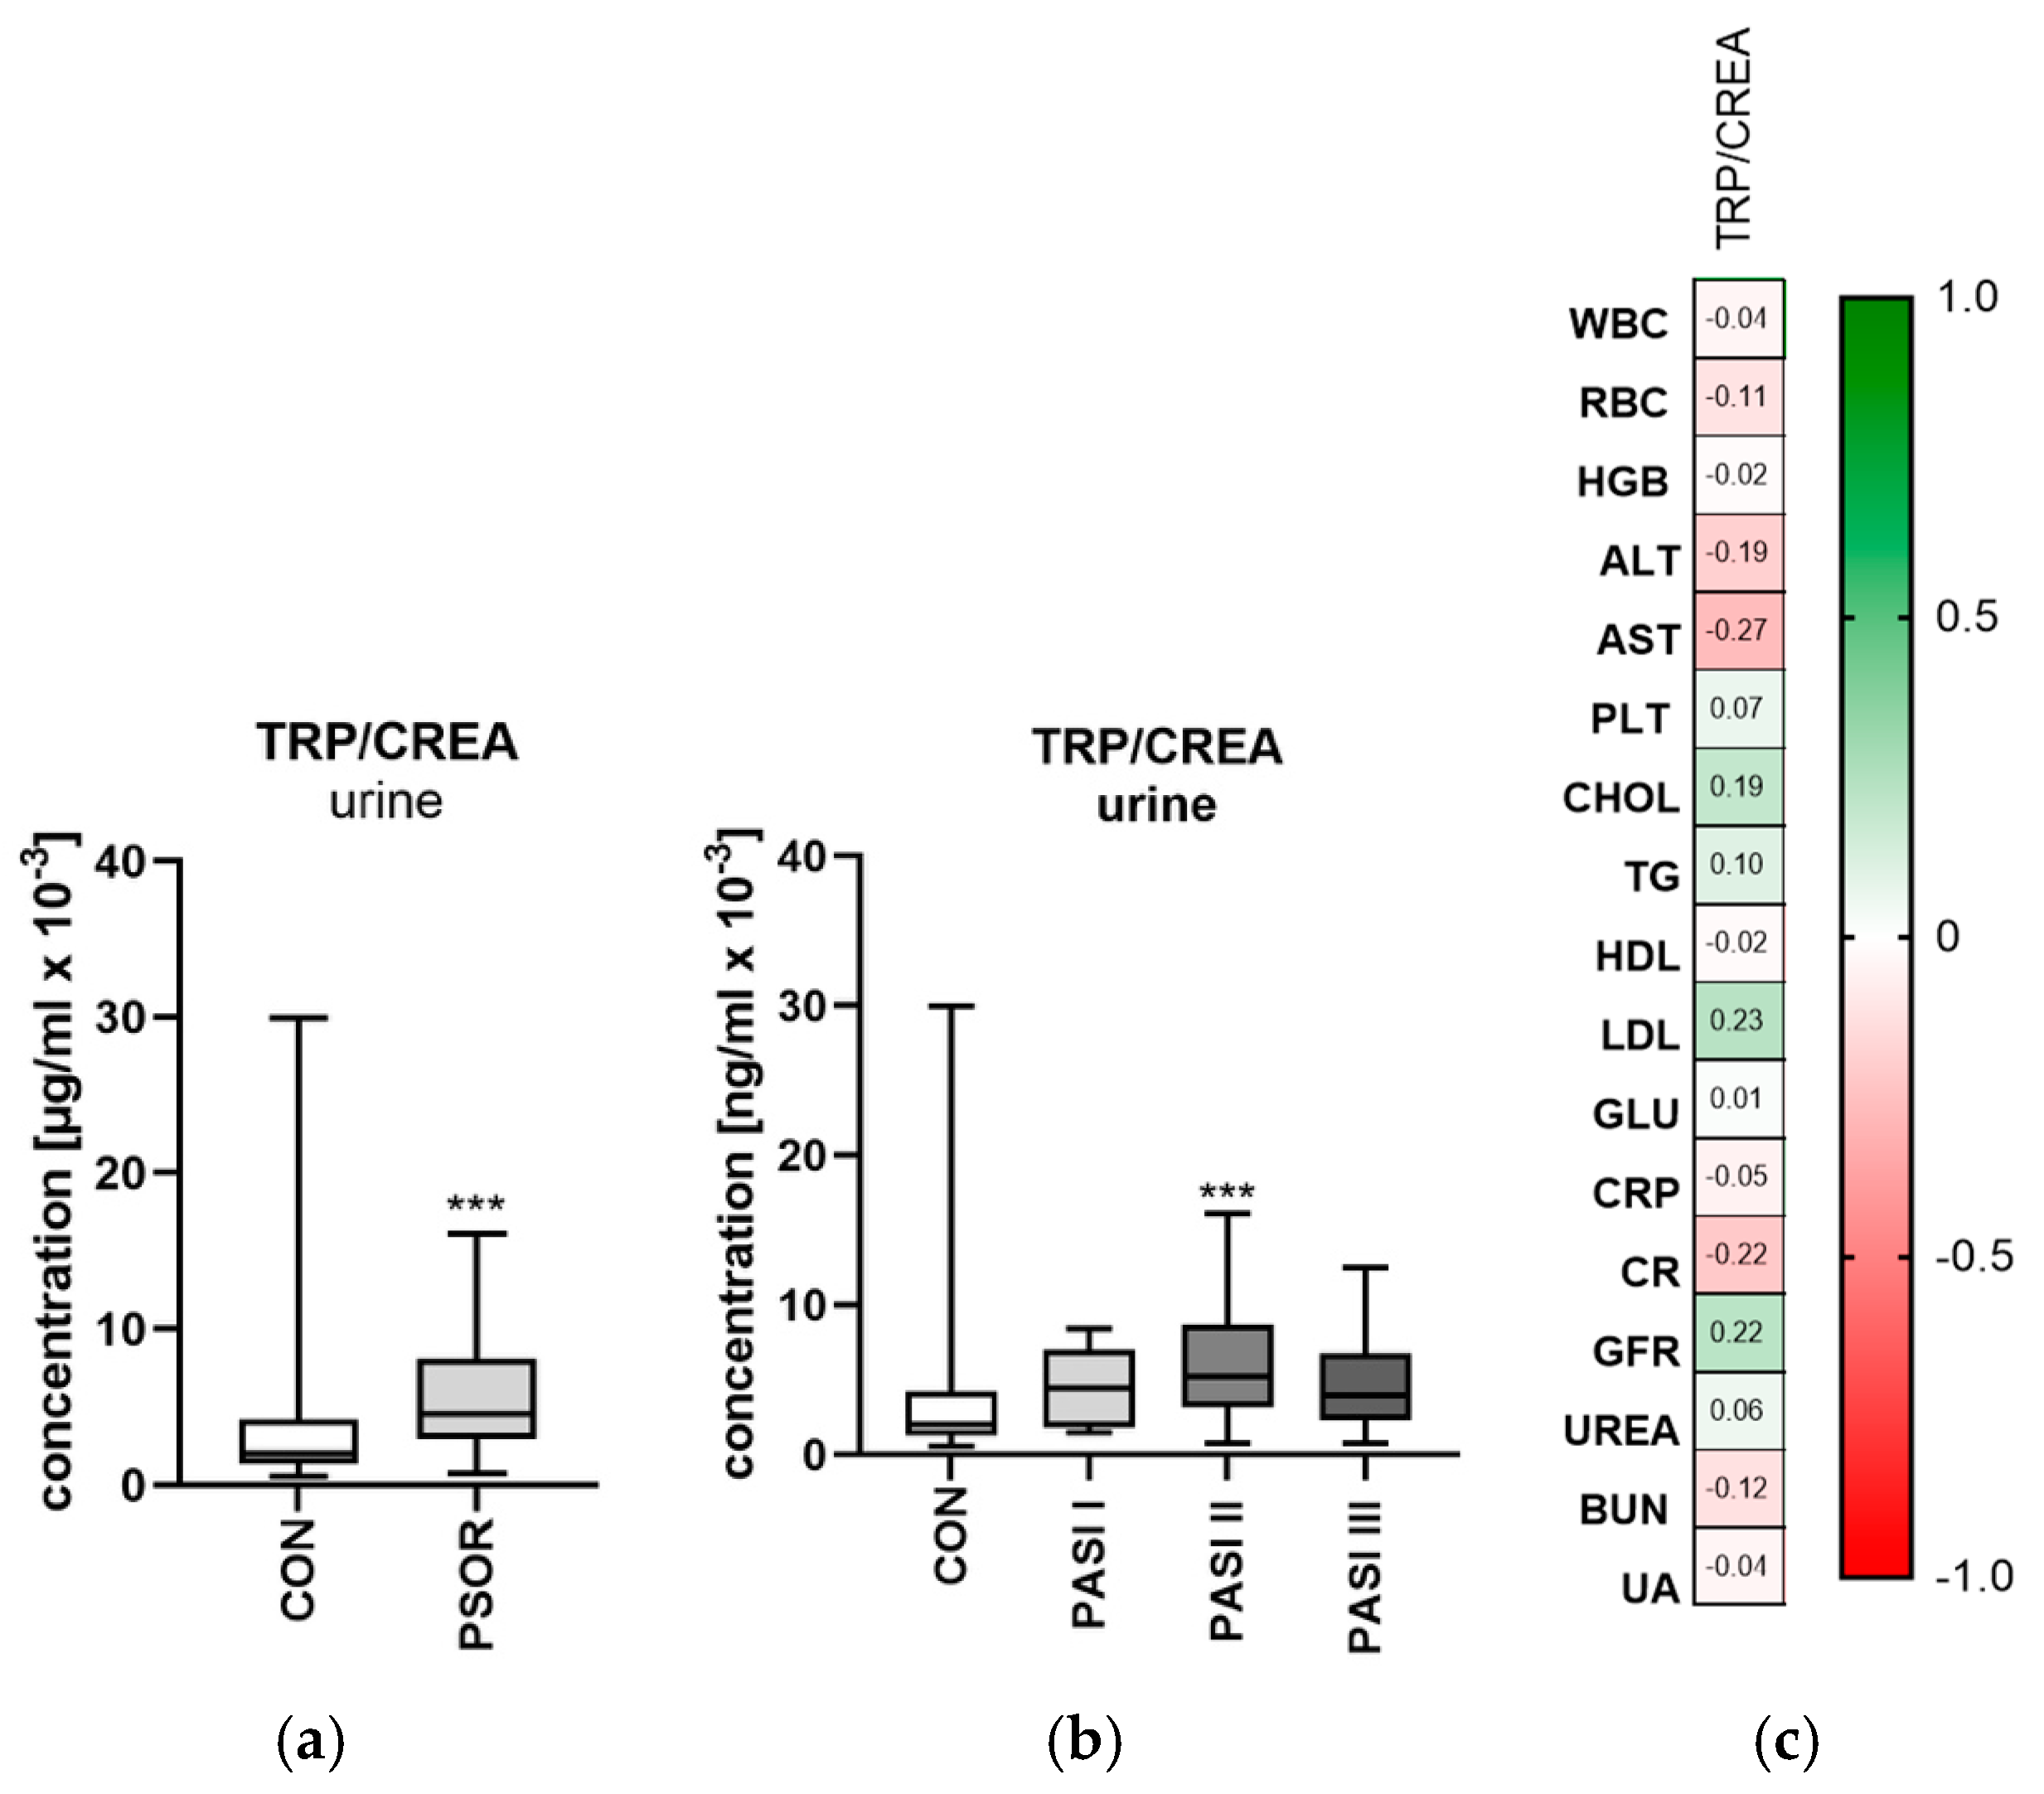
2.1.2. Urinary Tryptophan/Creatinine Ratio Concentration
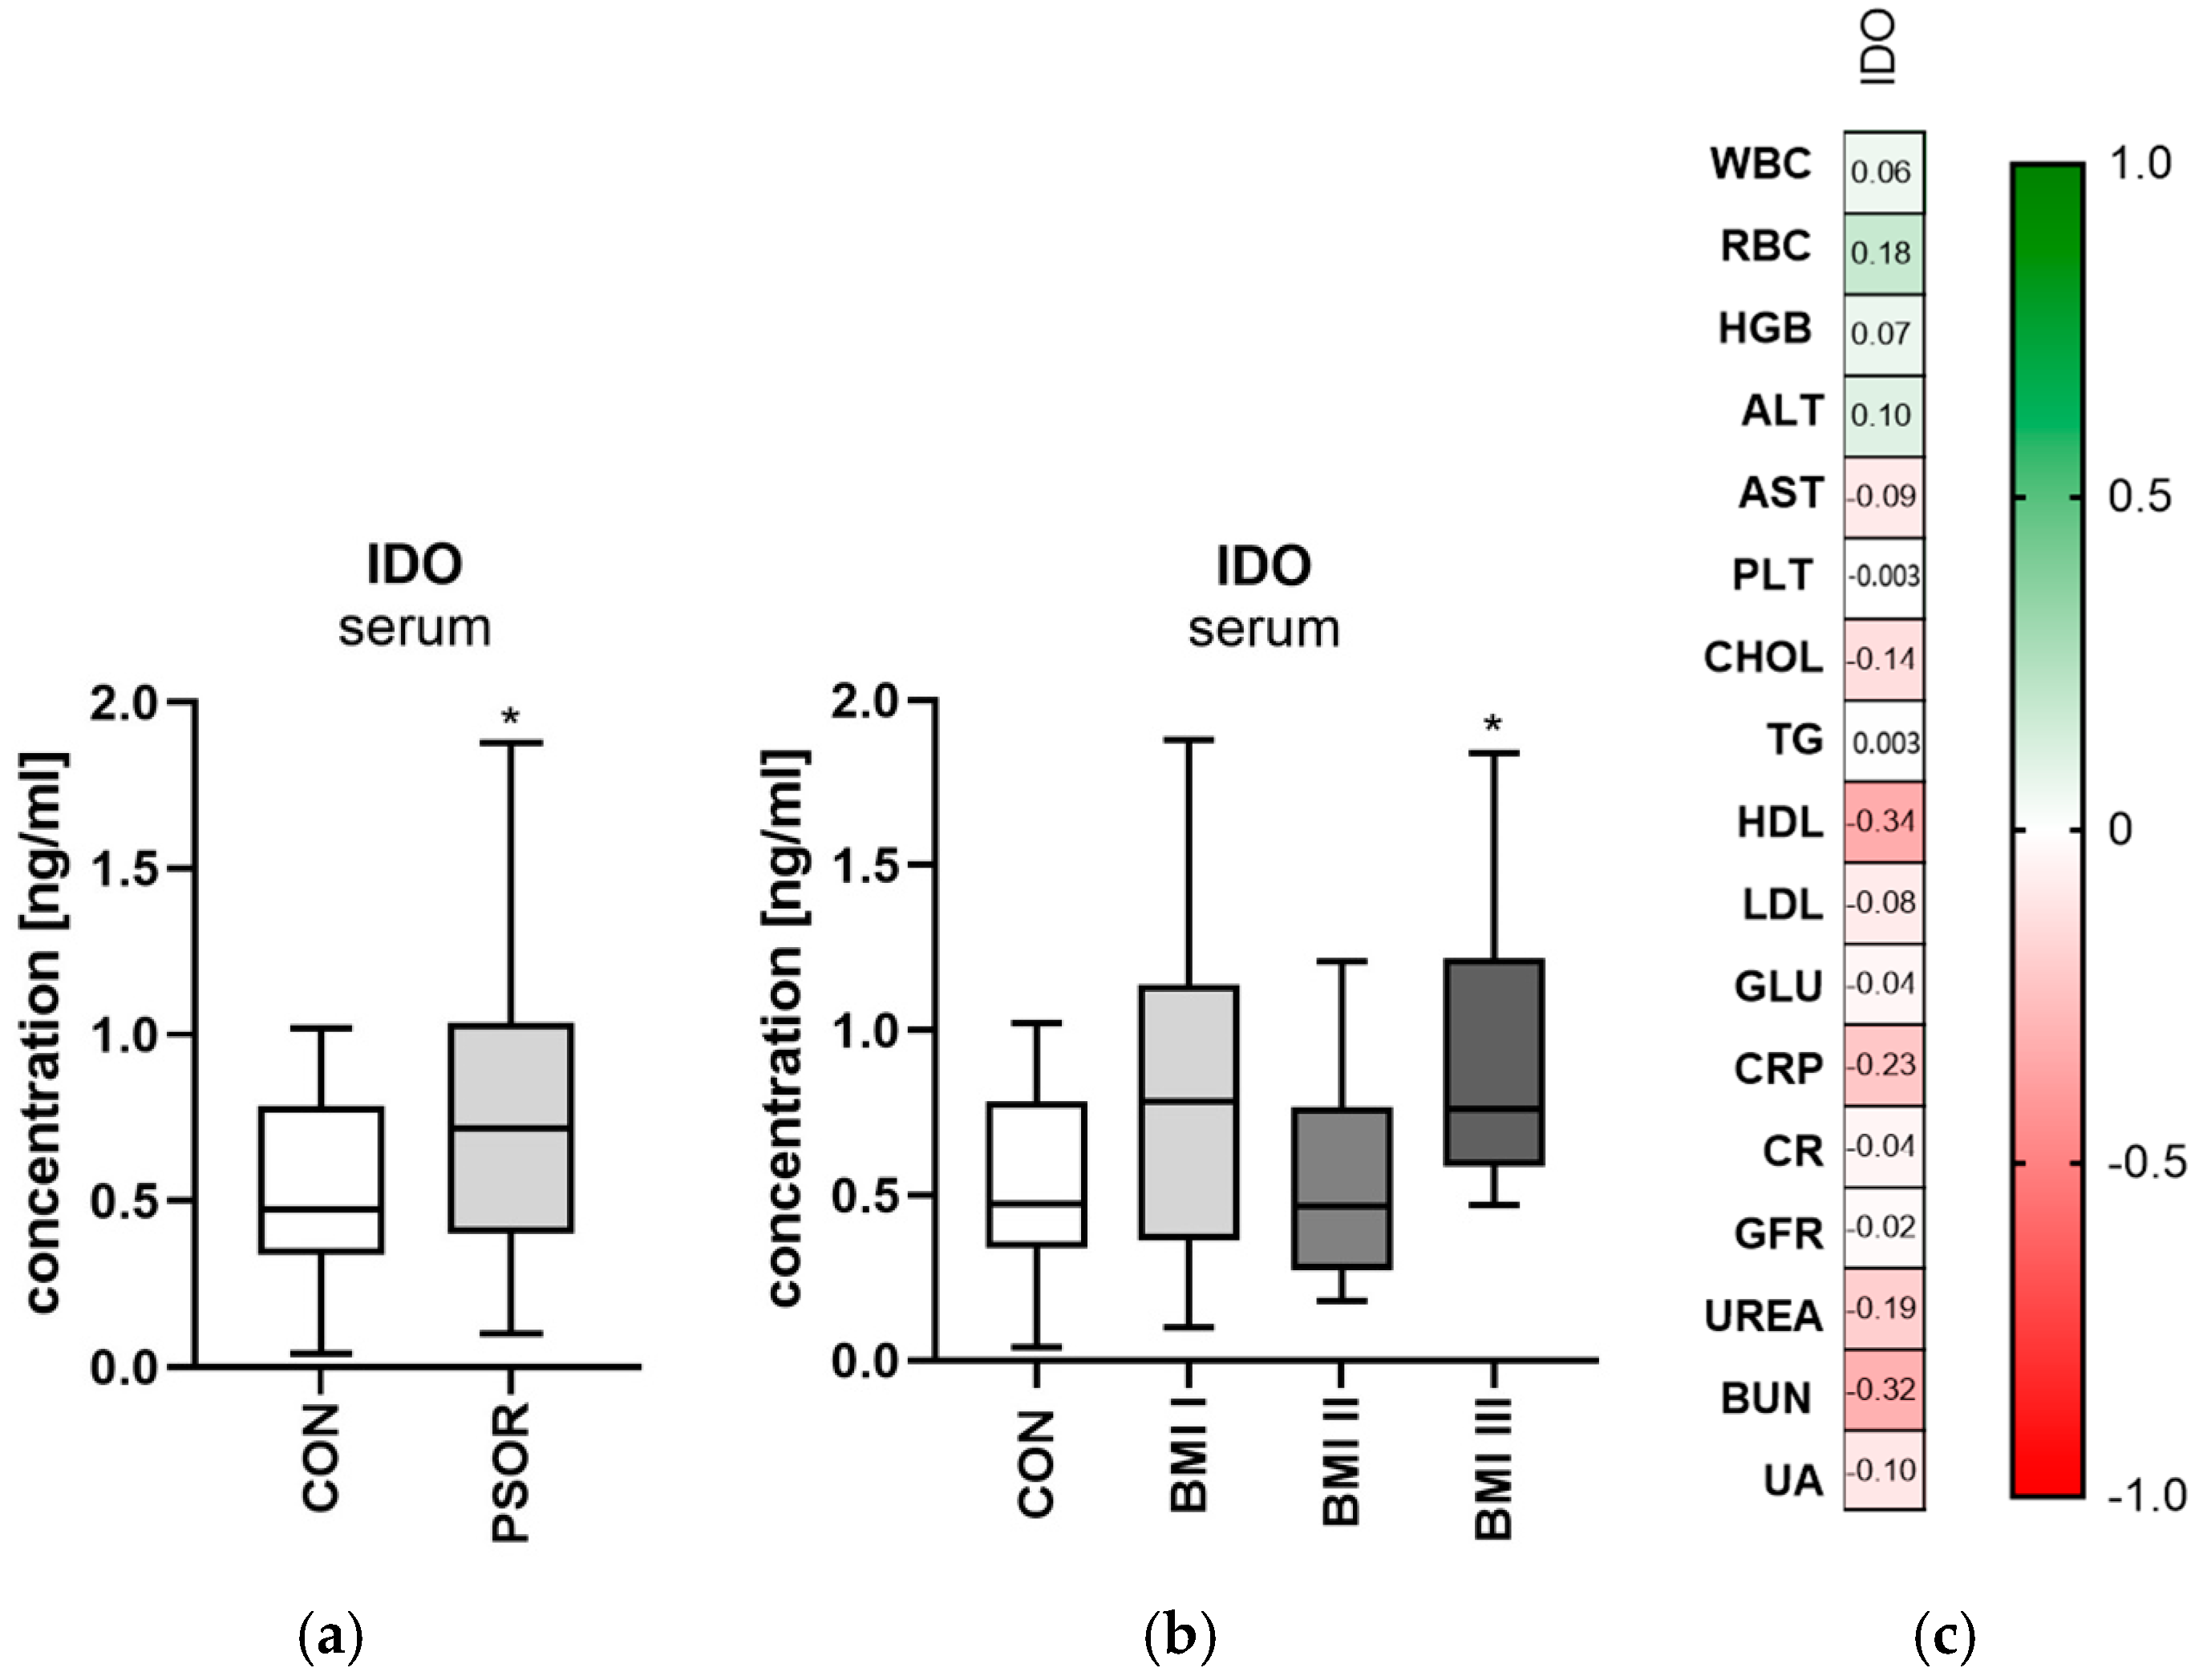
2.2. Indoleamine 2,3-Dioxygenase
2.2.1. Serum Indoleamine 2,3-Dioxygenase
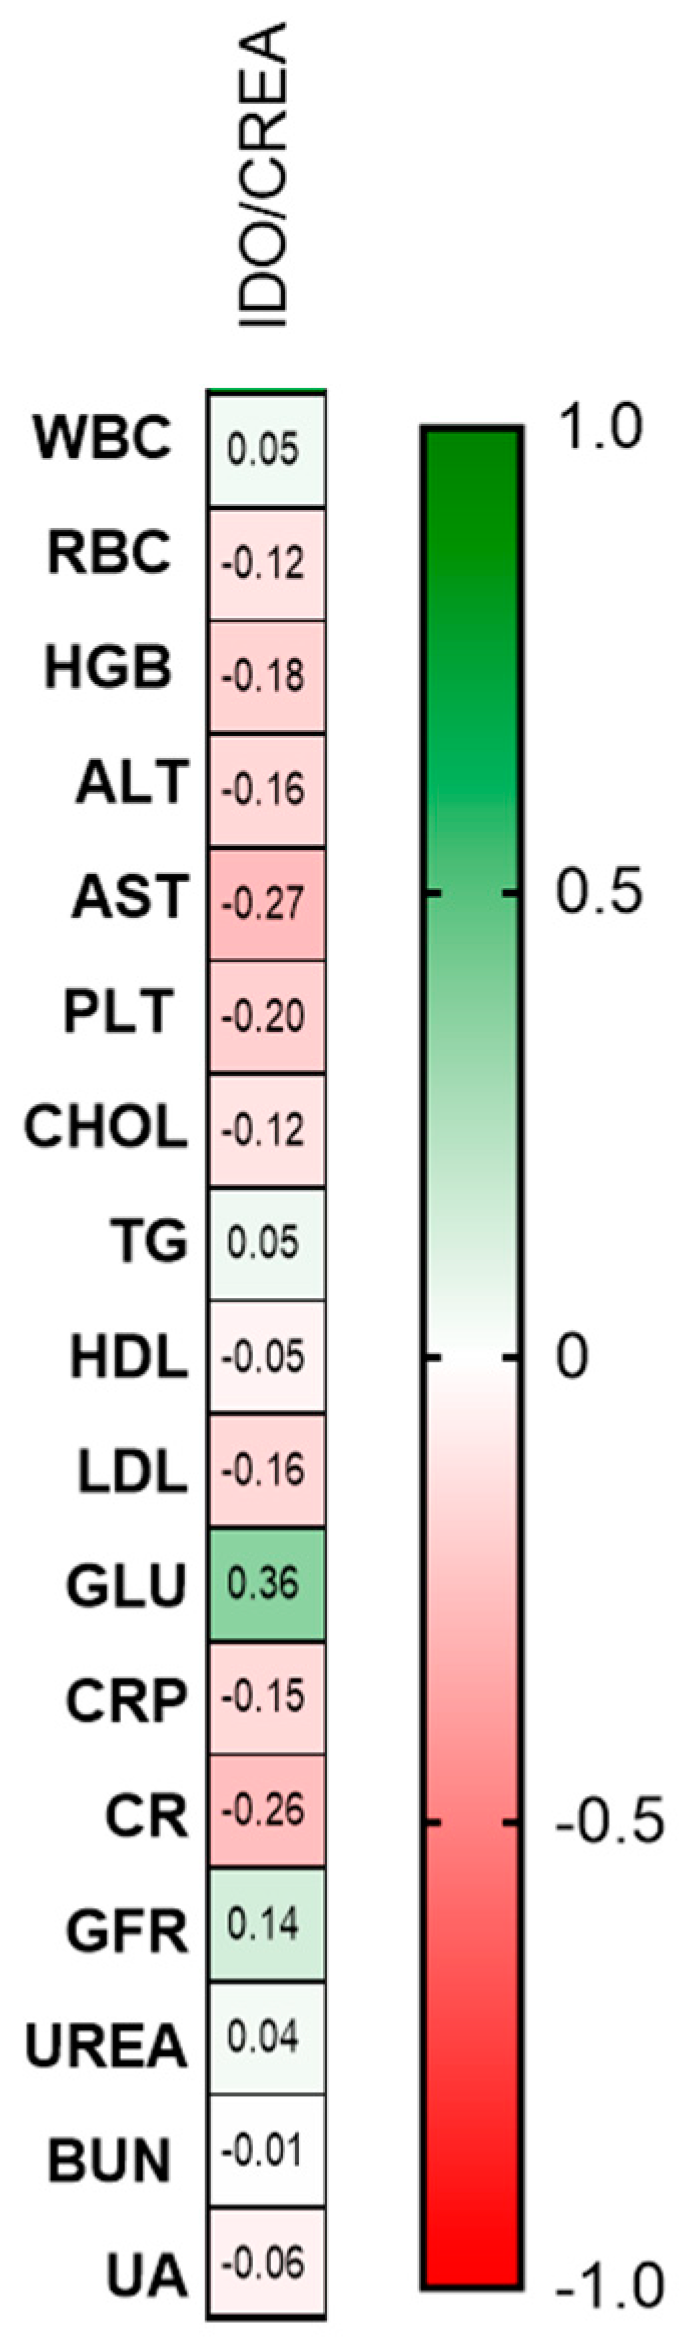
2.2.2. Urinary Indoleamine 2,3-Dioxygenase/Creatinine Ratio Concentration
2.3. Tryptophan 2,3-Dioxygenase
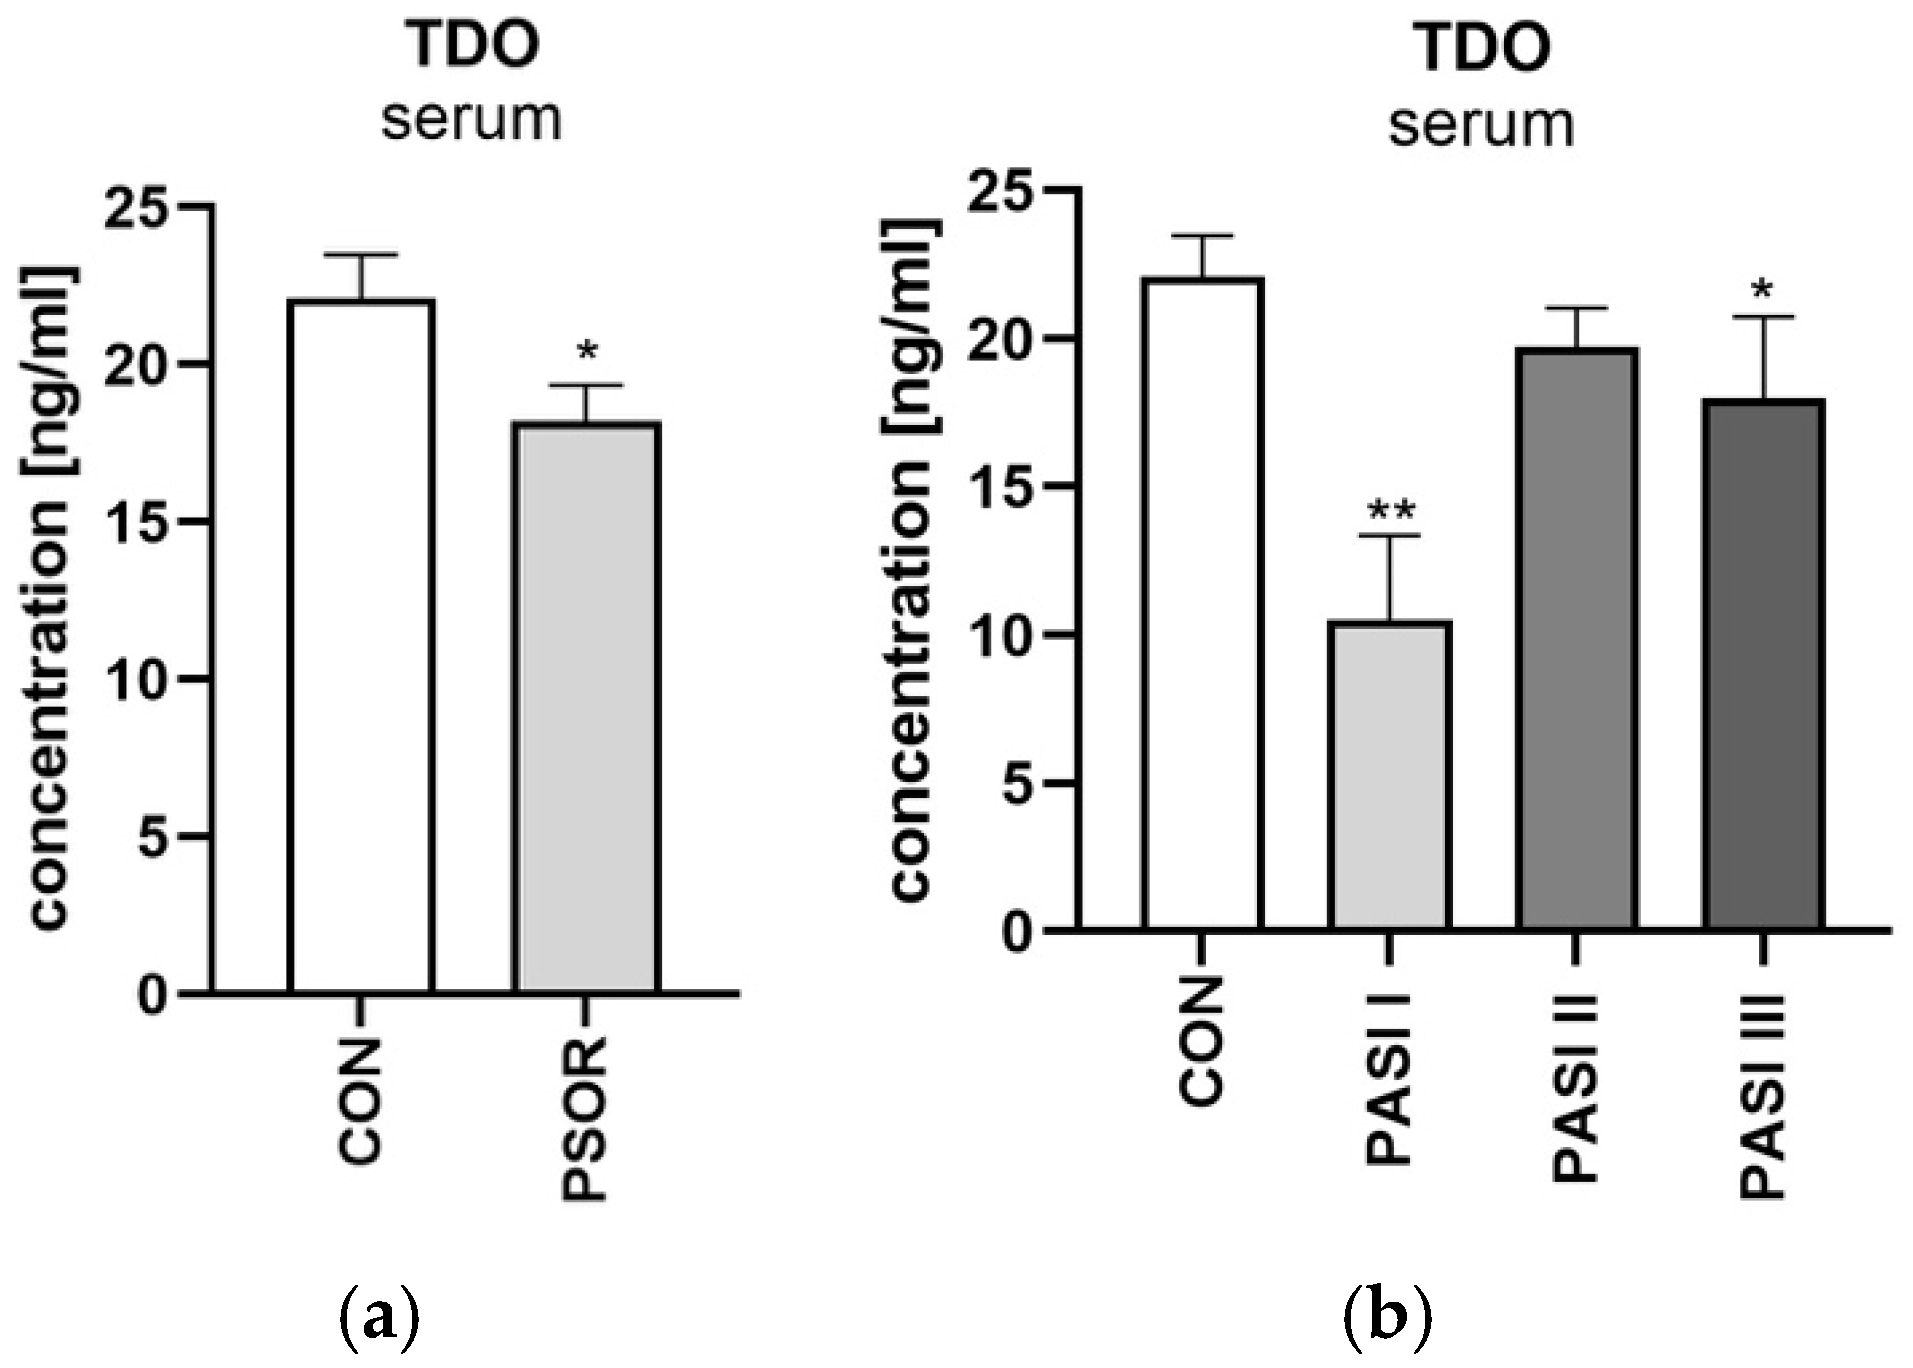
Serum Tryptophan 2,3-Dioxygenase
2.4. Kynurenine
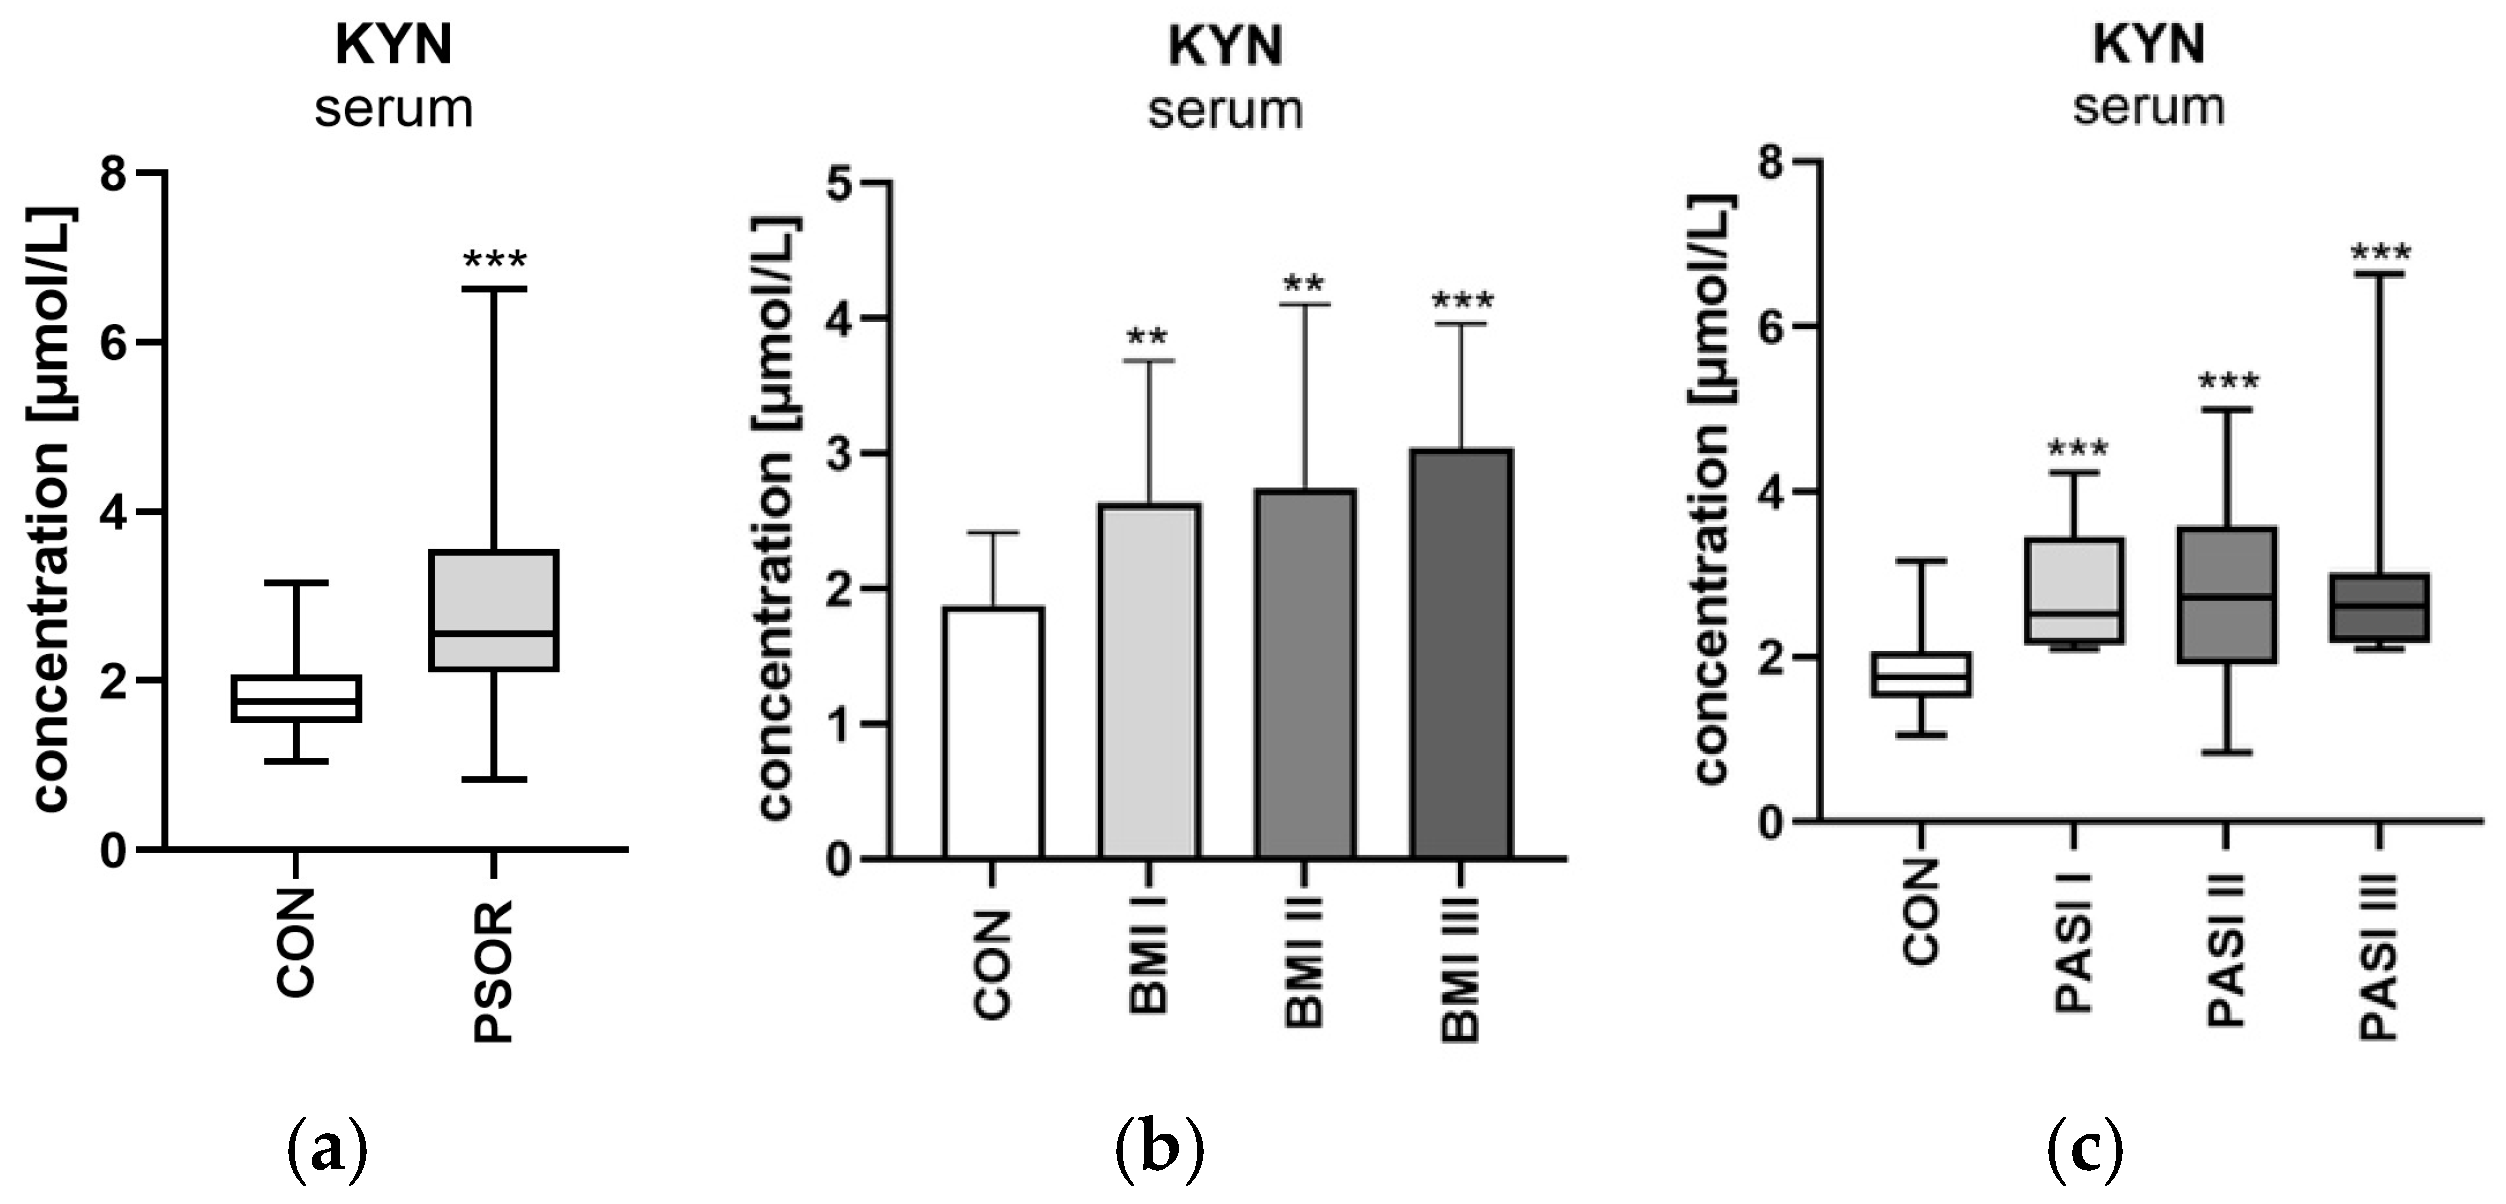
2.4.1. Serum Kynurenine
2.4.2. Urinary Kynurenine/Creatinine Ratio Concentration
2.5. Kynurenic Acid
2.5.1. Serum Kynurenic Acid
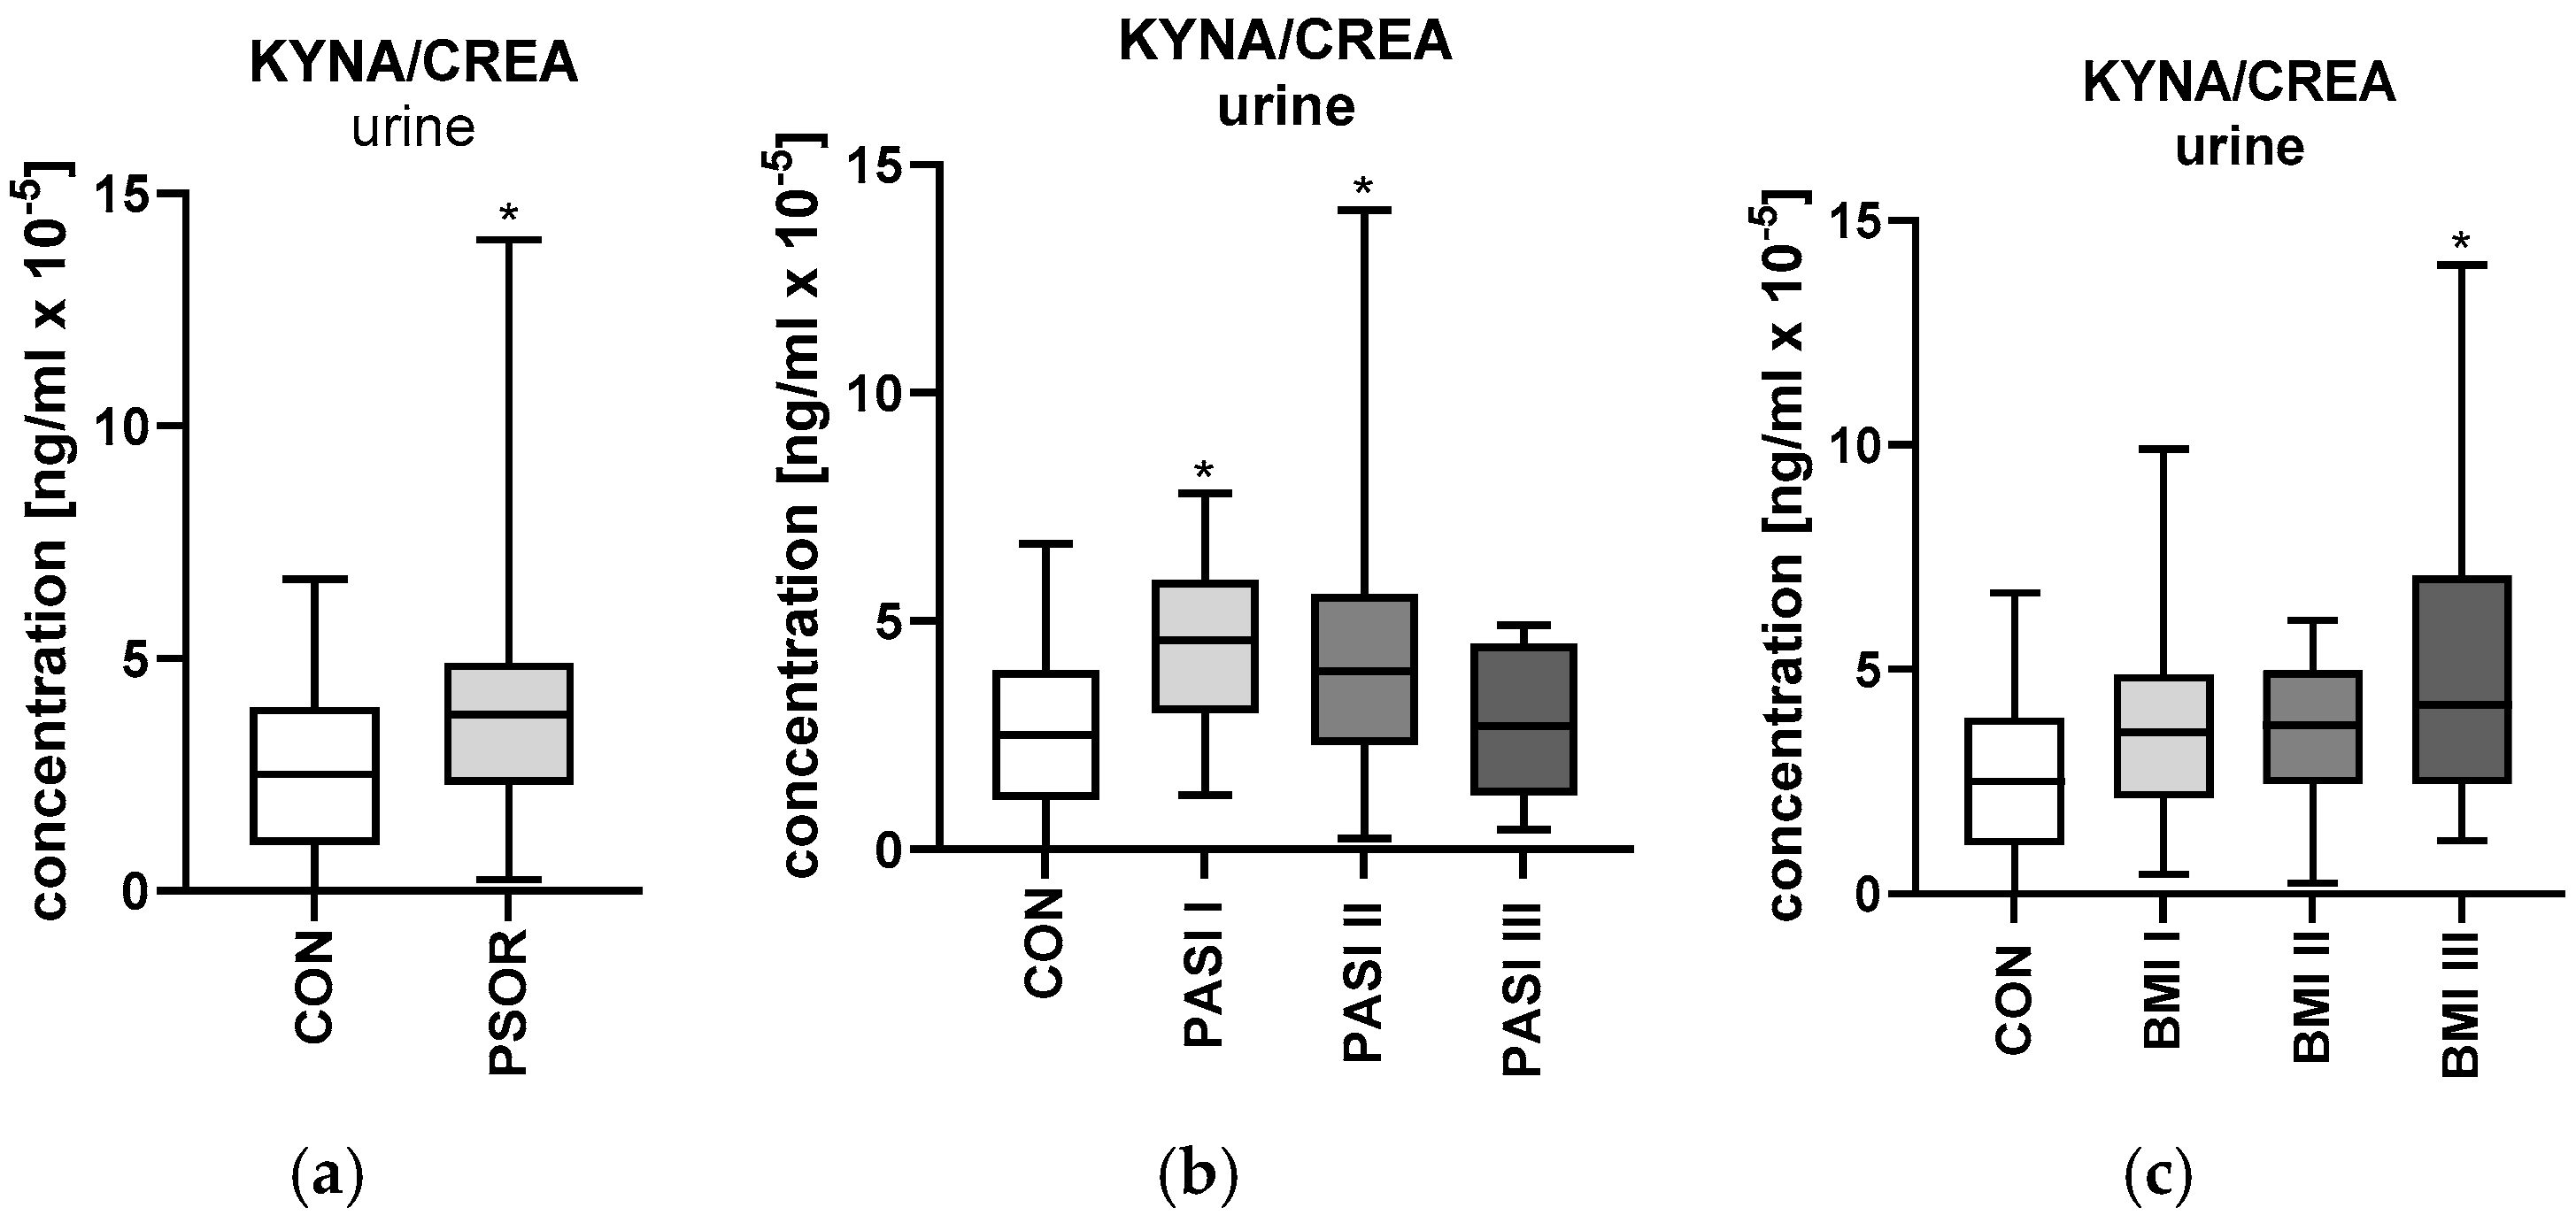
2.5.2. Urinary Kynurenic Acid/Creatinine Ratio Concentration
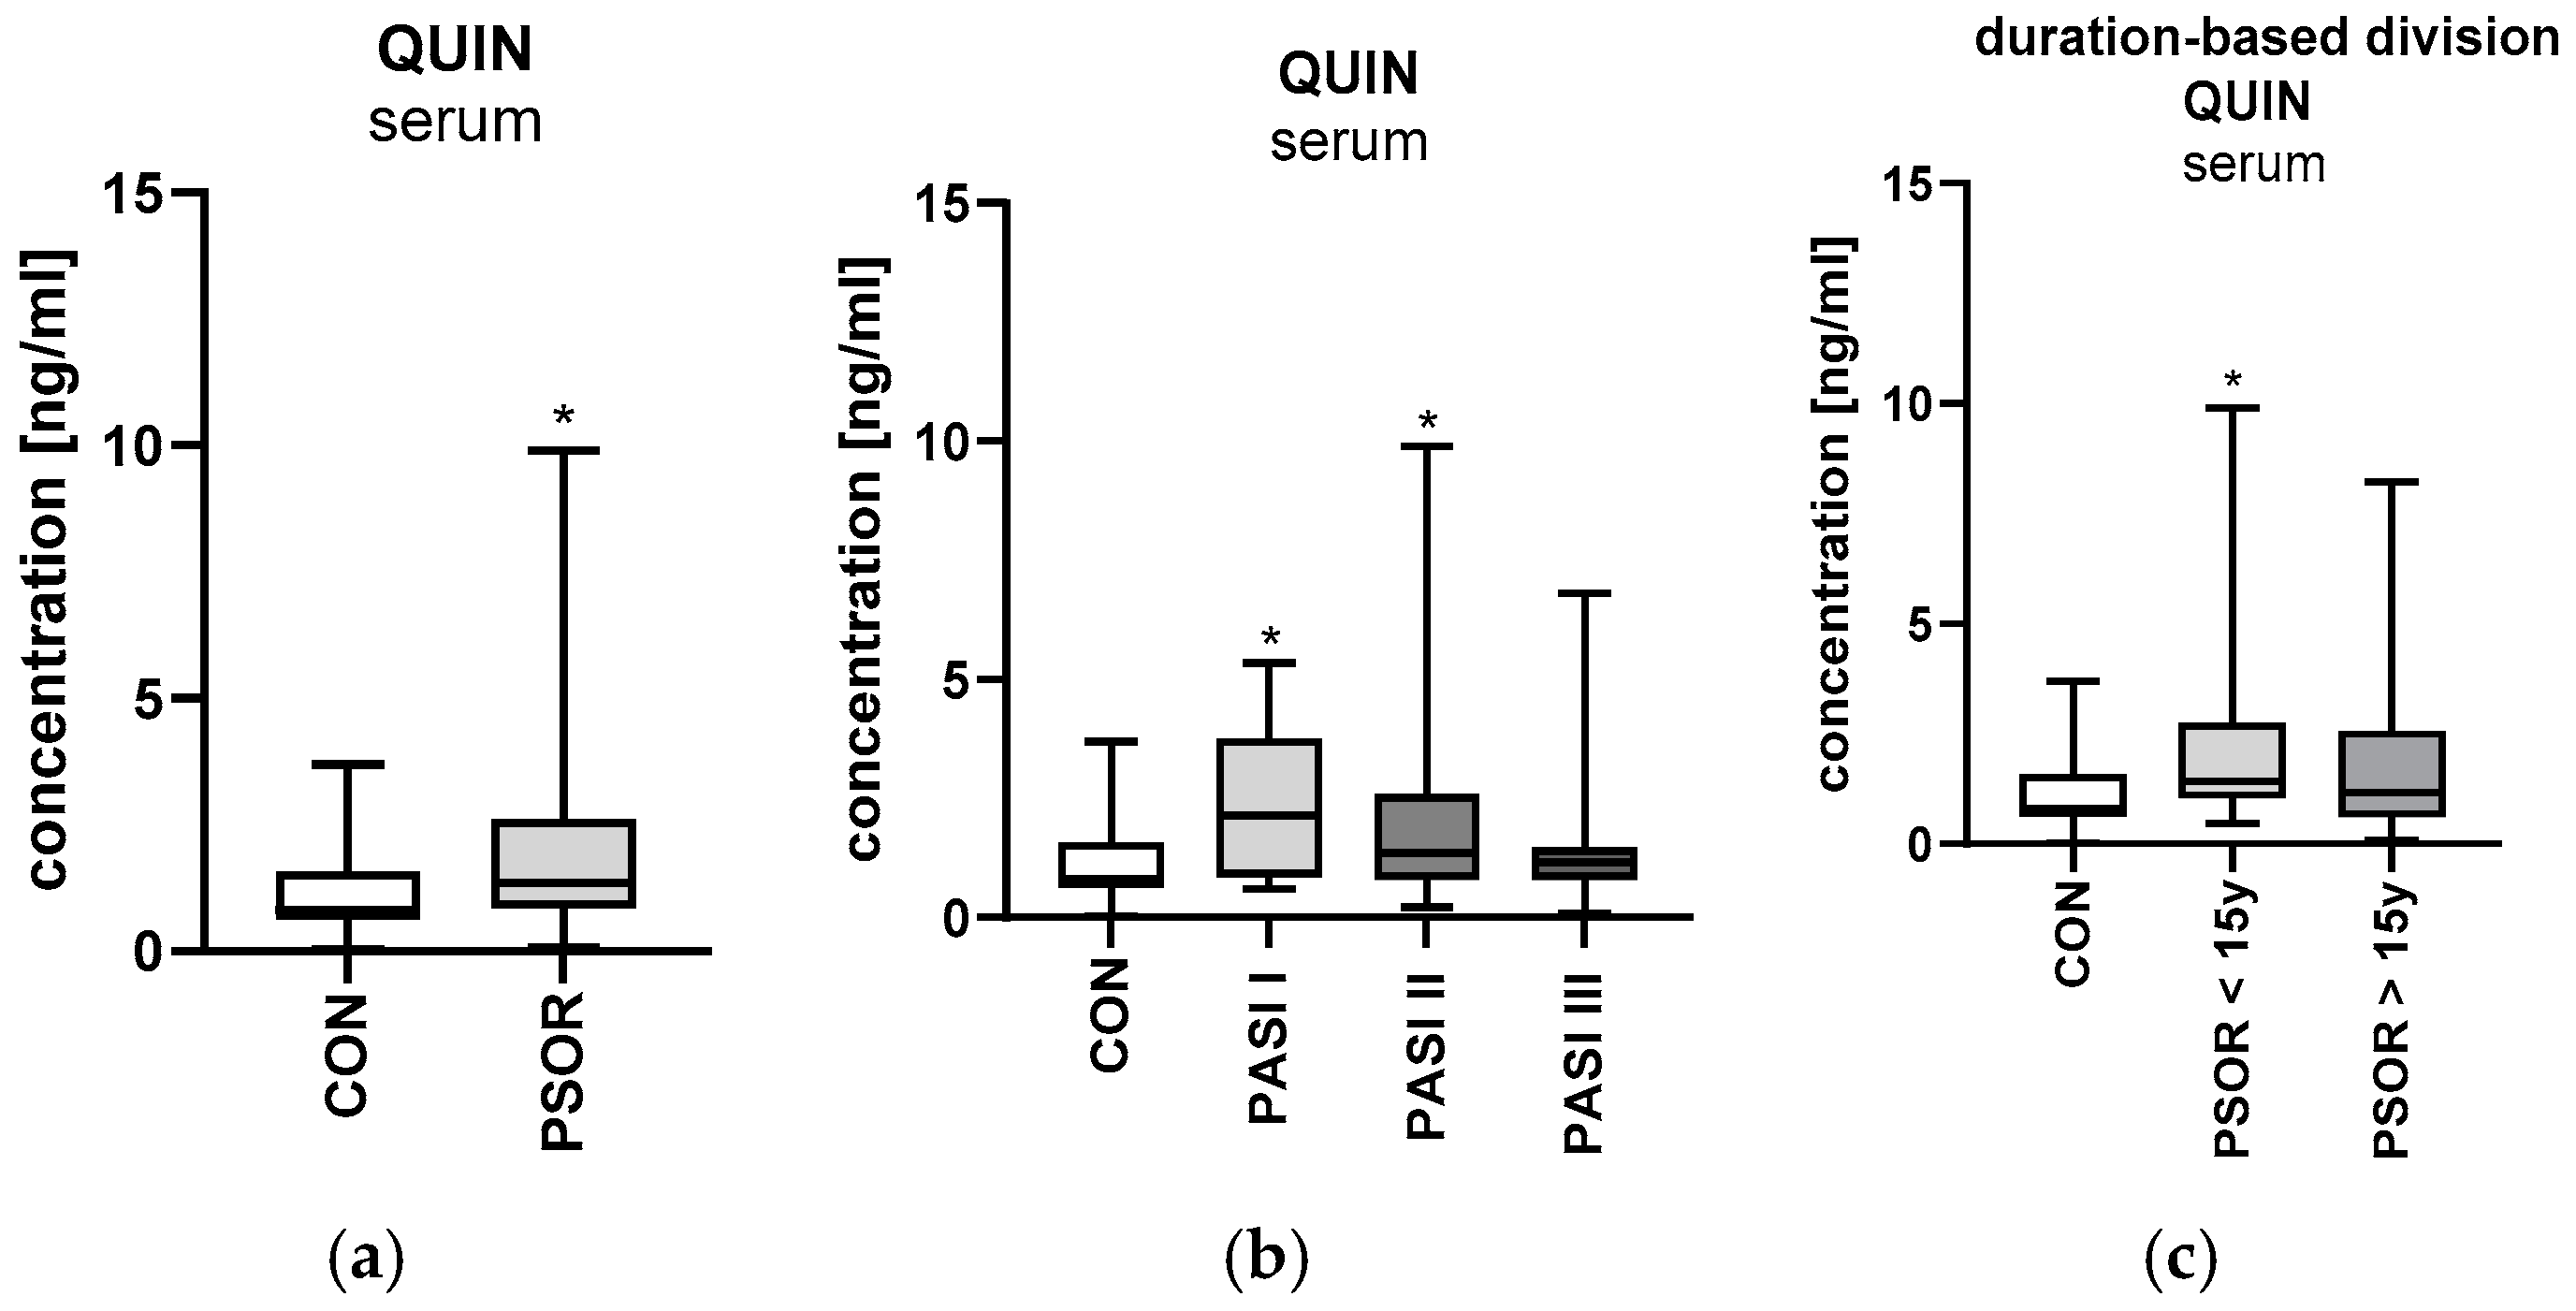
2.6. Quinolinic Acid
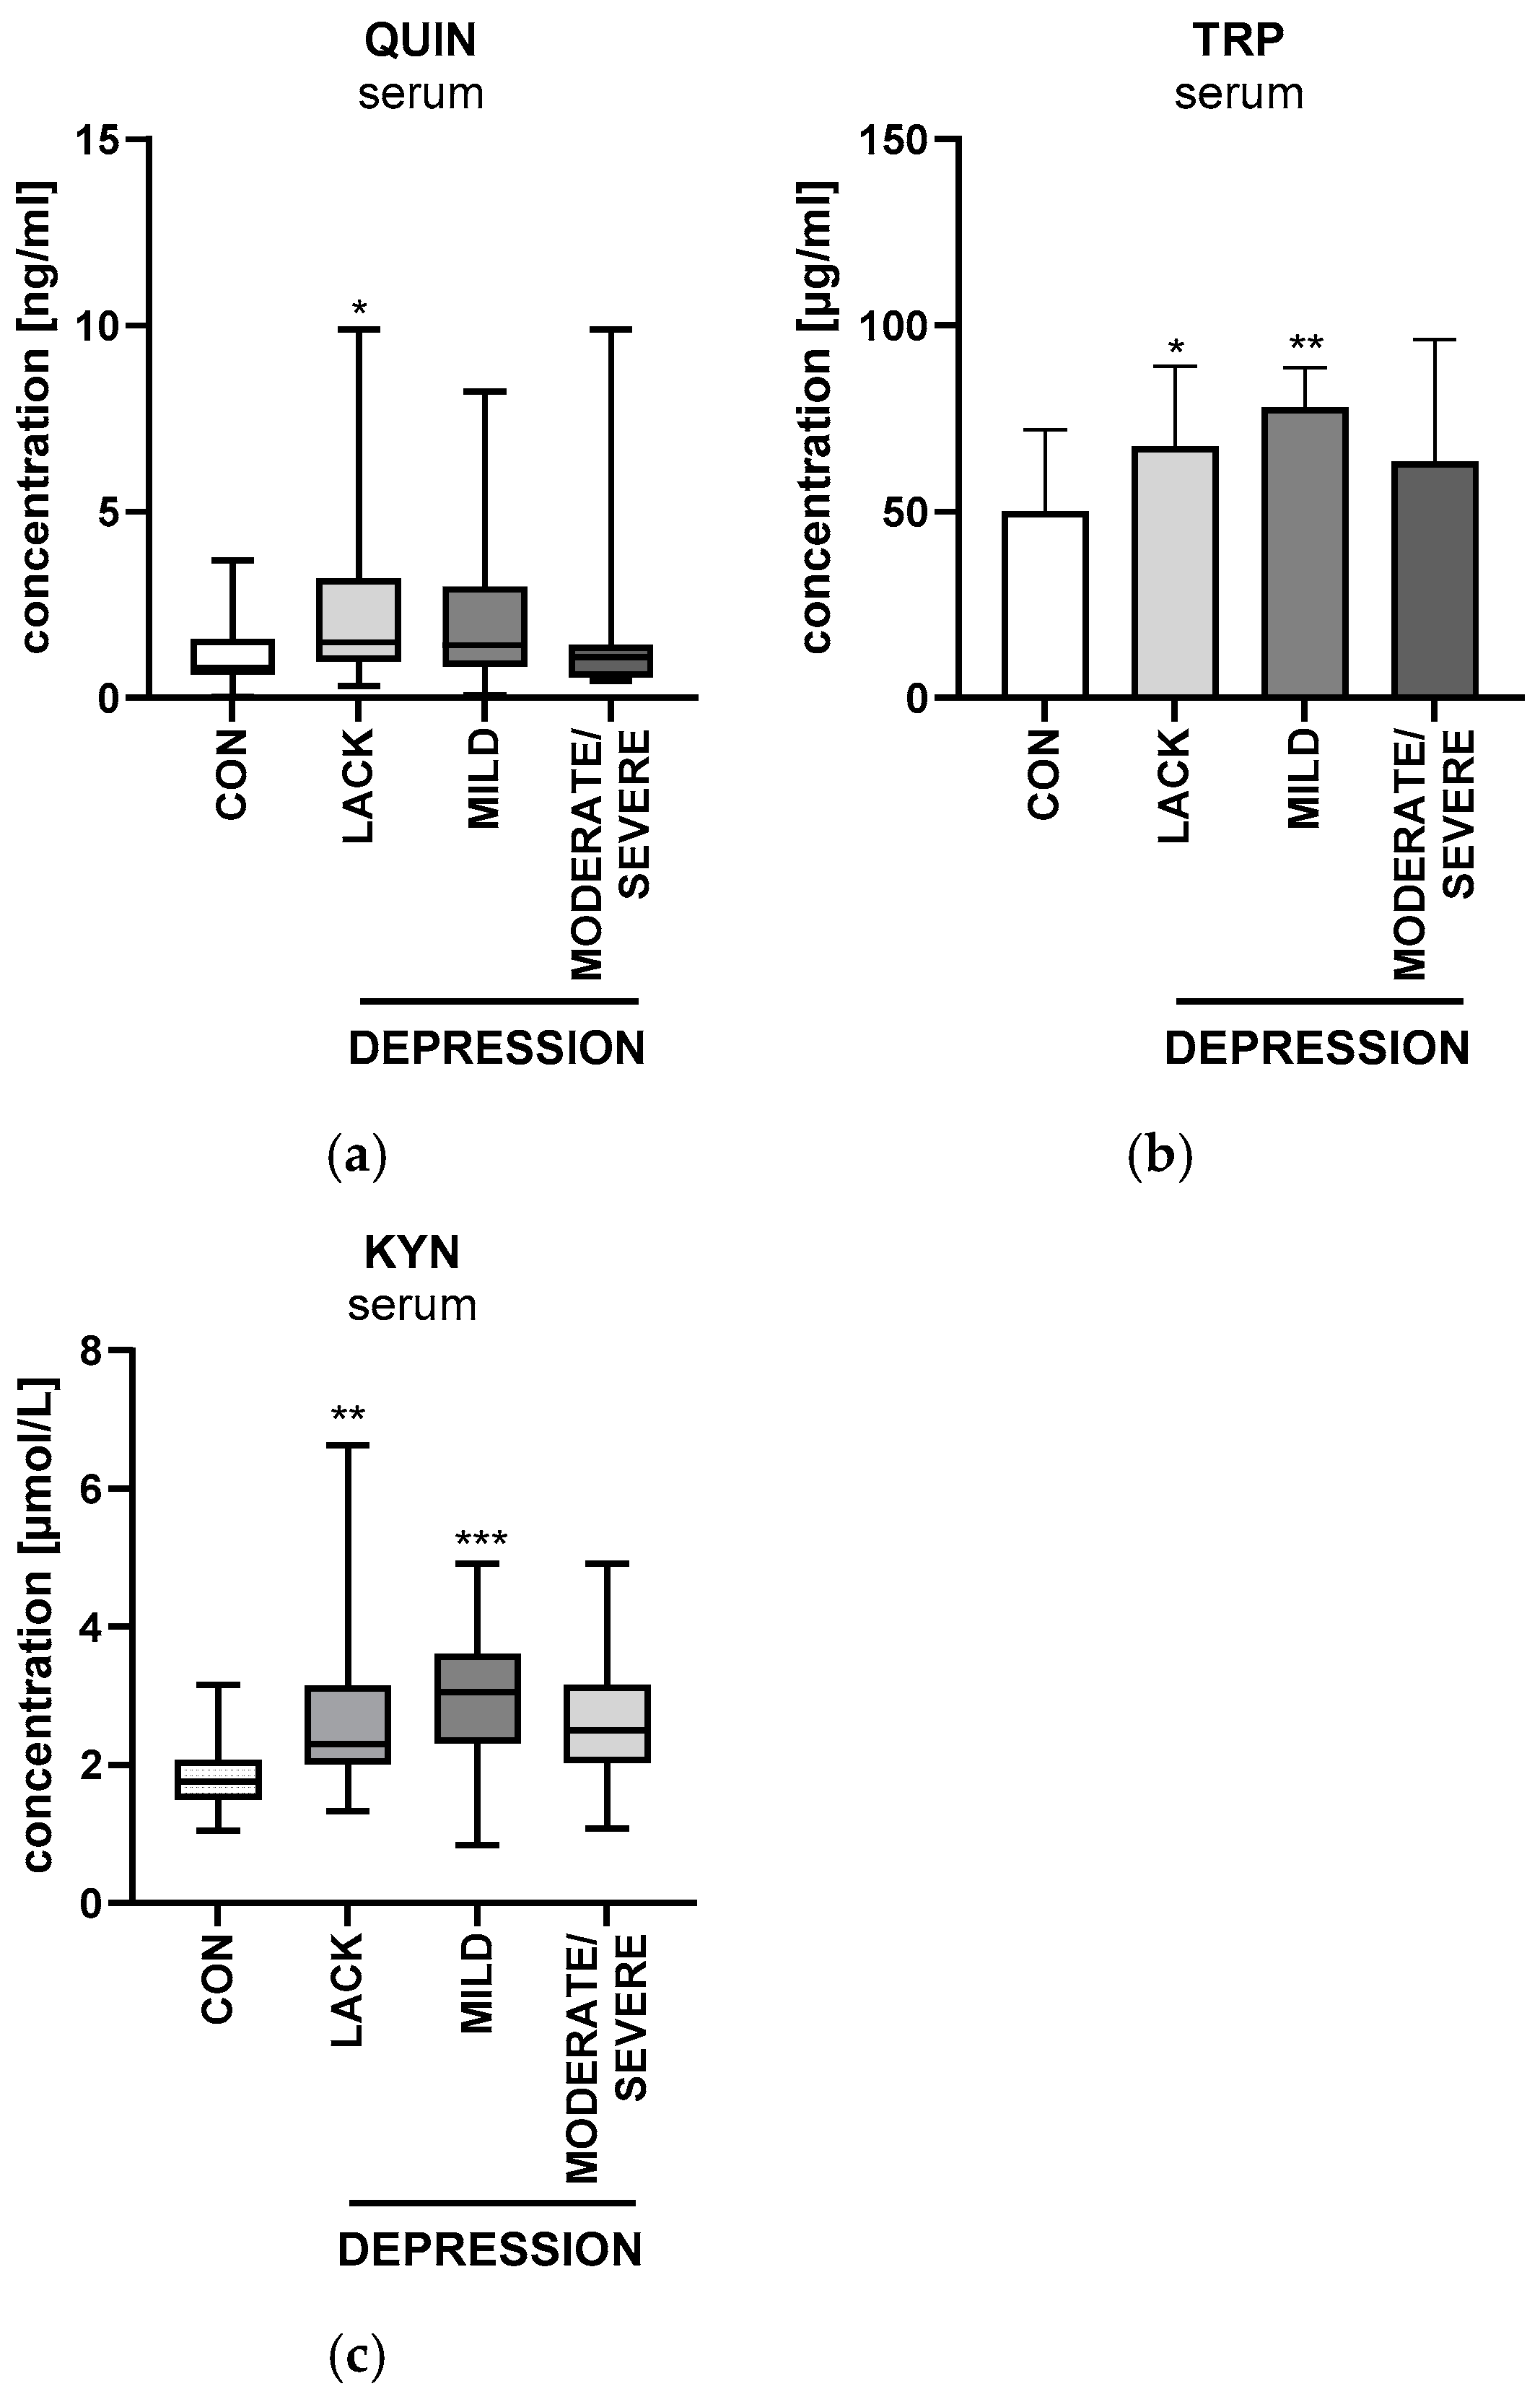
2.6.1. Serum Quinolinic Acid
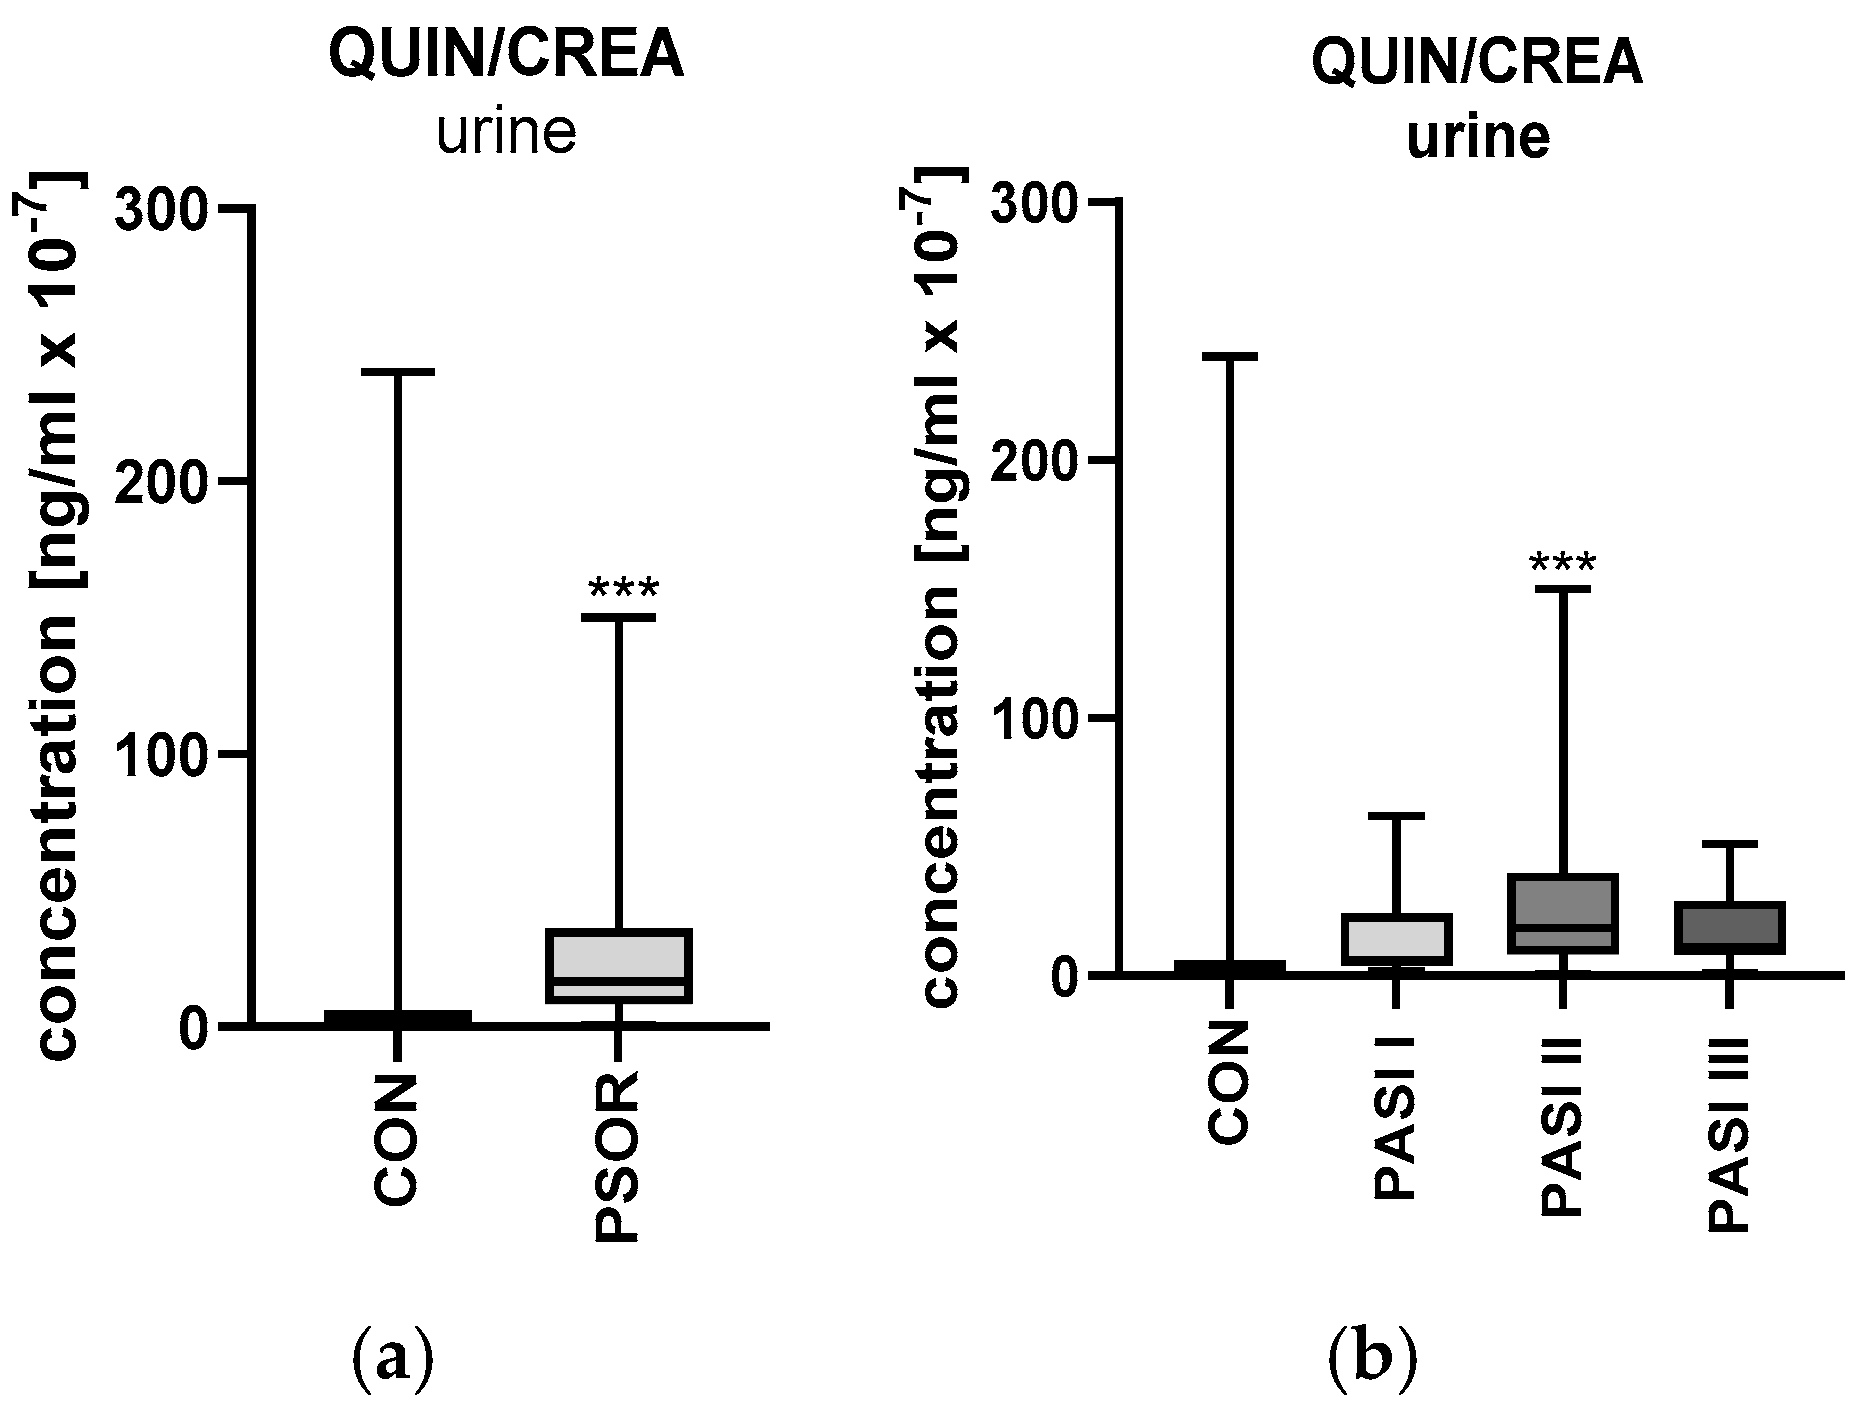
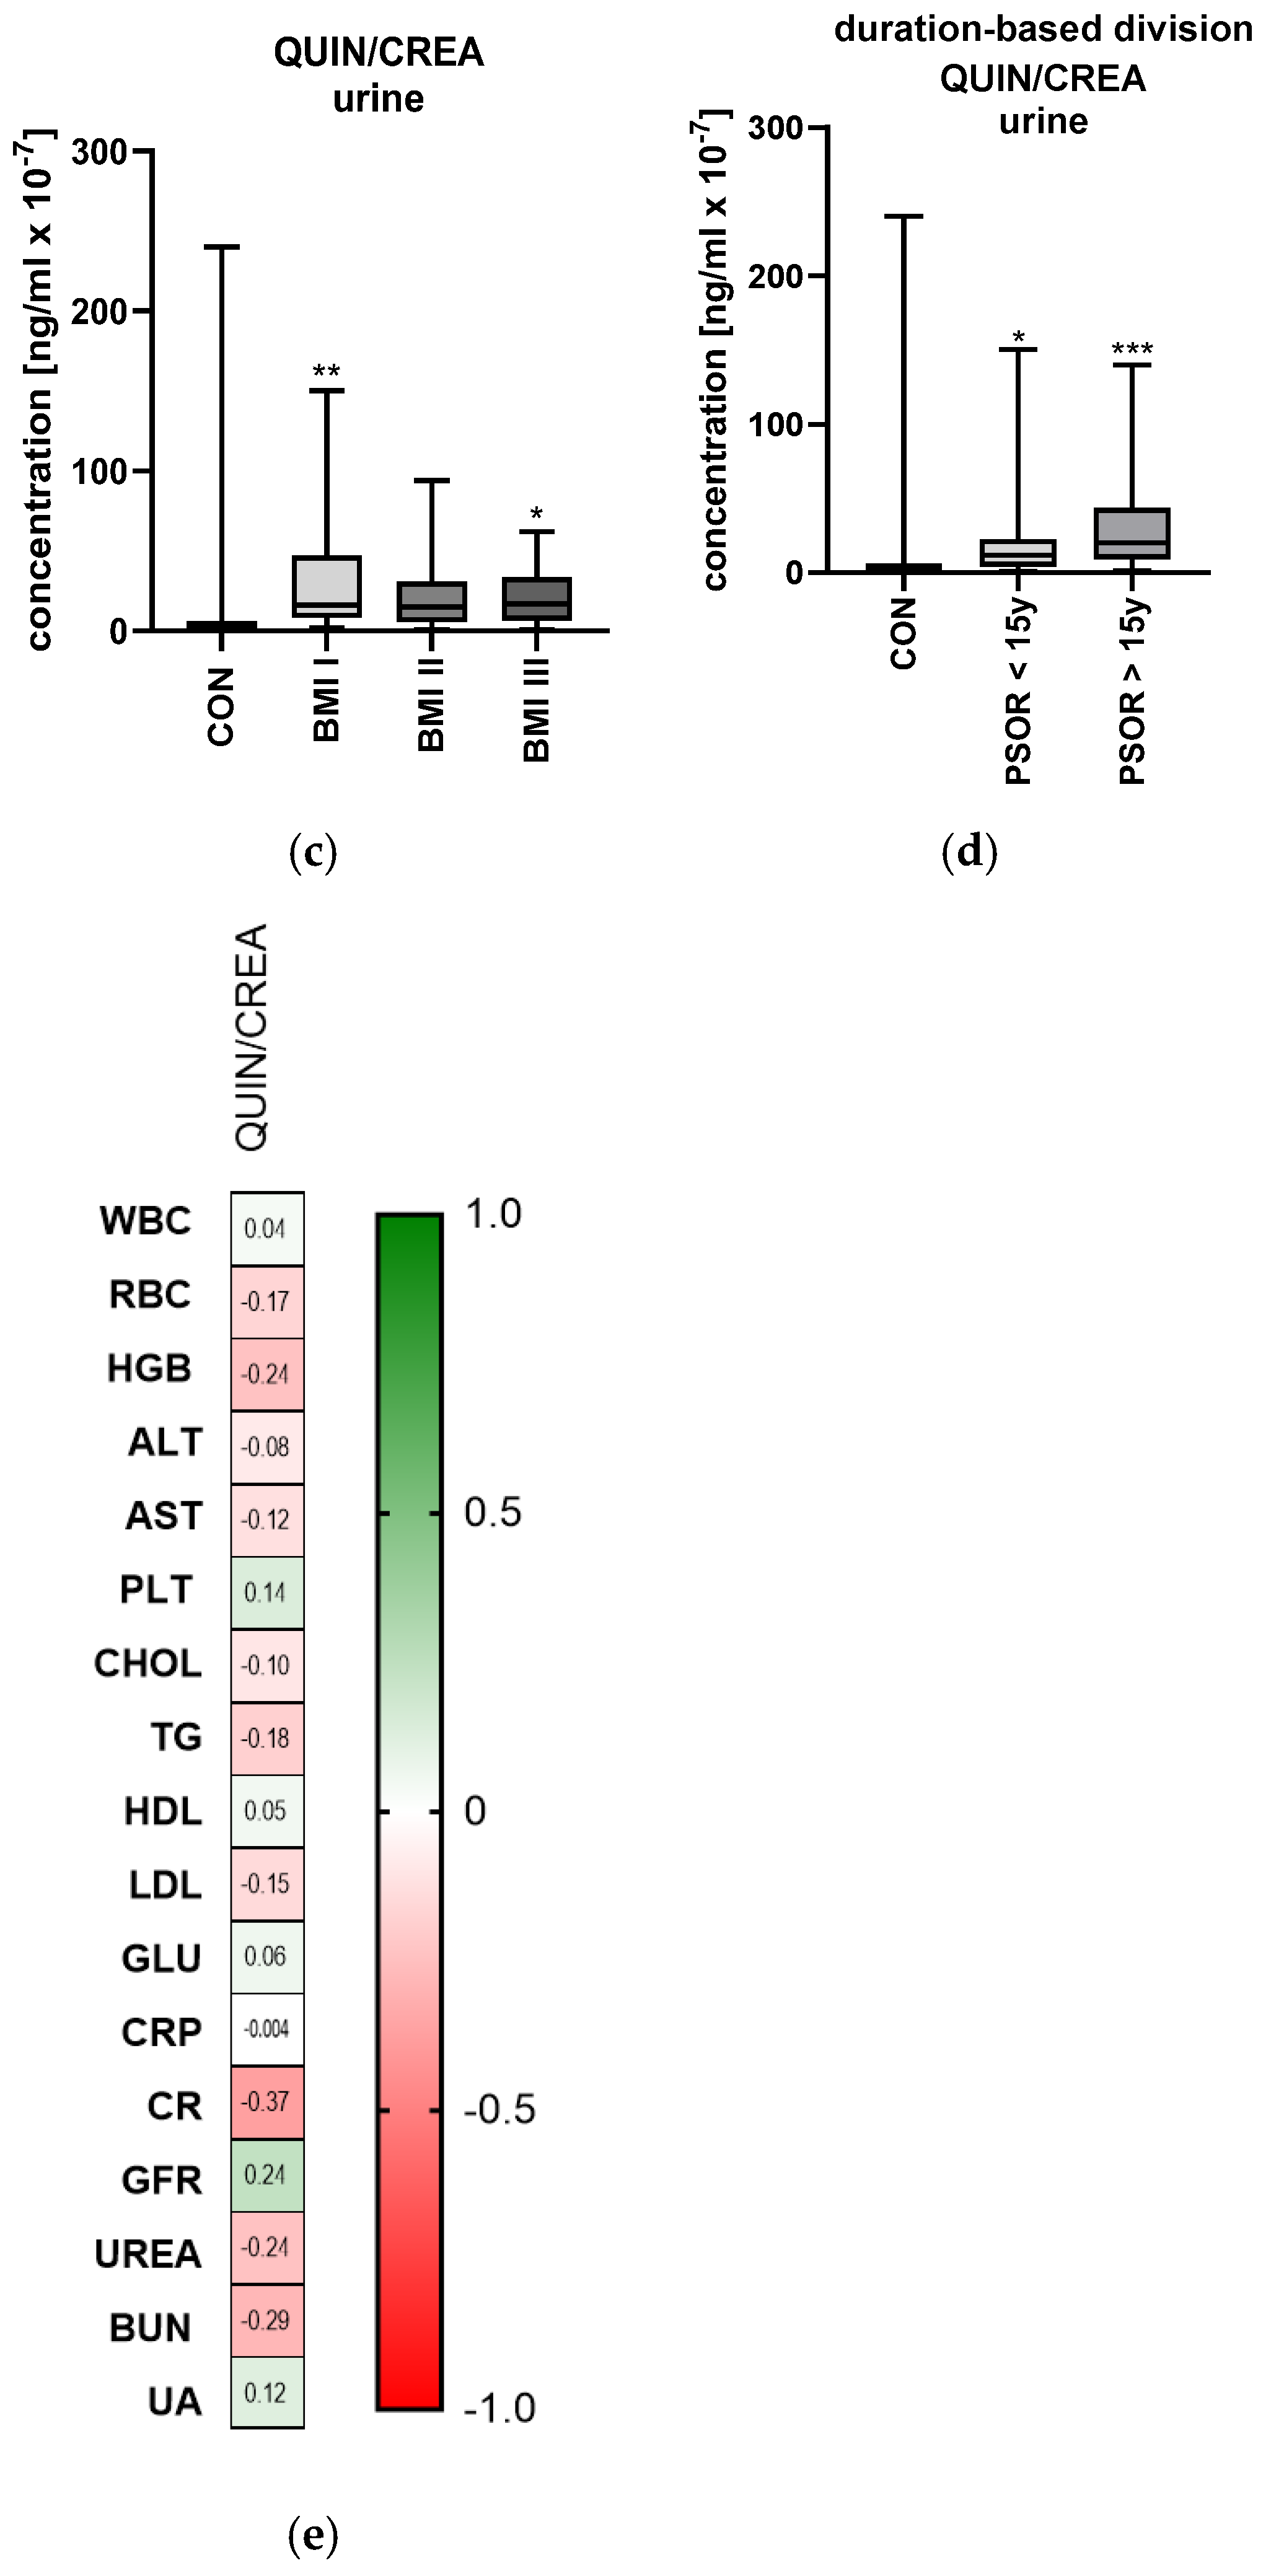
2.6.2. Urinary Quinolinic Acid/Creatinine Ratio Concentration
2.7. Beck’s Depression Inventory
3. Discussion
4. Materials and Methods
5. Conclusions
Supplementary Materials
Author Contributions
Funding
Institutional Review Board Statement
Informed Consent Statement
Data Availability Statement
Conflicts of Interest
Abbreviations
References
- Bellinato, F.; Maurelli, M.; Geat, D.; Girolomoni, G.; Gisondi, P. Managing the Patient with Psoriasis and Metabolic Comorbidities. Am. J. Clin. Dermatol. 2024, 25, 527–540. [Google Scholar] [PubMed]
- Yamazaki, F. Psoriasis: Comorbidities. J. Dermatol. 2021, 48, 732–740. [Google Scholar] [PubMed]
- Takeshita, J.; Grewal, S.; Langan, S.M.; Mehta, N.N.; Ogdie, A.; Van Voorhees, A.S.; Gelfand, J.M. Psoriasis and Comorbid Diseases Part I. Epidemiology. J. Am. Acad. Dermatol. 2017, 76, 377–390. [Google Scholar]
- Grandinetti, V.; Baraldi, O.; Comai, G.; Corradetti, V.; Aiello, V.; Bini, C.; Minerva, V.; Barbuto, S.; Fabbrizio, B.; Donati, G.; et al. Renal dysfunction in psoriatic patients. G. Ital. Nefrol. 2020, 37, 2020-vol 1. [Google Scholar]
- Roque Ferreira, B.; Pio-Abreu, J.L.; Reis, J.P.; Figueiredo, A. Analysis of the Prevalence of Mental Disorders in Psoriasis: The Relevance of Psychiatric Assessment in Dermatology. Psychiatr. Danub. 2017, 29, 401–406. [Google Scholar]
- Savitz, J. The Kynurenine Pathway: A Finger in Every Pie. Mol. Psychiatry 2020, 25, 131–147. [Google Scholar]
- Correia, A.S.; Vale, N. Tryptophan Metabolism in Depression: A Narrative Review with a Focus on Serotonin and Kynurenine Pathways. Int. J. Mol. Sci. 2022, 23, 8493. [Google Scholar] [CrossRef] [PubMed]
- Ala, M.; Eftekhar, S.P. The Footprint of Kynurenine Pathway in Cardiovascular Diseases. Int. J. Tryptophan. Res. 2022, 15, 11786469221096643. [Google Scholar]
- Mallmann, N.H.; Emerson, S.L.; Lalwani, P. Dysregulation of Tryptophan Catabolism in Metabolic Syndrome. Metab. Syndr. Relat. Disord. 2018, 16, 135–142. [Google Scholar]
- Jensen, P.; Skov, L. Psoriasis and Obesity. Dermatology 2016, 232, 633–639. [Google Scholar]
- Lee, H.; Jang, H.B.; Yoo, M.; Park, S.I.; Lee, H. Amino Acid Metabolites Associated with Chronic Kidney Disease: An Eight-Year Follow-Up Korean Epidemiology Study. Biomedicines 2020, 8, 222. [Google Scholar] [CrossRef] [PubMed]
- Krupa, A.; Krupa, M.M.; Pawlak, K. Indoleamine 2,3 Dioxygenase 1-The Potential Link between the Innate Immunity and the Ischemia-Reperfusion-Induced Acute Kidney Injury? Int. J. Mol. Sci. 2022, 23, 6176. [Google Scholar] [CrossRef]
- Zakrocka, I.; ZaŇāuska, W. Kynurenine pathway in kidney diseases. Pharmacol. Rep. 2021, 74, 27–39. [Google Scholar] [PubMed]
- Harden, J.L.; Lewis, S.M.; Lish, S.R.; Suárez-Fariñas, M.; Gareau, D.; Lentini, T.; Johnson-Huang, L.M.; Krueger, J.G.; Lowes, M.A. The tryptophan metabolism enzyme L-kynureninase is a novel inflammatory factor in psoriasis and other inflammatory diseases. J. Allergy Clin. Immunol. 2016, 137, 1830–1840. [Google Scholar] [PubMed]
- Krupa, A.; Kowalska, I. The Kynurenine Pathway-New Linkage between Innate and Adaptive Immunity in Autoimmune Endocrinopathies. Int. J. Mol. Sci. 2021, 22, 9879. [Google Scholar] [CrossRef]
- Chen, X.; Xu, D.; Yu, J.; Song, X.; Li, X.; Cui, Y. Tryptophan Metabolism Disorder-Triggered Diseases, Mechanisms, and Therapeutic Strategies: A Scientometric Review. Nutrients 2024, 16, 3380. [Google Scholar] [CrossRef]
- Wang, M.; Wang, Y.; Zhang, M.; Duan, Q.; Chen, C.; Sun, Q. Kynureninase contributes to the pathogenesis of psoriasis through pro-inflammatory effect. J. Cell Physiol. 2022, 237, 1044–1056. [Google Scholar] [CrossRef]
- Fujii, K.; Yamamoto, Y.; Mizutani, Y.; Saito, K.; Seishima, M. Indoleamine 2,3-Dioxygenase 2 Deficiency Exacerbates Imiquimod-Induced Psoriasis-Like Skin Inflammation. Int. J. Mol. Sci. 2020, 21, 5515. [Google Scholar] [CrossRef]
- Choudhary, V.; Ajebo, E.; Uaratanawong, R.; Spaulding, S.C.; Hossack, S.; Chen, X. Loss of Indoleamine-2,3-Dioxygenase-1 (IDO1) in Knockout Mice Does Not Affect the Development of Skin Lesions in the Imiquimod-Induced Mouse Model of Psoriasis. Int. J. Tryptophan Res. 2022, 15, 11786469221078191. [Google Scholar] [CrossRef]
- Laurans, L.; Venteclef, N.; Haddad, Y.; Chajadine, M.; Alzaid, F.; Metghalchi, S.; Sovran, B.; Denis, R.G.P.; Dairou, J.; Cardellini, M.; et al. Genetic deficiency of indoleamine 2,3-dioxygenase promotes gut microbiota-mediated metabolic health. Nat. Med. 2018, 24, 1113–1120. [Google Scholar] [CrossRef]
- Brandacher, G.; Winkler, C.; Aigner, F.; Schwelberger, H.; Schroecksnadel, K.; Margreiter, R. Bariatric surgery cannot prevent tryptophan depletion due to chronic immune activation in morbidly obese patients. Obes. Surg. 2006, 16, 541–548. [Google Scholar] [CrossRef] [PubMed]
- Yang, Y.; Liu, X.; Liu, X.; Xie, C.; Shi, J. The role of the kynurenine pathway in cardiovascular disease. Front. Cardiovasc. Med. 2024, 11, 1406856. [Google Scholar]
- Pan, B.; Zhang, F.; Sun, J.; Chen, D.; Huang, W.; Zhang, H.; Cao, C.; Wan, X. Correlation of Indoleamine-2,3-Dioxygenase and Chronic Kidney Disease: A Pilot Study. J. Immunol. Res. 2021, 2021, 8132569. [Google Scholar] [PubMed]
- Ruan, Z.; Lu, T.; Chen, Y.; Yuan, M.; Yu, H.; Liu, R.; Xie, X. Association Between Psoriasis and Nonalcoholic Fatty Liver Disease Among Outpatient US Adults. JAMA Dermatol. 2022, 158, 745–753. [Google Scholar]
- Teunis, C.; Nieuwdorp, M.; Hanssen, N. Interactions between Tryptophan Metabolism, the Gut Microbiome and the Immune System as Potential Drivers of Non-Alcoholic Fatty Liver Disease (NAFLD) and Metabolic Diseases. Metabolites 2022, 12, 514. [Google Scholar] [CrossRef]
- Tillmann, S.; Awwad, H.M.; MacPherson, C.W.; Happ, D.F.; Treccani, G.; Geisel, J. The Kynurenine Pathway Is Upregulated by Methyl-deficient Diet and Changes Are Averted by Probiotics. Mol. Nutr. Food Res. 2021, 65, 2100078. [Google Scholar]
- Spiera, H.; Lefkovits, A.M. Remission of psoriasis with low dietary tryptophan. Lancet 1967, 2, 137–139. [Google Scholar] [CrossRef]


| Parameter | Controls (n = 30) | Study Group (n = 60) |
|---|---|---|
| Sex (M/F) | 21/9 | 43/17 NS |
| Age [years] | 43 ± 2 | 47 ± 2 NS |
| Height [m] | 1.7 ± 0.1 | 1.71 ± 0.1 NS |
| Weight [kg] | 77.5 (67–90) | 83 (57–120) NS |
| BMI ratio | 25.9 ± 0.4 | 27.8 ± 0.6 NS |
Disclaimer/Publisher’s Note: The statements, opinions and data contained in all publications are solely those of the individual author(s) and contributor(s) and not of MDPI and/or the editor(s). MDPI and/or the editor(s) disclaim responsibility for any injury to people or property resulting from any ideas, methods, instructions or products referred to in the content. |
© 2025 by the authors. Licensee MDPI, Basel, Switzerland. This article is an open access article distributed under the terms and conditions of the Creative Commons Attribution (CC BY) license (https://creativecommons.org/licenses/by/4.0/).
Share and Cite
Stepaniuk, A.; Baran, A.; Hermanowicz, J.M.; Sieklucka, B.; Pawlak, D.; Flisiak, I. Peripheral Kynurenine Pathway Metabolites in Patients with Psoriasis. Int. J. Mol. Sci. 2025, 26, 3139. https://doi.org/10.3390/ijms26073139
Stepaniuk A, Baran A, Hermanowicz JM, Sieklucka B, Pawlak D, Flisiak I. Peripheral Kynurenine Pathway Metabolites in Patients with Psoriasis. International Journal of Molecular Sciences. 2025; 26(7):3139. https://doi.org/10.3390/ijms26073139
Chicago/Turabian StyleStepaniuk, Anna, Anna Baran, Justyna Magdalena Hermanowicz, Beata Sieklucka, Dariusz Pawlak, and Iwona Flisiak. 2025. "Peripheral Kynurenine Pathway Metabolites in Patients with Psoriasis" International Journal of Molecular Sciences 26, no. 7: 3139. https://doi.org/10.3390/ijms26073139
APA StyleStepaniuk, A., Baran, A., Hermanowicz, J. M., Sieklucka, B., Pawlak, D., & Flisiak, I. (2025). Peripheral Kynurenine Pathway Metabolites in Patients with Psoriasis. International Journal of Molecular Sciences, 26(7), 3139. https://doi.org/10.3390/ijms26073139