Author Contributions
Conceptualization, S.D.; methodology, H.G., J.M. (James Moran), S.R., J.M. (Joshua Mathew), and S.D.; validation, H.G., J.M. (James Moran), S.R., J.M. (Joshua Mathew), J.A.-B., and P.S.; formal analysis, H.G., J.M. (James Moran), S.R., J.M. (Joshua Mathew), J.A.-B., E.C., and P.S.; investigation, H.G., J.M. (James Moran), J.A.-B., and S.D.; resources, S.D.; data curation, H.G., S.R., J.M. (Joshua Mathew), J.A.-B., E.C., and P.S.; writing—original draft, H.G., J.M. (James Moran), S.R., J.M. (Joshua Mathew), J.A.-B., E.C., P.S., and S.D.; writing—review and editing, H.G., J.M. (James Moran), S.R., J.M. (Joshua Mathew), and S.D.; supervision, S.D.; funding acquisition, S.D. All authors have read and agreed to the published version of the manuscript.
Figure 1.
(
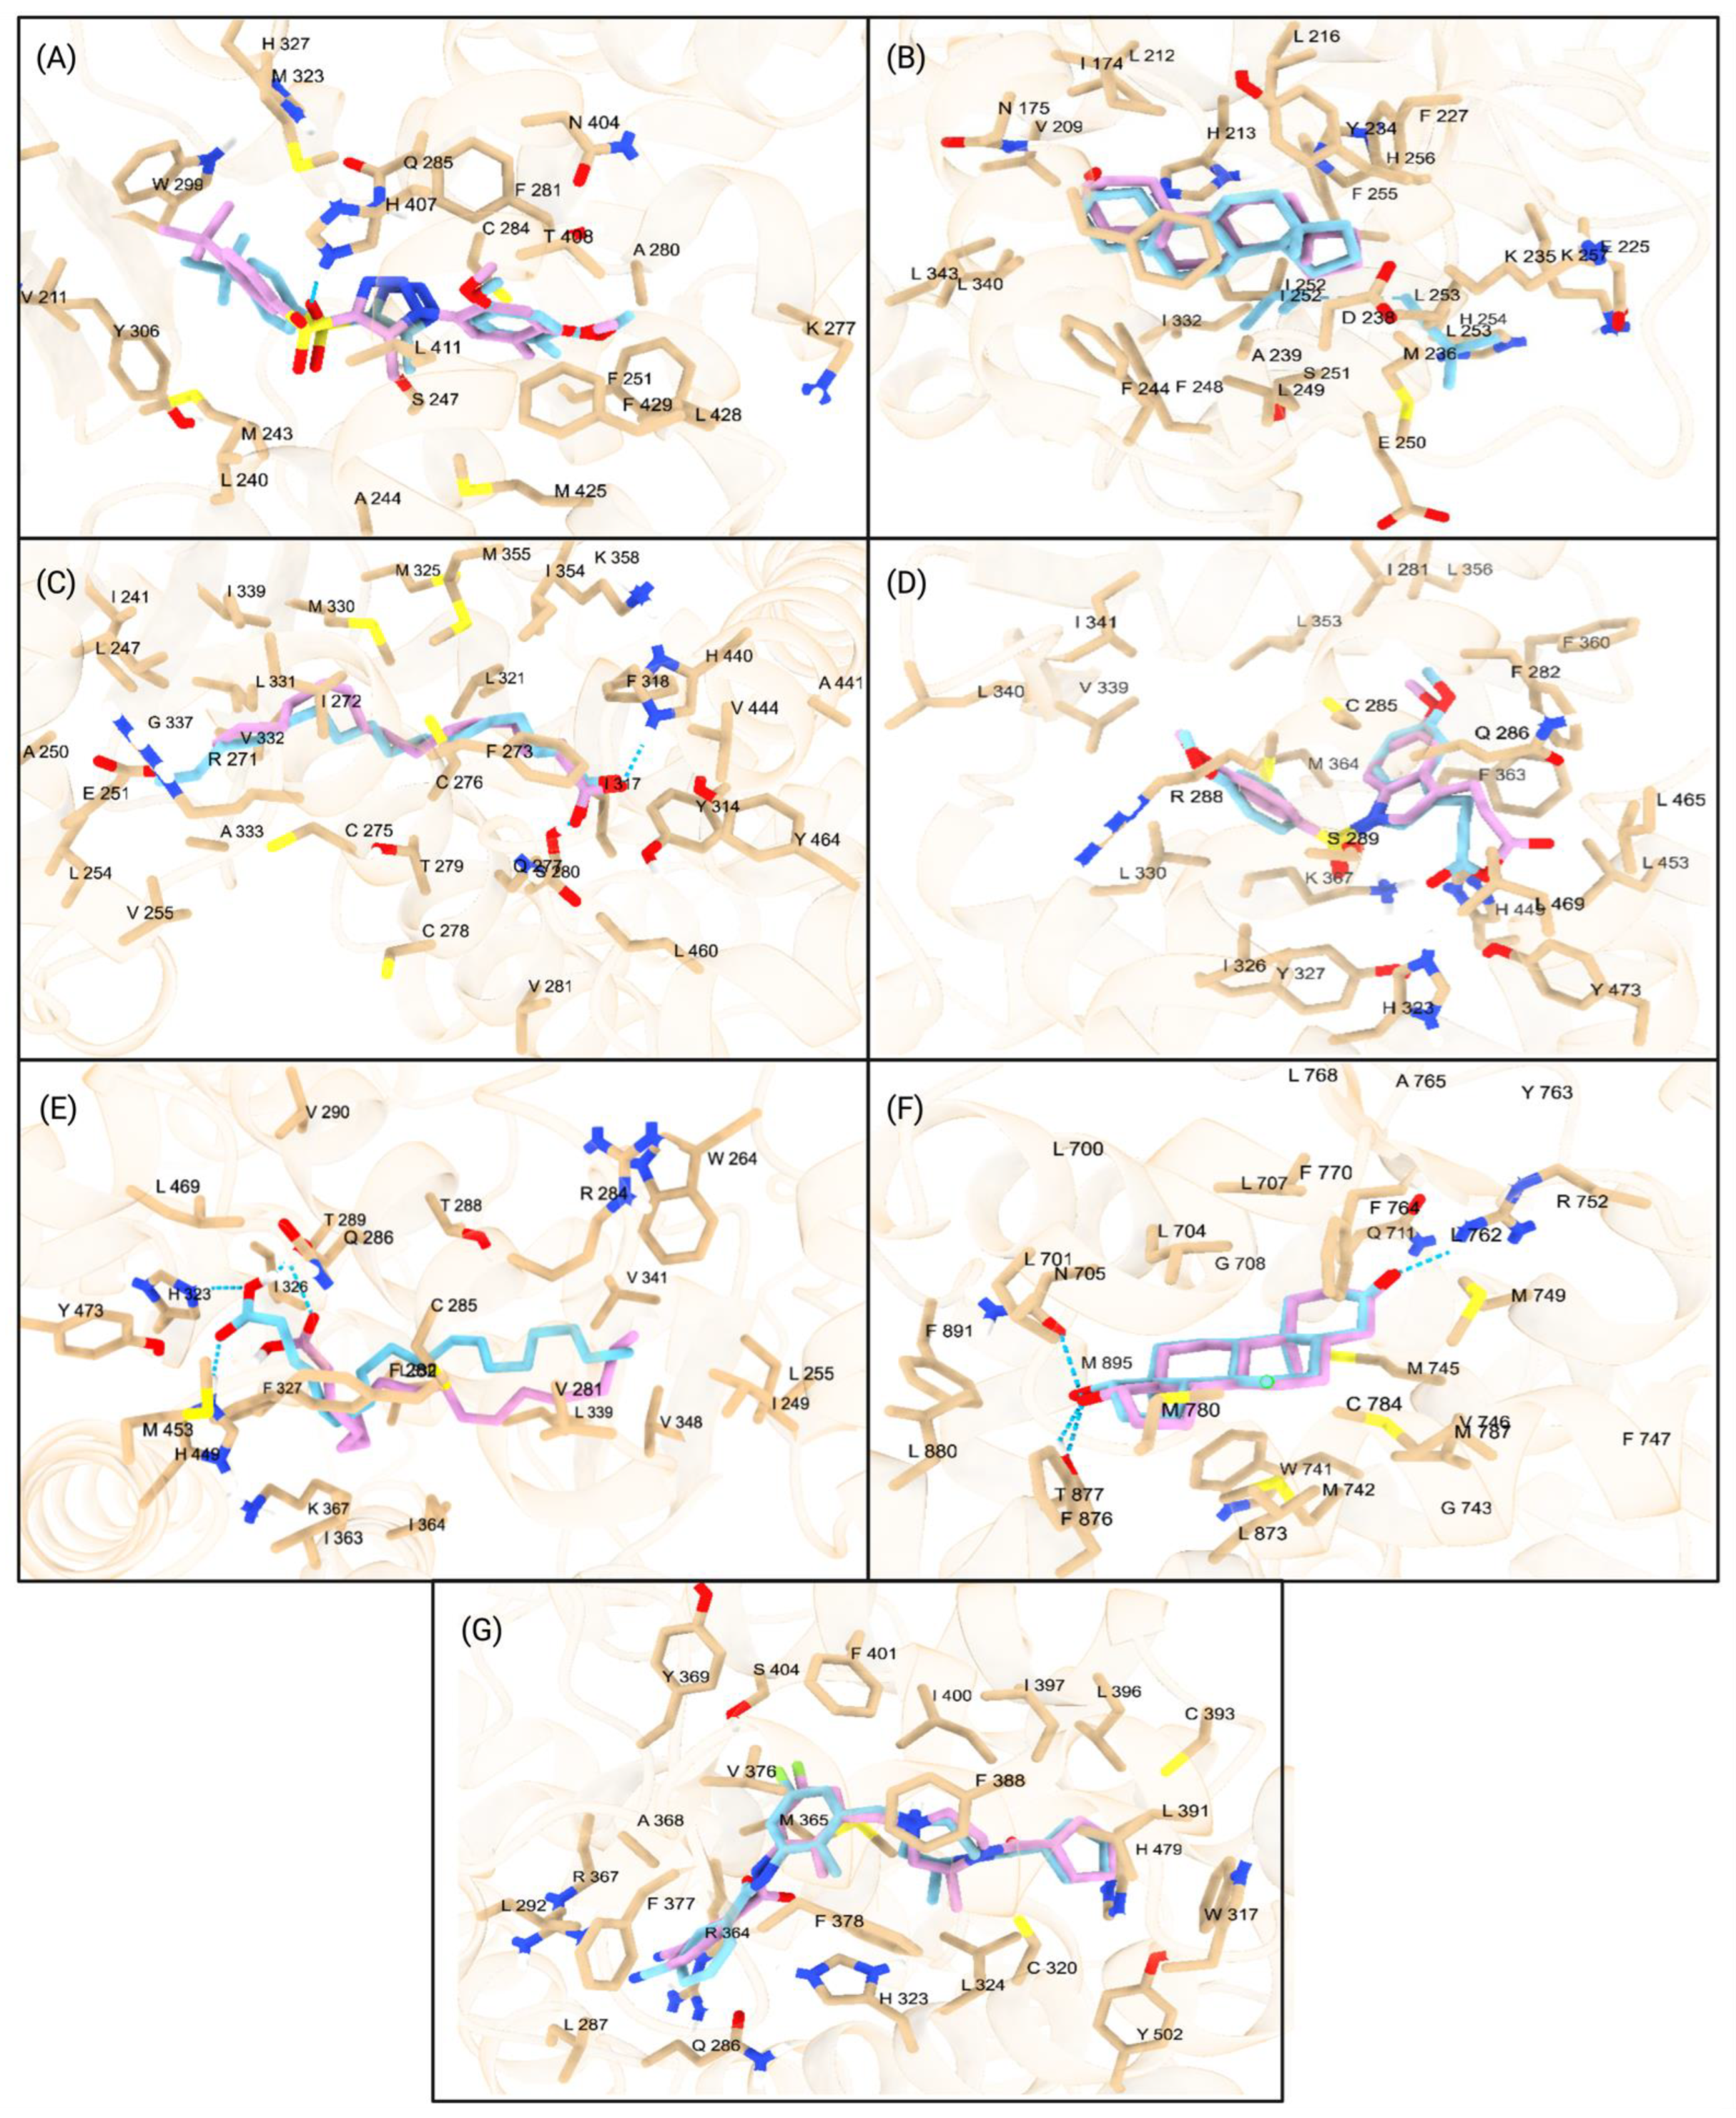
A) Superimposed PXR structure in brown (PBD ID: 5X0R) and docked binding pose of PXR orthosteric ligand 4WH. The reference binding pose of SJB7 is shown in blue. The redocked endogenous ligand (pink), SJB7, was superimposed on the reference ligand (cyan) with an RMSD value of 1.720 Å. (
B) Superimposed CAR co-crystal structure in blue (PBD ID: 1XNX) and docked binding pose of androstenol (ATE) in pink. The reference binding pose of ATE is shown in blue. (
C) Redocked palmitic acid (pink) with a score of −6.4 kcal/mol superimposed on the native position (blue) at the orthosteric site of the PPARα LBD. The root-mean-square deviation (RMSD) was calculated to be 1.495 Å, indicating the accuracy of the docking protocol. (
D) Superimposed depiction of redocked ET1 ligand (pink) onto co-crystallized ET1 ligand (blue) displayed (PDB ID: 3ET3) at the orthosteric site of PPARγ is shown, with an RMSD of 1.060 Å. (
E) The endogenous ligand vaccenic acid (cyan) was redocked at the PPARδ LBD. The structural alignment with the co-crystallized ligand (pink) revealed an RMSD value of 2.416 Å. (
F) Androgen receptor with redocked DHT (pink) and native co-crystallized DHT (blue) (PDB ID: 2PIV). The RMSD value between the redocked and endogenous confirmation of DHT is 0.353. (
G) Superimposed conformation of the redocked Ursolic Acid (pink) and the co-crystalized structure of Ursolic Acid (blue) (PDB ID: 6O3Z) on the RORγt protein. The structural alignment revealed an RMSD value of 0.822. All amino acid residues within 5 Å of the redocked ligand are shown. All hydrogen bonds are represented with a blue dotted line. Specific ligands and experimental binding affinity and predicted binding affinities can be found in
Supplementary Table S10.
Figure 1.
(
A) Superimposed PXR structure in brown (PBD ID: 5X0R) and docked binding pose of PXR orthosteric ligand 4WH. The reference binding pose of SJB7 is shown in blue. The redocked endogenous ligand (pink), SJB7, was superimposed on the reference ligand (cyan) with an RMSD value of 1.720 Å. (
B) Superimposed CAR co-crystal structure in blue (PBD ID: 1XNX) and docked binding pose of androstenol (ATE) in pink. The reference binding pose of ATE is shown in blue. (
C) Redocked palmitic acid (pink) with a score of −6.4 kcal/mol superimposed on the native position (blue) at the orthosteric site of the PPARα LBD. The root-mean-square deviation (RMSD) was calculated to be 1.495 Å, indicating the accuracy of the docking protocol. (
D) Superimposed depiction of redocked ET1 ligand (pink) onto co-crystallized ET1 ligand (blue) displayed (PDB ID: 3ET3) at the orthosteric site of PPARγ is shown, with an RMSD of 1.060 Å. (
E) The endogenous ligand vaccenic acid (cyan) was redocked at the PPARδ LBD. The structural alignment with the co-crystallized ligand (pink) revealed an RMSD value of 2.416 Å. (
F) Androgen receptor with redocked DHT (pink) and native co-crystallized DHT (blue) (PDB ID: 2PIV). The RMSD value between the redocked and endogenous confirmation of DHT is 0.353. (
G) Superimposed conformation of the redocked Ursolic Acid (pink) and the co-crystalized structure of Ursolic Acid (blue) (PDB ID: 6O3Z) on the RORγt protein. The structural alignment revealed an RMSD value of 0.822. All amino acid residues within 5 Å of the redocked ligand are shown. All hydrogen bonds are represented with a blue dotted line. Specific ligands and experimental binding affinity and predicted binding affinities can be found in
Supplementary Table S10.
![Ijms 26 02879 g001]()
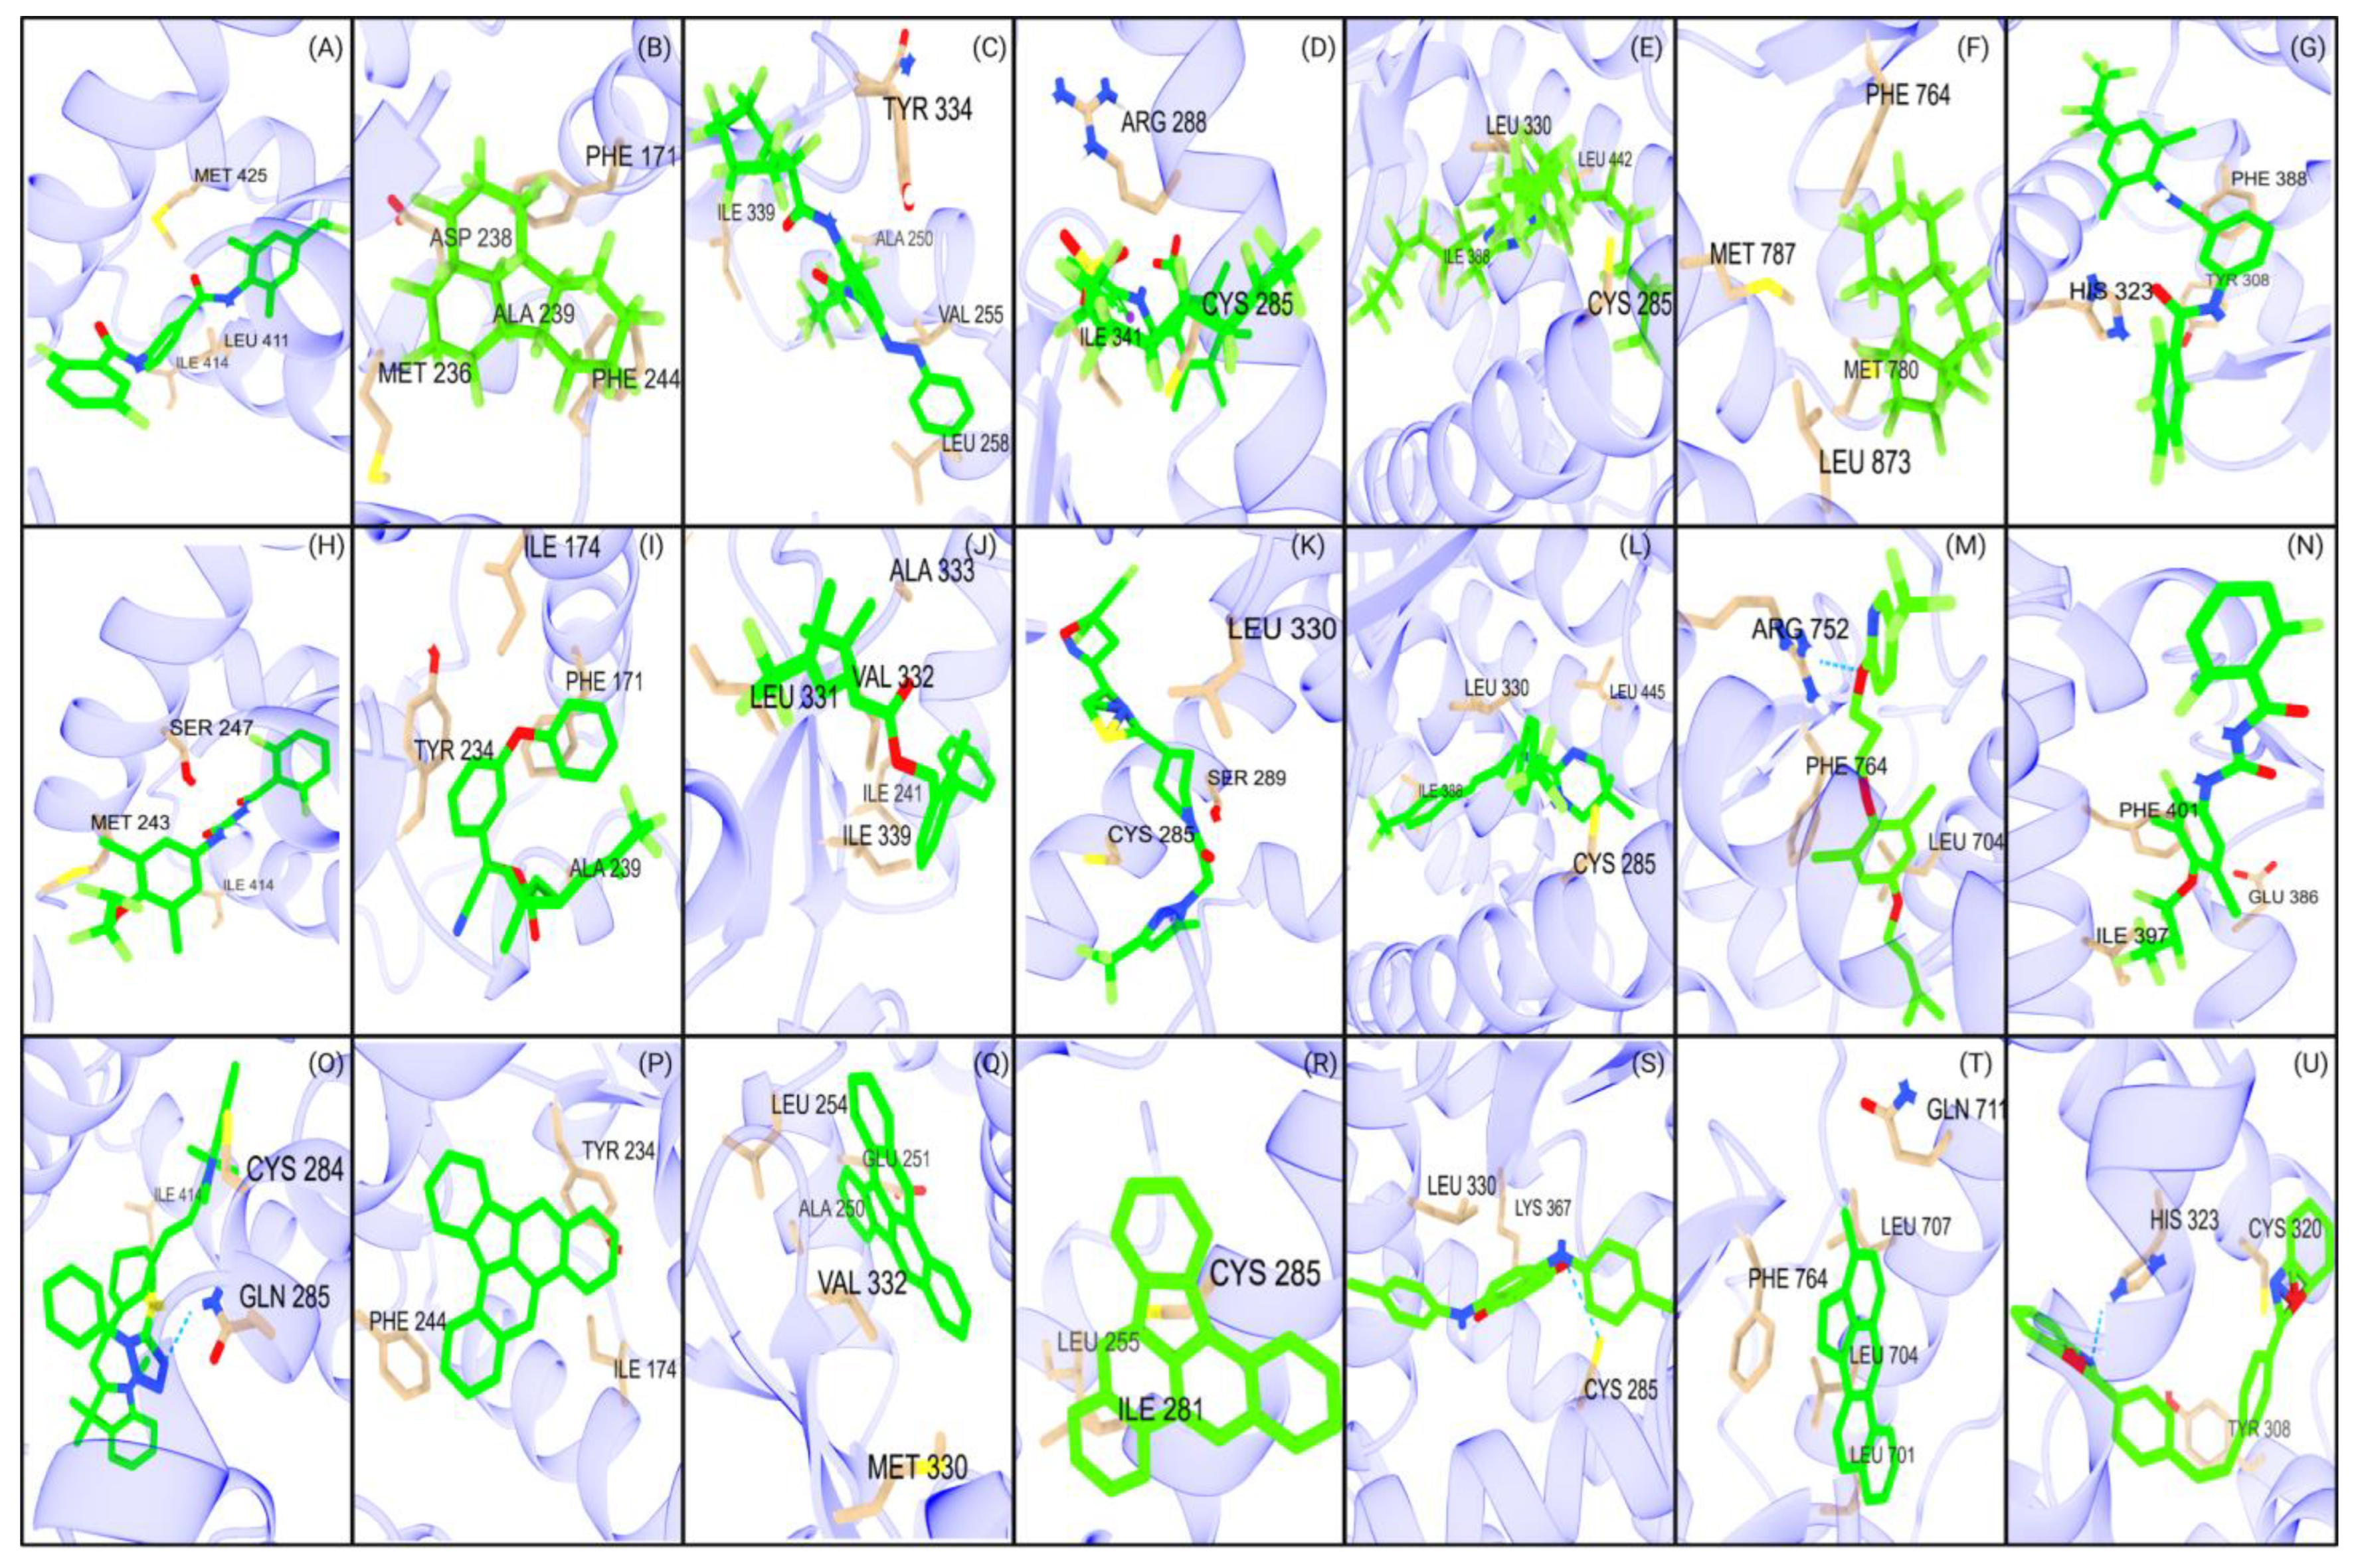
Figure 2.
Major interactions of studied NRs with PFAS, PFAS pesticides, and nanoplastics. The first row (A–G) represents the interactions of seven NRs with PFAS: (A) PXR, (B) CAR, (C) PPARα, (D) PPARγ, (E) PPARδ, (F) AR, and (G) RORγt. The second row (H–N) illustrates the interactions of the same NRs with PFAS pesticides: (H) PXR, (I) CAR, (J) PPARα, (K) PPARγ, (L) PPARδ, (M) AR, and (N) RORγt. The third row (O–U) depicts the interactions of these NRs with nanoplastics: (O) PXR, (P) CAR, (Q) PPARα, (R) PPARγ, (S) PPARδ, (T) AR, and (U) RORγt. Hydrogen bonds are represented with a blue dotted line.
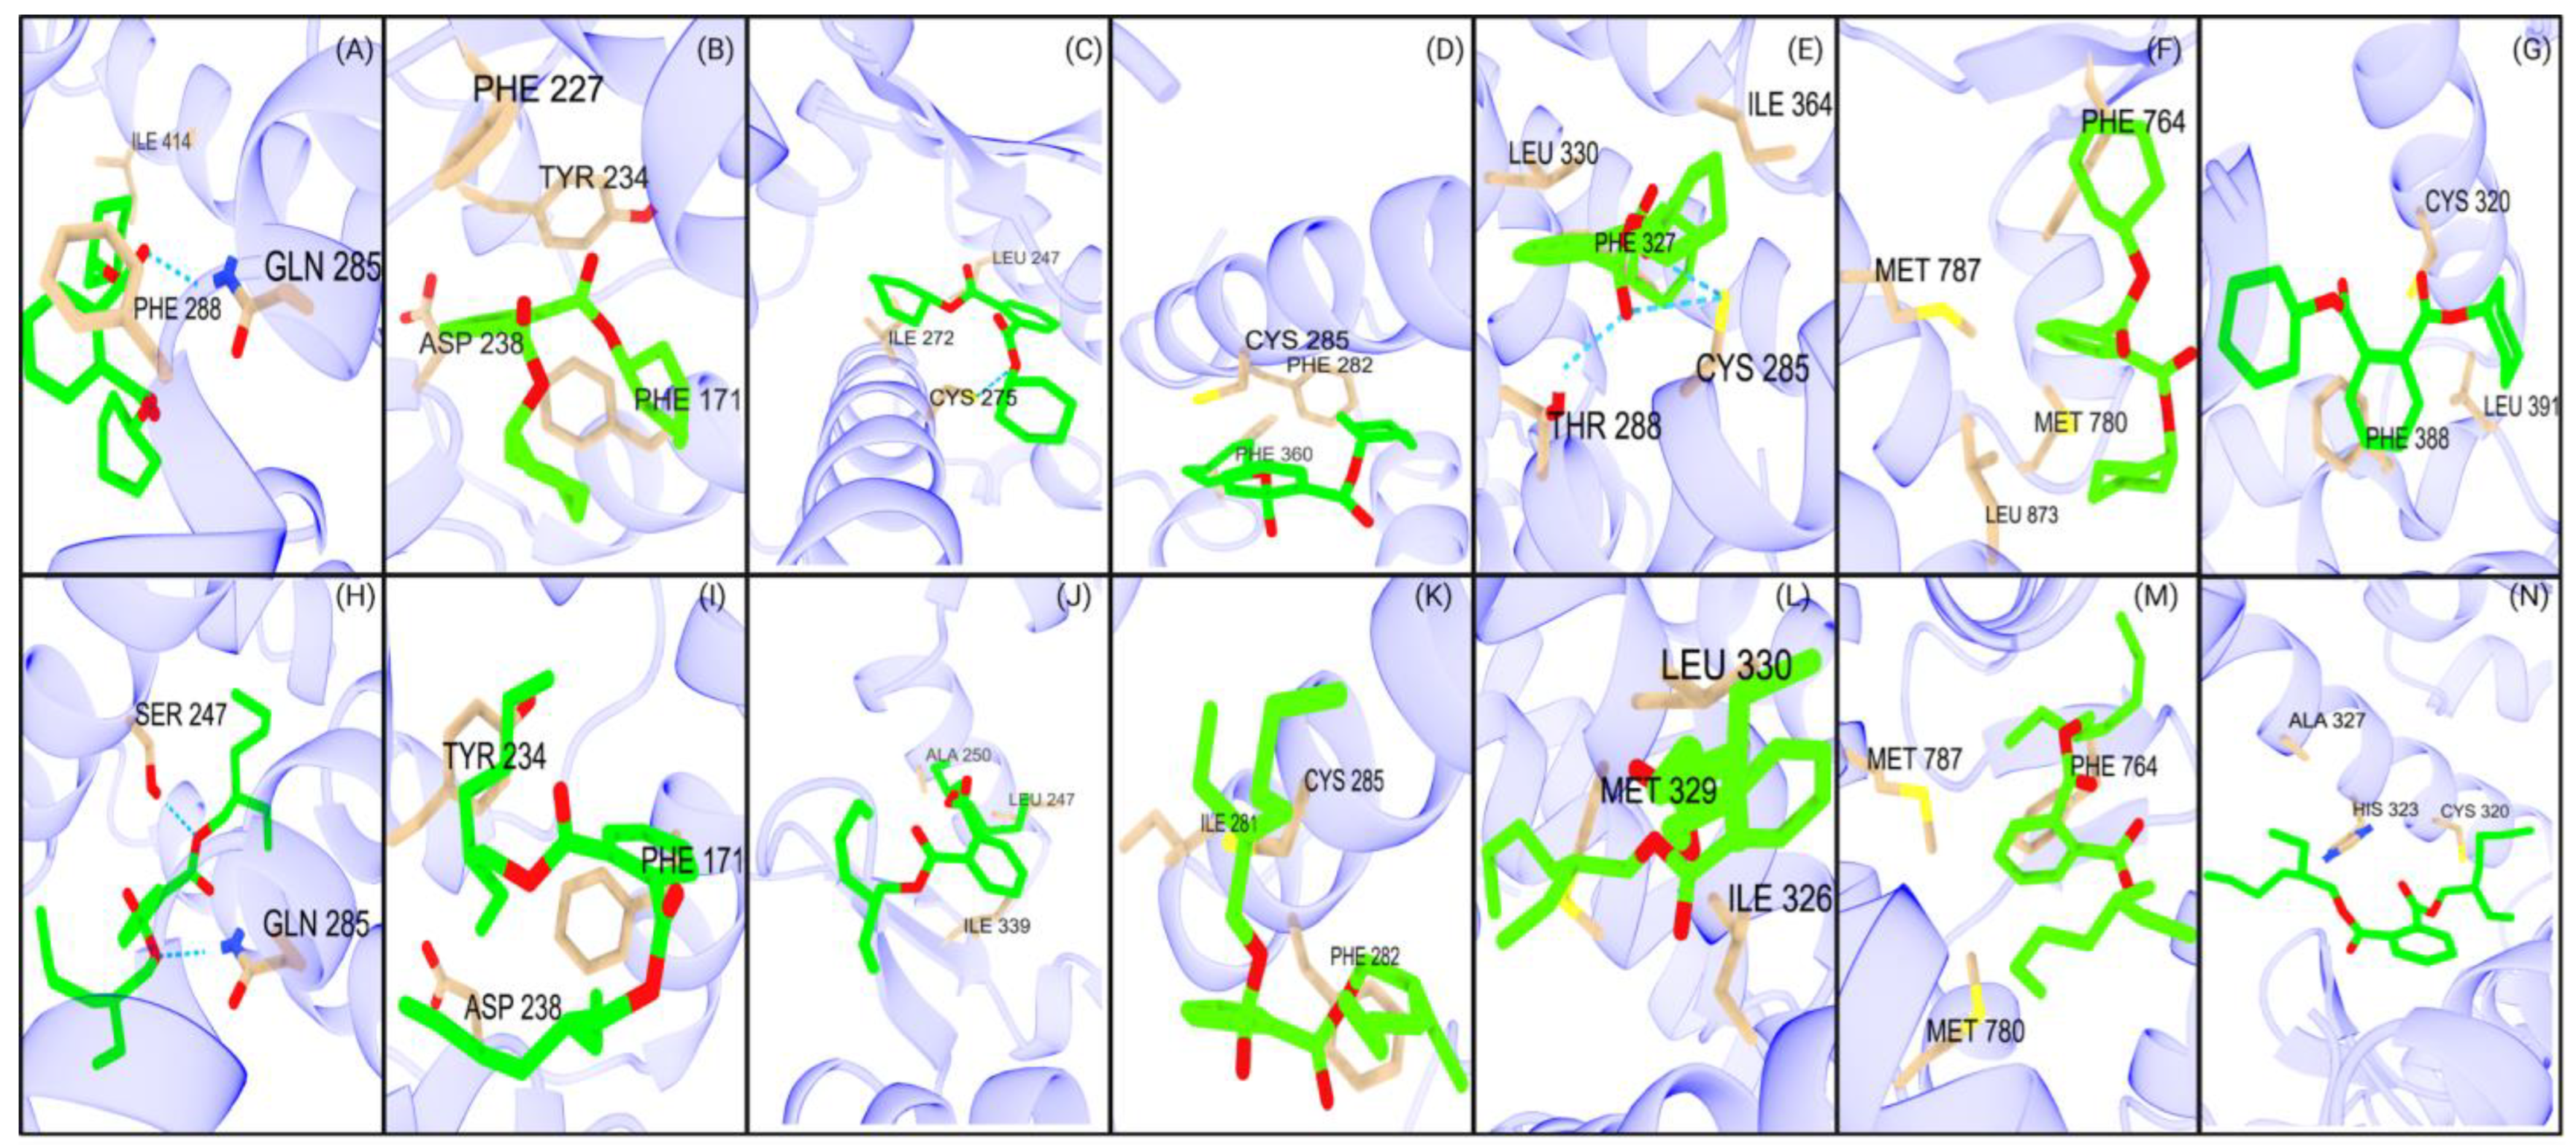
Figure 3.
Major interactions of studied NRs with DCHP and DEHP. The first row (A–G) represents the interactions of seven NRs with DCHP: (A) PXR, (B) CAR, (C) PPARα, (D) PPARγ, (E) PPARδ, (F) AR, and (G) RORγt. The second row (H–N) illustrates the interactions of the same NRs with DEHP: (H) PXR, (I) CAR, (J) PPARα, (K) PPARγ, (L) PPARδ, (M) AR, and (N) RORγt.
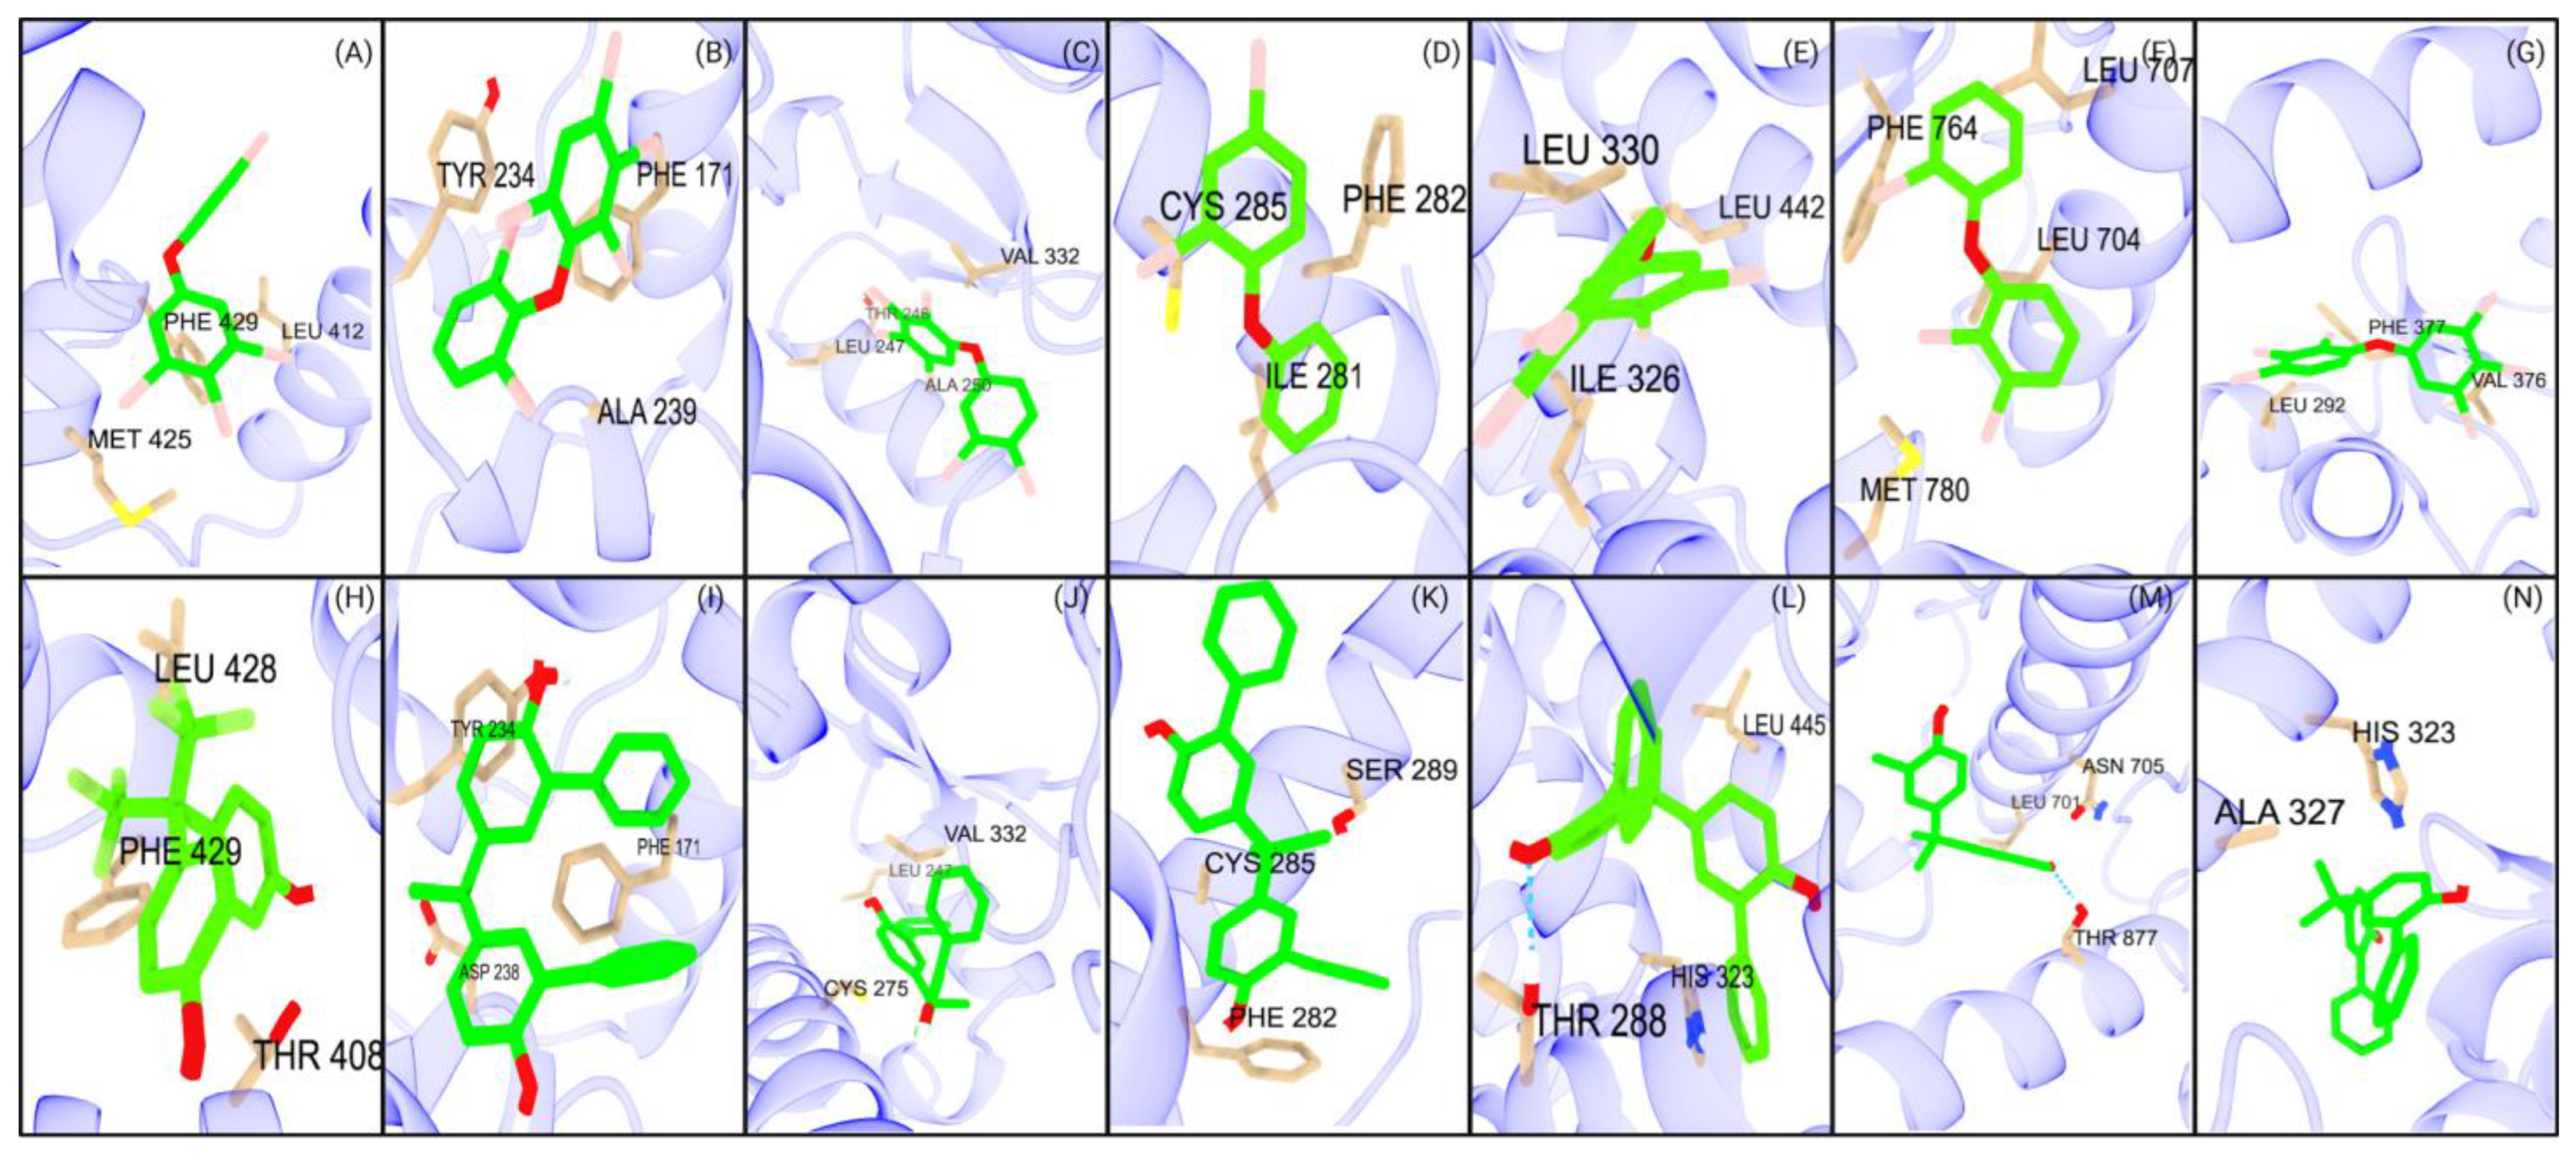
Figure 4.
Top PBDE and BPA major interactions with studied NRs. The first row (A–G) illustrates the interactions of the seven NRs with the top PBDEs: (A) PXR, (B) CAR, (C) PPARα, (D) PPARγ, (E) PPARδ, (F) AR, and (G) RORγt. The second row (H–N) depicts the interactions of the same seven NRs with the top BPAs: (H) PXR, (I) CAR, (J) PPARα, (K) PPARγ, (L) PPARδ, (M) AR, and (N) RORγt.
Figure 5.
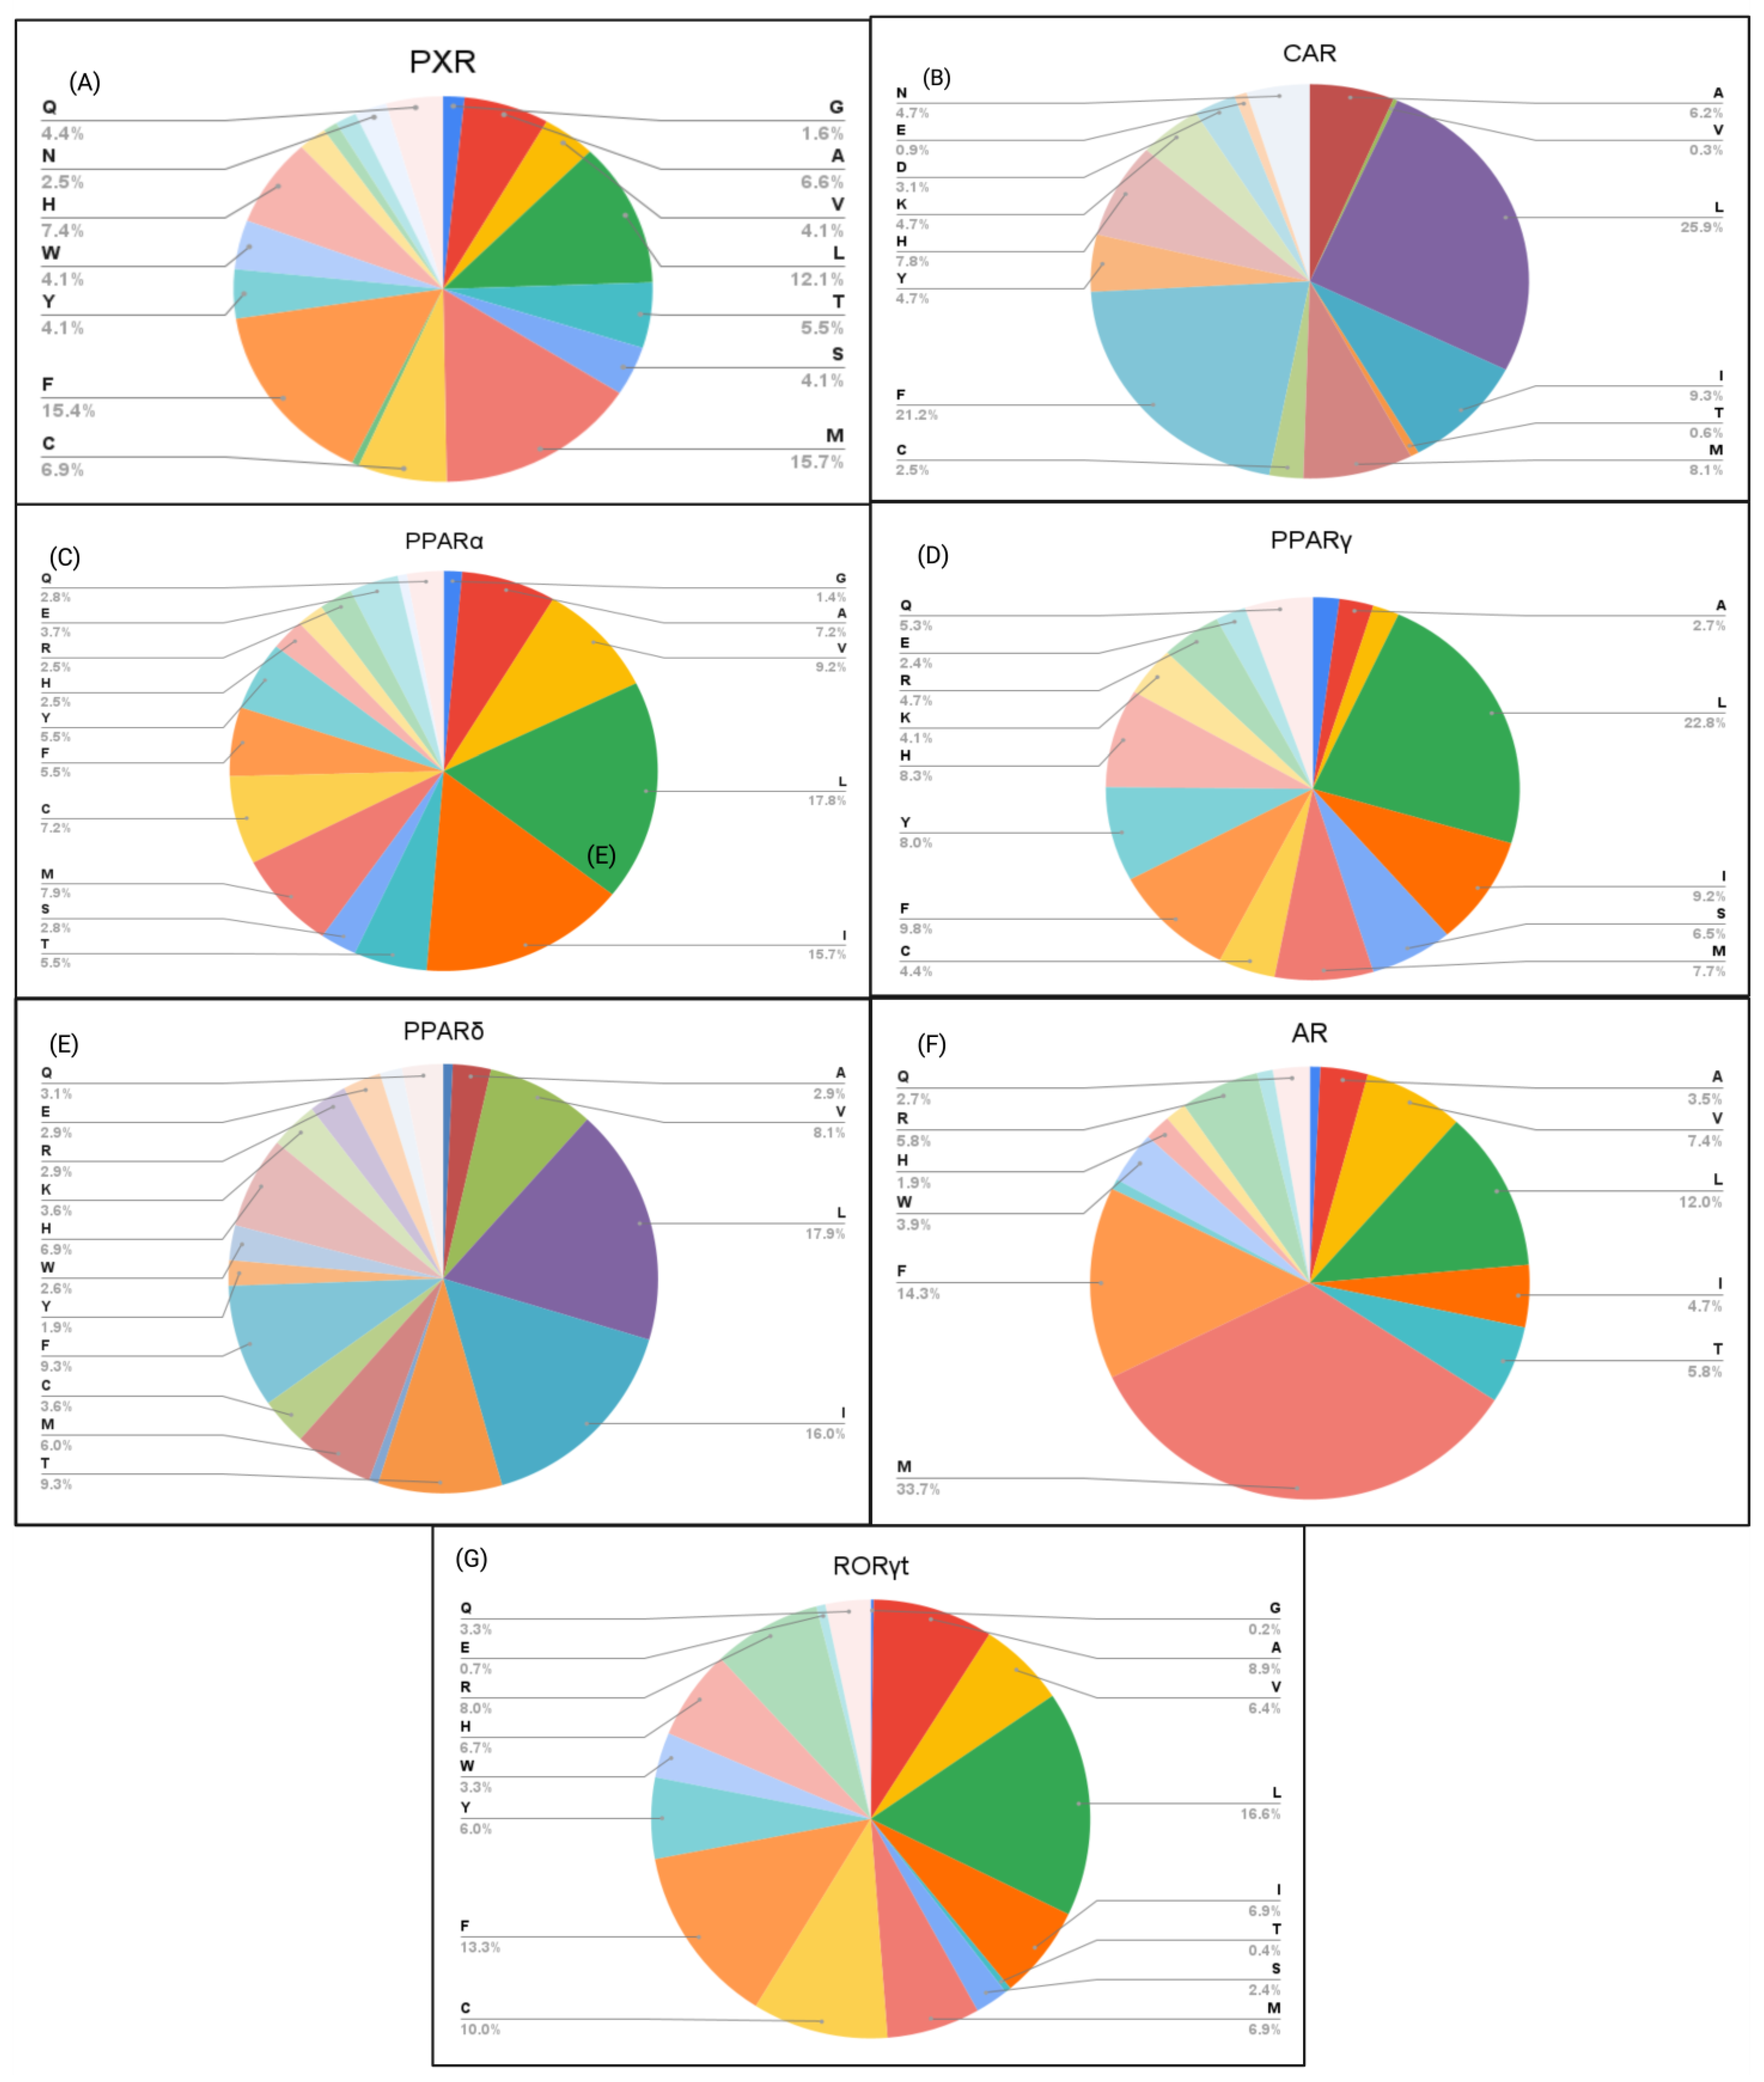
Percentage of NR amino acid residues interacting with the top 15 PFAS binders. (A) PXR, (B) CAR, (C) PPARα, (D) PPARγ, (E) PPARδ, (F) AR, and (G) RORγt.
Figure 5.
Percentage of NR amino acid residues interacting with the top 15 PFAS binders. (A) PXR, (B) CAR, (C) PPARα, (D) PPARγ, (E) PPARδ, (F) AR, and (G) RORγt.
Figure 6.
Percentage of NR amino acid residues interacting with the top 15 nanoplastic binders. (A) PXR, (B) CAR, (C) PPARα, (D) PPARγ, (E) PPARδ, (F) AR, and (G) RORγt.
Figure 6.
Percentage of NR amino acid residues interacting with the top 15 nanoplastic binders. (A) PXR, (B) CAR, (C) PPARα, (D) PPARγ, (E) PPARδ, (F) AR, and (G) RORγt.
Figure 7.
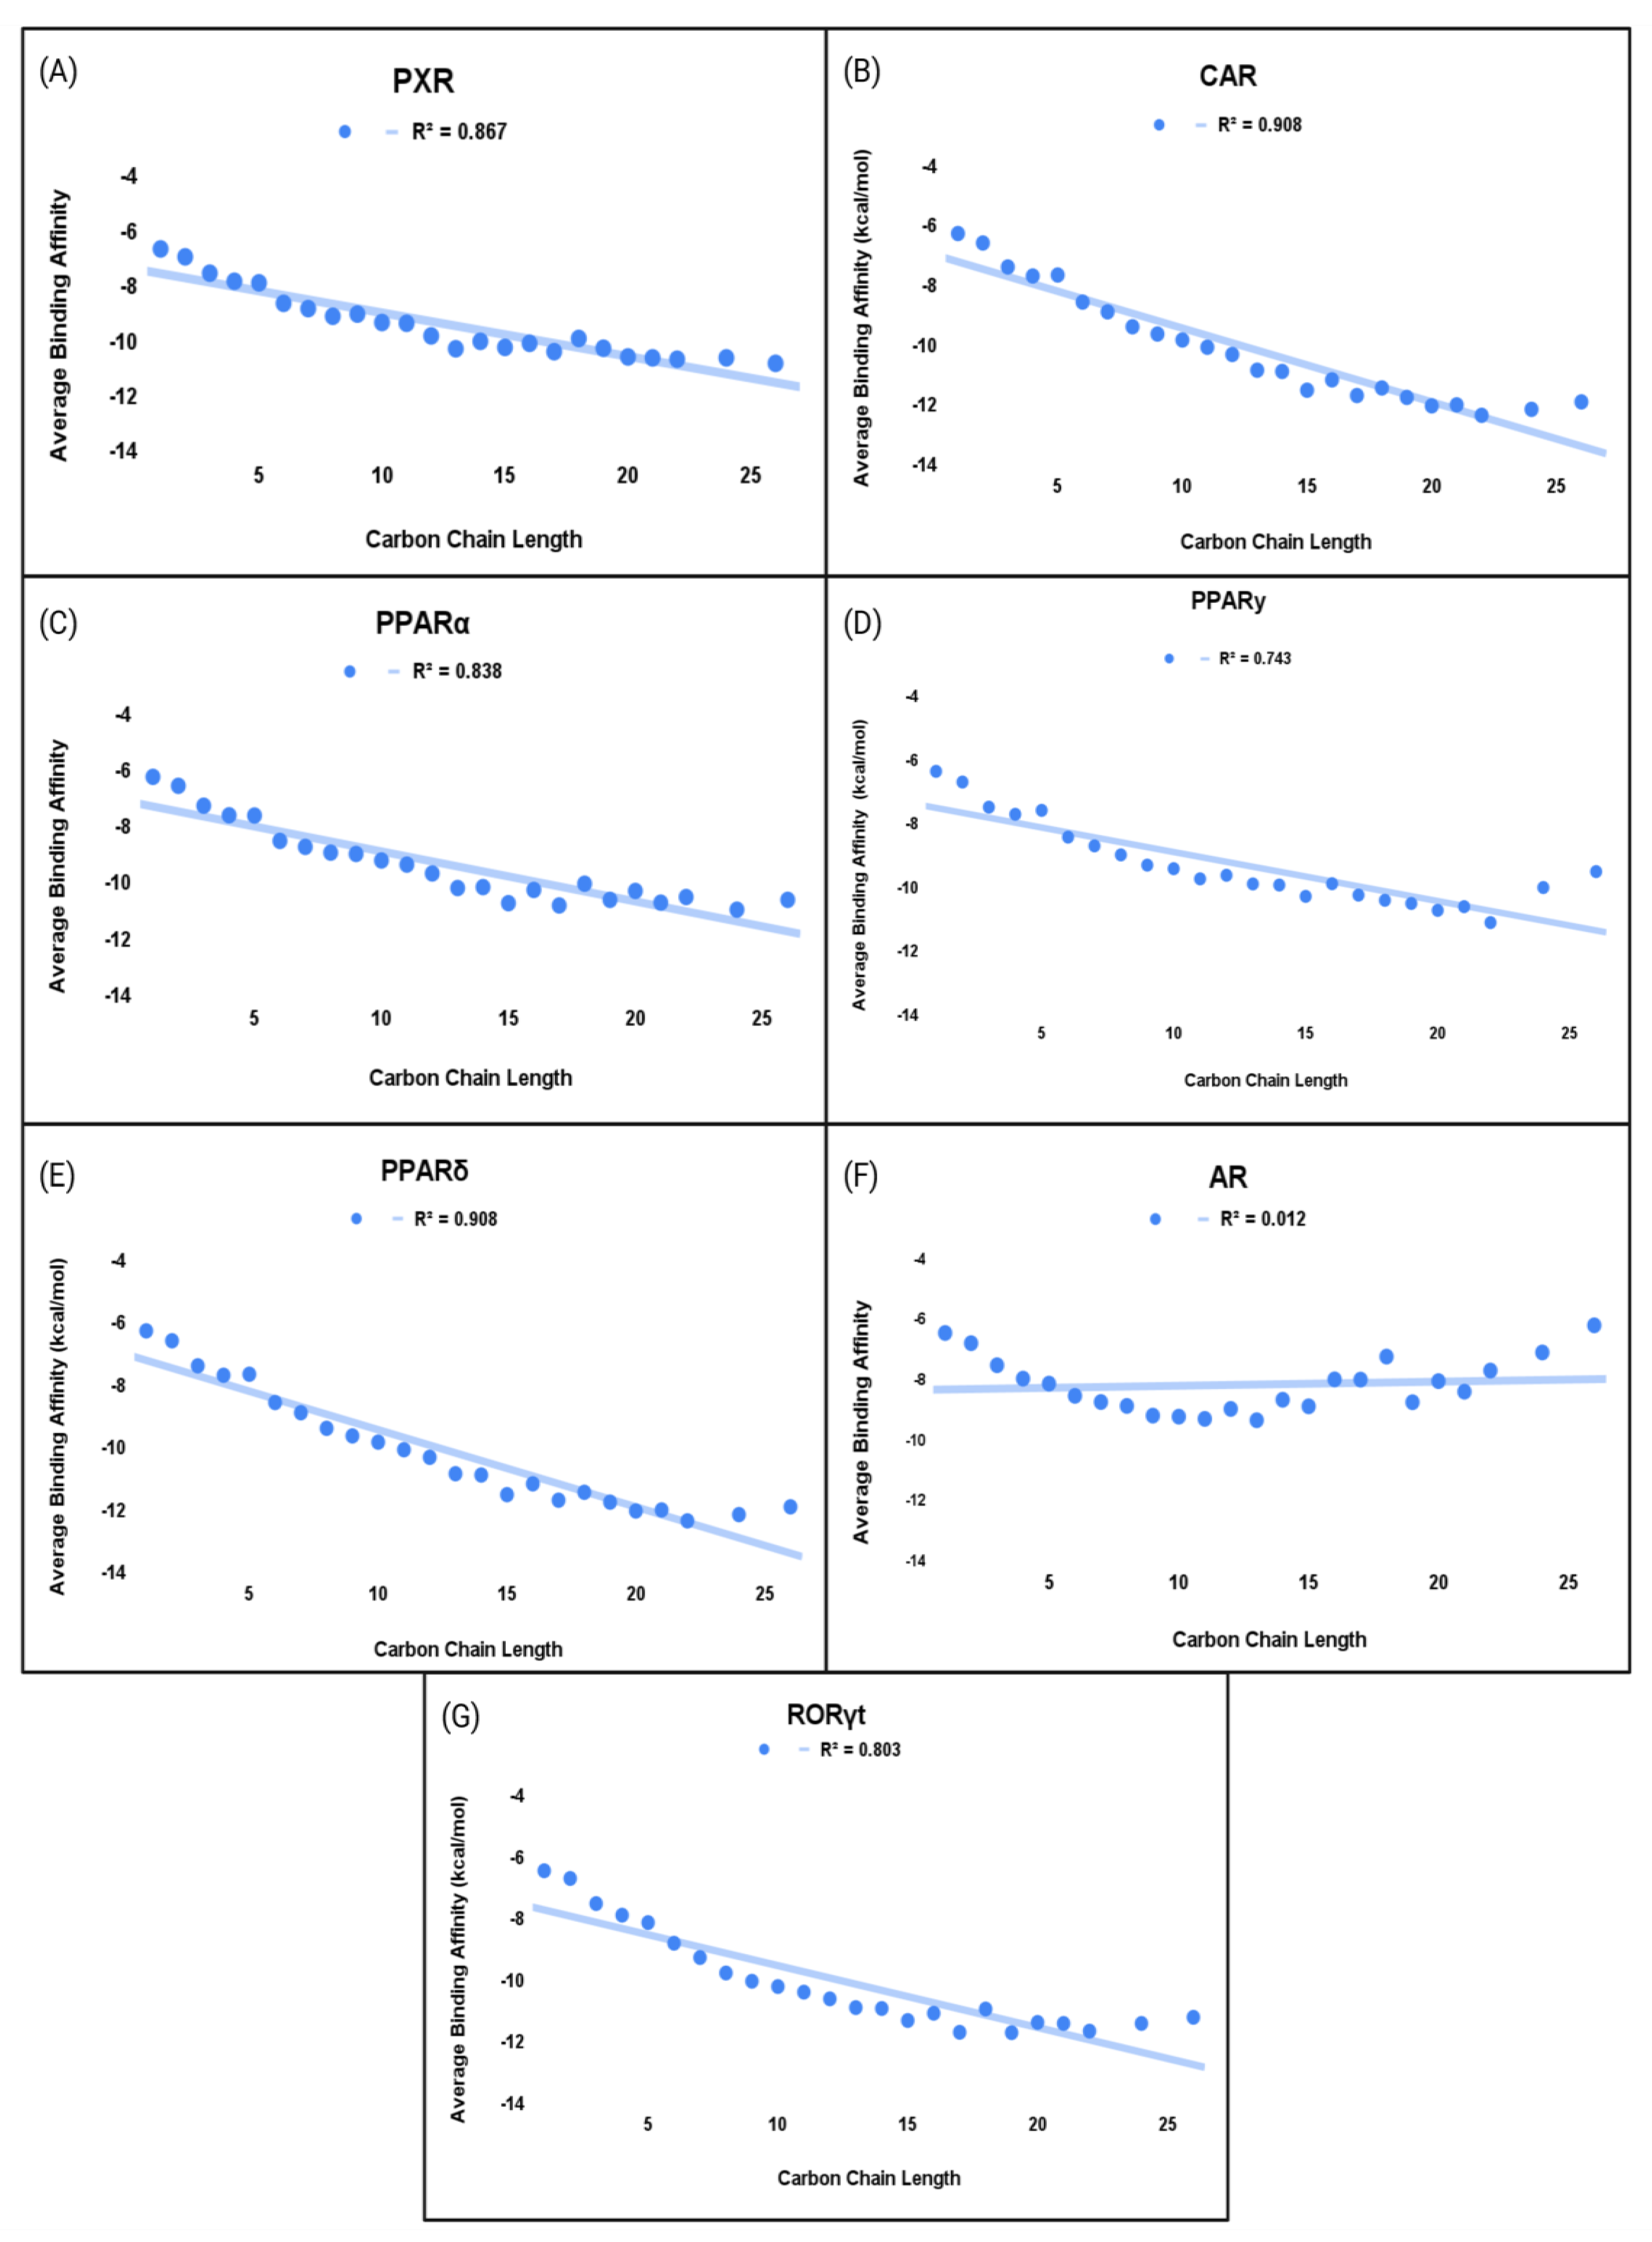
Comprehensive chain length vs. average binding affinity of PFAS to NRs. (A) PXR, (B) CAR, (C) PPARα, (D) PPARγ, (E) PPARδ, (F) AR, and (G) RORγt.
Figure 7.
Comprehensive chain length vs. average binding affinity of PFAS to NRs. (A) PXR, (B) CAR, (C) PPARα, (D) PPARγ, (E) PPARδ, (F) AR, and (G) RORγt.
Figure 8.
Effect of DCHP and DEHP (10 mM, 16 h) on NR activity in HepG2 cells. HepG2 cells were transiently transfected with the optimized trans-FACTORIALTM library. After twenty four hours, the transfection cells were washed, supplied with fresh low-serum (1% FBS, charcoal-stripped) culture medium, and treated with an inducer for 16 h. The profile of the trans-FACTORIALTM activities was determined as a fold of induction values versus vehicle-treated (DMSO) control cells. The graph shows fold-induction data plotted in logarithmic scale. (A) Red-colored data represent dicyclohexyl phthalate to 50 human NRs. Green-colored data represent bis-(2-ethylhexyl) phthalate to 50 human NRs. (B) Red-colored data represent various transcription factors in response to dicyclohexyl phthalate in relation to 50 human NRs. Green-colored data represent various transcription factors in response to bis-(2-ethylhexyl) phthalate in relation to 50 human NRs.
Table 1.
Percentage of NRs with strong, moderate, and weak PFAS binders with count for PXR, CAR, PPARα, PPARγ, PPARδ, AR, and RORγt.
Table 1.
Percentage of NRs with strong, moderate, and weak PFAS binders with count for PXR, CAR, PPARα, PPARγ, PPARδ, AR, and RORγt.
| Receptor | Strong Binder (%) | Moderate Binder (%) | Weak Binder (%) |
|---|
| PXR | 13.1 | 16.8 | 70.2 |
| CAR | 7.8 | 13.9 | 78.3 |
| PPARα | 5.8 | 11.4 | 82.7 |
| PPARγ | 16.9 | 19.0 | 64.1 |
| PPARδ | 8.7 | 12.0 | 79.3 |
| AR | 0.5 | 2.1 | 97.4 |
| RORγt | 12.8 | 13.5 | 73.7 |
Table 2.
Percentage of NRs with strong, moderate, and weak nanoplastic binders with count for PXR, CAR, PPARα, PPARγ, PPARδ, AR, RORγt.
Table 2.
Percentage of NRs with strong, moderate, and weak nanoplastic binders with count for PXR, CAR, PPARα, PPARγ, PPARδ, AR, RORγt.
| Receptor | Strong Binder (%) | Moderate Binder (%) | Weak Binder (%) |
|---|
| PXR | 6.5 | 10.6 | 82.8 |
| CAR | 1.5 | 4.2 | 94.3 |
| PPARα | 0.9 | 3.8 | 95.3 |
| PPARγ | 8.2 | 9.9 | 81.8 |
| PPARδ | 2.6 | 7.1 | 90.3 |
| AR | 0.1 | 0.4 | 99.5 |
| RORγt | 2.1 | 6.2 | 91.7 |
Table 3.
Average docking score (kcal/mol) of functional groups for seven studied NRs.
Table 3.
Average docking score (kcal/mol) of functional groups for seven studied NRs.
| Functional Group Present in PFAS | CAR | PXR | PPARα | PPARγ | PPARδ | AR |
|---|
| Alcohol | −8.17 | −7.9 | −7.79 | −7.67 | −7.96 | −7.78 |
| Aldehyde | −7.46 | −7.24 | −7.11 | −7.09 | −7.29 | −7.32 |
| Alkene | −7.82 | −7.49 | −7.28 | −7.34 | −7.38 | −7.52 |
| Alkyne | −7.18 | −7.03 | −6.72 | −7.05 | −6.95 | −7.00 |
| Amide | −8.27 | −8.61 | −8.32 | −8.38 | −8.59 | −7.99 |
| Amine | −7.78 | −7.66 | −7.48 | −7.47 | −7.56 | −7.65 |
| Anhydride | −8.82 | −8.58 | −8.2 | −8.47 | −8.49 | −8.23 |
| Carbamate | −8.67 | −8.93 | −8.81 | −8.96 | −9.22 | −7.88 |
| Carboxylic Acid | −8.31 | −7.95 | −7.86 | −7.66 | −8.03 | −7.91 |
| Disulfide | −7.09 | −6.85 | −6.36 | −6.44 | −6.50 | −6.77 |
| Ester | −8.06 | −7.79 | −7.76 | −7.9 | −7.87 | −7.71 |
| Ether | −7.89 | −7.63 | −7.51 | −7.64 | −7.62 | −7.56 |
| Halide | −7.82 | −7.57 | −7.36 | −7.39 | −7.49 | −7.52 |
| Isocyanate | −7.29 | −6.98 | −6.87 | −6.971 | −6.92 | −7.32 |
| Ketone | −8.11 | −7.9 | −7.78 | −7.81 | −7.92 | −7.8 |
| Nitrile | −7.06 | −7.11 | −6.84 | −6.8 | −6.90 | −6.97 |
| Phenyl | −8.34 | −8.28 | −7.86 | −8.04 | −8.15 | −7.82 |
| Sulfide | −7.59 | −7.46 | −7.28 | −7.15 | −7.40 | −7.3 |
| Sulfinate Ester | −6.54 | −6.19 | −6.29 | −6.52 | −6.12 | −6.59 |
| Sulfonamide | −8.68 | −8.49 | −8.38 | −8.44 | −8.72 | −8.04 |
| Sulfonate Ester | −8.26 | −7.96 | −7.65 | −8.13 | −7.92 | −7.98 |
| Sulfone | −8.67 | −8.37 | −8.2 | −8.26 | −8.50 | −8.11 |
| Sulfonic Acid | −9.06 | −8.6 | −8.58 | −8.41 | −8.85 | −8.45 |
| Sulfoxide | −7.9 | −7.77 | −7.58 | −7.41 | −7.89 | −7.63 |
| Thioketone | −6.16 | −6.11 | −5.84 | −6.06 | −5.80 | −6.11 |
| Thiol | −6.5 | −6.37 | −6.12 | −6.18 | −6.14 | −6.44 |
| Urea | −7.54 | −9.28 | −8.76 | −8.47 | −8.94 | −7.36 |
Table 4.
Heat map of the top 25 binders of PFAS bound to CAR, PXR, AR, PPARα, PPARγ, PPARδ, and RORγt. Light yellow represents compounds that appear twice between the NRs. Light orange represents compounds that appear three times.
Table 4.
Heat map of the top 25 binders of PFAS bound to CAR, PXR, AR, PPARα, PPARγ, PPARδ, and RORγt. Light yellow represents compounds that appear twice between the NRs. Light orange represents compounds that appear three times.
| | CAR | PXR | AR | PPARα | PPARγ | PPARδ | RORγt |
|---|
| 1 | 662-28-2 | 5366-99-4 | 306-91-2 | 548470-06-0 | NOCAS_1026885 | 21674-38-4 | 862130-96-9 |
| 2 | 306-91-2 | 61778-79-8 | 86630-50-4 | 547748-28-7 | 57589-85-2 | 57101-59-4 | 86630-50-4 |
| 3 | 307-08-4 | 548470-06-0 | 558-64-5 | 21674-38-4 | 151707-04-9 | 347838-21-5 | 88951-08-0 |
| 4 | 118914-94-6 | NOCAS_871520 | 119107-96-9 | NOCAS_1027003 | 749924-57-0 | 25761-65-3 | NOCAS_1026885 |
| 5 | 558-64-5 | 347838-21-5 | 61855-74-1 | 1075687-38-5 | 919293-76-8 | 230295-10-0 | 2663-96-9 |
| 6 | 118914-93-5 | NOCAS_1026885 | 306-99-0 | 151707-03-8 | 1075687-38-5 | 862589-19-3 | 305849-27-8 |
| 7 | 97571-69-2 | 131662-80-1 | 306-95-6 | 25761-65-3 | 646533-88-2 | 23790-50-3 | 15038-90-1 |
| 8 | 33021-47-5 | 146304-71-4 | NOCAS_1027599 | 61798-68-3 | 919293-77-9 | 548470-06-0 | 3824-74-6 |
| 9 | 306-99-0 | 126565-13-7 | NOCAS_1026765 | 464-34-6 | 919293-78-0 | NOCAS_1027003 | 61855-74-1 |
| 10 | 118945-64-5 | 446043-85-2 | 95827-25-1 | NOCAS_1035154 | 55987-23-0 | 1127427-75-1 | 819792-77-3 |
| 11 | 307-07-3 | NOCAS_1026915 | 118914-93-5 | NOCAS_1026885 | 231953-37-0 | 146304-71-4 | 862130-87-8 |
| 12 | 105462-77-9 | NOCAS_1026998 | 119141-86-5 | 55987-23-0 | 68541-01-5 | 649561-66-0 | 862130-95-8 |
| 13 | 125061-94-1 | 125061-94-1 | 114832-09-6 | 160248-96-4 | 151707-03-8 | 548434-15-7 | 862133-29-7 |
| 14 | 61855-74-1 | 87667-00-3 | 119141-87-6 | NOCAS_1035147 | 675583-26-3 | 126565-13-7 | 151707-04-9 |
| 15 | 119107-96-9 | 61547-75-9 | 306-92-3 | 548455-52-3 | 667938-69-4 | 646533-88-2 | 61547-75-9 |
| 16 | 118945-65-6 | NOCAS_1027048 | 662-28-2 | 916770-15-5 | 134880-89-0 | 231630-88-9 | 862130-67-4 |
| 17 | 95827-25-1 | 60131-74-0 | 60433-12-7 | 4314-47-0 | 61547-75-9 | 677033-16-8 | NOCAS_1027003 |
| 18 | NOCAS_1027599 | 662-28-2 | 306-94-5 | 1555-24-4 | 74582-85-7 | 61778-79-8 | 112242-89-4 |
| 19 | 444658-67-7 | NOCAS_1026766 | 60433-11-6 | 548478-86-0 | 915-76-4 | 548478-86-0 | 24768-65-8 |
| 20 | 17051-14-8 | 876517-48-5 | 86714-34-3 | 305849-27-8 | 200862-70-0 | 1127427-64-8 | 146304-71-4 |
| 21 | 119141-86-5 | 919489-99-9 | 444658-67-7 | 57338-64-4 | 1555-24-4 | 61798-68-3 | 55987-23-0 |
| 22 | 306-95-6 | 116265-66-8 | 107349-88-2 | NOCAS_1035142 | 234449-42-4 | 848352-66-9 | 862133-15-1 |
| 23 | 119107-97-0 | 48240-25-1 | 118945-64-5 | NOCAS_1035206 | 864149-62-2 | 548455-85-2 | NOCAS_1026997 |
| 24 | 114832-09-6 | 304658-31-9 | 49771-67-7 | NOCAS_1035822 | 881689-01-6 | NOCAS_1026885 | 306-99-0 |
| 25 | 68697-63-2 | NOCAS_1009912 | 105462-77-9 | 240121-57-7 | 132877-69-1 | 749924-57-0 | 4314-47-0 |
Table 5.
Heat map of the top 25 binders of PBDE bound to CAR, PXR, AR, PPARα, PPARγ, PPARδ, and RORγt. Light yellow represents compounds that appear twice between the NRs. Light orange represents compounds that appear three times. The dark orange represents compounds that appear 4 times. The darkest orange represents compounds appearing 5 times.
| | CAR | PXR | AR | PPARα | PPARγ | PPARδ | RORγt |
|---|
| 1 | 446255-01-2 | 446255-18-1 | 147217-74-1 | 405237-85-6 | 446254-32-6 | 366791-32-4 | 446255-08-9 |
| 2 | 446254-72-4 | 446254-80-4 | 446254-24-6 | 446254-95-1 | 68631-49-2 | 373594-78-6 | 373594-78-6 |
| 3 | 218304-36-0 | 93703-48-1 | 337513-55-0 | 51452-87-0 | 337513-67-4 | 446254-48-4 | 366791-32-4 |
| 4 | 446254-55-3 | 446254-86-0 | 337513-68-5 | 446254-71-3 | 171977-44-9 | 405237-85-6 | 446254-82-6 |
| 5 | 446254-63-3 | 373594-78-6 | 446254-62-2 | 83694-71-7 | 446254-80-4 | 337513-68-5 | 446254-31-5 |
| 6 | 117948-63-7 | 366791-32-4 | 446254-45-1 | 147217-72-9 | 189084-59-1 | 446254-82-6 | 446255-18-1 |
| 7 | 446254-33-7 | 446255-07-8 | 446254-28-0 | 446254-70-2 | 46438-88-4 | 103173-66-6 | 446254-27-9 |
| 8 | 446254-17-7 | 446254-45-1 | 147217-76-3 | 446255-17-0 | 60348-60-9 | 446254-77-9 | 446254-70-2 |
| 9 | 446254-30-4 | 446254-28-0 | 446254-19-9 | 446254-97-3 | 147217-77-4 | 446254-84-8 | 446254-71-3 |
| 10 | 327185-09-1 | 189084-61-5 | 446254-15-5 | 366791-32-4 | 337513-54-9 | 446254-32-6 | 182677-28-7 |
| 11 | 446254-21-3 | 446254-29-1 | 49690-94-0 | 446254-27-9 | 446254-65-5 | 446254-39-3 | 446254-48-4 |
| 12 | 446254-32-6 | 446254-31-5 | 189084-62-6 | 446254-38-2 | 5436-43-1 | 446254-31-5 | 405237-85-6 |
| 13 | 446254-35-9 | 446254-39-3 | 147217-75-2 | 446254-48-4 | 189084-61-5 | 446254-64-4 | 446254-80-4 |
| 14 | 446254-36-0 | 446254-82-6 | 407606-55-7 | 407606-55-7 | 337513-55-0 | 446254-18-8 | 93703-48-1 |
| 15 | 446254-37-1 | 446254-64-4 | 337513-75-4 | 147217-73-0 | 101-55-3 | 189084-59-1 | 446254-28-0 |
| 16 | 446254-68-8 | 446254-50-8 | 446254-30-4 | 446255-10-3 | 93703-48-1 | 147217-77-4 | 446254-81-5 |
| 17 | 446254-95-1 | 446255-13-6 | 337513-53-8 | 446255-18-1 | 337513-72-1 | 446255-13-6 | 327185-11-5 |
| 18 | 446255-00-1 | 446254-19-9 | 446254-25-7 | 446254-45-1 | 446254-70-2 | 446254-20-2 | 446254-38-2 |
| 19 | 446255-12-5 | 147217-81-0 | 337513-56-1 | 446254-39-3 | 366791-32-4 | 446254-51-9 | 446254-83-7 |
| 20 | 446255-20-5 | 446254-27-9 | 446254-18-8 | 446254-50-8 | 407606-55-7 | 327185-11-5 | 446254-34-8 |
| 21 | 337513-66-3 | 446254-38-2 | 337513-82-3 | 446254-53-1 | 446254-39-3 | 60348-60-9 | 446254-78-0 |
| 22 | 51930-04-02 | 446254-71-3 | 147217-81-0 | 446254-32-6 | 259087-35-9 | 446254-38-2 | 446255-09-0 |
| 23 | 189084-60-4 | 446254-42-8 | 446255-04-5 | 147217-71-8 | 417727-71-0 | 446255-18-1 | 446254-96-2 |
| 24 | 337513-68-5 | 446254-48-4 | 446254-27-9 | 101-55-3 | 147217-75-2 | 147217-76-3 | 147217-76-3 |
| 25 | 446254-22-4 | 446255-08-9 | 446254-53-1 | 446254-84-8 | 337513-66-3 | 446254-86-0 | 147217-79-6 |
Table 6.
Heat map of top 25 binders of plastic chemicals bound to CAR, PXR, AR, PPARα, PPARγ, PPARδ, and RORγt. Light yellow represents compounds that appear twice between the NRs. Light orange represents compounds that appear three times. Dark orange represents compounds that appear 4 times. The darkest orange represents compounds appearing 5 times, and red represents compounds appearing in all 6 receptors.
| | CAR | PXR | AR | PPARα | PPARγ | PPARδ | RORγt |
|---|
| 1 | 5385-75-1 | 440102-72-7 | 56-49-5 | 5385-75-1 | 5385-75-1 | 128-80-3 | 1533-45-5 |
| 2 | 4076-39-5 | 5468-75-7 | 6925-69-5 | 57583-54-7 | 1324-76-1 | 54299-17-1 | 54299-17-1 |
| 3 | 57-97-6 | 7128-64-5 | 4076-39-5 | 24038-68-4 | 57583-54-7 | 1533-45-5 | 69227-22-1 |
| 4 | 24038-68-4 | 101463-69-8 | 57-97-6 | 3697-24-3 | 54299-17-1 | 128-69-8 | 177936 |
| 5 | 0376-06-07 | 54299-17-1 | 307-55-1 | 791156 | 1533-45-5 | 7128-64-5 | 1594-08-07 |
| 6 | 63-05-8 | 1650964 | 1705-85-7 | 72629-94-8 | 56-49-5 | 101463-69-8 | 72629-94-8 |
| 7 | 72629-94-8 | 24938-16-7 | 72629-94-8 | 0376-06-07 | 82657-04-03 | 5385-75-1 | 26375-23-5 |
| 8 | 307-55-1 | 5979-28-2 | 0376-06-07 | 2725-22-6 | 24038-68-4 | 56-49-5 | 0376-06-07 |
| 9 | 13595-25-0 | 1533-45-5 | 86112-79-0 | 56-49-5 | 101463-69-8 | 791156 | 7128-64-5 |
| 10 | 2772-45-4 | 22094-93-5 | 3697-24-3 | 1533-45-5 | 12237-62-6 | 1705-85-7 | 307-55-1 |
| 11 | 56-49-5 | 128-80-3 | 2058-94-8 | 1705-85-7 | 31107-36-5 | 24038-68-4 | 791156 |
| 12 | 6925-69-5 | 65181-78-4 | 7576-65-0 | 4129-84-4 | 177936 | 57583-54-7 | 3118-97-6 |
| 13 | 86112-79-0 | 31107-36-5 | 57-83-0 | 86112-79-0 | 26967-76-0 | 0376-06-07 | 0563-04-02 |
| 14 | 3697-24-3 | 68959-00-2 | 8003-22-3 | 23328-53-2 | 2398-96-1 | 18254-13-2 | 82657-04-03 |
| 15 | 1705-85-7 | 67905-17-3 | 302-97-6 | 57-97-6 | 4702-90-3 | 61788-44-1 | 302-97-6 |
| 16 | 2058-94-8 | 13676-91-0 | 63-05-8 | 177936 | 6505-28-8 | 177936 | 67905-17-3 |
| 17 | 84-15-1 | 5102-79-4 | 84-47-9 | 67905-17-3 | 90268-24-9 | 65181-78-4 | 7417-99-4 |
| 18 | 26898-17-9 | 981-40-8 | 335-76-2 | 4076-39-5 | 0376-06-07 | 68937-40-6 | 128-80-3 |
| 19 | 13676-91-0 | 18254-13-2 | 58-22-0 | 26967-76-0 | 6925-69-5 | 26967-76-0 | 31107-36-5 |
| 20 | 82657-04-03 | 61788-44-1 | 53-16-7 | 1324-76-1 | 78-32-0 | 72629-94-8 | 53-16-7 |
| 21 | 68411-46-1 | 4076-39-5 | 7128-64-5 | 12237-62-6 | 1330-78-5 | 57-97-6 | 68610-51-5 |
| 22 | 3910-35-8 | 0376-06-07 | 483-65-8 | 5522-43-0 | 13676-54-5 | 5468-75-7 | 8003-22-3 |
| 23 | 77-09-8 | 8003-22-3 | 5522-43-0 | 981-40-8 | 69227-22-1 | 67905-17-3 | 86112-79-0 |
| 24 | 57-41-0 | 177936 | 53-06-5 | 72363-26-9 | 128-80-3 | 82451-48-7 | 12237-62-6 |
| 25 | 54048-10-1 | 5124-25-4 | 2478-20-8 | 82-28-0 | 26898-17-9 | 4076-39-5 | 13676-91-0 |
Table 7.
Heat map of docking scores of PFAS pesticides bound to CAR, AR, PXR, PPARα, PPARγ, PPARδ, and RORγt. The green color represents lower binding affinity and as the gradient approaches red, it indicates a higher binding affinity.
Table 7.
Heat map of docking scores of PFAS pesticides bound to CAR, AR, PXR, PPARα, PPARγ, PPARδ, and RORγt. The green color represents lower binding affinity and as the gradient approaches red, it indicates a higher binding affinity.
| Compound | EPA ID | CAR | AR | PXR | PPARα | PPARγ | PPARδ | RORγt |
|---|
| Acifluorfen–sodium | 114402 | −8.8 | −7.5 | −8.5 | −8 | −8.9 | −8.9 | −9.2 |
| Bifenthrin | 128825 | −9.6 | −5.5 | −10 | −10.3 | −10.1 | −10.9 | −9.5 |
| Bromethalin | 112802 | −8.1 | −7.2 | −7.6 | −5.7 | −7.4 | −5.8 | −6.2 |
| Chlorfenapyr | 129093 | −8.1 | −7.8 | −7.4 | −6.4 | −6.9 | −7.6 | −7.4 |
| Cyflufenamid | 555550 | −9.1 | −5.9 | −9.4 | −8.2 | −10.1 | −8.7 | −7.4 |
| Cyflumetofen | 138831 | −7.1 | −5.9 | −8.1 | −6.1 | −7.9 | −7.5 | −7.2 |
| Dithiopyr | 128994 | −8.2 | −7.1 | −6.3 | −5.2 | −6 | −7 | −6.2 |
| Ethalfluralin | 113101 | −8 | −8 | −6.9 | −6 | −7.1 | −7 | −6.8 |
| Fipronil | 129121 | −7.7 | −7.7 | −8.2 | −7.1 | −7.3 | −8 | −8.4 |
| Fluazifop-P-butyl | 122809 | −7.7 | −7.8 | −8.7 | −8.3 | −8.3 | −8.9 | −9 |
| Flufenacet | 121903 | −8.1 | −8.1 | −8.7 | −7.9 | −8.4 | −8.2 | −8 |
| Fluridone | 112900 | −9.3 | −8 | −9.5 | −9.6 | −10 | −9.9 | −9.2 |
| Flurprimidol | 125701 | −8 | −9.1 | −8.5 | −6.8 | −8.4 | −7.6 | −7.1 |
| Flutolanil | 128975 | −8.8 | −5.5 | −8.6 | −7.9 | −8.5 | −9.2 | −9.3 |
| Fluvalinate | 109302 | −8.7 | #N/A | −10.4 | −9.7 | −10.3 | −10.6 | −10 |
| Fomesafen | 123802 | #N/A | −7.1 | #N/A | #N/A | #N/A | #N/A | #N/A |
| gamma-Cyhalothrin | 128807 | −10 | −6.4 | −9.7 | −9 | −9.3 | −10.2 | −7.8 |
| Hexaflumuron | 118202 | −7.1 | −7.1 | #N/A | −9.6 | −8.9 | −9.8 | −9.6 |
| Hydramethylnon | 118401 | −7.1 | −8.2 | −10.4 | −9.6 | −10.2 | −12.3 | −8.9 |
| Lactofen | 128888 | −8.1 | −7 | −9.1 | −9.1 | −9 | −9.2 | −8.7 |
| lambda-Cyhalothrin | 128897 | #N/A | −8.8 | −9.9 | −8 | −9.9 | −10 | −6.5 |
| Norflurazon | 105801 | −8.4 | −7.6 | −8.3 | −7.8 | −8.3 | −8.2 | −8 |
| Novaluron | 124002 | −7.4 | −6.6 | −10.7 | −9.5 | −10.3 | −10.5 | −10.4 |
| Noviflumuron | 118204 | −7.8 | −9.3 | −10.8 | −9.6 | −9.4 | −10.4 | −10.8 |
| Oxathiapiprolin | 128111 | −8 | −9 | −10.7 | −9.2 | −10.8 | −11.6 | −10.5 |
| Oxyfluorfen | 111601 | −8.2 | −6.1 | −8.3 | −7.9 | −8.5 | −8.6 | −8.6 |
| Penoxsulam | 119031 | −8.1 | −7.3 | −9.2 | −7.7 | −9 | −7.7 | −9.1 |
| Picoxystrobin | 129200 | −9.4 | −7.1 | −8.3 | −8.3 | −7.7 | −8.5 | −7.4 |
| Prodiamine | 110201 | −7.3 | −5.9 | −6.6 | −5.9 | −6.6 | −6.6 | −6.2 |
| Prosulfuron | 129031 | −8.1 | −9.5 | −9.6 | −8.4 | −10 | −8.9 | −9.2 |
| Pyridalyl | 295149 | −8.9 | −8.5 | −9.4 | −8.5 | −8.7 | −9.3 | −9.2 |
| Pyrifluquinazon | 555555 | −9.2 | −6.2 | −9.7 | −8.2 | −10.3 | −9.9 | −8.5 |
| Saflufenacil | 118203 | −6.6 | −8.8 | −10.6 | −8.4 | −9 | −10.4 | −8.9 |
| Tefluthrin | 128912 | −9.2 | −8 | −9 | −7.9 | −9 | −9.5 | −9.9 |
| Tetraconazole | 120603 | −8.1 | −8.1 | −8.1 | −7.1 | −7.9 | −7.4 | −7.8 |
| Tralopyril | 119093 | −8.9 | −8.2 | −8 | −7.2 | −8.7 | −7.9 | −8.1 |
| Trifloxystrobin | 129112 | −9.2 | −7.3 | −9.8 | −9.2 | −9.1 | −8.8 | −9.4 |
| Triflumizole | 128879 | −8.7 | −6.8 | −7 | −7.6 | −7.3 | −7.2 | −7.6 |
| Triflusulfuron-methyl | 129002 | −6.8 | #N/A | −9.6 | −8.9 | −9.8 | −8.8 | −9 |
Table 8.
Heat map of docking scores of bisphenols bound to CAR, AR, PXR, PPARα, PPARγ, PPARδ, and RORγt. The green color represents lower binding affinity and as the gradient approaches red, it indicates a higher binding affinity.
Table 8.
Heat map of docking scores of bisphenols bound to CAR, AR, PXR, PPARα, PPARγ, PPARδ, and RORγt. The green color represents lower binding affinity and as the gradient approaches red, it indicates a higher binding affinity.
| Compound | CASRN | CAR | AR | PXR | PPARα | PPARγ | PPARδ | RORγt |
|---|
| 4,4′-isopropylidenediphenol | 80-05-7 | −8.6 | −8.2 | −8.4 | −6.9 | −7 | −7.5 | −7 |
| 4,4′-sulphonyldiphenol | 80-09-1 | −7.8 | −7.6 | −7.6 | −6.7 | −7 | −7.6 | −7 |
| 4,4′-methylenediphenol | 620-92-8 | −7.5 | −7.4 | −7.5 | −7.2 | −7.7 | −7 | −7.7 |
| 4,4′-(1-methylpropylidene)bisphenol | 77-40-7 | −8.5 | −7.9 | −8.4 | −6.9 | −7 | −7.7 | −7 |
| 4,4′-[2,2,2-trifluoro-1-(trifluoromethyl)ethylidene]diphenol | 1478-61-1 | −8.7 | −7.8 | −9.7 | −7.1 | −7.3 | −7.6 | −7.3 |
| 4,4′-(1,3-phenylene-bis(1-methylethylidene))bisphenol | 13595-25-0 | −11.2 | −8.3 | −9.4 | −7.1 | −9.9 | #N/A | #N/A |
| 4,4′-(1-Phenylethylidene)bisphenol | 1571-75-1 | −9.2 | −7.2 | −7.6 | −6.4 | −7.7 | −8.8 | −7.7 |
| 9,9-Bis(4-hydroxyphenyl)fluorene | 3236-71-3 | −6.7 | −6 | −8.4 | −7.5 | −8 | −7 | −8 |
| Biphenyl-4,4′-diol | 92-88-6 | −7.5 | −7.5 | −7.2 | −6.8 | −7.3 | −6.9 | −7.3 |
| 4,4′-isopropylidenedi-o-cresol | 79-97-0 | −8.9 | #N/A | −9 | −7 | −8 | −8 | −8 |
| 4,4′-(dichlorovinylidene)diphenol | 14868-03-02 | −7.9 | −8.1 | −7.7 | −5.9 | −7.3 | −7.7 | −7.3 |
| 4,4′-(1,4-Phenylenediisopropylidene)bisphenol | 2167-51-3 | −7.2 | −6.5 | −9.5 | −8.6 | −8.7 | −8.9 | −8.7 |
| 4,4′-cyclohexylidenebisphenol | 843-55-0 | −8.8 | −7.6 | −8.3 | −6.7 | −6.5 | −8.2 | −6.5 |
| 2,2-bis(2-hydroxy-5-biphenylyl)propane | 24038-68-4 | −11.5 | −6.8 | −9.6 | −10.3 | −9.8 | −11.1 | −9.8 |
| 4,4′-ihydroxytetraphenylmethane | 1844-01-05 | −5.9 | −5.6 | −8.3 | −6.5 | −7.7 | −8.7 | −7.7 |
| 4,4′-(1,3-phenylene-bis(1-methylethylidene))bis-phenol | 13595-25-0 | −11.2 | −8.3 | −9.4 | −7.1 | −9.9 | #N/A | #N/A |
| 9,9-Bis(4-hydroxyphenyl)fluorene | 3236-71-3 | −6.7 | −6 | −8.4 | −7.5 | −8 | −7 | −8 |
| 4,4′-cyclohexylidenebisphenol | 843-55-0 | −8.8 | −7.6 | −8.3 | −6.7 | −6.5 | −8.2 | −6.5 |
| Biphenyl-4,4′-diol | 92-88-6 | −7.5 | −7.5 | −7.2 | −6.8 | −7.3 | −6.9 | −7.3 |
Table 9.
Heat map of docking scores of phthalates bound to CAR, AR, PXR, PPARα, PPARγ, PPARδ, and RORγt. The green color represents lower binding affinity and as the gradient approaches red, it indicates a higher binding affinity.
Table 9.
Heat map of docking scores of phthalates bound to CAR, AR, PXR, PPARα, PPARγ, PPARδ, and RORγt. The green color represents lower binding affinity and as the gradient approaches red, it indicates a higher binding affinity.
| Compound | CASRN | CAR | AR | PXR | PPARα | PPARγ | PPARδ | RORγt |
|---|
| Dimethyl phthalate | 131-11-3 | #N/A | #N/A | −6.7 | #N/A | #N/A | #N/A | #N/A |
| Diethyl phthalate | 84-66-2 | −6.7 | −6.3 | −6.8 | −6.3 | −6.7 | −6.1 | −6.6 |
| Diallyl phthalate | 131-17-9 | −7.2 | −6.5 | −6.9 | −6.7 | −7.5 | −6.6 | −6.6 |
| Di-n-propyl phthalate | 131-16-8 | −7.2 | −6.4 | −6.8 | −6.5 | −7.3 | −6.3 | −6.4 |
| Di-n-butyl phthalate | 84-74-2 | −6.8 | −6.9 | −6.7 | −6.9 | −7.1 | −6.7 | −7.3 |
| Diisobutyl phthalate | 84-69-5 | −7.7 | −7.3 | −7.3 | −7 | −7.6 | −7 | −7.3 |
| Di-2-methoxyethyl phthalate | 117-82-8 | −6.6 | −6.2 | −6.7 | −6.5 | −6.9 | −6 | −6.3 |
| Butyl cyclohexyl phthalate | 84-64-0 | −8 | −7.9 | −7.9 | −7.5 | −8.1 | −7.8 | −8 |
| Di-n-pentyl phthalate | 131-18-0 | −7.4 | −7 | −7.2 | −6.8 | −7.5 | −7.2 | −5.4 |
| Dicyclohexyl phthalate | 84-61-7 | −9.7 | −8.7 | −8.6 | −8.6 | −9 | −9.3 | −9.4 |
| Butyl benzyl phthalate | 85-68-7 | −8.4 | −7.8 | −8.2 | −8.2 | −8.8 | −8.3 | −7.9 |
| Di-n-hexyl phthalate | 84-75-3 | −6.9 | −7.1 | −7 | −6.9 | −7.2 | −7.4 | −7.6 |
| Diisohexyl phthalate | 146-50-9 | −8.2 | −7.3 | −7.7 | −7.4 | −8.2 | −7.9 | −7.6 |
| Diisoheptyl phthalate | 41451-28-9 | −8 | −7 | −8.1 | −7.2 | −8 | −8.2 | −8 |
| Butyl decyl phthalate | 89-19-0 | −7.9 | −6.9 | −7.4 | −7.3 | −7.5 | −7.4 | −7.5 |
| Dibutoxy ethyl phthalate | 117-83-9 | −6.9 | −7 | −7 | −7.3 | −7.1 | −7.2 | −7.4 |
| Di(2-ethylhexyl) phthalate | 117-81-7 | −8 | −5.9 | −8 | −7.5 | −7.8 | −7.9 | −8.5 |
| Di(n-octyl) phthalate | 117-84-0 | −8 | −7.3 | −7.3 | −7.5 | −7.7 | −7.7 | −7.8 |
| Diisooctyl phthalate | 27554-26-3 | −8.2 | −7.6 | −8 | −7.4 | −7.8 | −8.2 | −8.3 |
| n-Octyl n-decyl phthalate | 119-07-3 | #N/A | #N/A | −7.3 | #N/A | #N/A | #N/A | #N/A |
| Diisononyl phthalate | 28553-12-0 | −7.9 | −8 | −7.7 | −7.5 | −7.6 | −8.3 | −8 |
| Di(2-propylheptyl) phthalate | 53306-54-0 | −7.9 | −6.9 | −7.9 | −7.5 | −7.8 | −7.8 | −8.3 |
| Diisodecyl phthalate | 26761-40-0 | −7.6 | −7.5 | −8 | −7.9 | −7.7 | −8.1 | −8.5 |
| Diundecyl phthalate | 3648-20-2 | −6.7 | −7.4 | −7.1 | −7.3 | −7.4 | −7.7 | −7.8 |
| Diisoundecyl phthalate | 85507-79-5 | −7.7 | −7.3 | −8.3 | −7.8 | −7.7 | −8 | −8.5 |
| Ditridecyl phthalate | 119-06-2 | #N/A | #N/A | −6.9 | #N/A | #N/A | #N/A | #N/A |
| Diisotridecyl phthalate | 68515-47-9 | −7.4 | −7.3 | −7.5 | −8 | −8 | −8.3 | −8.2 |
Table 10.
Binding affinity of nuclear receptors tested with DCHP and DEHP. The functional activity column displays the activation assay results.
Table 10.
Binding affinity of nuclear receptors tested with DCHP and DEHP. The functional activity column displays the activation assay results.
| Receptors | DEHP (CAS ID:117-81-7) Binding Affinity (kcal/mol) | DEHP Functional Activity | DCHP (CAS ID: 84-61-7) Binding Affinity (kcal/mol) | DCHP Functional Activity |
|---|
| PXR | −8.0 | Agonist | −8.6 | Agonist |
| CAR | −8.0 | Agonist | −9.7 | Agonist |
| PPARα | −7.5 | Agonist | −8.6 | Antagonist |
| PPARγ | −7.8 | Agonist | −9.0 | Agonist |
| PPARδ | −7.9 | Antagonist | −9.3 | Neutral |
| AR | −5.9 | Agonist | −8.7 | Agonist |
| RORγt | −8.5 | Neutral | −9.4 | Antagonist |
| RARγ | −8.4 | Antagonist | −9.9 | Antagonist |
| RARβ | −5.5 | Antagonist | −9.9 | Antagonist |
| RORβ | −7.8 | Antagonist | −8.8 | Antagonist |
| RXRβ | −7.6 | Antagonist | −8.7 | Agonist |
| SF-1 | −6.8 | Neutral | −9.0 | Antagonist |
| ERα | −7.1 | Agonist | −8.6 | Agonist |


