Article

Identification of Quantitative Trait Loci for Node Number, Pod Number, and Seed Number in Soybean

1
Soybean Research Institute of Heilongjiang Academy of Agriculture Sciences, Harbin 150086, China
2
College of Modern Agriculture and Ecological Environment, Heilongjiang University, Harbin 150080, China
3
College of Agronomy, Shenyang Agricultural University, Shenyang 110065, China
4
Institute of Crop Sciences, Chinese Academy of Agricultural Sciences, National Key Facility for Crop Gene Resources and Genetic Improvement (NFCRl), Ministry of Agriculture and Rural Affairs, Key Laboratory of Crop Gene Resource and Germplasm Enhancement, Ministry of Agriculture and Rural Affairs, Beijing 100081, China
5
Institute of Biotechnology, Heilongjiang Academy of Agricultural Sciences, Harbin 150086, China
6
Work Station of Science and Technique for Post-Doctoral in Sugar Beet Institute, Heilongjiang University, 74 Xuefu Road, Harbin 150000, China
7
Plant Production Department, Faculty of Agriculture Saba Basha, Alexandria University, Alexandria 21531, Egypt
*
Authors to whom correspondence should be addressed.
These authors contributed equally to this work.
Int. J. Mol. Sci. 2025, 26(5), 2300; https://doi.org/10.3390/ijms26052300
Submission received: 23 January 2025 / Revised: 22 February 2025 / Accepted: 3 March 2025 / Published: 5 March 2025
(This article belongs to the Special Issue Molecular Genetics and Plant Breeding, 5th Edition)

Abstract

:
Optimizing soybean yield remains a crucial challenge in meeting global food security demands. In this study, we report a comprehensive genetic analysis of yield-related traits in soybeans using a recombinant inbred line (RIL) population derived from crosses between ‘Qihuang 34’ (GH34) and ‘Dongsheng 16′ (DS16). Phenotypic analysis across two years (2023–2024) revealed significant variations between parental lines. Through high-density genetic mapping with 6297 SLAF markers spanning 2945.26 cM across 20 chromosomes, we constructed a genetic map with an average marker distance of 0.47 cM and 99.17% of gaps under 5 cM. QTL analysis identified ten significant loci across both years: in 2023, we detected six QTLs, including a major main stem node number (MSNN) QTL on chromosome 19 (LOD = 22.59, PVE = 24.57%), two seed number (SN) QTLs on chromosomes 14 and 18 (LOD = 2.52–2.85, PVE = 7.35% combined), and one pod number (PN) QTL on chromosome 20 (LOD = 4.68, PVE = 5.85%). The 2024 analysis revealed four major QTLs, notably a cluster on chromosome 19 harboring significant loci for MSNN (LOD = 37.92, PVE = 43.59%), PN (LOD = 18.16, PVE = 23.02%), and SN (LOD = 15.24, PVE = 19.59%). Within the stable chromosome 19 region, we identified seventeen candidate genes involved in crucial developmental processes. Gene expression analysis revealed distinct temporal patterns between parental lines during vegetative and reproductive stages, with GH34 showing dramatically higher expression of key reproductive genes Glyma.19G201300 and Glyma.19G201400 during the R1 stage. Our findings provide new insights into the genetic architecture of soybean stem node development and yield components, offering multiple promising targets for molecular breeding programs aimed at crop improvement.

1. Introduction

The soybean (Glycine max (L.) Merr.) is a vital agricultural crop worldwide, providing an essential source of protein and oil for human consumption, animal feed, and diverse industrial uses [1,2]. With the rising demand driven by population growth and dietary shifts, it is essential to improve the production and adaptability of soybeans [3]. China stands as the world’s largest consumer of soybeans, with its commercial products increasingly reliant on soybean imports [4]. Over the past fifty years, efforts to enhance soybean yields in China have seen minimal progress highlighting an urgent need for the country to boost domestic production and achieve self-sufficiency in soybean cultivation [5]. Breeders are focusing on various yield-related traits to enhance soybean production, and one key trait is the stem node, which influences the plant’s architecture, adaptability, and yield potential [6,7].
Several QTLs linked to yield components have been identified in previous studies [8,9]. Researchers have discovered numerous QTLs associated with yield traits, particularly seed weight [10]. However, there has been limited research examining the features of main stems, pods, and seed numbers. One of the significant qualities in soybean breeding is the node number, a crucial characteristic affecting plant architecture, total biomass accumulation, and, ultimately, yield potential [11]. The architecture of the soybean plant, especially its node configuration, is crucial for photosynthesis and nutrient distribution, which directly influences seed yield [6,9]. The MSNN is a vital factor influencing plant height and branching, impacting light interception and, therefore, the plant’s capacity for effective photosynthesis [7]. Furthermore, node number can affect the allocation of reproductive structures, including pods and seeds, thus directly impacting yield results [12,13]. Consequently, comprehending the genetic foundation of node number variability in soybean populations is crucial for the creation of high-yield cultivars [13,14]. MSNN is associated with several key agronomic traits, including plant height, days to flowering, and days to maturity. However, MSNN is a complex quantitative trait controlled by multiple genes and is affected by environmental factors as well as genotype–environment interactions [15,16]. These genes can exert varying effects, ranging from minor to substantial, and may participate in various molecular and biological processes, functioning together within a network that can behave differently under diverse geographic and environmental conditions [17]. The seed number is determined by three factors: plant density, number of pods per plant (NPP), and number of seeds per plant (NSP). Both NPP and NSP are influenced by branch number and main stem number, though the genetic basis of these characteristics remains poorly understood [10,18,19]. PN is a crucial criterion in soybean classification and shows stability across years and environments [20]. Recent evidence suggests that one-seeded pods are controlled by two of three recessive genes. However, molecular studies on pod and seed number traits and their relationships remain limited [21]. Research in legumes has provided valuable insights into pod and seed number regulation. In soybeans, the map-based cloning of the Ln gene revealed that Gm-JAG1 controls both leaf morphology and pod type. A specific amino acid change in Gm-JAG1′s ERF motif increased multiple-seeded pod numbers, leading to higher NSP and overall seed yield [22,23]. Another soybean gene, GmCYP78A10b, was found to increase seed size while reducing NPP, though this trade-off did not affect overall plant yield [24]. Similar genetic studies in other legumes have identified various mechanisms controlling pod and seed traits. These include a pentatricopeptide repeat (PPR) gene affecting NPP in chickpeas, simple sequence repeats (SSR) markers linked to NSP in common beans, and the relationship between non-structural polysaccharides and yield components in broad beans [25,26]. Researchers have also found co-localized QTLs for productivity, flowering, and seed development across multiple legume species. Recent metabolic studies have furthered our understanding of pod development [26]. In soybeans, eight metabolic pathways were found to contribute to the development of pods with four or more seeds [27,28,29]. In rapeseed, researchers identified both pleiotropic QTLs affecting NSP and seed yield, as well as a strong genetic linkage between NPP and NSP traits [30]. To better understand the genetic relationships among yield components in soybean, researchers have employed multivariable conditional analysis techniques. This approach has successfully revealed genetic associations among multiple phenotypes at the QTL level. For example, conditional QTL mapping in soybeans has shown that pod length has a greater influence on 100-pod weight than pod width, and that branch number significantly affects resistance to late leaf spot [21,31]. These findings suggest that similar approaches could be valuable for analyzing genetic relationships among PN and SN. Single nucleotide polymorphisms (SNPs) are important for making high-density genetic linkage maps and mapping quantitative trait loci (QTL) [28,32,33,34,35,36]. Many researchers indicated that using both linkage analysis and association analysis together is more accurate and useful than using only one of them [37,38,39]. Linkage analysis usually only looks at populations that come from two parental lines. This limits genetic diversity and, in turn, its ability to find things [40]. SLAF-seq is an innovative method that facilitates the swift development of SNP markers following the building of an SLAF-seq library [41]. SLAF-seq technology has been effectively utilized to create high-density maps of various species owing to its benefits of high throughput, precision, cost-effectiveness, and rapid cycle times [42,43,44]. This study aimed to genetically map QTLs associated with three yield-related traits using the Dongsheng 16 and Qihuang 34 F2-6 RIL population, while also identifying candidate genes involved in soybean MSNN, PN, and SN. We utilized a genetic linkage map obtained from SLAF sequencing to identify candidate intervals for the primary loci associated with MSNN. This research aimed to identify and characterize QTLs linked to main stem nodes in the soybean recombinant inbred lines (RILs) population, thereby enhancing the effectiveness of breeding programs.

2. Results

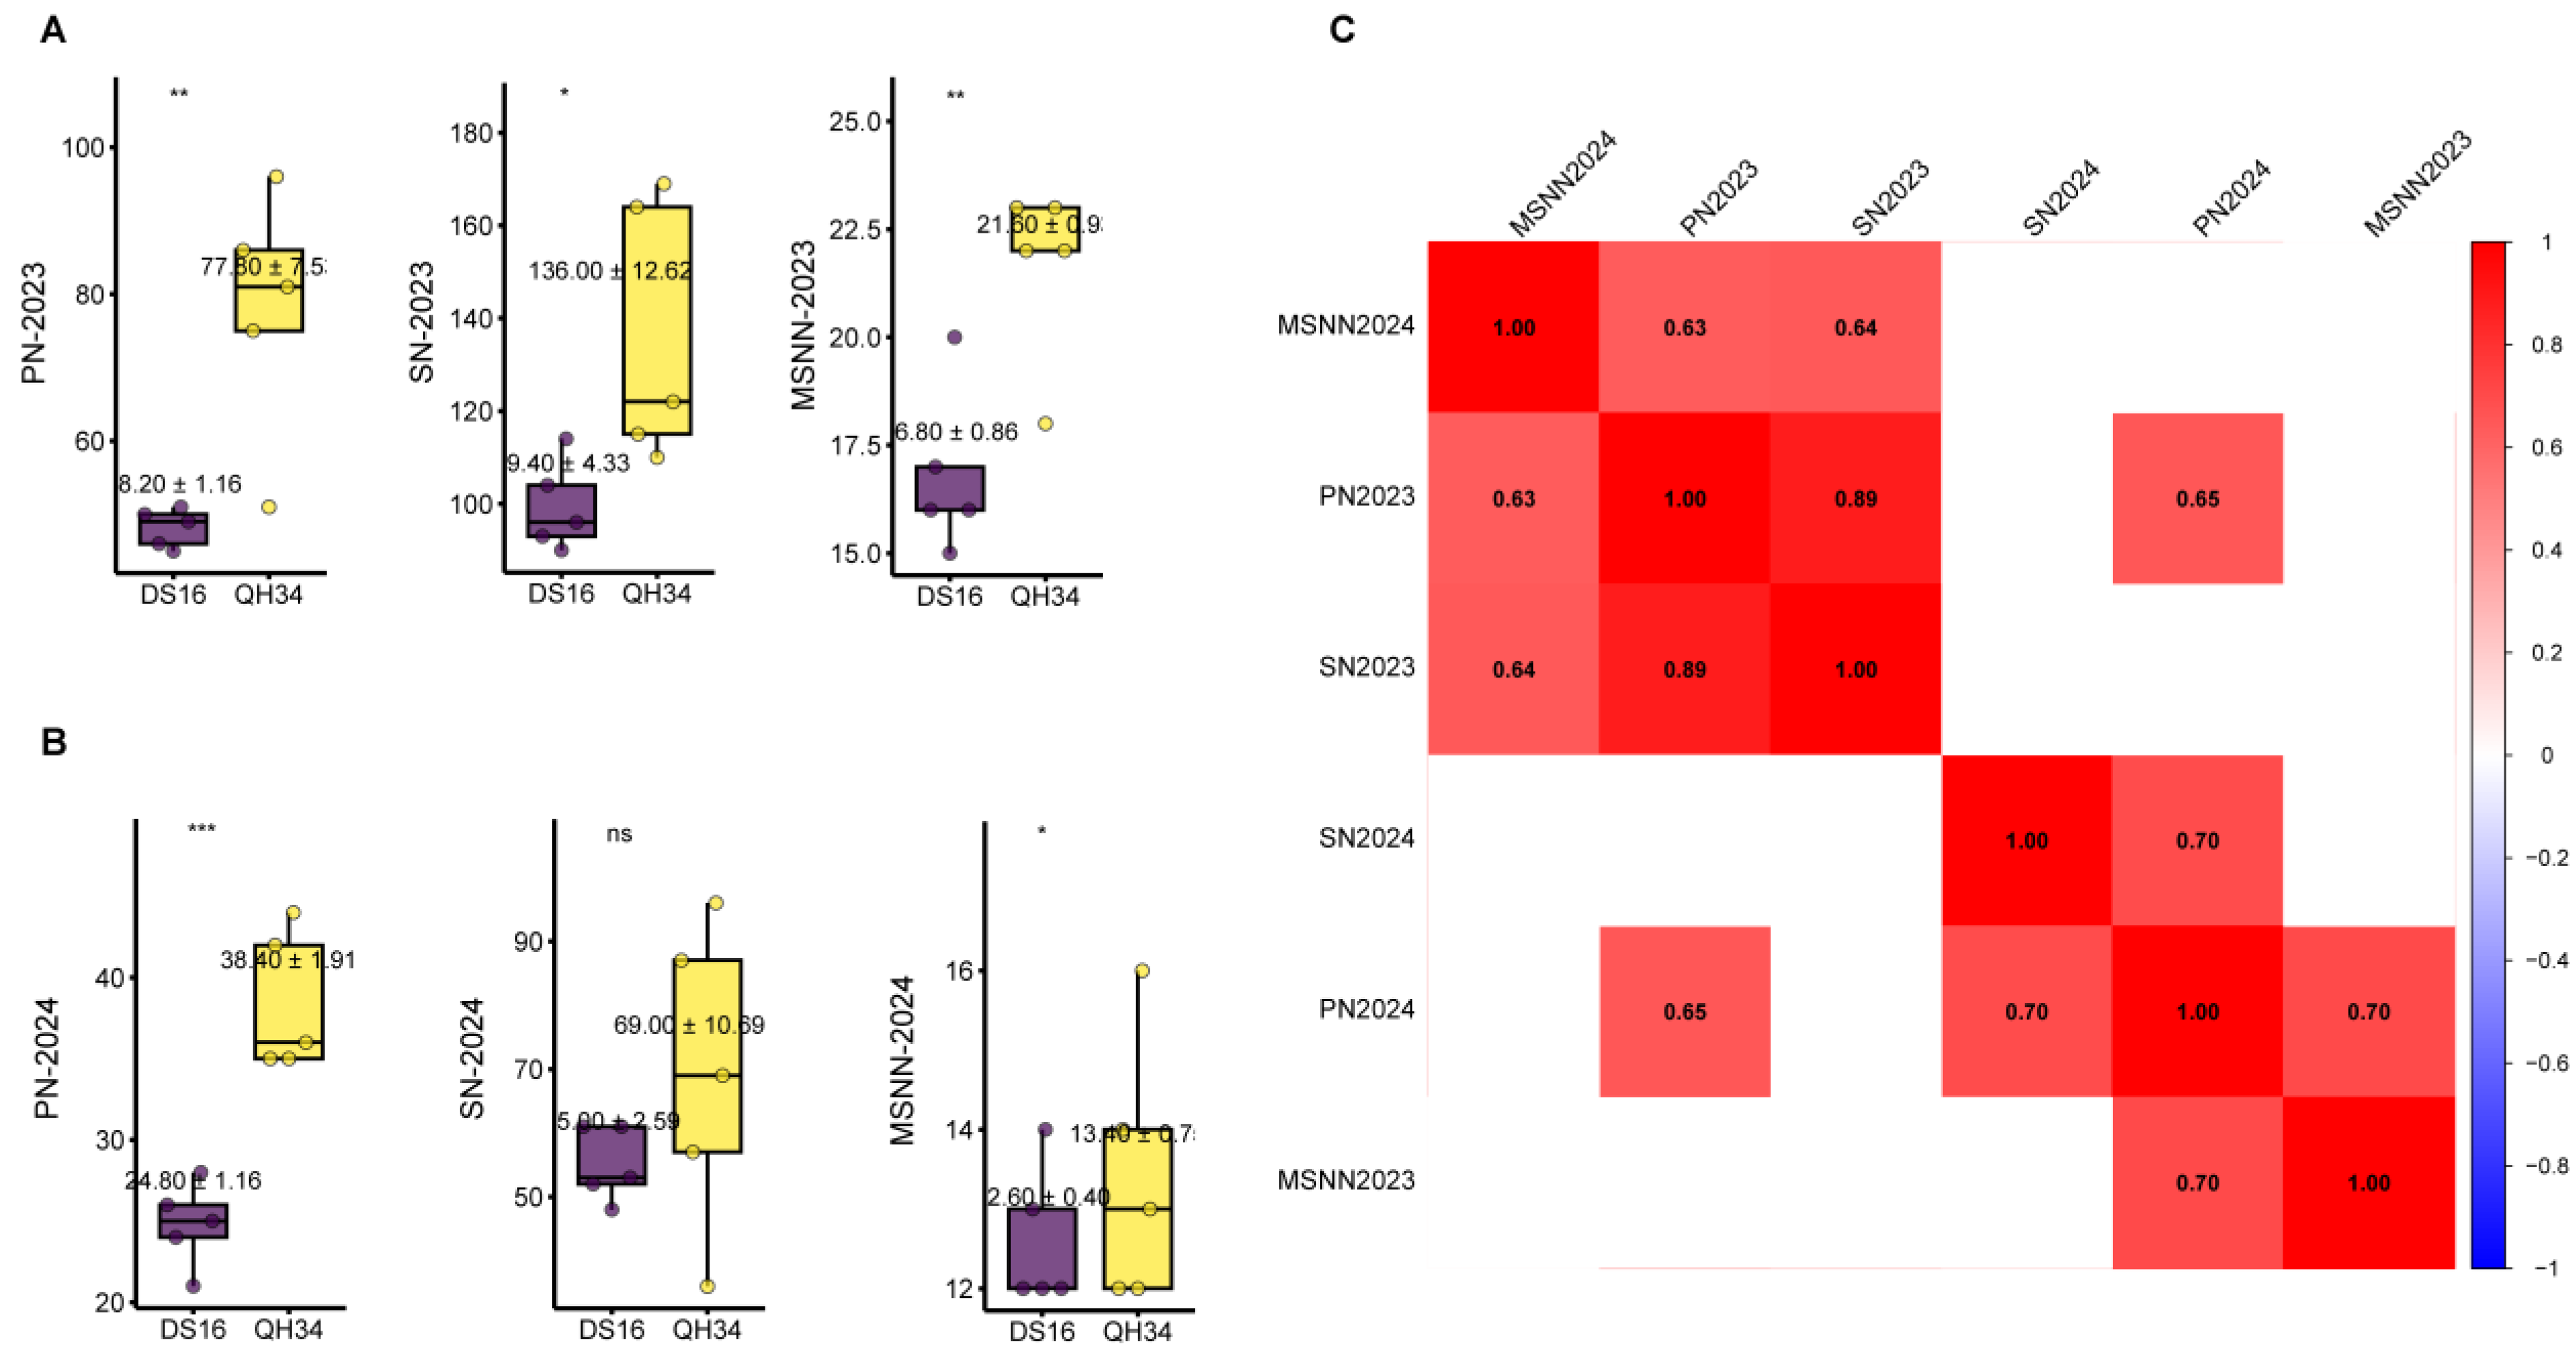
2.1. Phenotypic Characteristics of Parents and RILs

The phenotypic analysis of PN, SN, and MSNN revealed significant variations between genotypes DS16 and QH34 across two years (2023 (Harbin) and 2024 (Sanya)) (Figure 1A,B). In 2023, substantial differences were observed between the two genotypes. QH34 demonstrated consistently higher values across all traits compared to DS16. PN in QH34 (77.0 ± 2.5) was significantly higher than DS16 (45.20 ± 1.16). Similarly, SN showed marked differences with QH34 (156.00 ± 12.65) exhibiting higher values than DS16 (96.40 ± 4.33). MSNN also followed this trend, with QH34 (22.5 ± 0.9) showing higher values compared to DS16 (16.80 ± 0.86) (Figure 1A). The 2024 data showed an overall decrease in trait values compared to 2023, though genotypic differences persisted. PN maintained a highly significant difference between QH34 (38.0 ± 1.91) and DS16 (24.60 ± 1.16). SN showed no significant difference between genotypes, with values of approximately 69.02 ± 10.39 for QH34 and 56.0 ± 5.52 for DS16. MSNN showed a slight but significant difference between QH34 (13.7 ± 0.7) and DS16 (12.0 ± 0.4) (Figure 1B). The correlation analysis revealed strong positive relationships among traits across both years (Figure 1C). Notable correlations included the following: a strong correlation between PN2023 and SN2023 (r = 0.89), a positive correlation between MSNN2024 and PN2023 (r = 0.63), a high correlation between SN2024 and PN2024 (r = 0.70), and a strong relationship between MSNN2024 and SN2024 (r = 0.70).
Frequency distribution analysis revealed distinct patterns in trait distribution between genotypes DS16 and QH34 across both years (Figure 2). For PN in 2023 (Harbin), the distribution showed a relatively normal pattern with the highest frequency occurring between 40 and 55 pods, encompassing both DS16 and QH34 populations. In 2024 (Sanya), the PN distribution shifted leftward, showing lower values overall, with peak frequencies between 20 and 35 pods, demonstrating the year-over-year reduction in pod number. SN distributions in 2023 displayed a broader range, with frequencies peaking between 80 and 120 seeds, showing a slight positive skew. The 2024 data revealed a compressed distribution with the highest frequencies occurring between 40 and 60 seeds, reflecting the overall reduction in seed production. Both genotypes showed overlapping distributions, though QH34 consistently maintained higher ranges. MSNN showed distinctive distribution patterns. In 2023, the distribution was relatively symmetric, centered between 16 and 22 seeds per node, with the highest frequency around 20 MSNN. The 2024 distribution shifted notably lower, with peak frequencies between 7 and 11 MSNN, demonstrating a more condensed range. This shift aligns with the overall reduction in reproductive traits observed in 2024. The frequency distributions support the statistical findings of decreased trait values in 2024 compared to 2023, while also revealing the nature of trait variation within and between genotypes. The distributions generally showed more positive skewness in 2024, particularly for PN and SN, which aligns with the higher skewness values reported in the statistical analysis (skewness = 1.96 for PN and 2.21 for SN in 2024).
The phenotypic analysis of PN, SN, and MSNN revealed notable variations across 2023 and 2024 (Table 1). In 2023, PN ranged from 22.8 to 104.0 with a mean of 52.37 ± 13.24, while SN exhibited broader variation ranging from 35.6 to 239.4 with a mean of 111.43 ± 34.22. The MSNN varied from 8.0 to 28.8 with an average of 18.57 ± 3.61. In 2024, all traits showed generally lower values compared to the previous year. PN ranged from 9.8 to 82.0 with a mean of 27.25 ± 9.89, representing a substantial decrease from 2023. Similarly, SN showed reduced values ranging from 22.0 to 192.0 with a mean of 57.16 ± 21.35. MSNN also decreased, ranging from 5.2 to 15.8 with an average of 8.98 ± 1.94. The coefficient of variation (CV) remained relatively stable across both years, ranging from 0.22 to 0.37, suggesting consistent relative variability despite the differences in absolute values. Notably, the 2024 data exhibited higher skewness and kurtosis values, particularly for PN (skewness = 1.96, kurtosis = 6.96) and SN (skewness = 2.21, kurtosis = 8.85), indicating a more asymmetric distribution compared to 2023. Variance analysis revealed that seed number consistently showed the highest variation among all traits (1171.23 in 2023 and 455.82 in 2024), while MSNN displayed the lowest variance (13.07 in 2023 and 3.77 in 2024). This pattern suggests that SN is the most variable trait among those measured, while MSNN remains relatively stable.

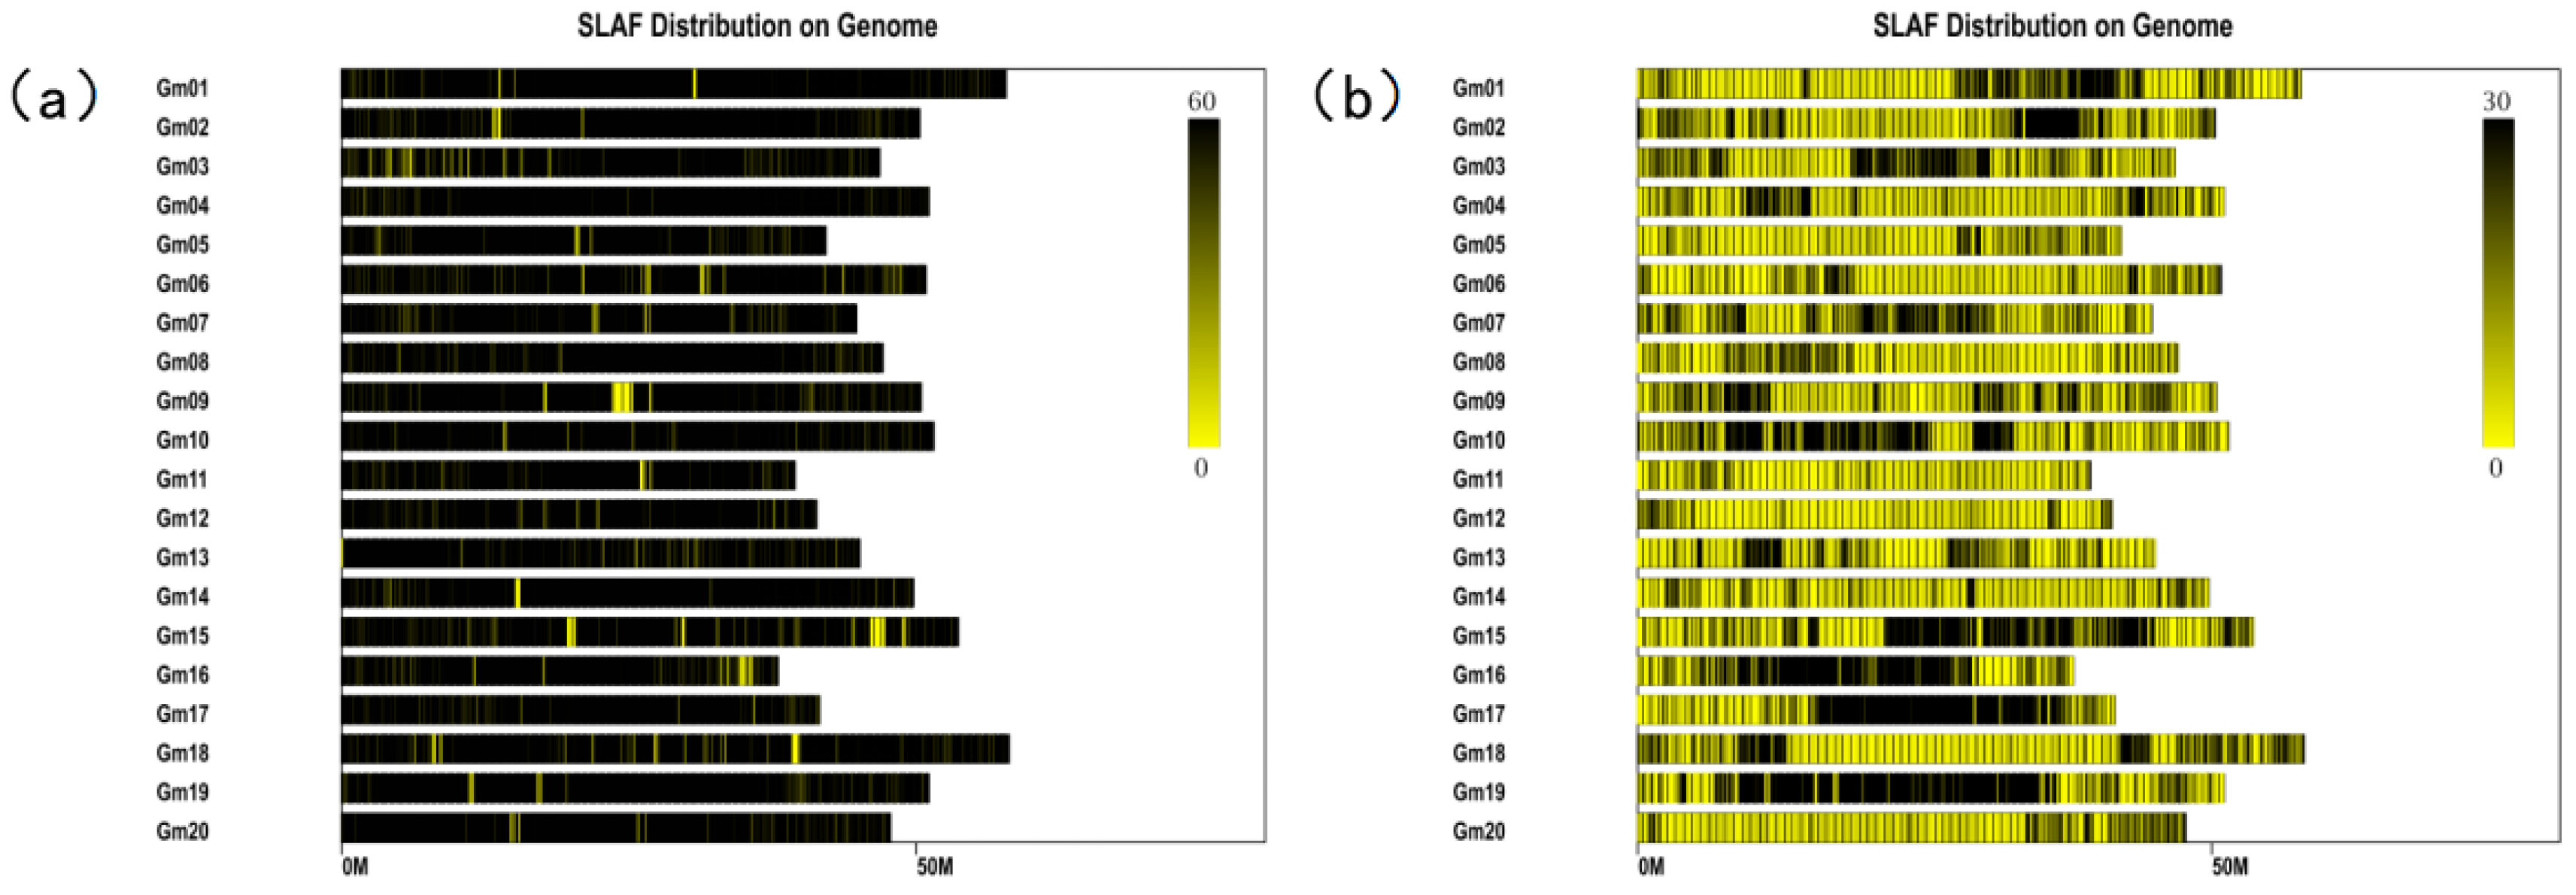
2.2. Construction of the High-Density Genetic Map

Based on the reference genome, a total of 6717 polymorphic markers were located on 20 chromosomes. After filtering out the tags with MLOD values less than 3 with the SLAF tags, a total of 6297 markers were mapped and located as markers. The mapping rate was 93.75%. Each chromosome is a linkage group. The linear arrangement of markers within the linkage group was obtained via HighMap software analysis, and the genetic distance between adjacent markers was estimated. Finally, a high-density genetic map with a total map distance of 2945.26 cM was obtained. First, to test the quality of the soybean high-density genetic map, the basic information of the number of markers, total map distance, average map distance, maximum gap, and gap < 5 cM ratio of each linkage group was statistically analyzed (Table 2). The soybean high-density genetic map contains 6297 SLAF tags, with a total map distance of 2945.26 cM and an average map distance of 0.47 cM. The number of tags on each chromosome ranges from 131 to 625, the map distance ranges from 122.39 to 192.55 cM, the average map distance ranges from 0.24 to 1.37 cM, the ratio of spacing < 5 cM ranges from 97.73% to 100%, and the maximum spacing ranges from 4 to 14.34 cM.

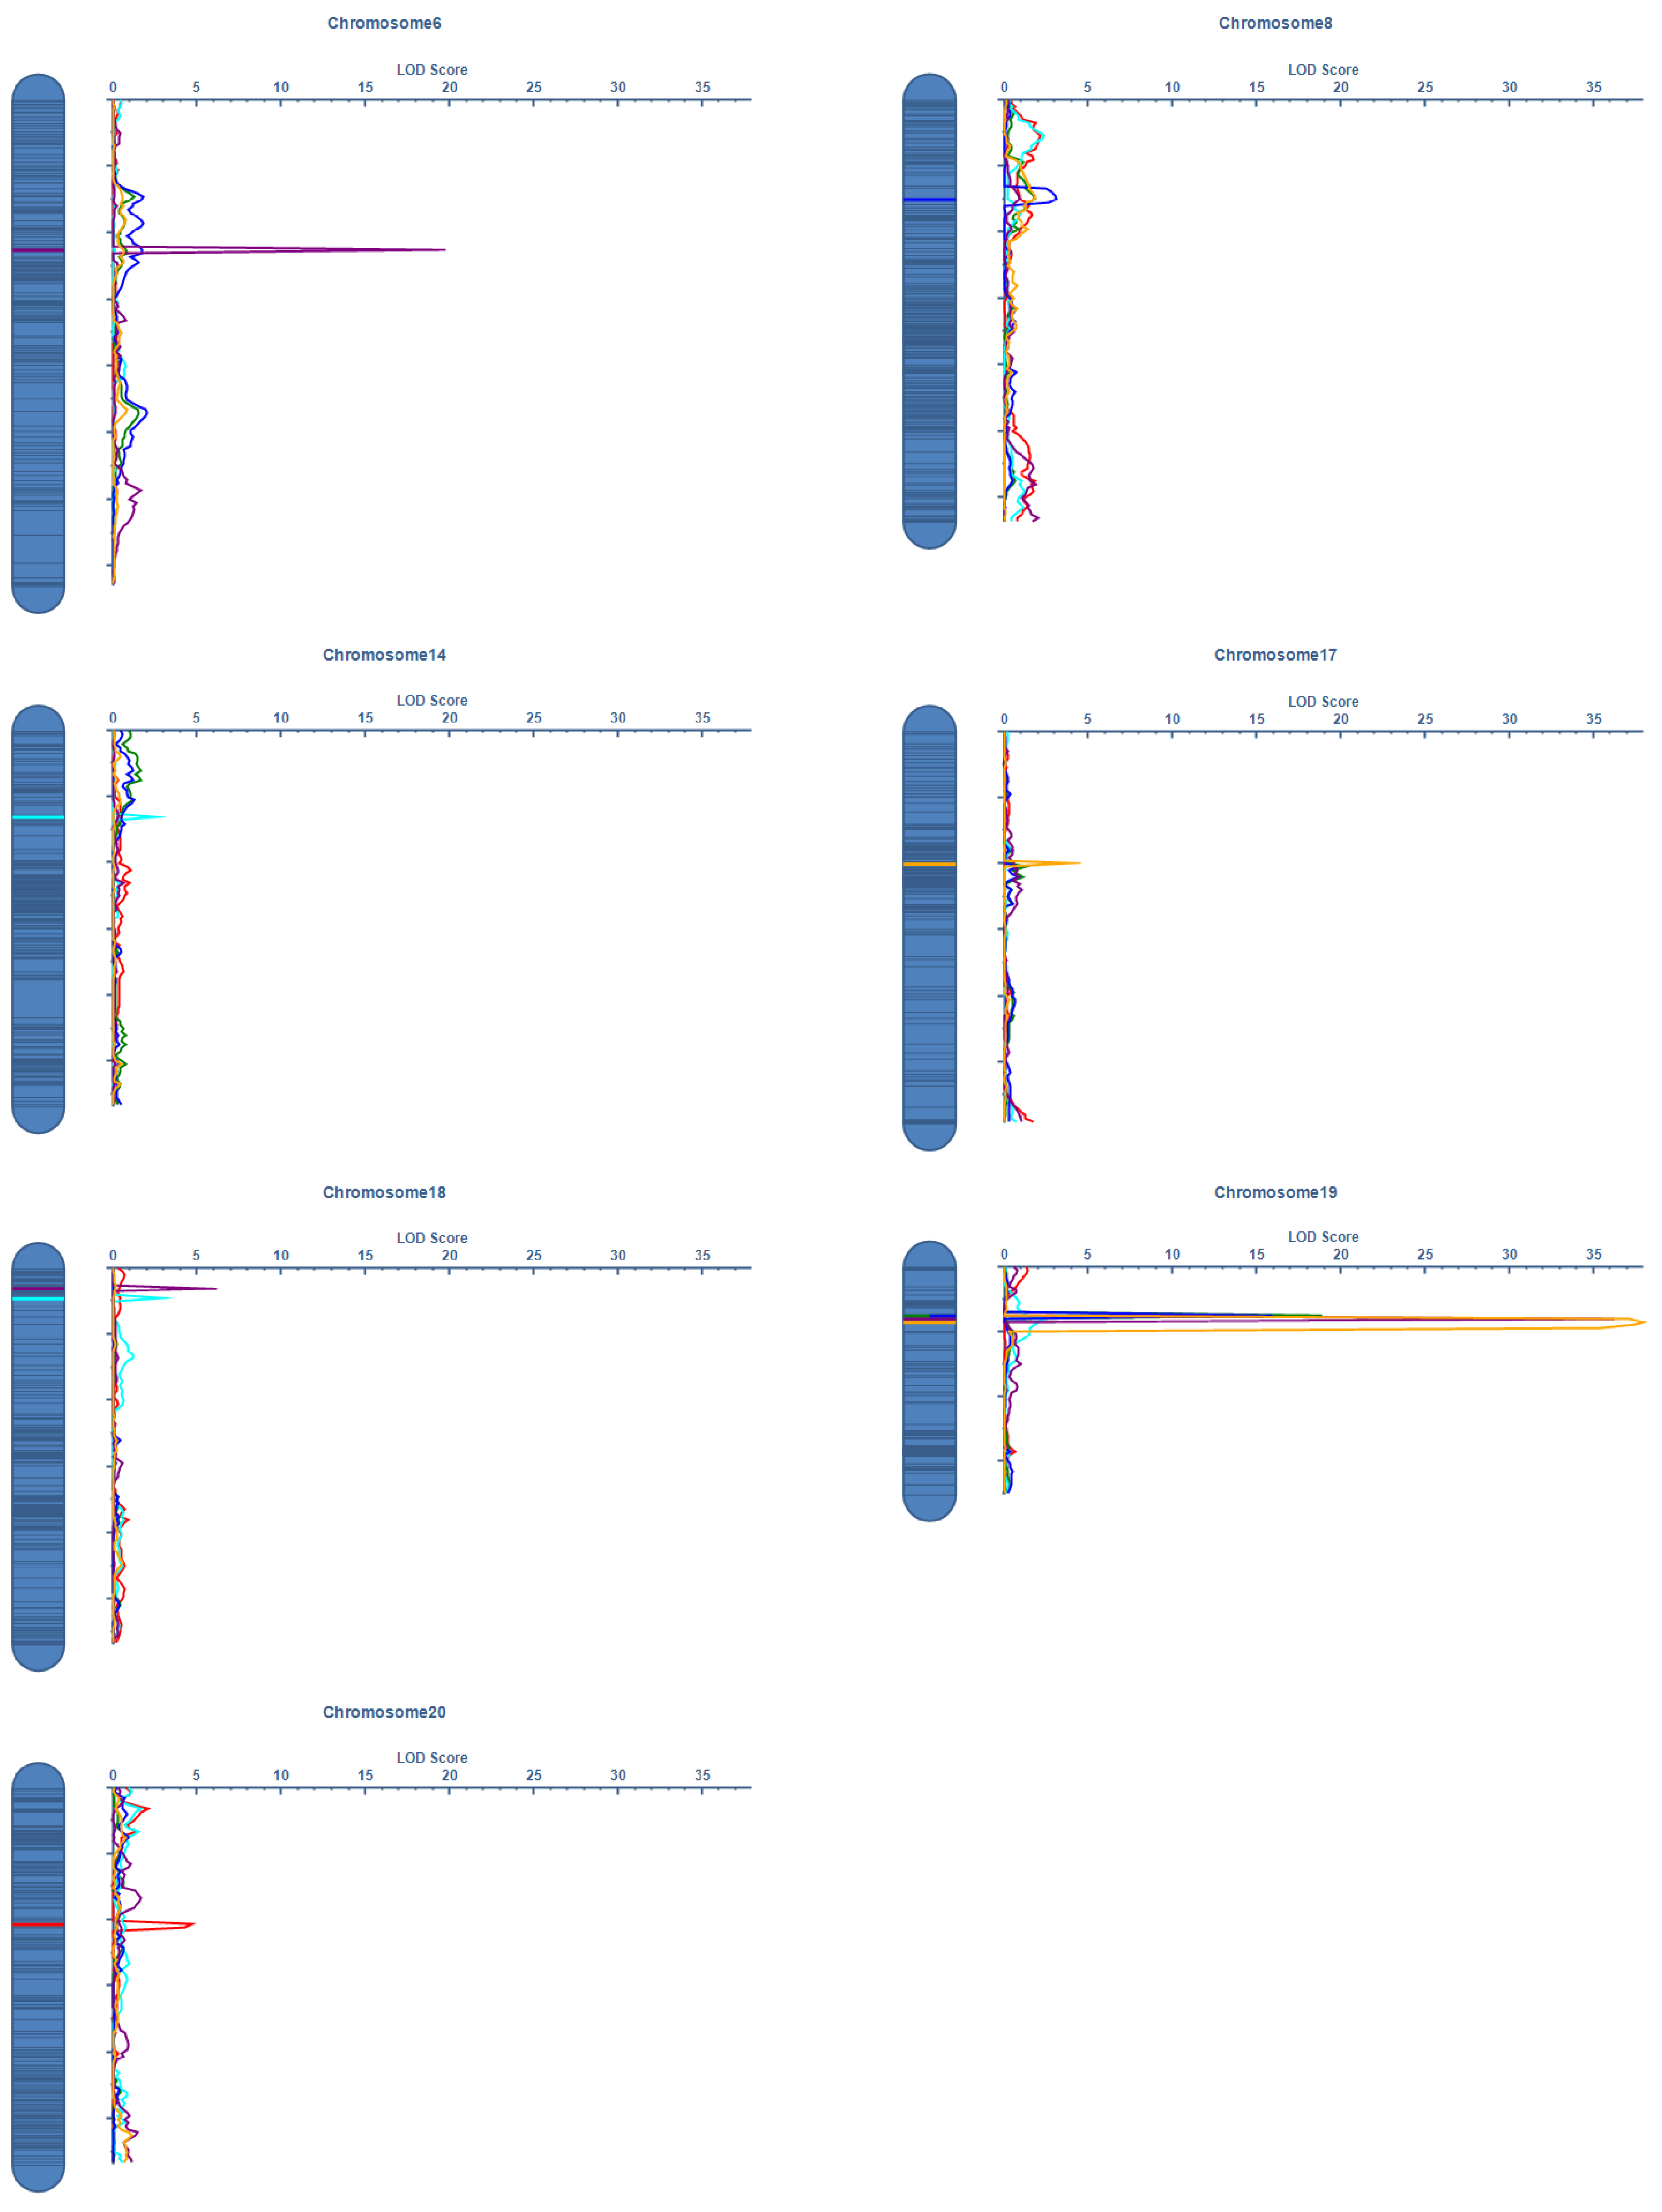
2.3. QTL Mapping and Genetic Architecture

QTL mapping identified multiple significant loci controlling these yield-related traits (Figure 3, and Table 3). In Harbin, six QTLs were detected across chromosomes 6, 14, 18, 19, and 20. The most significant QTL was identified for MSNN on chromosome 19 (LOD = 22.59), explaining 24.57% of the phenotypic variation with a positive additive effect of 2.22. Two significant QTLs for SN were detected on chromosomes 14 and 18, collectively explaining 7.35% of the phenotypic variation. A single QTL for PN was identified on chromosome 20, explaining 5.85% of the phenotypic variation. The Sanya analysis revealed four major QTLs, with chromosome 19 emerging as a crucial genomic region. A highly significant MSNN QTL on chromosome 19 (LOD = 37.92) explained 43.59% of the phenotypic variation. This same chromosomal region harbored significant QTLs for both PN (LOD = 18.16, PVE = 23.02%) and SN (LOD = 15.24, PVE = 19.59%), suggesting potential pleiotropy or tight linkage among yield-related traits. An additional MSNN QTL was identified on chromosome 17 (LOD = 3.89), explaining 3.46% of the phenotypic variation. Physical lengths of QTL intervals varied considerably, ranging from 64.58 kb to 5.54 Mb, indicating different levels of mapping resolution. Notably, the major QTL cluster on chromosome 19 was consistently detected across both years, particularly for MSNN, suggesting stable genetic control of these yield-related traits despite environmental variation between years. Additive effect analysis revealed that QH34 alleles generally contributed positively to trait values at major QTLs, particularly those on chromosome 19, consistent with the superior performance of QH34 in phenotypic evaluations. This comprehensive genetic architecture analysis provides valuable insights into the molecular basis of yield-related trait variation in this population.

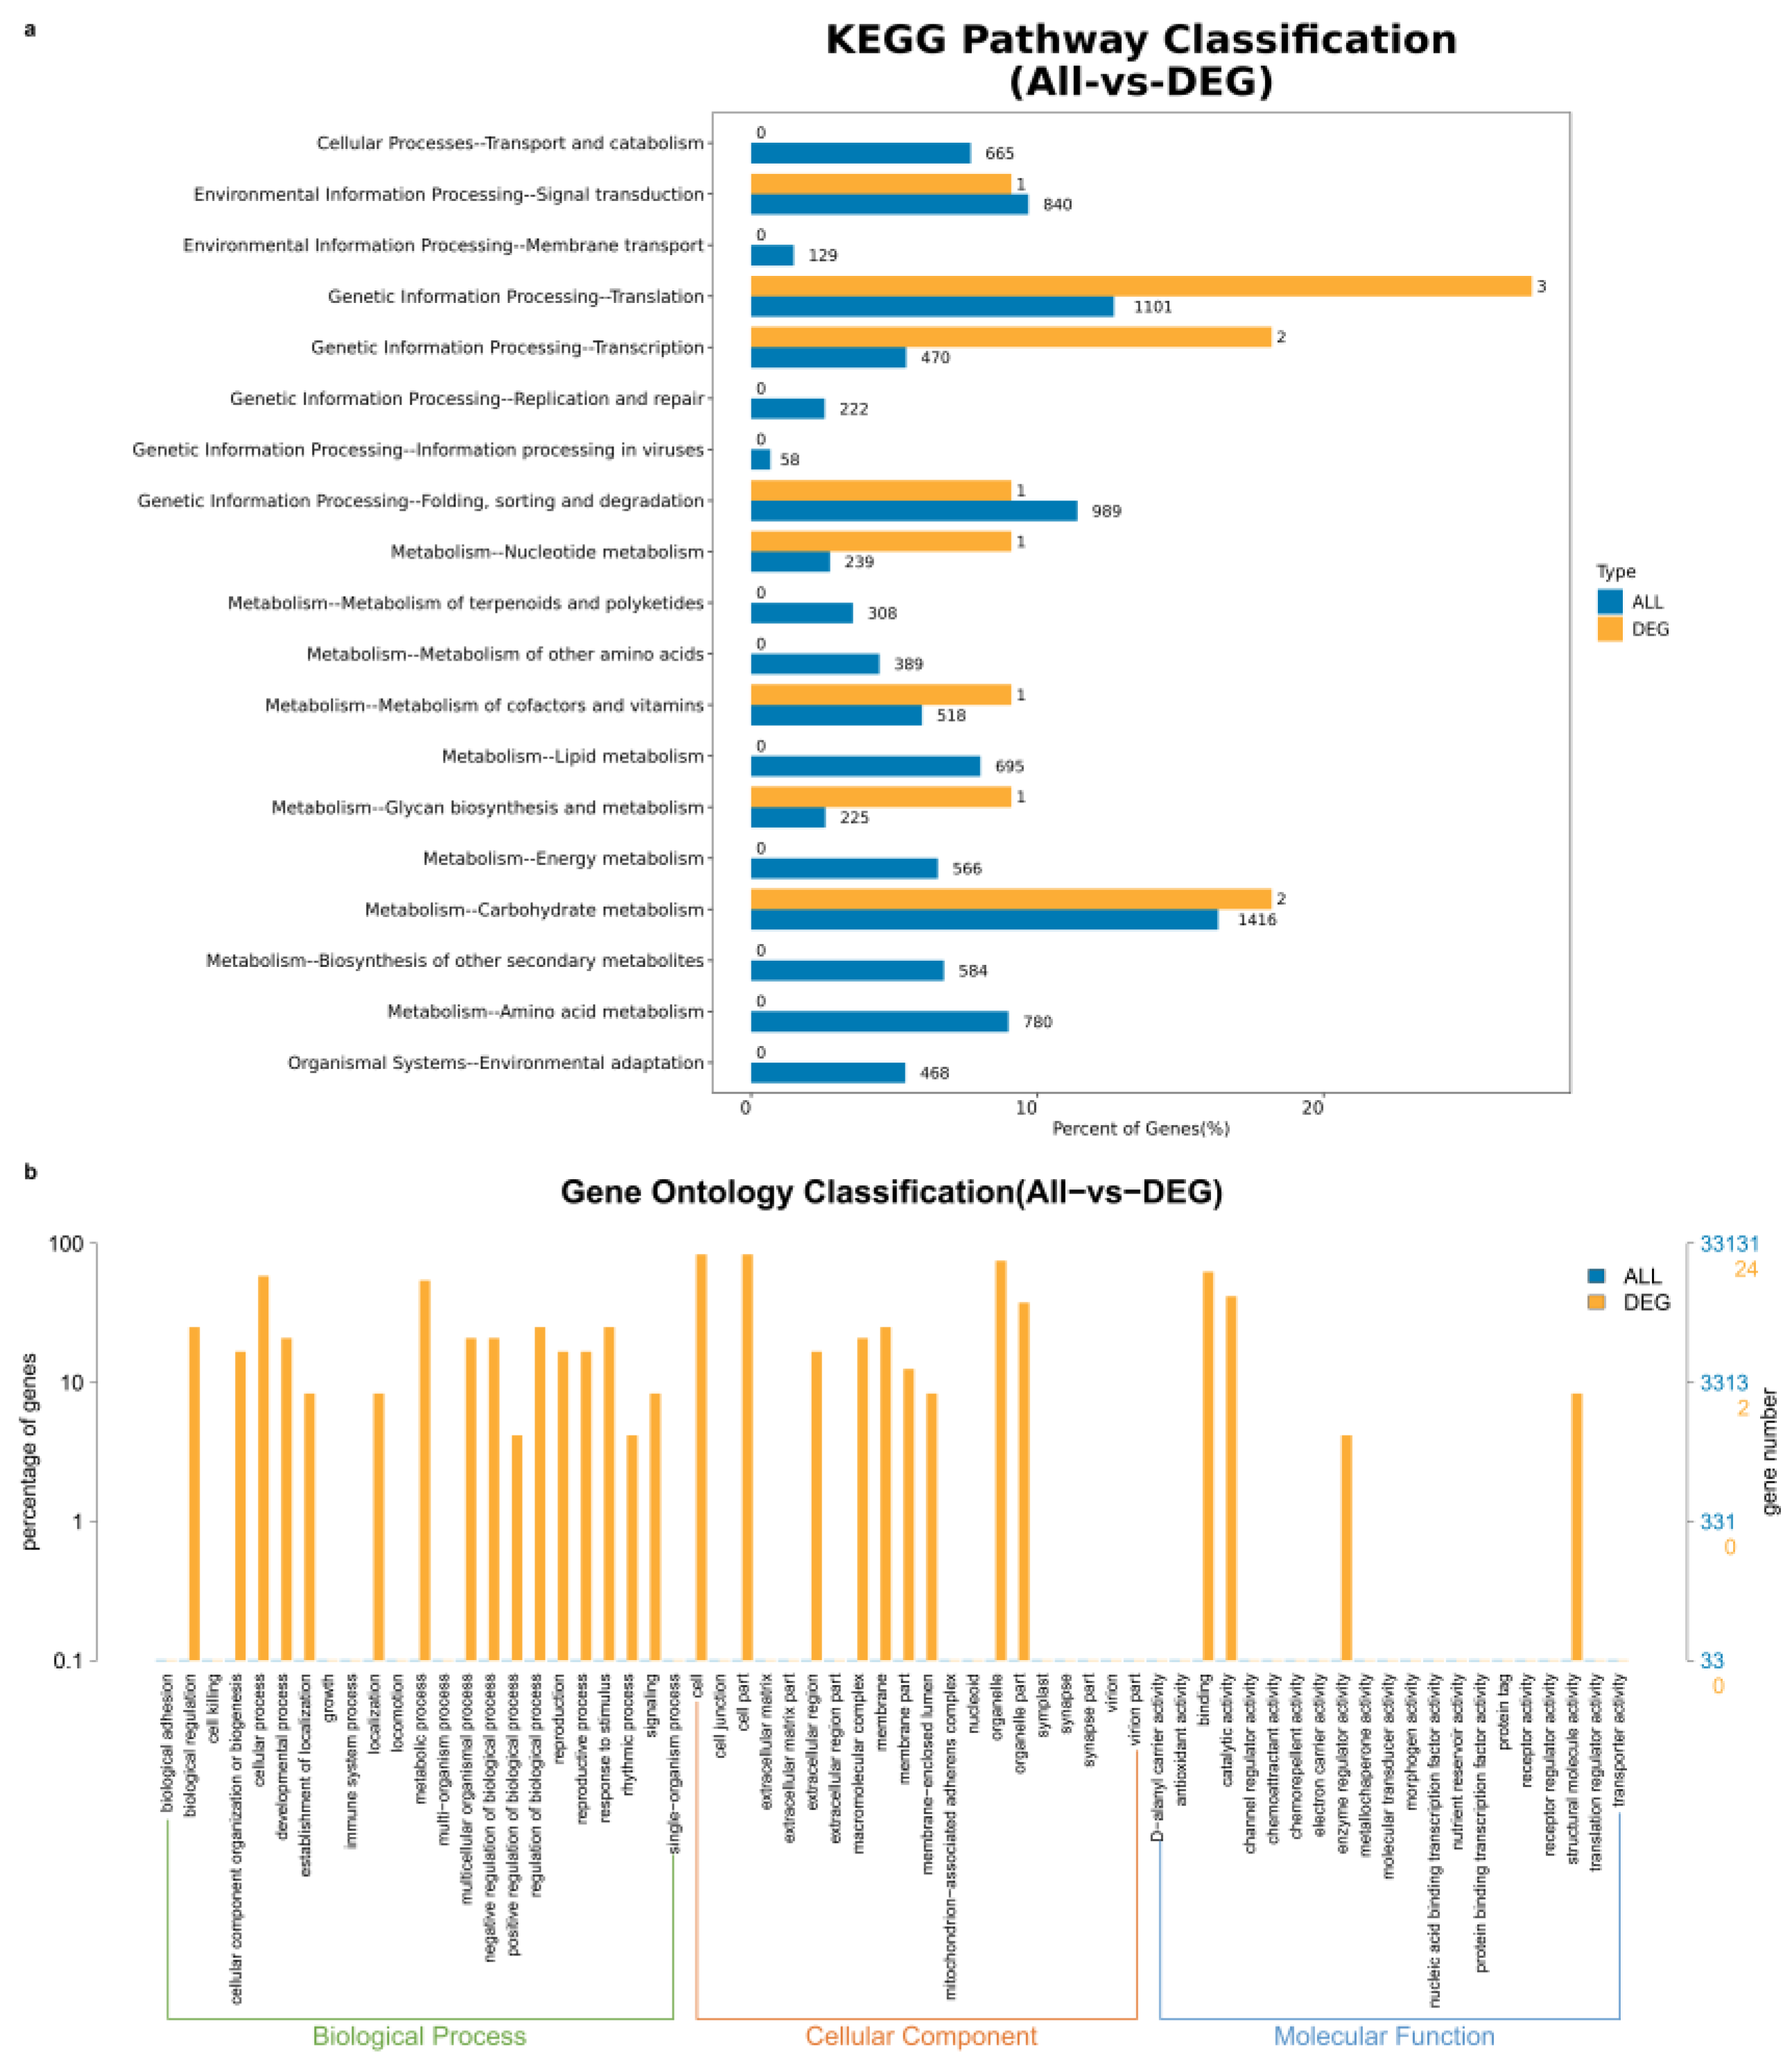
2.4. Gene GO Enrichment Analysis

Through GO enrichment analysis, we found that most of the genes within chr.19 QTL cluster intervals were involved in cellular processes and metabolic processes (Figure 4). Most of the genes were involved in intracellular metabolic processes, bioregulation, and reaction to stimuli, and were mostly involved in binding and catalytic activities in terms of molecular functions. The QTL in chr.19 contained only 17 annotated genes, most of which were involved in growth and cellular processes. and intracellular metabolic processes. GO enrichment and KEGG pathway analyses highlighted key biological processes, cellular components, molecular functions, and pathways associated with differentially expressed genes (DEGs). In the GO enrichment analysis, the figure emphasizes the significance of RNA processing pathways, particularly “mRNA splicing, via spliceosome”, which shows a high -log10 p-value (>2), along with other related processes such as “deadenylation-dependent decapping” and “termination of RNA polymerase II transcription”. The enrichment of splicing-related complexes such as U1, U2AF, U4, and U5 snRNPs, as well as the SMN–Sm protein complex, further supports the importance of RNA splicing in the study. Molecular functions such as RNA-binding and nucleosidase activity are also highlighted, reflecting their roles in RNA metabolism. The KEGG pathway analysis reinforces these findings, with the spliceosome pathway showing the highest enrichment score (~8, p-value < 0.1). Additionally, pathways related to aminoacyl-tRNA biosynthesis, RNA degradation, and mRNA surveillance were significantly enriched, further underscoring the centrality of RNA-related processes. Metabolic pathways, including starch and sucrose metabolism (enrichment score ~8), O-glycan biosynthesis, nicotinate and nicotinamide metabolism, galactose metabolism, and pyrimidine metabolism, were also prominently featured, suggesting extensive metabolic reprogramming. Signaling pathways such as MAPK signaling and plant hormone signal transduction, though modestly enriched, were statistically significant, indicating their potential roles in cellular responses.

2.5. Candidate Genes Mining

Seventeen candidate genes of interest were pinpointed within the chr.19 QTL region, each with distinct functional roles (Table S1). Glyma.19G191600 encodes a Serine/threonine-protein kinase CTR1, which is involved in ethylene signaling and stress responses, potentially regulating plant growth and development under stress conditions. Glyma.19G193100 encodes Serine/threonine-protein kinase KIPK1, associated with abiotic stress signaling pathways. Glyma.19G194800 encodes Cell division protein ftsz homolog 2–1, playing a role in cell division and chloroplast organization. Glyma.19G195300 encodes Kinesin-like protein KIN-5C, involved in intracellular transport and cell division, suggesting a role in cellular dynamics. Glyma.19G196000 encodes Probable UDP-N-acetylglucosamine--peptide N-acetylglucosaminyltransferase SPINDLY, which regulates growth through protein glycosylation. Glyma.19G196300 encodes an mRNA-decapping enzyme-like protein, involved in mRNA turnover and post-transcriptional regulation. Glyma.19G199100 encodes a protein involved in damaged DNA binding and DNA-directed DNA polymerases, likely playing a role in DNA repair and replication. Glyma.19G199400 encodes a BTB/POZ domain-containing protein, potentially involved in protein–protein interactions and transcriptional regulation. Glyma.19G199900 encodes an Aluminium-activated malate transporter family protein, which may contribute to aluminum tolerance and organic acid transport. Glyma.19G200300 encodes a Dof-type zinc finger DNA-binding family protein, a transcription factor that may regulate gene expression in response to environmental or developmental cues. Glyma.19G200400 encodes a Tetratricopeptide repeat (TPR)-like superfamily protein, likely involved in protein-protein interactions and cellular signaling. Glyma.19G200800 encodes nuclear factor Y, subunit A10, a component of a transcription factor complex that regulates gene expression. Glyma.19G200900 encodes a Glutaredoxin family protein, involved in redox regulation and stress responses. Glyma.19G201100 encodes Ubiquitin-specific protease 8, which regulates protein stability and function through deubiquitination. Glyma.19G201200 encodes Dihydroneopterin aldolase, involved in the biosynthesis of tetrahydrobiopterin, a cofactor for enzymatic reactions. Glyma.19G201300 has no annotation provided, requiring further analysis to determine its function. Finally, Glyma.19G201400 encodes Calmodulin-domain protein kinase CDPK isoform 2, involved in calcium signaling and stress responses. These genes collectively highlight diverse roles in stress responses, growth regulation, DNA repair, metabolism, and gene expression, providing a strong foundation for further functional studies.

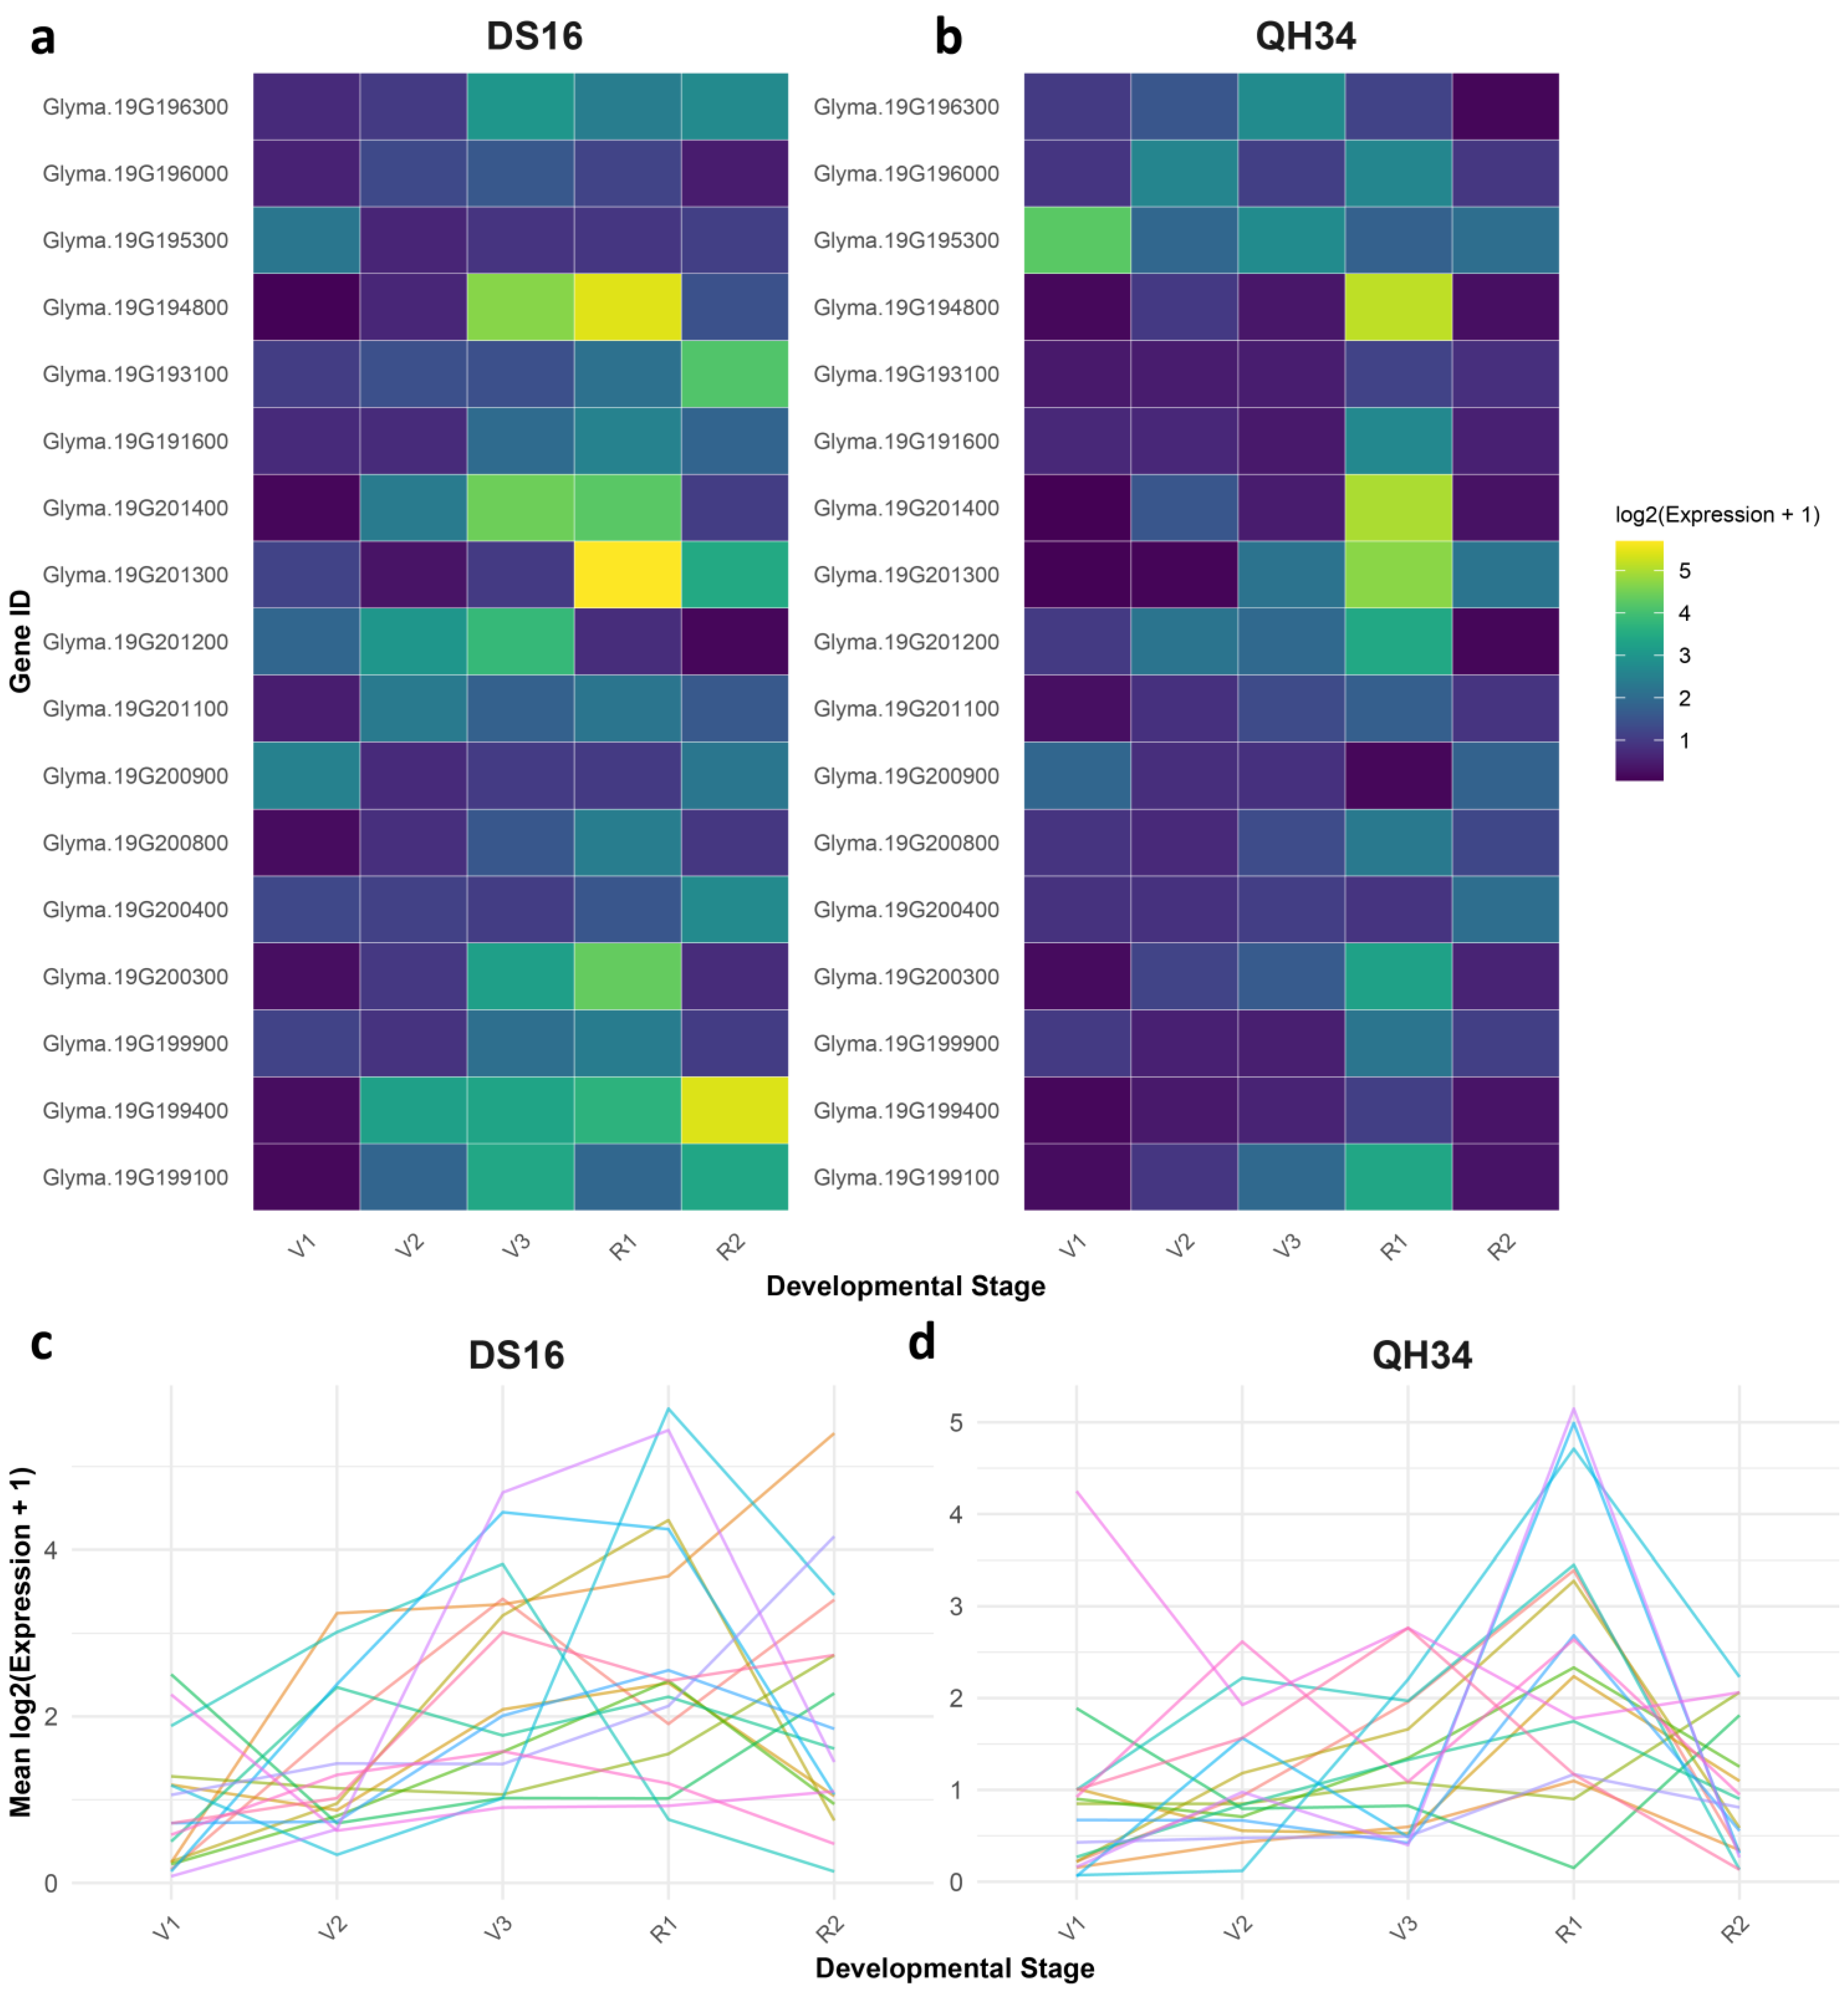
2.6. Differential Gene Expression Patterns Between QH34 and DS16 Lines

Figure 5 shows the gene expression patterns, which reveal distinct developmental responses in QH34 and DS16. Analysis of gene expression patterns across developmental stages (V1-V3, R1-R2) revealed distinct transcriptional responses between QH34 and DS16 genotypes (Figure 5a,b). We observed several notable expression patterns among the seventeen examined genes from chromosome 19. In QH34, Glyma.19G201300 and Glyma.19G201400 exhibited dramatic upregulation during the reproductive stage R1, with expression levels increasing approximately 500-fold and 750-fold, respectively, compared to vegetative stages. This sharp increase suggests these genes play crucial roles in the transition to reproductive development. Notably, Glyma.19G194800 showed similar temporal dynamics, with peak expression (34.44-fold) coinciding with the R1 stage (Figure 5b). DS16 displayed markedly different expression patterns (Figure 5a). The most striking observation was the substantial upregulation of Glyma.19G199400 during the R2 stage (41.16-fold increase), while this gene maintained relatively low expression levels in QH34 across all stages (Figure 5d). Similarly, Glyma.19G201300 reached its expression peak (50.75-fold) during R1 in DS16, showing a distinct temporal pattern compared to QH34. Several genes demonstrated stage-specific expression patterns common to both genotypes. For instance, Glyma.19G200900 showed elevated expression during early vegetative stages (V1-V2) in both genotypes, with higher levels in DS16 (4.68-fold) compared to QH34 (2.70-fold). Conversely, Glyma.19G200400 maintained relatively stable expression across all developmental stages in both genotypes, suggesting a housekeeping role. Comparative analysis between genotypes revealed that DS16 generally exhibited higher expression amplitudes for most genes during reproductive stages (Figure 5c). This was particularly evident for Glyma.19G193100, which showed a 16.85-fold increase during R2 in DS16 compared to only 0.75-fold in QH34. These genotype-specific differences suggest distinct regulatory mechanisms governing developmental transitions. A subset of genes (Glyma.19G200800, Glyma.19G201100, and Glyma.19G196000) showed moderate expression levels throughout development in both genotypes, with slight increases during reproductive stages. This pattern indicates their potential involvement in both vegetative and reproductive development, albeit with less stage-specific regulation. Interestingly, we observed coordinated expression patterns among several gene clusters. For example, Glyma.19G199100, Glyma.19G200300, and Glyma.19G201200 showed synchronized expression peaks during V3-R1 stages in both genotypes, suggesting possible co-regulation or involvement in related developmental processes. These findings highlight the complex transcriptional networks governing developmental transitions in both genotypes and reveal potential key regulators of reproductive development. The distinct expression patterns between QH34 and DS16 provide valuable insights into genotype-specific developmental regulation and may explain observed phenotypic differences between these lines.

3. Discussion

Complex quantitative traits in soybeans are generally interrelated [45], and influenced by genetic and environmental variables [18]. The efficacy and precision of QTL mapping for quantitative traits may be considerably influenced by its application in a particular context. This study performed QTL mapping of three yield traits, including PN, MSNN, and SN, in two locations in China to alleviate environmental influences. Furthermore, varying QTL mapping results are often observed across different approaches because of the distinct assumptions and models employed, each containing unique advantages and disadvantages. This research utilized QTL mapping by SLAF-seq to construct a detailed genetic framework. QTL mapping is an effective method for examining quantitative traits in plants [46,47]. The quality of genetic maps is essential for the precision of QTL mapping. Studies indicate that augmenting the number of genetic markers can improve the resolution of genetic maps [48,49]. Nonetheless, soybeans demonstrate elevated levels of linkage disequilibrium (LD) relative to other plants [50]. In our study, we utilized SLAF-seq for extensive marker identification and genotyping to construct a high-density genomic map. SLAF-seq has numerous benefits, such as efficient marker development, cost efficiency, and capacity for managing extensive populations. The soybean high-density genetic map contains 6297 SLAF tags, with a total map distance of 2945.26 cM and an average map distance of 0.47 cM. The number of tags on each chromosome ranges from 131 to 625, the map distance ranges from 122.39 to 192.55 cM, the average map distance ranges from 0.24 to 1.37 cM, the ratio of spacing <5 cM ranges from 97.73% to 100%, and the maximum spacing ranges from 4 to 14.34 cM. This soybean genetic map exhibited significantly enhanced marker density and diminished inter-marker distances compared to earlier maps. Consequently, SLAF fragment length selection is not plagued by random interruptions and thus achieves better repeatability over RAD-seq and GBS. Moreover, large amounts of sequence information can be generated and whole-genome density distributions can be handled using SLAF-seq [51] to generate markers with higher density, better consistency, greater effectiveness, and at lower cost than using traditional methods.
The phenotypic analysis demonstrated significant genotypic variation between DS16 and GH34, with GH34 consistently showing superior performance across traits. In Harbin, GH34 exhibited substantially higher values for all traits (PN: 77.0 vs. 45.2; SN: 156.0 vs. 96.4; MSNN: 22.5 vs. 16.8), indicating its genetic potential for yield improvement. The pronounced environmental variation, particularly the reduced trait values in Sanya, highlights the strong environmental influence on these yield components. This environmental sensitivity is evidenced by the substantial decreases in trait means from Harbin to Sanya. Similar environmental effects on soybean yield components have been reported by Zhang et al. [19], who found significant year-to-year variations in pod and seed numbers across different genetic backgrounds. The most significant finding of our study is the identification of a major QTL cluster on chromosome 19 that consistently influenced all three traits across both environments. This genomic region demonstrated remarkable stability and effect size, explaining up to 43.59% of MSNN variation in Sanya. The co-localization of QTLs for PN (PVE = 23.02%) and SN (PVE = 19.59%) in this same region suggests possible pleiotropy or tight linkage. This finding aligns with previous studies by Li et al. [21], who identified similar QTL clusters affecting multiple yield components in soybeans. The physical length of QTL intervals varied considerably, with the chromosome 19 cluster showing particularly high mapping resolution, comparable to recent high-density mapping studies by Wang et al. [24].
Plant pod and seed production involves complex genetic regulation across multiple biological processes [52]. The final numbers of pods and seeds depend on several key factors: the number of reproductive organs (both male and female), the viability of gametophytes, and how the zygote develops after fertilization [53]. In this research, the genes found within the major QTL regions on chromosome 19 appear to be associated with reproductive development. Similar genes in other crop species are known to regulate various developmental processes, including protein ubiquitination, cell division, growth, and proliferation, petal differentiation, auxin response, gibberellin signaling, and plant self-incompatibility [54,55]. Notably, there was significant overlap in the known genes controlling PN, SN, and MSNN within these QTL regions. However, determining the specific genes responsible for these traits based solely on functional annotations remains challenging. Gene ontology analysis of the chromosome 19 QTL cluster revealed enrichment in cellular processes and metabolic pathways, particularly RNA-processing and -splicing mechanisms. The identification of 17 candidate genes within this region provides specific molecular targets for functional validation. Key candidates include serine/threonine protein kinases and cell division proteins, similar to those identified in yield-related studies by Chen et al. [20]. The differential expression patterns between GH34 and DS16 across developmental stages reveal distinct regulatory mechanisms, with some genes showing dramatic upregulation during reproductive stages. These expression patterns align with findings from Liu et al. [47], who reported stage-specific regulation of yield-related genes in soybeans. The stable QTL cluster on chromosome 19, combined with the identified candidate genes and their expression patterns, provides multiple avenues for yield improvement. The strong environmental effects observed suggest that breeding strategies should focus on developing varieties with both high yield potential and stability across environments, as suggested by recent studies [2,4,30]. The co-localization of QTLs for multiple traits offers opportunities for simultaneous improvement of yield components through marker-assisted breeding. The integration of advanced sequencing technologies, robust statistical methods, and functional validation strategies in this study sets a new benchmark for QTL mapping and candidate gene identification in soybeans. Our findings not only provide novel insights into the genetic architecture of PN, SN, and MSNN but also offer valuable targets for marker-assisted breeding to improve soybean yield and plant architecture.

4. Materials and Methods

4.1. Soybean Populations Assessments

The soybean RILs were developed from two parents, ‘Qihuang 34′, and ‘Dongsheng 16′. A population of 325 individual F2:6 plants was created through single-seed descent. In 2023, the parents and the RIL populations were planted at the Harbin Experimental Farm, and in 2024 planted at the Yazhou District Experimental Farm in Sanya. Each treatment for the two parents and the RILs was replicated three times in a randomized block design, with plots measuring 3.0 m in row length, 35 cm spacing between rows, 10 cm spacing between plants, and three rows per plot. On 30 April each year, seeds were hand sown, placing two seeds in each hole. If both seeds germinated, one plant was removed after it produced its second set of trifoliate leaves. The entire field was irrigated with 120 m3 of water before sowing. Following seed emergence, field management practices adhered to local agricultural guidelines.

4.2. Phenotypic Statistics and Analysis

Ten mature plants from each plot were selected randomly in the middle of each row to measure MSNN, PN, and SN before the harvest in the field for each replication. The average of the three replications was used for phenotypic data analysis. Descriptive statistics, linear regression analysis, and calculation of the skewness and the kurtosis were performed on phenotypic data from two environments using GraphPad Prism software (GraphPad Software Inc. v.7.0.4, La Jolla, CA, USA), and the corresponding tables or figures were generated.

4.3. DNA Extraction, Construction and Genotyping of SLAF Libraries

Fresh leaves from the two parents and all 325 RILs were collected into centrifuge tubes, frozen in liquid nitrogen, ground in a tissue grinder, and then stored at −80 °C. Total genomic DNA was extracted from each leaf sample using a modified CTAB method [56]. The quality and concentration of the extracted DNA were determined by 1% agarose gel electrophoresis and a spectrophotometer (UV-Vis Spectrophotometer Q5000/Waltham, MA, USA). Individual SLAF libraries of 325 RILs and their parents were constructed and sequenced. A combination of Rsa I and Hae III restriction endonucleases was selected to digest genomic DNA. The SLAF markers of 325 RILs were grouped and genotyped using the method of Sun et al. [41]. The high-density molecular tags developed for the RIL population were used to construct a genetic map using HighMap software (http://highmap.biomarker.com.cn (accessed on 2 March 2025)) [57].

4.4. SLAF-Sequence and Genotype Parental Lines and RILs

The sequencing depth of Dongsheng 16 was 13.17××, the sequencing depth of Qihuang 34 was 12.77×, the average sequencing depth of parents was 12.97×, and the average sequencing depth of offspring was 10.05×. A total of 627,099 SLAF tags were obtained. Among them, there were 98,571 polymorphic SLAF tags, and the polymorphism ratio reached 15.72%. The SLAF tags were located on the reference genome using BWA software (https://nchc.dl.sourceforge.net/project/bio-bwa/bwa-0.7.15.tar.bz2 (accessed on 2 March 2025)) [58,59], and the chromosome distribution map of SLAF tags (Figure 6a) and polymorphic SLAF tags (Figure 1B) were drawn according to the distribution of SLAF tags on chromosomes.

4.5. Polymorphic SLAF Tag Encoding and Screening of Mapping SLAF Tags

To facilitate subsequent genetic analysis, all polymorphic SLAF tags need to be genotyped. The genotype encoding rule is the common two-allele encoding rule in genetics. This study is a RIL segregation population, so aa x bb type polymorphic tags were selected, and the paternal genotype was aa, the maternal genotype was bb, and the offspring genotype was aa (paternal type), bb (maternal type), ab (heterozygous type), and -(missing type). Based on the results of parental genotype detection, sites with missing parental information were filtered out. According to the genotype encoding rules in the above table, the 98,571 polymorphic SLAF tags obtained in this study were typed, and 35,174 tags were successfully encoded. To ensure the quality of the genetic map, the polymorphic SLAF tags were filtered to obtain 6717 SLAF tags that can be used for mapping. The distribution of the chromosome is shown in Table S2.

4.6. QTL Mapping Analysis of RIL Population

QTL IciMapping V4.2 software was used for QTL detection based on the phenotypes in the two environments. The complete interval mapping method (ICIM-ADD) was used, the scanning step was set to 1 cM, the stepwise regression marker entry probability was 0.001, and LOD = 3.0 was used as the threshold to detect the existence of a putative QTL. In addition, the ICIM-EPI method was used to detect epistatic interactions between markers, with a threshold of 5.0.

4.7. Candidate Gene Prediction

Gene ontology (GO) term enrichment analysis was conducted for genes located within the identified QTL clusters. This step aids in selecting candidate genes by examining sequence variations between the parental lines. GO annotation data were retrieved from the soybean database SoyBase (https://www.soybase.org/ (accessed on 28 December 2024)), and the WEGO2.0 online tool (http://wego.genomics.org.cn/ (accessed on 28 December 2024)) was utilized to generate visualizations of gene enrichment across cellular components, molecular functions, and biological processes. Subsequently, genes exhibiting high expression in soybeans were further screened using expression data obtained from SoyBase. Functional annotation of the selected genes was performed using the Phytozome database (https://phytozome-next.jgi.doe.gov/ (accessed on 28 December 2024)), and candidate genes were identified based on literature reviews and gene function analyses. Tissue-specific expression patterns of the candidate genes were visualized using a heat map generated by the online tool (https://www.omicshare.com/tools/Home/Soft/heatmap/ (accessed on 28 December 2024)) [60], while gene structures were mapped using the Gene Structure Display Server (http://gsds.gao-lab.org/index.php/ (accessed on 28 December 2024)). Additionally, resequencing data of the parental lines were analyzed to compare variations in candidate genes. The whole genomes of the parental lines were sequenced using the Illumina HiSeq X Ten platform, achieving an average sequencing depth of 8× [61]. High-quality sequencing data were evaluated to predict structural variations in the candidate genes.

4.8. Quantitative Real-Time PCR (qRT-PCR) Analysis

Quantitative real-time PCR (qRT-PCR) was employed to analyze gene expression levels. Root and stem tissues from the two parental lines, DS16 and QX34, were stored at –80 °C. Total RNA was extracted from these tissues using the Plant Total RNA Purification Kit (Promega (Beijing) Biotech Co., Ltd., Beijing, China). Following extraction, 1 µg of RNA was treated to remove genomic DNA and then reverse transcribed into cDNA using the TransScript One-Step gDNA Removal and cDNA Synthesis SuperMix kit (Novoprotein). The qRT-PCR was performed on the CFX96 Real-Time System (Bio-Rad, Hercules, CA, USA) with the following cycling conditions: initial denaturation at 95 °C for 1 minute, followed by 40 cycles of denaturation at 95 °C for 10 s, annealing at 55.0–60.0 °C (gene-specific) for 10 s, and extension at 72 °C for 30 s. The soybean ACT3 gene served as the reference control. Expression levels were quantified using the comparative cycle threshold method (2−△△ct), and each experiment was replicated three times. Primer sequences for the target genes are provided in Table S3.

5. Conclusions

This study provides a comprehensive analysis of the genetic and molecular mechanisms underlying yield-related traits in soybeans, focusing on PN, SN, and MSNN. Phenotypic analysis revealed significant variations between genotypes DS16 and QH34, with QH34 consistently exhibiting higher trait values, though environmental effects were evident across growing seasons. A high-density genetic map enabled the identification of stable QTLs, particularly on chromosome 19, which explained up to 43.59% of the phenotypic variation for MSNN and harbored key candidate genes involved in stress responses, growth regulation, and metabolism. Gene expression analysis highlighted genotype-specific transcriptional responses, with QH34 showing dramatic upregulation of reproductive-stage genes, suggesting distinct regulatory mechanisms.

Supplementary Materials

The supporting information can be downloaded at https://www.mdpi.com/article/10.3390/ijms26052300/s1.

Author Contributions

Conceptualization, C.Z., B.Z. (Bire Zha), J.S. and L.Q.; data curation, B.Z. (Bire Zha), R.Y., K.Z., J.S. and S.F.L.; formal analysis, B.Z. (Bire Zha), R.Y., K.Z., F.Z., S.F.L. and L.Q.; funding acquisition, X.L., B.Z. (Bixian Zhang), H.R. and L.Q.; investigation, C.Z., B.Z. (Bire Zha), K.Z., X.L., X.W. and F.Z.; methodology, B.Z. (Bixian Zhang), J.S., X.L., X.W., F.Z. and S.F.L.; project administration, X.L., B.Z. (Bixian Zhang), H.R. and L.Q.; resources, R.Y., K.Z., J.S., F.Z. and L.Q.; software, X.L., F.Z., S.F.L., H.R. and L.Q.; supervision, J.S., X.W., B.Z. (Bixian Zhang), H.R. and L.Q.; validation, C.Z., B.Z. (Bire Zha), R.Y., K.Z. and L.Q.; visualization, R.Y., X.W. and H.R.; writing—original draft, C.Z., K.Z., J.S., X.W., S.F.L. and L.Q.; writing—review and editing, B.Z. (Bixian Zhang), S.F.L. and H.R. All authors have read and agreed to the published version of the manuscript.

Funding

This work was supported by Scientific Research Business Expenses of Heilongjiang Scientific Research Institutes (Grant No. CZKYF2024-1-A003); Biological Breeding-National Science and Technology Major Project (2023ZD04032); Project funded by Agricultural Science and Technology Innovation Leaping Project in Heilongjiang Province (Grant No. CX23ZD04); Natural Science Foundation of Heilongjiang Province of China (PL2024C027).

Institutional Review Board Statement

Not applicable.

Informed Consent Statement

Not applicable.

Data Availability Statement

Data is contained within the article and Supplementary Material.

Conflicts of Interest

The authors declare no conflicts of interest.

Abbreviations

The following abbreviations are used in this manuscript:
MSNNMain Stem Node Number
QTLQuantitative Trait Loci
RILsRecombinant inbred lines
PNPod number
SNSeed number
SLAFSpecific locus-amplified fragment sequencing
GOGene Ontology
KEGGKyoto Encyclopedia of Genes and Genomes

References

  1. Chowdhury, S.; Fuller, R.A.; Dingle, H.; Chapman, J.W.; Zalucki, M.P. Migration in butterflies: A global overview. Biol. Rev. 2021, 96, 1462–1483. [Google Scholar] [CrossRef] [PubMed]
  2. Wang, L.; Zhang, M.; Li, M.; Jiang, X.; Jiao, W.; Song, Q. A telomere-to-telomere gap-free assembly of soybean genome. Mol. Plant 2023, 16, 1711–1714. [Google Scholar] [CrossRef] [PubMed]
  3. Sedivy, E.J.; Wu, F.; Hanzawa, Y. Soybean domestication: The origin, genetic architecture and molecular bases. New Phytol. 2017, 214, 539–553. [Google Scholar] [CrossRef]
  4. Yu, H.; Bhat, J.A.; Li, C.; Zhao, B.; Guo, T.; Feng, X. Genome-wide survey identified superior and rare haplotypes for plant height in the north-eastern soybean germplasm of China. Mol. Breed. 2023, 43, 22. [Google Scholar] [CrossRef]
  5. Bhat, J.A.; Yu, D. High-throughput NGS-based genotyping and phenotyping: Role in genomics-assisted breeding for soybean improvement. Legume Sci. 2021, 3, e81. [Google Scholar] [CrossRef]
  6. Wang, B.; Smith, S.M.; Li, J. Genetic regulation of shoot architecture. Annu. Rev. Plant Biol. 2018, 69, 437–468. [Google Scholar] [CrossRef]
  7. Egli, D. The relationship between the number of nodes and pods in soybean communities. Crop Sci. 2013, 53, 1668–1676. [Google Scholar] [CrossRef]
  8. Liu, W.; Kim, M.Y.; Van, K.; Lee, Y.-H.; Li, H.; Liu, X.; Lee, S.-H. QTL identification of yield-related traits and their association with flowering and maturity in soybean. J. Crop Sci. Biotechnol. 2011, 14, 65–70. [Google Scholar] [CrossRef]
  9. Song, J.; Sun, X.; Zhang, K.; Liu, S.; Wang, J.; Yang, C.; Jiang, S.; Siyal, M.; Li, X.; Qi, Z. Identification of QTL and genes for pod number in soybean by linkage analysis and genome-wide association studies. Mol. Breed. 2020, 40, 60. [Google Scholar] [CrossRef]
  10. Yao, D.; Liu, Z.; Zhang, J.; Liu, S.; Qu, J.; Guan, S.; Pan, L.; Wang, D.; Liu, J.; Wang, P. Analysis of quantitative trait loci for main plant traits in soybean. Genet. Mol. Res. 2015, 14, 6101–6109. [Google Scholar] [CrossRef]
  11. Wang, P.; Sun, X.; Zhang, K.; Fang, Y.; Wang, J.; Yang, C.; Li, W.-X.; Ning, H. Mapping QTL/QTN and mining candidate genes for plant height and its response to planting densities in soybean [Glycine max (L.) Merr.] through a FW-RIL population. Mol. Breed. 2021, 41, 12. [Google Scholar] [CrossRef] [PubMed]
  12. Chang, F.; Guo, C.; Sun, F.; Zhang, J.; Wang, Z.; Kong, J.; He, Q.; Sharmin, R.A.; Zhao, T. Genome-wide association studies for dynamic plant height and number of nodes on the main stem in summer sowing soybeans. Front. Plant Sci. 2018, 9, 1184. [Google Scholar] [CrossRef] [PubMed]
  13. Li, R.; Jiang, H.; Zhang, Z.; Zhao, Y.; Xie, J.; Wang, Q.; Zheng, H.; Hou, L.; Xiong, X.; Xin, D. Combined linkage mapping and BSA to identify QTL and candidate genes for plant height and the number of nodes on the main stem in soybean. Int. J. Mol. Sci. 2019, 21, 42. [Google Scholar] [CrossRef]
  14. Assefa, T.; Otyama, P.I.; Brown, A.V.; Kalberer, S.R.; Kulkarni, R.S.; Cannon, S.B. Genome-wide associations and epistatic interactions for internode number, plant height, seed weight and seed yield in soybean. BMC Genom. 2019, 20, 527. [Google Scholar] [CrossRef] [PubMed]
  15. Fu, M.; Wang, Y.; Ren, H.; Du, W.; Yang, X.; Wang, D.; Cheng, Y.; Zhao, J.; Gai, J. Exploring the QTL–allele constitution of main stem node number and its differentiation among maturity groups in a Northeast China soybean population. Crop Sci. 2020, 60, 1223–1238. [Google Scholar] [CrossRef]
  16. Fahim, A.M.; Liu, F.; He, J.; Wang, W.; Xing, G.; Gai, J. Evolutionary QTL-allele changes in main stem node number among geographic and seasonal subpopulations of Chinese cultivated soybeans. Mol. Genet. Genom. 2021, 296, 313–330. [Google Scholar] [CrossRef]
  17. Gai, J.; Wang, Y.; Wu, X.; Chen, S. A comparative study on segregation analysis and QTL mapping of quantitative traits in plants—With a case in soybean. Front. Agric. China 2007, 1, 1–7. [Google Scholar] [CrossRef]
  18. Wang, L.; Cheng, Y.; Ma, Q.; Mu, Y.; Huang, Z.; Xia, Q.; Zhang, G.; Nian, H. QTL fine-mapping of soybean (Glycine max L.) leaf type associated traits in two RILs populations. BMC Genom. 2019, 20, 260. [Google Scholar] [CrossRef]
  19. Zhang, W.-K.; Wang, Y.-J.; Luo, G.-Z.; Zhang, J.-S.; He, C.-Y.; Wu, X.-L.; Gai, J.-Y.; Chen, S.-Y. QTL mapping of ten agronomic traits on the soybean (Glycine max L. Merr.) genetic map and their association with EST markers. Theor. Appl. Genet. 2004, 108, 1131–1139. [Google Scholar] [CrossRef]
  20. Chen, S.; Sun, Y.; Shao, Z.; Li, W.; Du, H.; Kong, Y.; Li, X.; Zhang, C. Stable pleiotropic loci and candidate genes for fresh pod-and seed-related characteristics across multiple environments in soybean (Glycine max). Plant Breed. 2021, 140, 630–642. [Google Scholar] [CrossRef]
  21. Li, C.; Zou, J.; Jiang, H.; Yu, J.; Huang, S.; Wang, X.; Liu, C.; Guo, T.; Zhu, R.; Wu, X. Identification and validation of number of pod-and seed-related traits QTL s in soybean. Plant Breed. 2018, 137, 730–745. [Google Scholar] [CrossRef]
  22. Jeong, N.; Suh, S.J.; Kim, M.-H.; Lee, S.; Moon, J.-K.; Kim, H.S.; Jeong, S.-C. Ln is a key regulator of leaflet shape and number of seeds per pod in soybean. Plant Cell 2012, 24, 4807–4818. [Google Scholar] [CrossRef] [PubMed]
  23. Sayama, T.; Tanabata, T.; Saruta, M.; Yamada, T.; Anai, T.; Kaga, A.; Ishimoto, M. Confirmation of the pleiotropic control of leaflet shape and number of seeds per pod by the Ln gene in induced soybean mutants. Breed. Sci. 2017, 67, 363–369. [Google Scholar] [CrossRef]
  24. Wang, X.; Li, Y.; Zhang, H.; Sun, G.; Zhang, W.; Qiu, L. Evolution and association analysis of GmCYP78A10 gene with seed size/weight and pod number in soybean. Mol. Biol. Rep. 2015, 42, 489–496. [Google Scholar] [CrossRef] [PubMed]
  25. Das, S.; Singh, M.; Srivastava, R.; Bajaj, D.; Saxena, M.S.; Rana, J.C.; Bansal, K.C.; Tyagi, A.K.; Parida, S.K. mQTL-seq delineates functionally relevant candidate gene harbouring a major QTL regulating pod number in chickpea. DNA Res. 2016, 23, 53–65. [Google Scholar] [CrossRef]
  26. Nemli, S.; Asciogul, T.K.; Kaya, H.B.; Kahraman, A.; Eşiyok, D.; Tanyolac, B. Association mapping for five agronomic traits in the common bean (Phaseolus vulgaris L.). J. Sci. Food Agric. 2014, 94, 3141–3151. [Google Scholar] [CrossRef]
  27. Liu, Z.; Yao, D.; Zhang, J.; Li, Z.; Ma, J.; Liu, S.; Qu, J.; Guan, S.; Wang, D.; Pan, L. Identification of genes associated with the increased number of four-seed pods in soybean (Glycine max L.) using transcriptome analysis. Genet. Mol. Res. 2015, 14, 18895–18912. [Google Scholar] [CrossRef]
  28. Ren, H.; Zhao, K.; Zhang, C.; Lamlom, S.F.; Liu, X.; Wang, X.; Zhang, F.; Yuan, R.; Gao, Y.; Cao, B. Genetic analysis and QTL mapping of seed hardness trait in a soybean (Glycine max) recombinant inbred line (RIL) population. Gene 2024, 905, 148238. [Google Scholar] [CrossRef]
  29. Zhang, B.; Zhao, K.; Ren, H.; Lamlom, S.F.; Liu, X.; Wang, X.; Zhang, F.; Yuan, R.; Wang, J. Comparative Study of Isoflavone Synthesis Genes in Two Wild Soybean Varieties Using Transcriptomic Analysis. Agriculture 2023, 13, 1164. [Google Scholar] [CrossRef]
  30. Yang, Y.; Shi, J.; Wang, X.; Liu, G.; Wang, H. Genetic architecture and mechanism of seed number per pod in rapeseed: Elucidated through linkage and near-isogenic line analysis. Sci. Rep. 2016, 6, 24124. [Google Scholar] [CrossRef]
  31. Lamlom, S.F.; Zhang, Y.; Su, B.; Wu, H.; Zhang, X.; Fu, J.; Zhang, B.; Qiu, L.-J. Map-based cloning of a novel QTL qBN-1 influencing branch number in soybean [Glycine max (L.) Merr.]. Crop J. 2020, 8, 793–801. [Google Scholar] [CrossRef]
  32. Hyten, D.L.; Choi, I.Y.; Song, Q.; Specht, J.E.; Carter, T.E.; Shoemaker, R.C.; Hwang, E.Y.; Matukumalli, L.K.; Cregan, P.B. A high density integrated genetic linkage map of soybean and the development of a 1536 universal soy linkage panel for quantitative trait locus mapping. Crop Sci. 2010, 50, 960–968. [Google Scholar] [CrossRef]
  33. Jun, T.H.; Freewalt, K.; Michel, A.P.; Mian, R. Identification of novel QTL for leaf traits in soybean. Plant Breed. 2014, 133, 61–66. [Google Scholar] [CrossRef]
  34. Lee, S.; Freewalt, K.R.; McHale, L.K.; Song, Q.; Jun, T.-H.; Michel, A.P.; Dorrance, A.E.; Mian, M.R. A high-resolution genetic linkage map of soybean based on 357 recombinant inbred lines genotyped with BARCSoySNP6K. Mol. Breed. 2015, 35, 58. [Google Scholar] [CrossRef]
  35. Ren, H.; Qu, X.; Hong, H.; Sun, L.; Lamlom, S.F.; Liu, Z.; Lu, W. Multi-environment QTL mapping identifies major genetic loci influencing soybean main stem node architecture. PeerJ 2024, 12, e18539. [Google Scholar] [CrossRef]
  36. Ren, H.; Zhang, F.; Zhu, X.; Lamlom, S.F.; Liu, X.; Wang, X.; Zhao, K.; Wang, J.; Sun, M.; Yuan, M. Cultivation model and deficit irrigation strategy for reducing leakage of bundle sheath cells to CO2, improve 13C carbon isotope, photosynthesis and soybean yield in semi-arid areas. J. Plant Physiol. 2023, 285, 153979. [Google Scholar] [CrossRef]
  37. Ott, J.; Kamatani, Y.; Lathrop, M. Family-based designs for genome-wide association studies. Nat. Rev. Genet. 2011, 12, 465–474. [Google Scholar] [CrossRef] [PubMed]
  38. Liu, R.; Gong, J.; Xiao, X.; Zhang, Z.; Li, J.; Liu, A.; Lu, Q.; Shang, H.; Shi, Y.; Ge, Q. GWAS analysis and QTL identification of fiber quality traits and yield components in upland cotton using enriched high-density SNP markers. Front. Plant Sci. 2018, 9, 1067. [Google Scholar] [CrossRef]
  39. Fang, Y.; Liu, S.; Dong, Q.; Zhang, K.; Tian, Z.; Li, X.; Li, W.; Qi, Z.; Wang, Y.; Tian, X. Linkage analysis and multi-locus genome-wide association studies identify QTNs controlling soybean plant height. Front. Plant Sci. 2020, 11, 9. [Google Scholar] [CrossRef]
  40. Zhang, S.; Meng, L.; Wang, J.; Zhang, L. Background controlled QTL mapping in pure-line genetic populations derived from four-way crosses. Heredity 2017, 119, 256–264. [Google Scholar] [CrossRef]
  41. Sun, X.; Liu, D.; Zhang, X.; Li, W.; Liu, H.; Hong, W.; Jiang, C.; Guan, N.; Ma, C.; Zeng, H. SLAF-seq: An efficient method of large-scale de novo SNP discovery and genotyping using high-throughput sequencing. PLoS ONE 2013, 8, e58700. [Google Scholar] [CrossRef] [PubMed]
  42. Shang, J.; Li, N.; Li, N.; Xu, Y.; Ma, S.; Wang, J. Construction of a high-density genetic map for watermelon (Citrullus lanatus L.) based on large-scale SNP discovery by specific length amplified fragment sequencing (SLAF-seq). Sci. Hortic. 2016, 203, 38–46. [Google Scholar] [CrossRef]
  43. Gong, D.; Huang, L.; Xu, X.; Wang, C.; Ren, M.; Wang, C.; Chen, M. Construction of a high-density SNP genetic map in flue-cured tobacco based on SLAF-seq. Mol. Breed. 2016, 36, 100. [Google Scholar] [CrossRef]
  44. Wang, L.; Li, X.; Wang, L.; Xue, H.; Wu, J.; Yin, H.; Zhang, S. Construction of a high-density genetic linkage map in pear (Pyrus communis × Pyrus pyrifolia nakai) using SSRs and SNPs developed by SLAF-seq. Sci. Hortic. 2017, 218, 198–204. [Google Scholar] [CrossRef]
  45. Berhanu, H.; Tesso, B.; Lule, D. Correlation and path coefficient analysis for seed yield and yield related traits in soybean (Glycine max (L.)) genotypes. Plant 2021, 9, 106–110. [Google Scholar] [CrossRef]
  46. Kumar, R.; Saini, M.; Taku, M.; Debbarma, P.; Mahto, R.K.; Ramlal, A.; Sharma, D.; Rajendran, A.; Pandey, R.; Gaikwad, K. Identification of quantitative trait loci (QTLs) and candidate genes for seed shape and 100-seed weight in soybean [Glycine max (L.) Merr.]. Front. Plant Sci. 2023, 13, 1074245. [Google Scholar] [CrossRef]
  47. Liu, C.; Chen, H.; Yu, Q.; Gu, H.; Li, Y.; Tu, B.; Zhang, H.; Zhang, Q.; Liu, X. Identification of quantitative trait loci and candidate genes for seed sucrose and soluble sugar concentrations in soybean. Crop Sci. 2023, 63, 2976–2992. [Google Scholar] [CrossRef]
  48. Guo, B.; Sleper, D.; Arelli, P.; Shannon, J.; Nguyen, H. Identification of QTLs associated with resistance to soybean cyst nematode races 2, 3 and 5 in soybean PI 90763. Theor. Appl. Genet. 2005, 111, 965–971. [Google Scholar] [CrossRef] [PubMed]
  49. Hirata, K.; Masuda, R.; Tsubokura, Y.; Yasui, T.; Yamada, T.; Takahashi, K.; Nagaya, T.; Sayama, T.; Ishimoto, M.; Hajika, M. Identification of quantitative trait loci associated with boiled seed hardness in soybean. Breed. Sci. 2014, 64, 362–370. [Google Scholar] [CrossRef]
  50. Orazaly, M.; Chen, P.; Zhang, B.; Florez-Palacios, L.; Zeng, A. Confirmation of SSR markers and QTL for seed calcium content and hardness of soybean. J. Crop Improv. 2018, 32, 71–89. [Google Scholar] [CrossRef]
  51. Xu, X.; Xu, R.; Zhu, B.; Yu, T.; Qu, W.; Lu, L.; Xu, Q.; Qi, X.; Chen, X. A high-density genetic map of cucumber derived from Specific Length Amplified Fragment sequencing (SLAF-seq). Front. Plant Sci. 2015, 5, 768. [Google Scholar] [CrossRef]
  52. Bleckmann, A.; Alter, S.; Dresselhaus, T. The beginning of a seed: Regulatory mechanisms of double fertilization. Front. Plant Sci. 2014, 5, 452. [Google Scholar] [CrossRef] [PubMed]
  53. Sreenivasulu, N.; Wobus, U. Seed-development programs: A systems biology–based comparison between dicots and monocots. Annu. Rev. Plant Biol. 2013, 64, 189–217. [Google Scholar] [CrossRef] [PubMed]
  54. Reyes-Olalde, J.I.; Zuñiga-Mayo, V.M.; Montes, R.A.C.; Marsch-Martínez, N.; de Folter, S. Inside the gynoecium: At the carpel margin. Trends Plant Sci. 2013, 18, 644–655. [Google Scholar] [CrossRef] [PubMed]
  55. Xing, Y.; Zhang, Q. Genetic and molecular bases of rice yield. Annu. Rev. Plant Biol. 2010, 61, 421–442. [Google Scholar] [CrossRef]
  56. Saghai-Maroof, M.A.; Soliman, K.M.; Jorgensen, R.A.; Allard, R. Ribosomal DNA spacer-length polymorphisms in barley: Mendelian inheritance, chromosomal location, and population dynamics. Proc. Natl. Acad. Sci. USA 1984, 81, 8014–8018. [Google Scholar] [CrossRef]
  57. Kozich, J.J.; Westcott, S.L.; Baxter, N.T.; Highlander, S.K.; Schloss, P.D. Development of a dual-index sequencing strategy and curation pipeline for analyzing amplicon sequence data on the MiSeq Illumina sequencing platform. Appl. Environ. Microbiol. 2013, 79, 5112–5120. [Google Scholar] [CrossRef]
  58. Li, H.; Durbin, R. Fast and accurate short read alignment with Burrows–Wheeler transform. Bioinformatics 2009, 25, 1754–1760. [Google Scholar] [CrossRef]
  59. Li, H.; Durbin, R. Fast and accurate long-read alignment with Burrows–Wheeler transform. Bioinformatics 2010, 26, 589–595. [Google Scholar] [CrossRef]
  60. Jia, J.; Huan, W.; Cai, Z.-d.; Wei, R.-q.; Huang, J.-h.; Xia, Q.-j.; Xiao, X.-h.; Hai, N.; Cheng, Y.-b. Identification and validation of stable and novel quantitative trait loci for pod shattering in soybean [Glycinemax (L.) Merr.]. J. Integr. Agric. 2022, 21, 3169–3184. [Google Scholar] [CrossRef]
  61. Xian, P.; Cai, Z.; Jiang, B.; Xia, Q.; Cheng, Y.; Yang, Y.; Zhou, Q.; Lian, T.; Ma, Q.; Wang, Y. GmRmd1 encodes a TIR-NBS-BSP protein and confers resistance to powdery mildew in soybean. Plant Commun. 2022, 3, 100418. [Google Scholar] [CrossRef] [PubMed]
Figure 1. Phenotypic variation and correlation analysis of yield-related traits in soybean genotypes DS16 and QH34 across two growing seasons. (A) Comparison of pod number (PN), seed number (SN), and main stem node number (MSNN) between DS16 and QH34 genotypes in 2023. Bar plots show mean values ± standard error (n = 5). (B) Comparison of PN, SN, and MSNN between DS16 and QH34 genotypes in 2024. Boxplots show mean values ± standard error (n = 5). (C) Correlation matrix showing Pearson’s correlation coefficients (r) among yield-related traits across both growing seasons. Color intensity indicates correlation strength, with red representing positive correlations. Significant differences between genotypes: * p < 0.05, ** p < 0.01, *** p < 0.001; ns: not significant.
Ijms 26 02300 g001
Figure 2. Frequency distribution of PN, SN, and MSNN for DS16 and QH34 genotypes in Harbin and Sanya.
Ijms 26 02300 g002
Figure 3. The QTLs of PN, SN, and MSNN traits identified in the RIL-F2:6 population using a high-density genetic map. The x-axis indicates genetic position (cM); the y-axis indicates LOD score. Different colored lines represent different traits and locations.
Ijms 26 02300 g003
Figure 4. Enrichment analysis of candidate genes. (a) KEGG pathway analyses, (b) GO enrichment analysis.
Ijms 26 02300 g004
Figure 5. Expression profiles of 17 selected genes in the soybean parental lines DS16 and QH34 across various developmental stages. (a) and (b) display heatmaps representing the expression levels in DS16 and QH34, respectively, with rows corresponding to individual genes and columns indicating developmental stages. (c,d) show line graphs summarizing the mean expression levels of these genes across developmental stages for DS16 and QH34.
Ijms 26 02300 g005
Figure 6. SLAF tag and polymorphism distribution of SLAF tag on chromosomes. (a) shows the distribution of SLAF markers, and (b) shows the polymorphic distribution of SLAF markers (in M units). Note: The abscissa is the length of a chromosome, and each yellow stripe represents a chromosome. The genome is divided into 1M units, and different colors indicate the number of SLAF. The darker the color, the more SLAF. The darker areas in the figure are the concentrated distribution of SLAF markers. Note: The horizontal axis is the length of the chromosome, and each yellow stripe represents a chromosome.
Ijms 26 02300 g006
Table 1. Statistical analysis of phenotypic traits for PN, SN, and MSNN across two environments.
EnvironmentTraitsMinMaxMeanSDVarianceSkewnessKurtosisCV
Harbin PN22.810452.3713.24175.390.550.450.25
SN35.6239.4111.4334.221171.230.40.190.31
MSNN828.818.573.6113.07−0.2031−0.05080.23
SanyaPN9.88227.259.8997.761.966.960.36
SN2219257.1621.35455.822.218.850.37
MSNN5.215.88.981.943.770.524−0.12290.22
Table 2. Basic information statistics of the high-density genetic map.
Linkage GroupMarker
(No)
Map Distance (cM)Average Map Distance (cM)Gaps < 5 cM
(%)
Max Gap
(cM)
Gm01348145.080.42100.004.54
Gm02372156.700.4299.465.56
Gm03365167.920.4699.187.46
Gm04309140.070.4599.037.28
Gm05183160.410.8898.355.38
Gm06211145.650.6999.058.32
Gm07371161.220.4499.469.49
Gm08255125.880.50100.004.00
Gm09357133.830.3899.725.50
Gm10455123.760.2799.567.94
Gm11131122.390.9496.9210.95
Gm12133128.100.9797.7314.34
Gm13243125.730.5299.1710.69
Gm14224148.460.6799.5511.70
Gm15625167.770.2799.367.90
Gm16390192.550.4999.237.58
Gm17345148.670.4398.846.76
Gm18283142.600.51100.004.43
Gm19484152.160.3299.796.31
Gm20213156.310.7499.065.82
Total62972945.260.4799.1714.34
Table 3. QTL mapping identified multiple significant loci in soybeans.
YearTraitsChr.PositionLeft MarkerRight MarkerLODPVE(%)AddPhysical Length
HarbinPN2041Marker2448322Marker25011504.68045.8529−3.384683,365 bp
SN1426Marker5556237Marker57176532.51983.4514−6.158836.05 kbp
SN189Marker4230716Marker44075222.84693.8975−6.5107381 kbp
MSNN645Marker777950Marker7669087.85687.7379−1.27295.54 Mbp
MSNN186Marker4165022Marker42283785.4933.804−0.754764.58 kbp
MSNN1916Marker1939109Marker197874522.590724.56682.2155101.90 kbp
Sanya PN1915Marker1990755Marker177032418.156823.01884.6921274,223 bp
SN1915Marker1990755Marker177032415.241419.58889.4462274,223 bp
MSNN1740Marker5907974Marker59352433.89313.4569−0.35232.84 Mbp
MSNN1917Marker1978745Marker171192037.921843.5881.24531.12 Mbp
Disclaimer/Publisher’s Note: The statements, opinions and data contained in all publications are solely those of the individual author(s) and contributor(s) and not of MDPI and/or the editor(s). MDPI and/or the editor(s) disclaim responsibility for any injury to people or property resulting from any ideas, methods, instructions or products referred to in the content.

