
Molecular Docking Study and 3D-QSAR Model for Trans-Stilbene Derivatives as Ligands of CYP1B1


Abstract
1. Introduction
2. Results and Discussion
2.1. Three-Dimensional Quantitative Structure–Activity Relationship Model
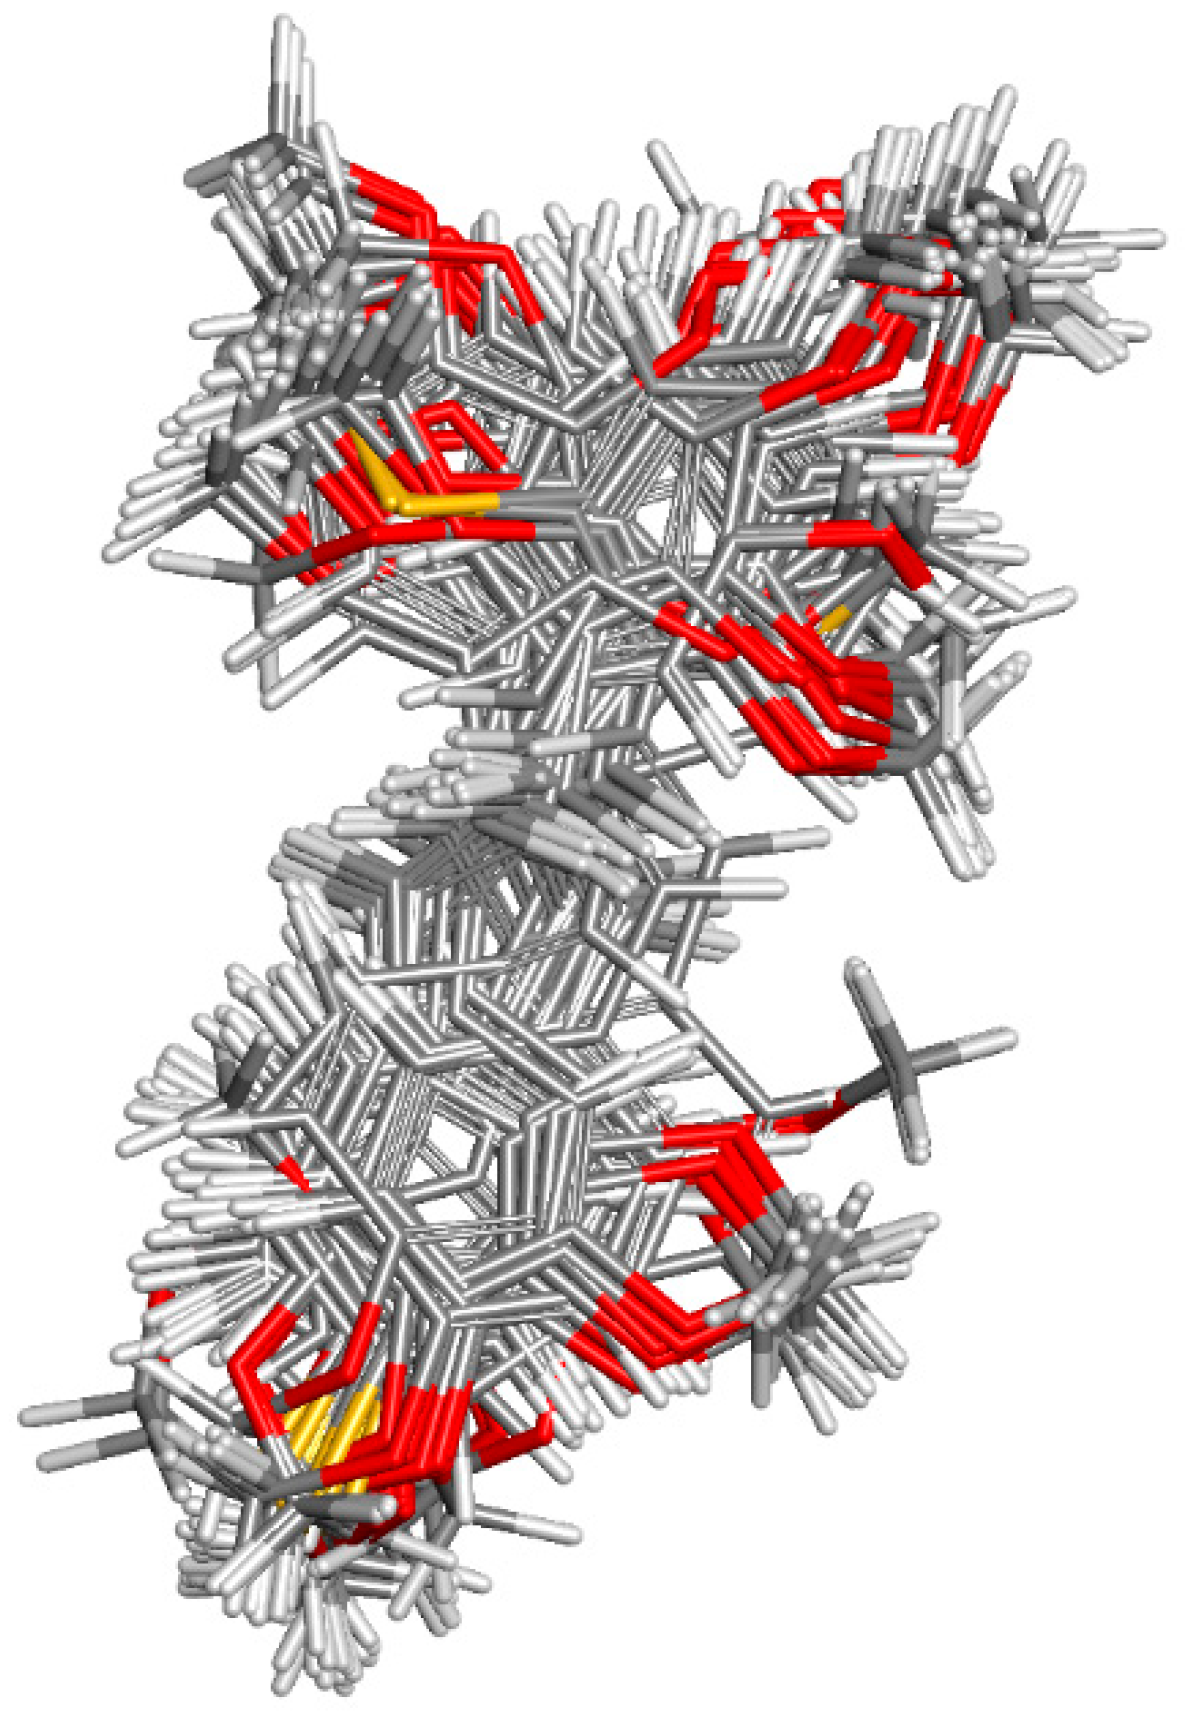
2.1.1. Molecular Alignment
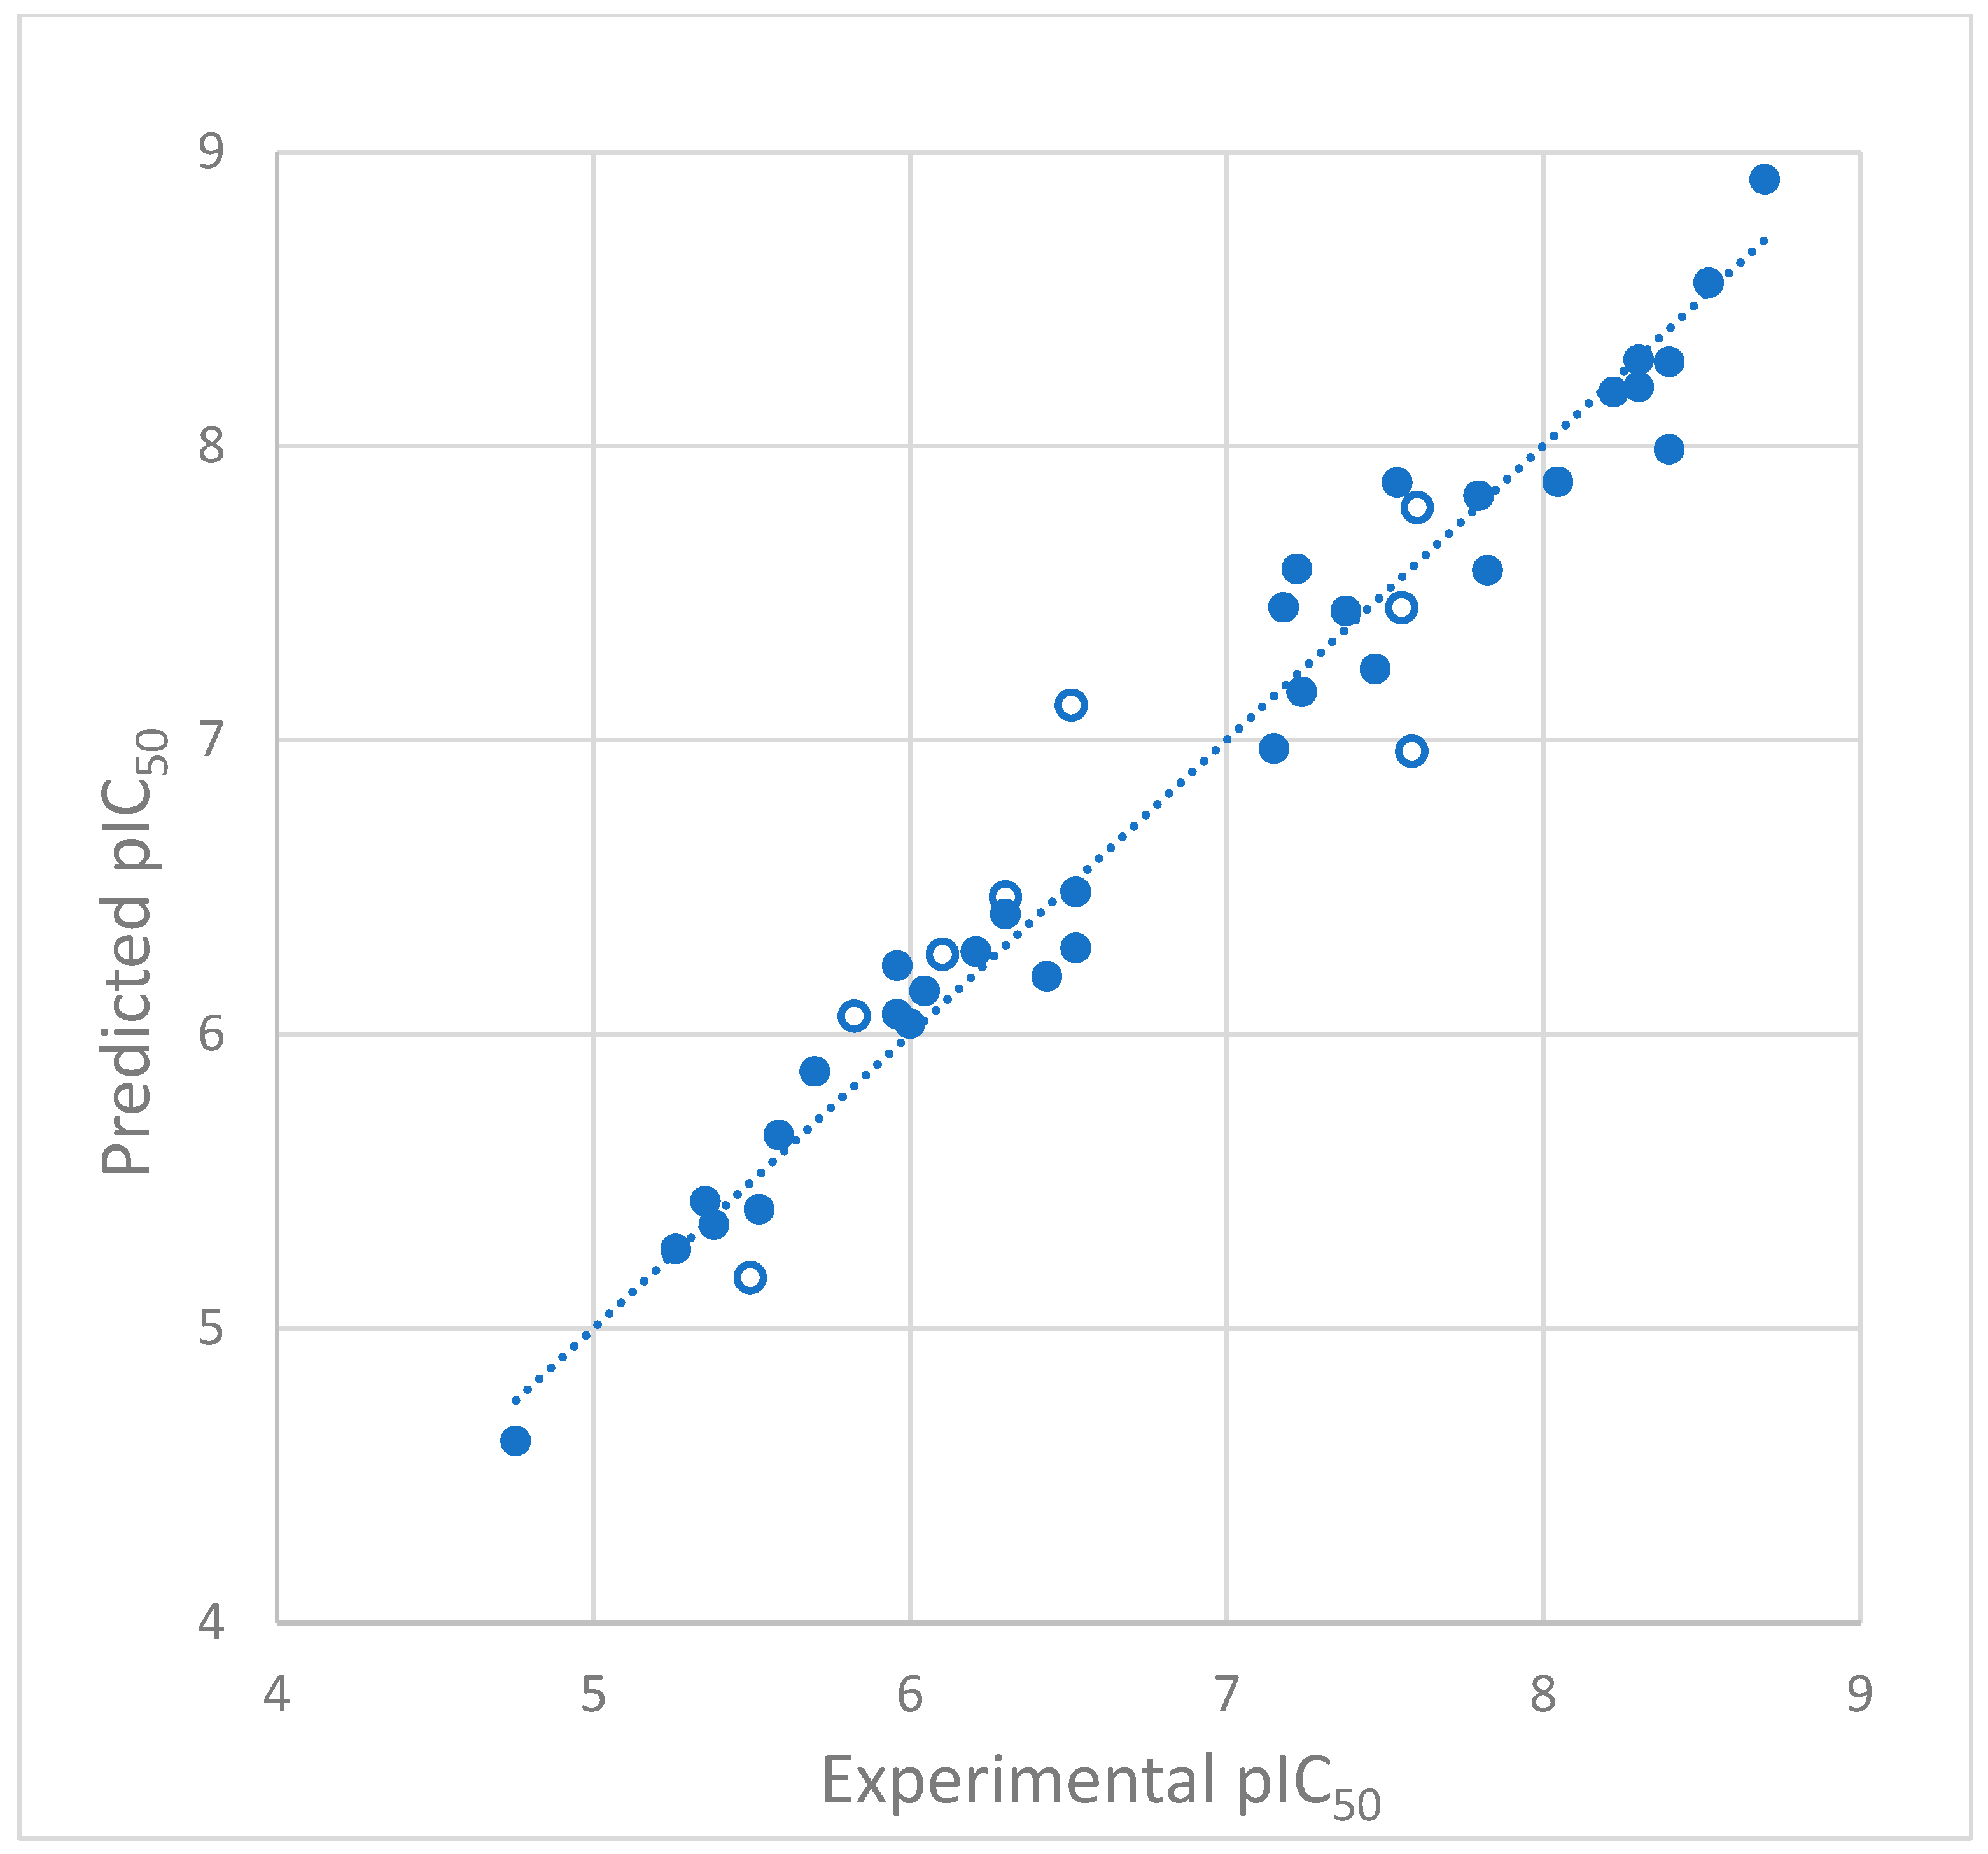
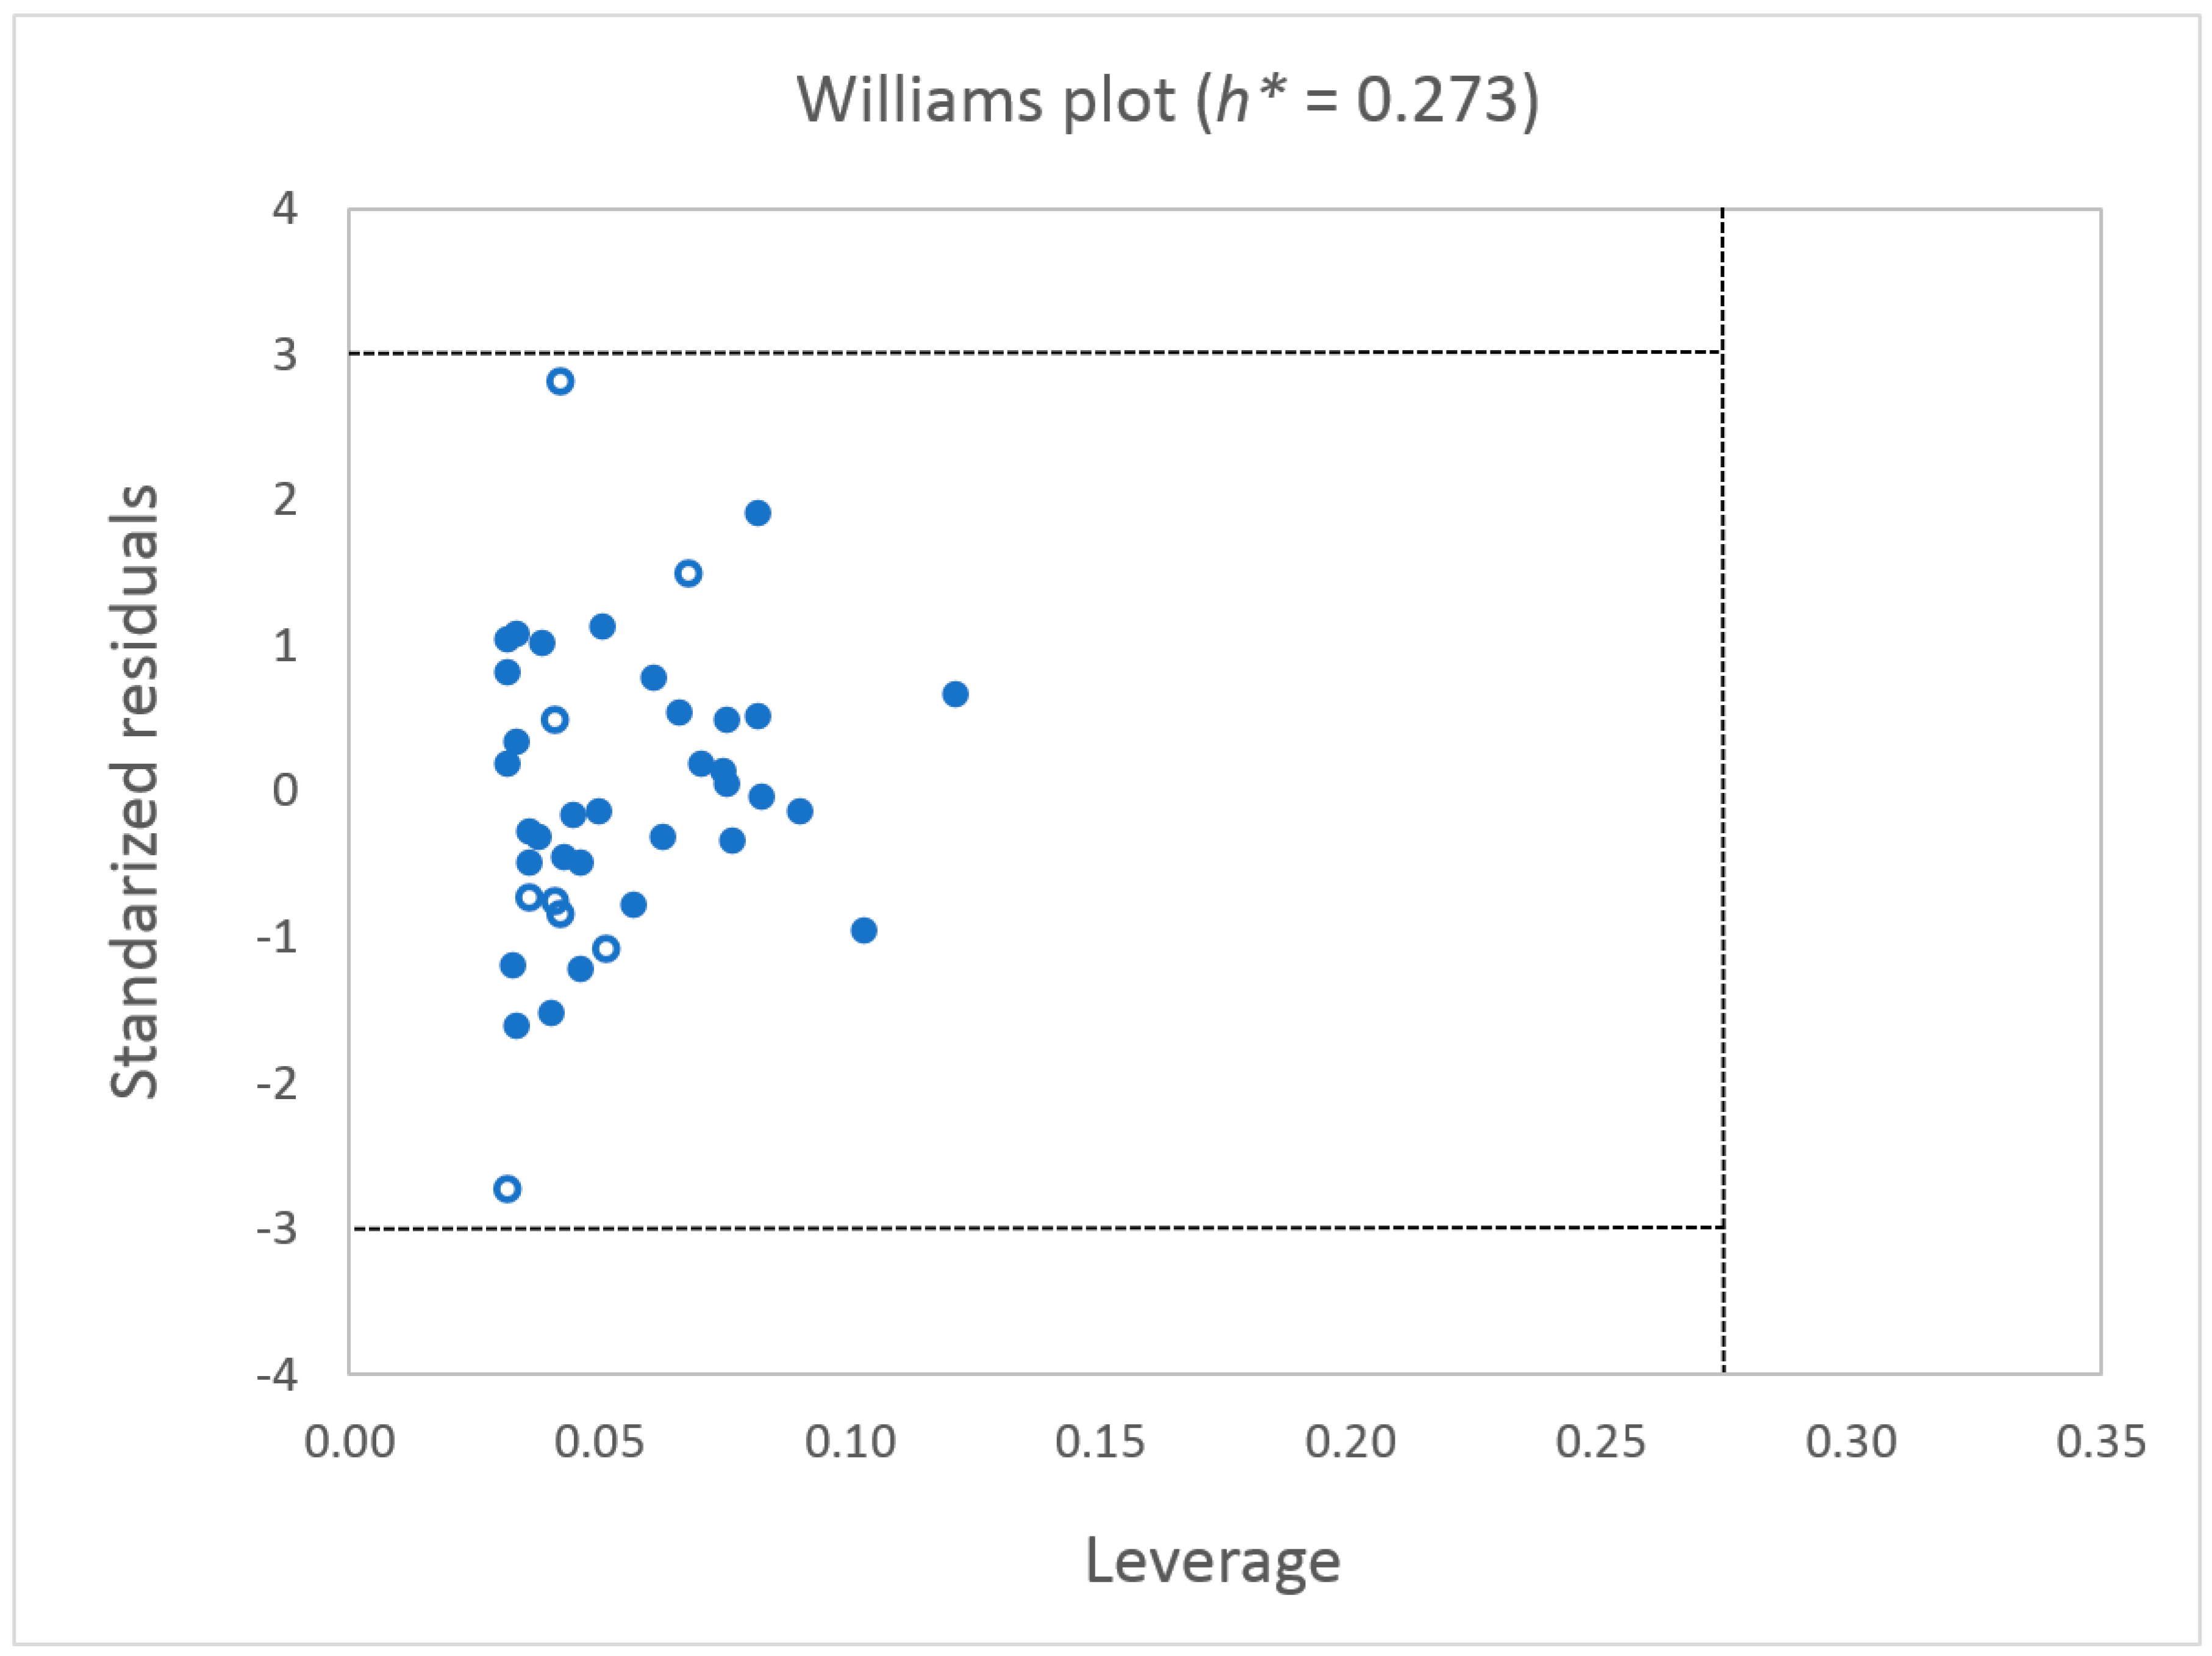
2.1.2. Model Validation
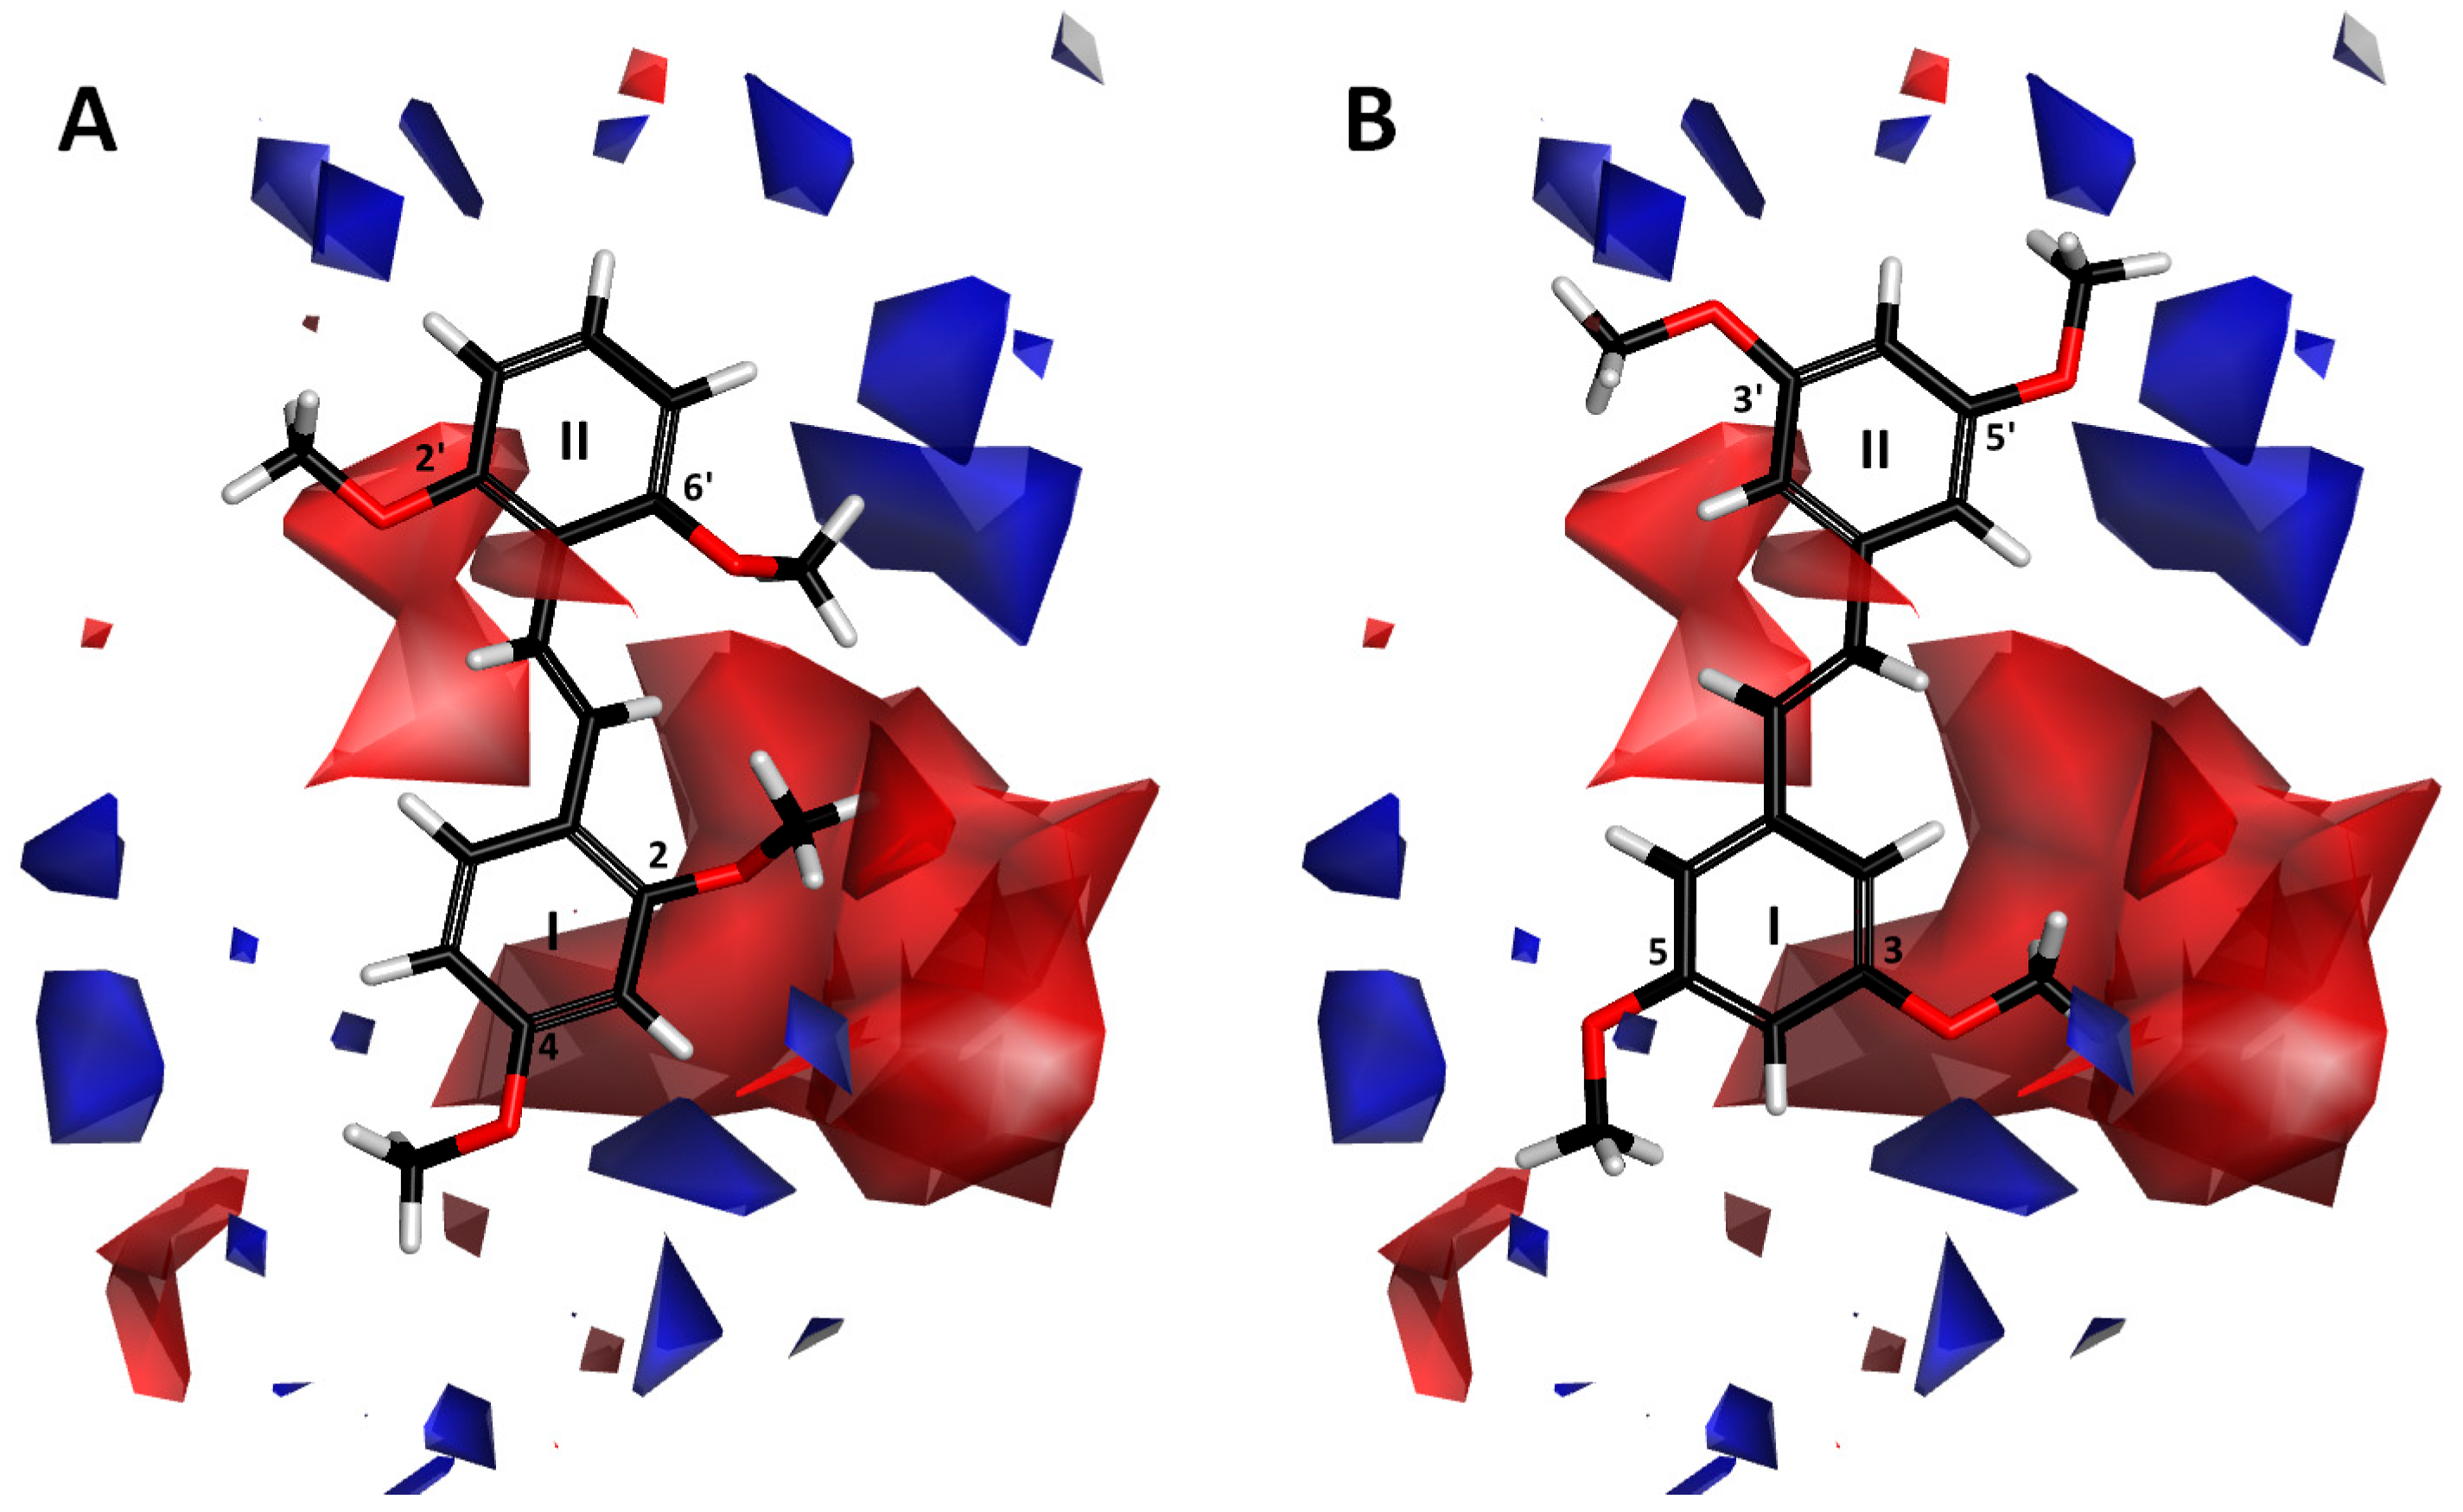
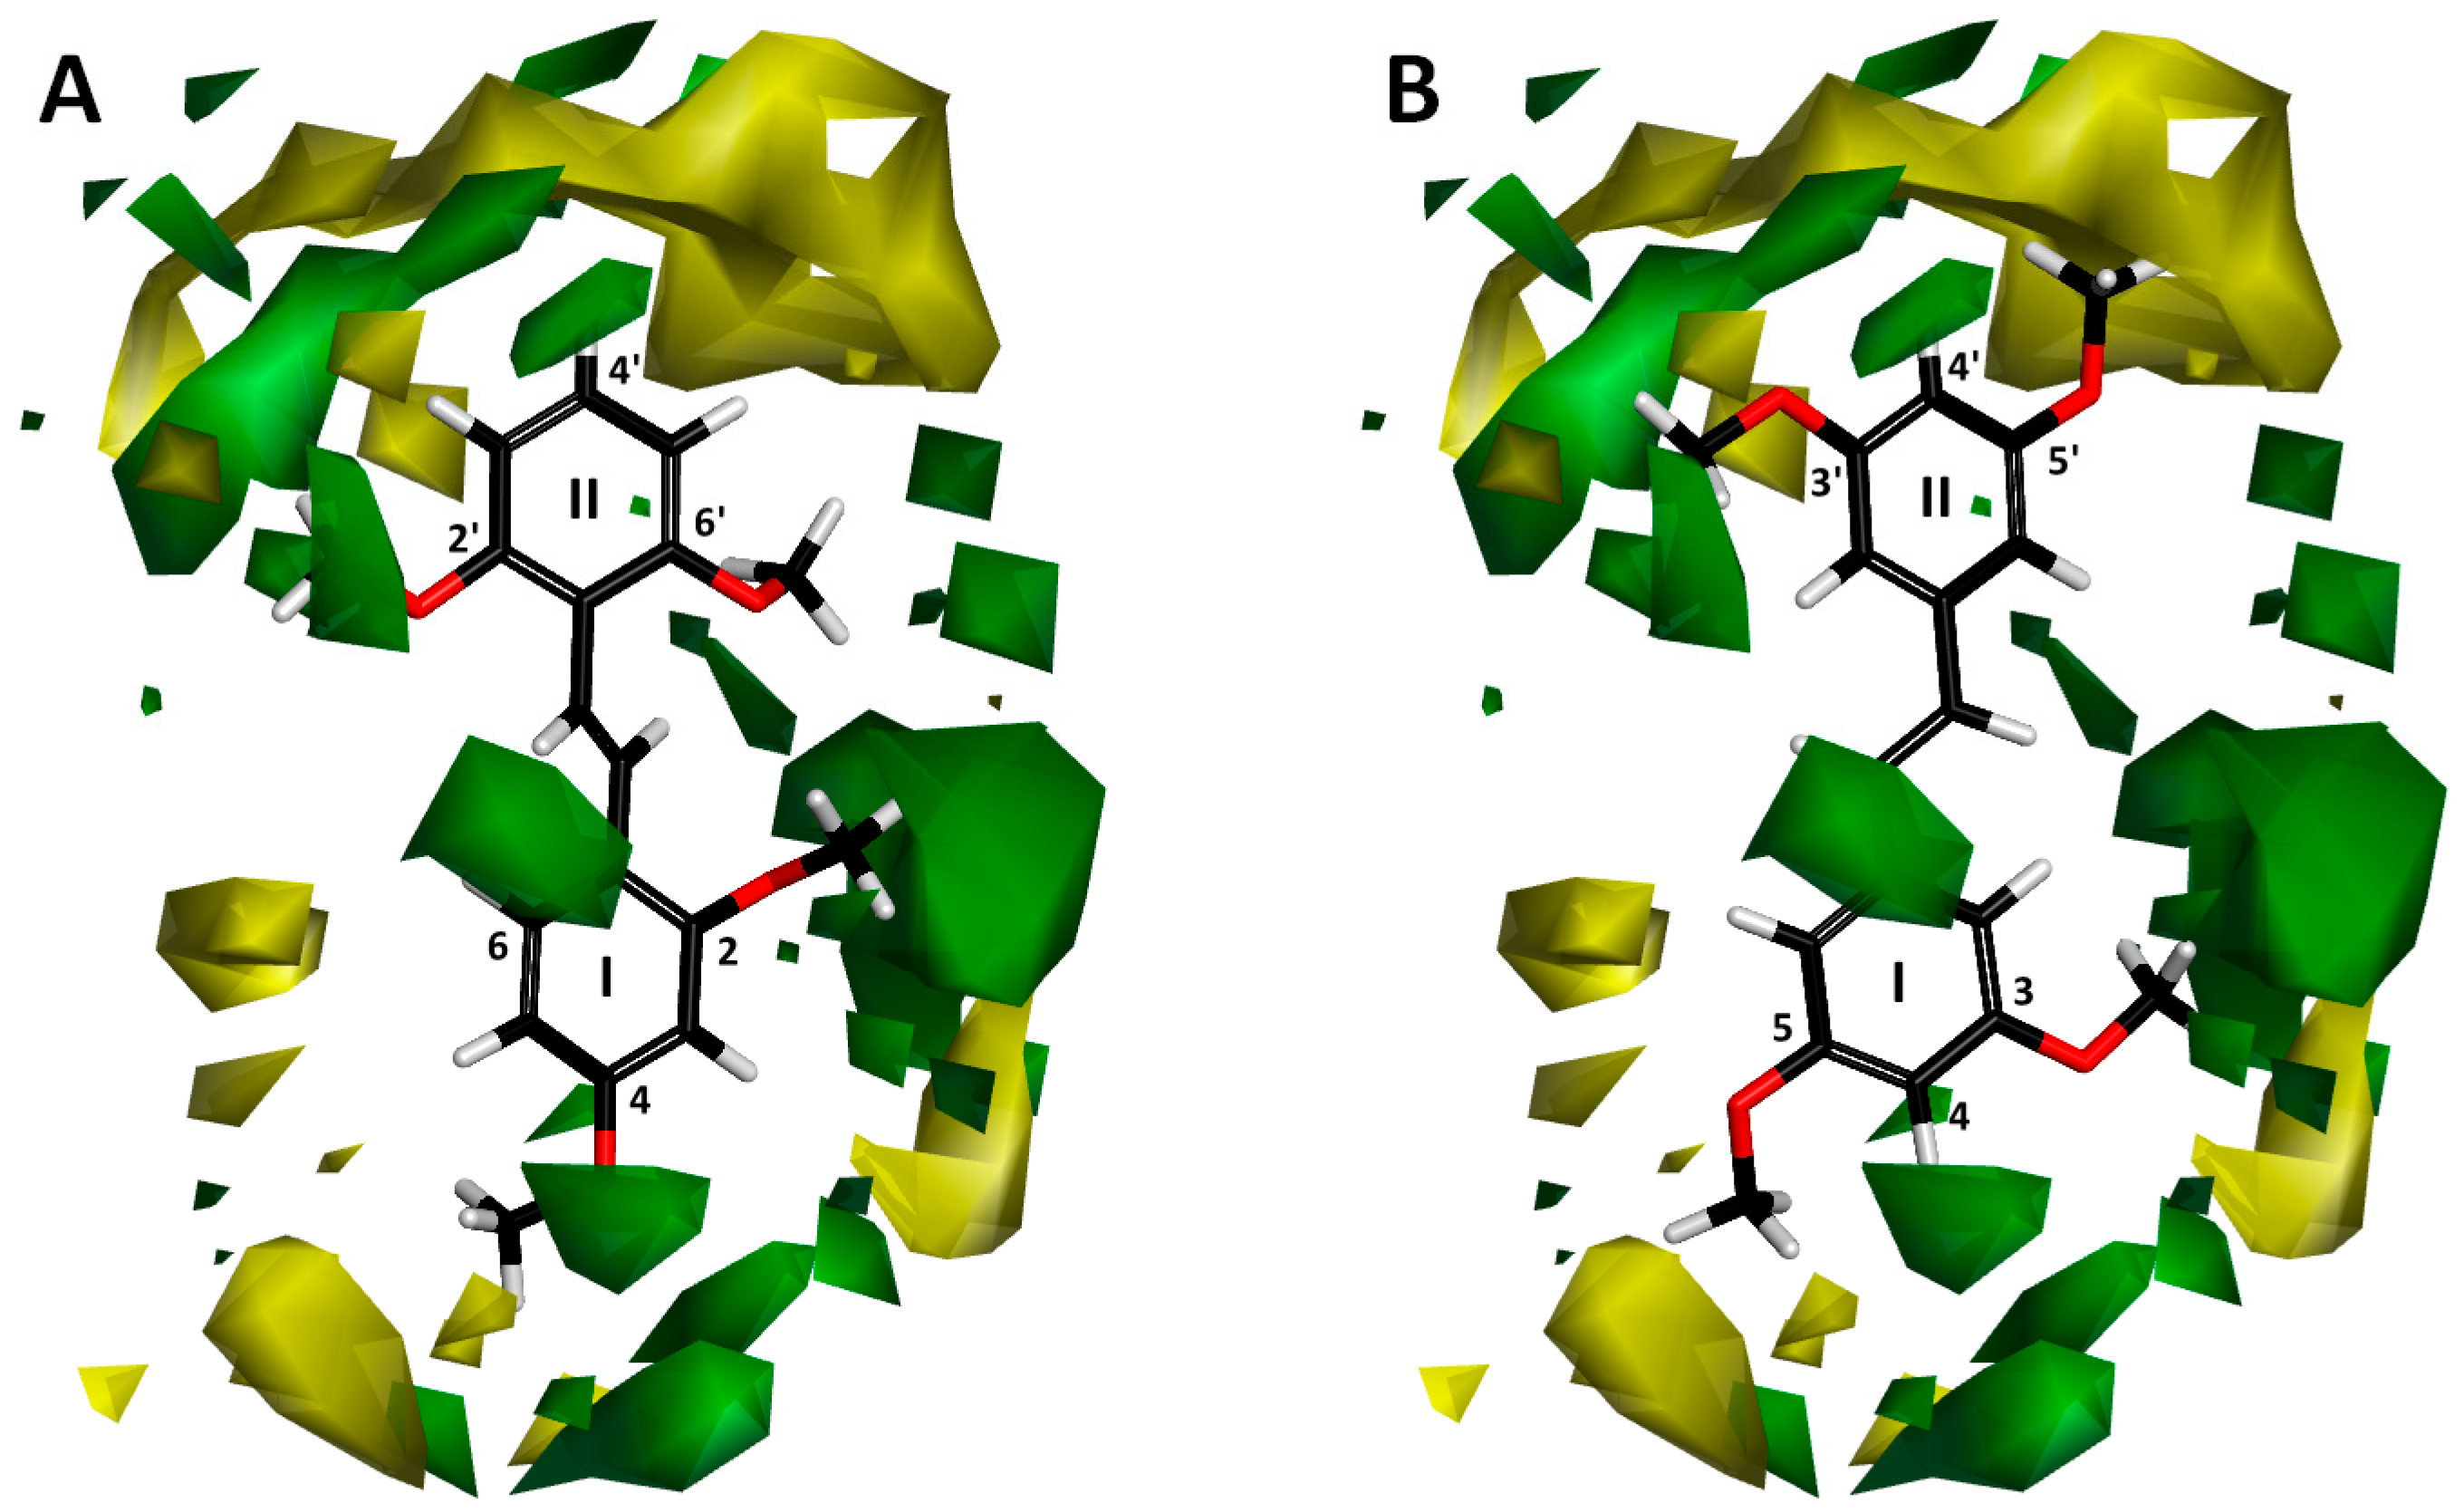
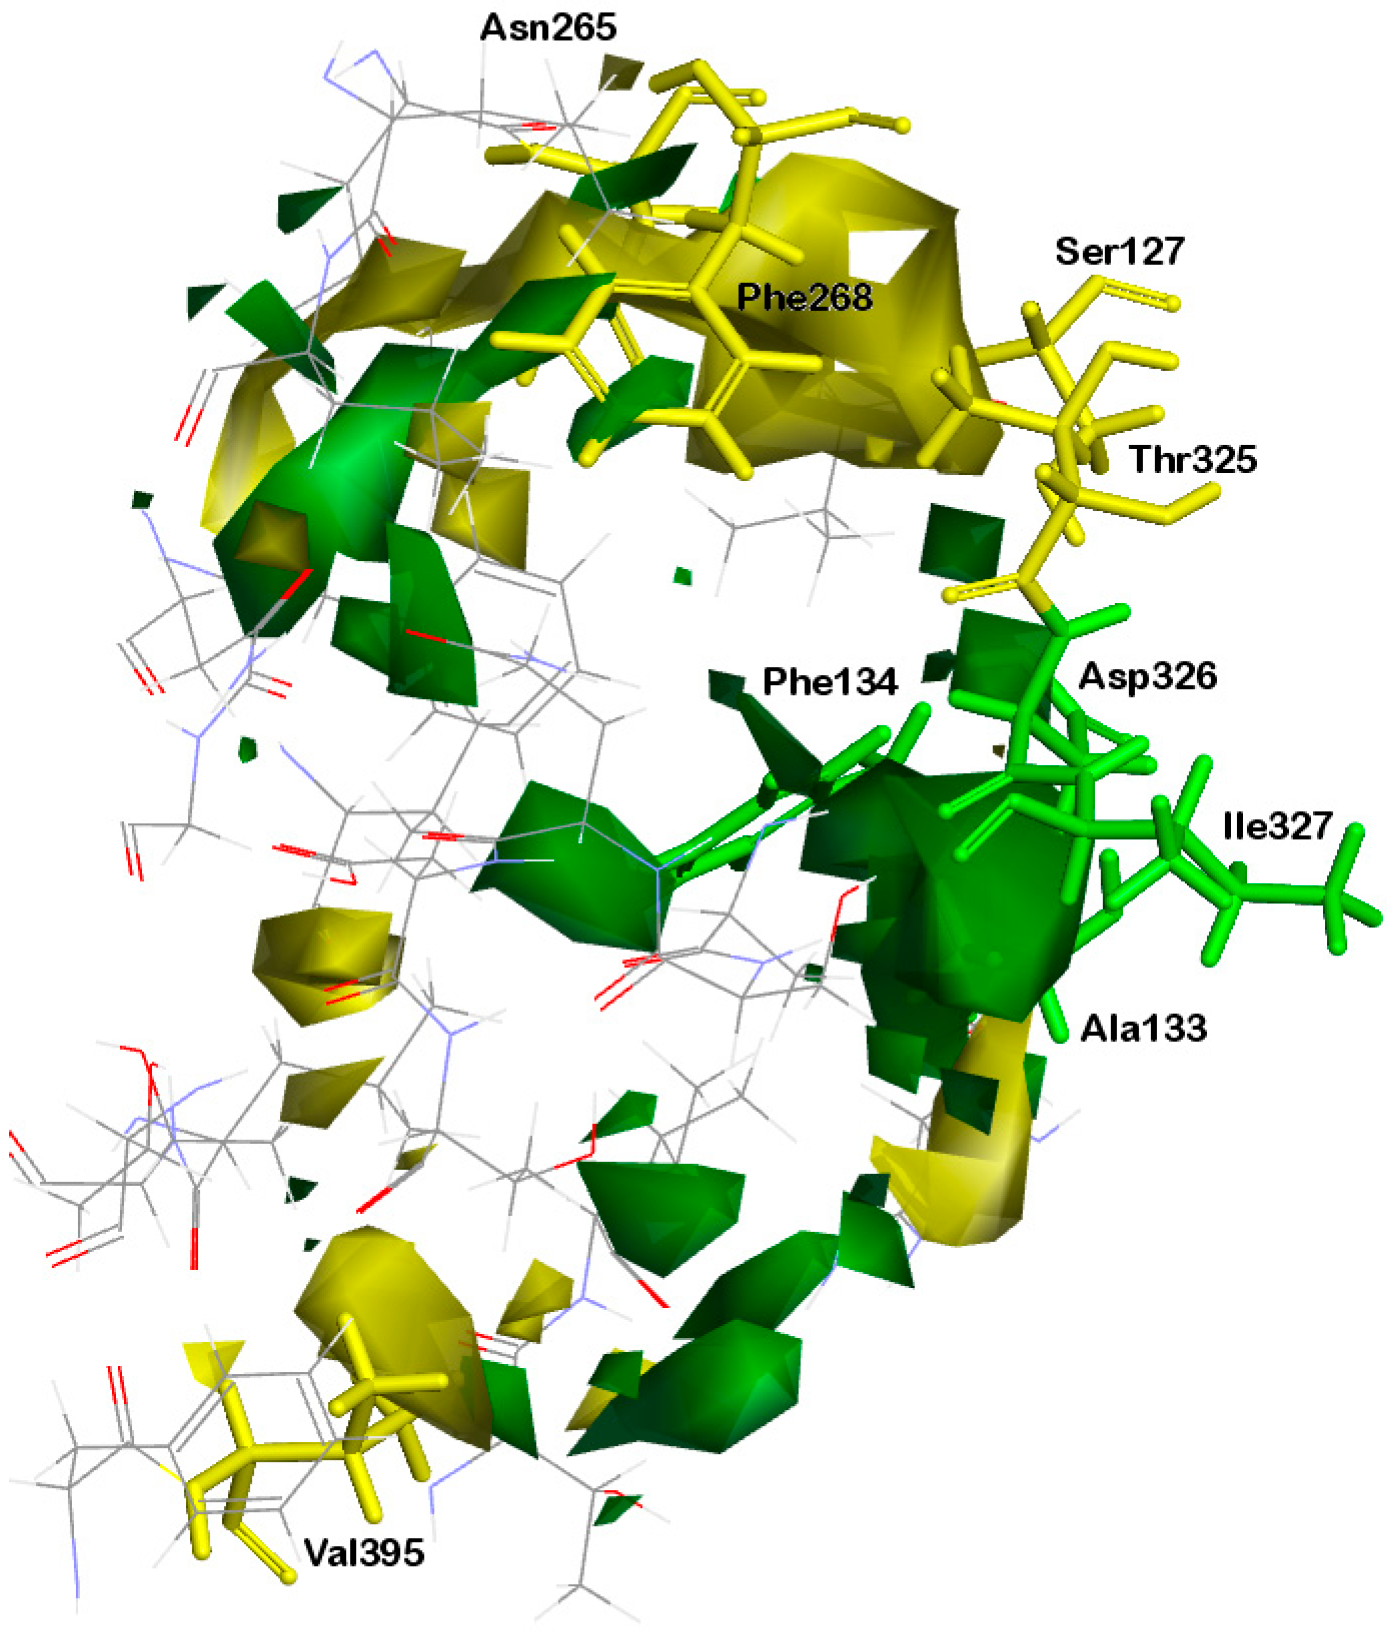
2.1.3. Contour Map Analysis
2.2. Docking Analysis
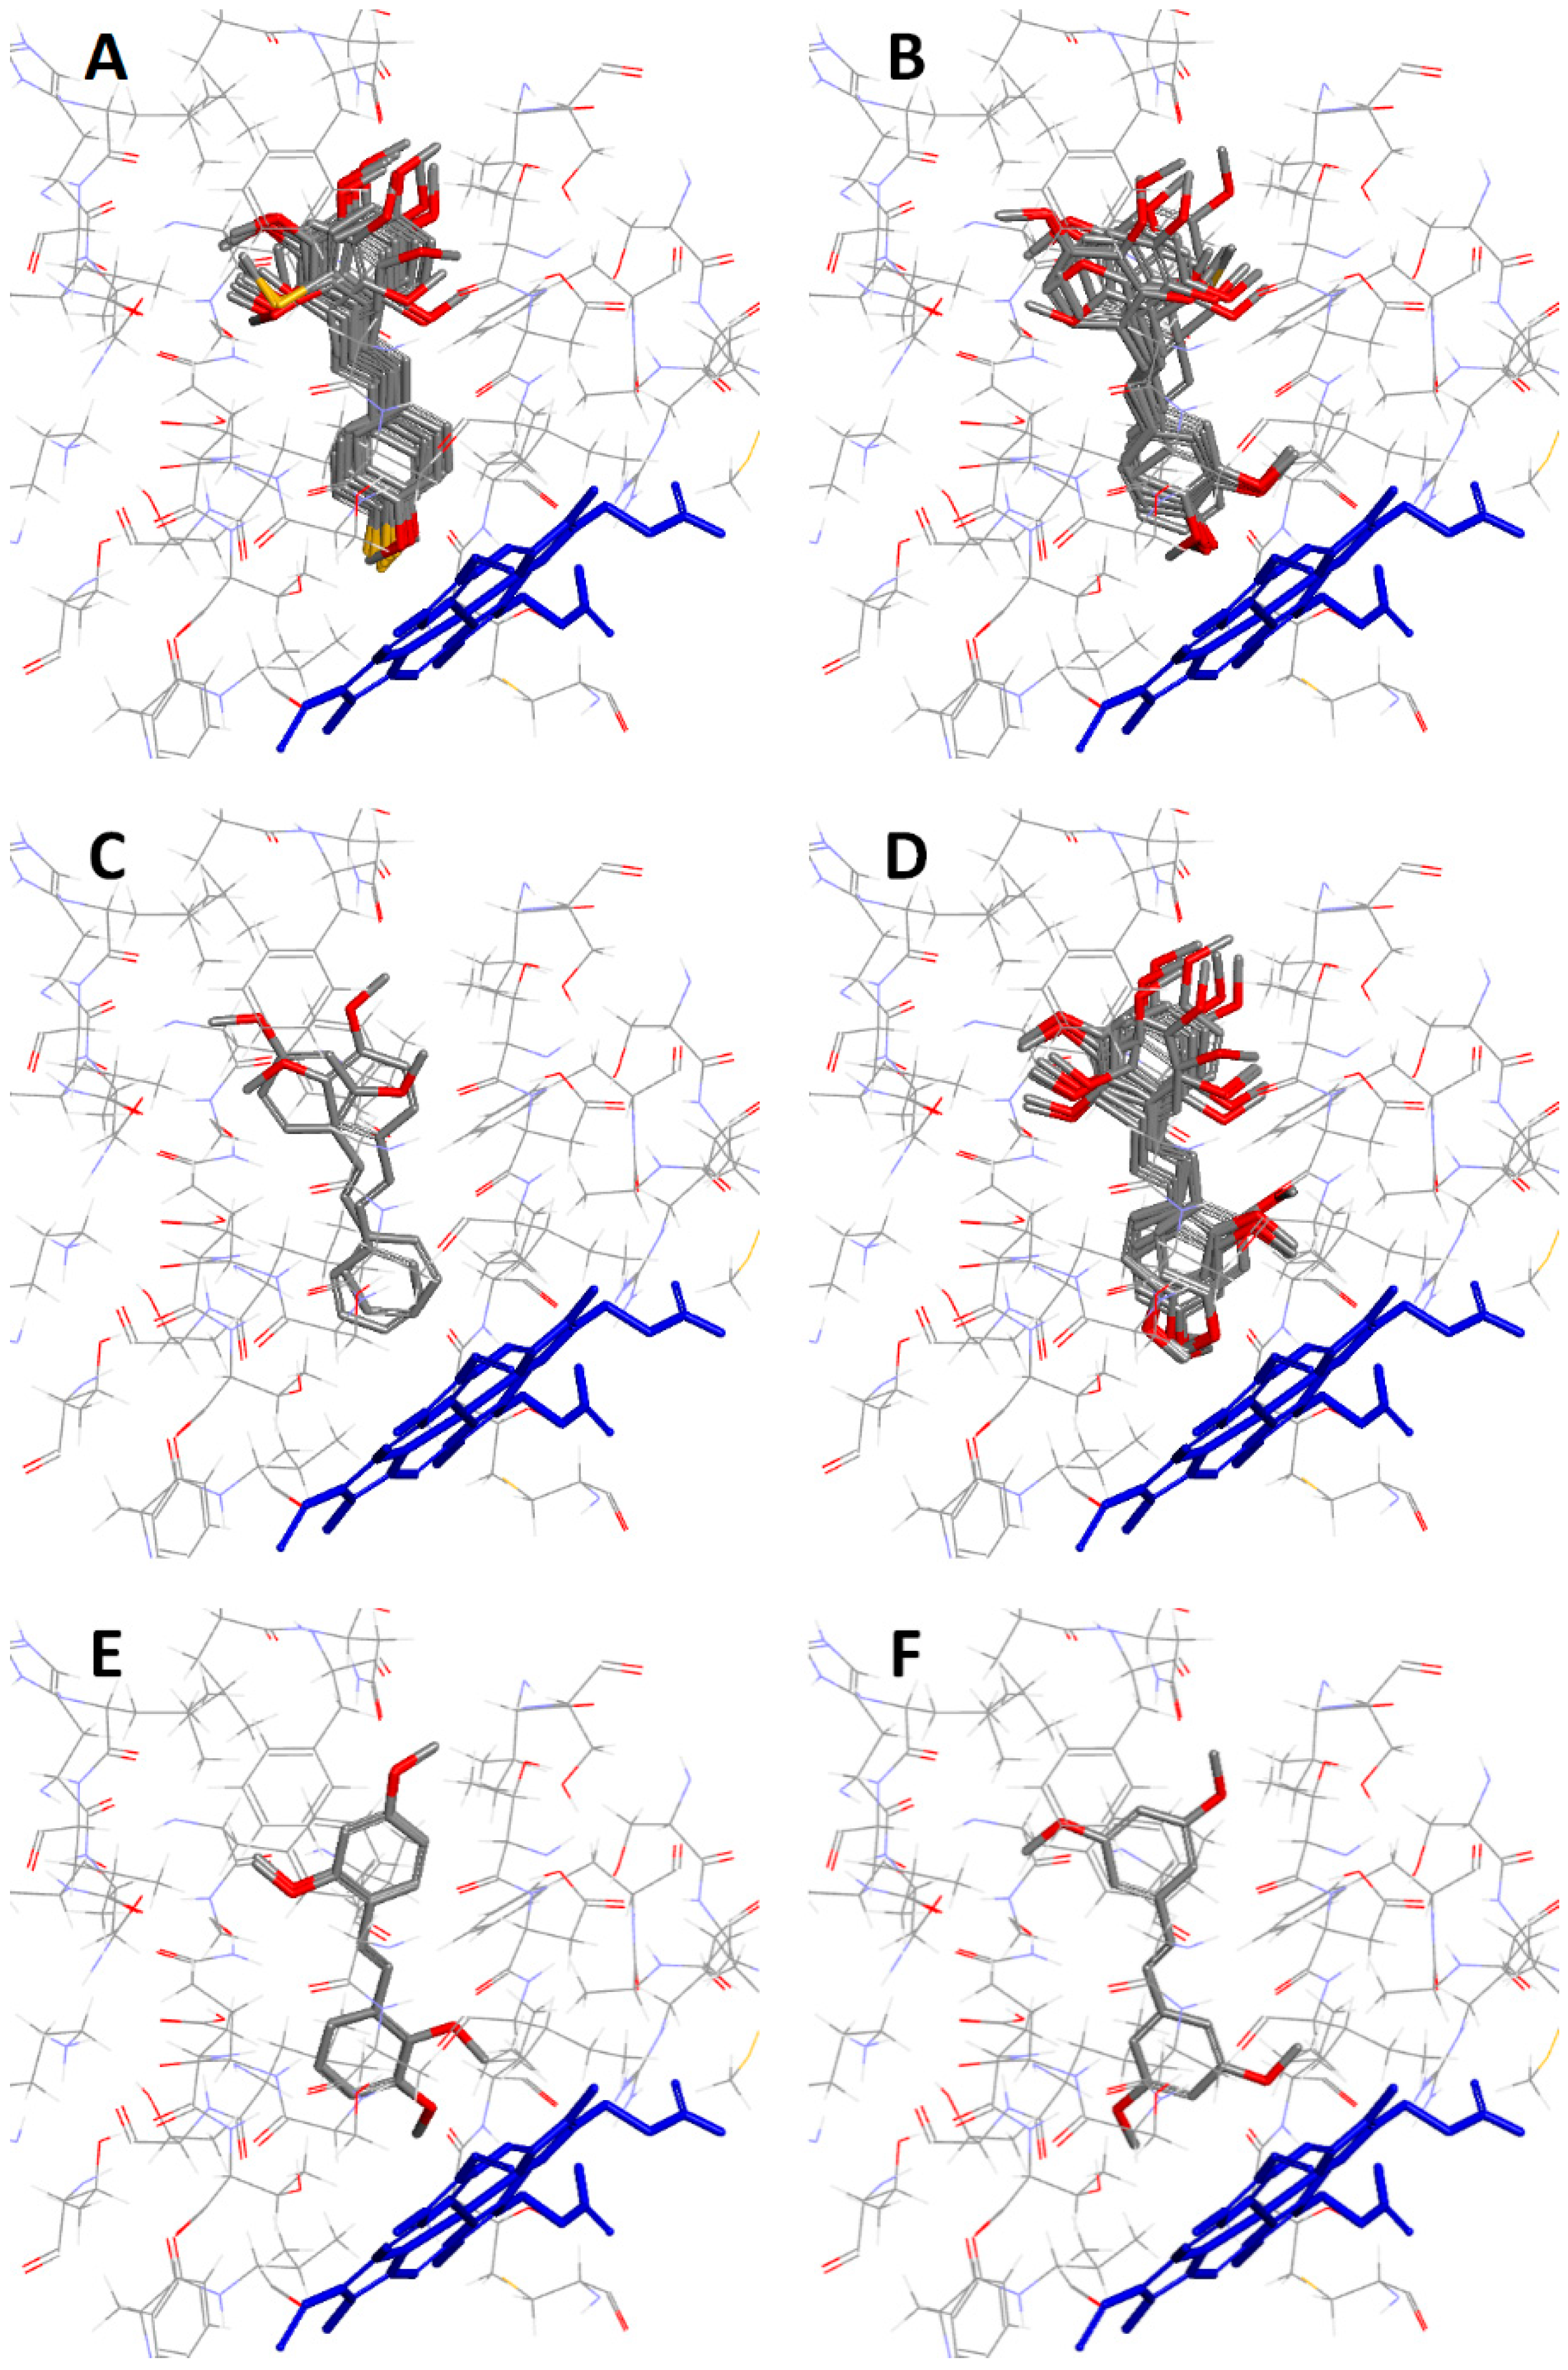
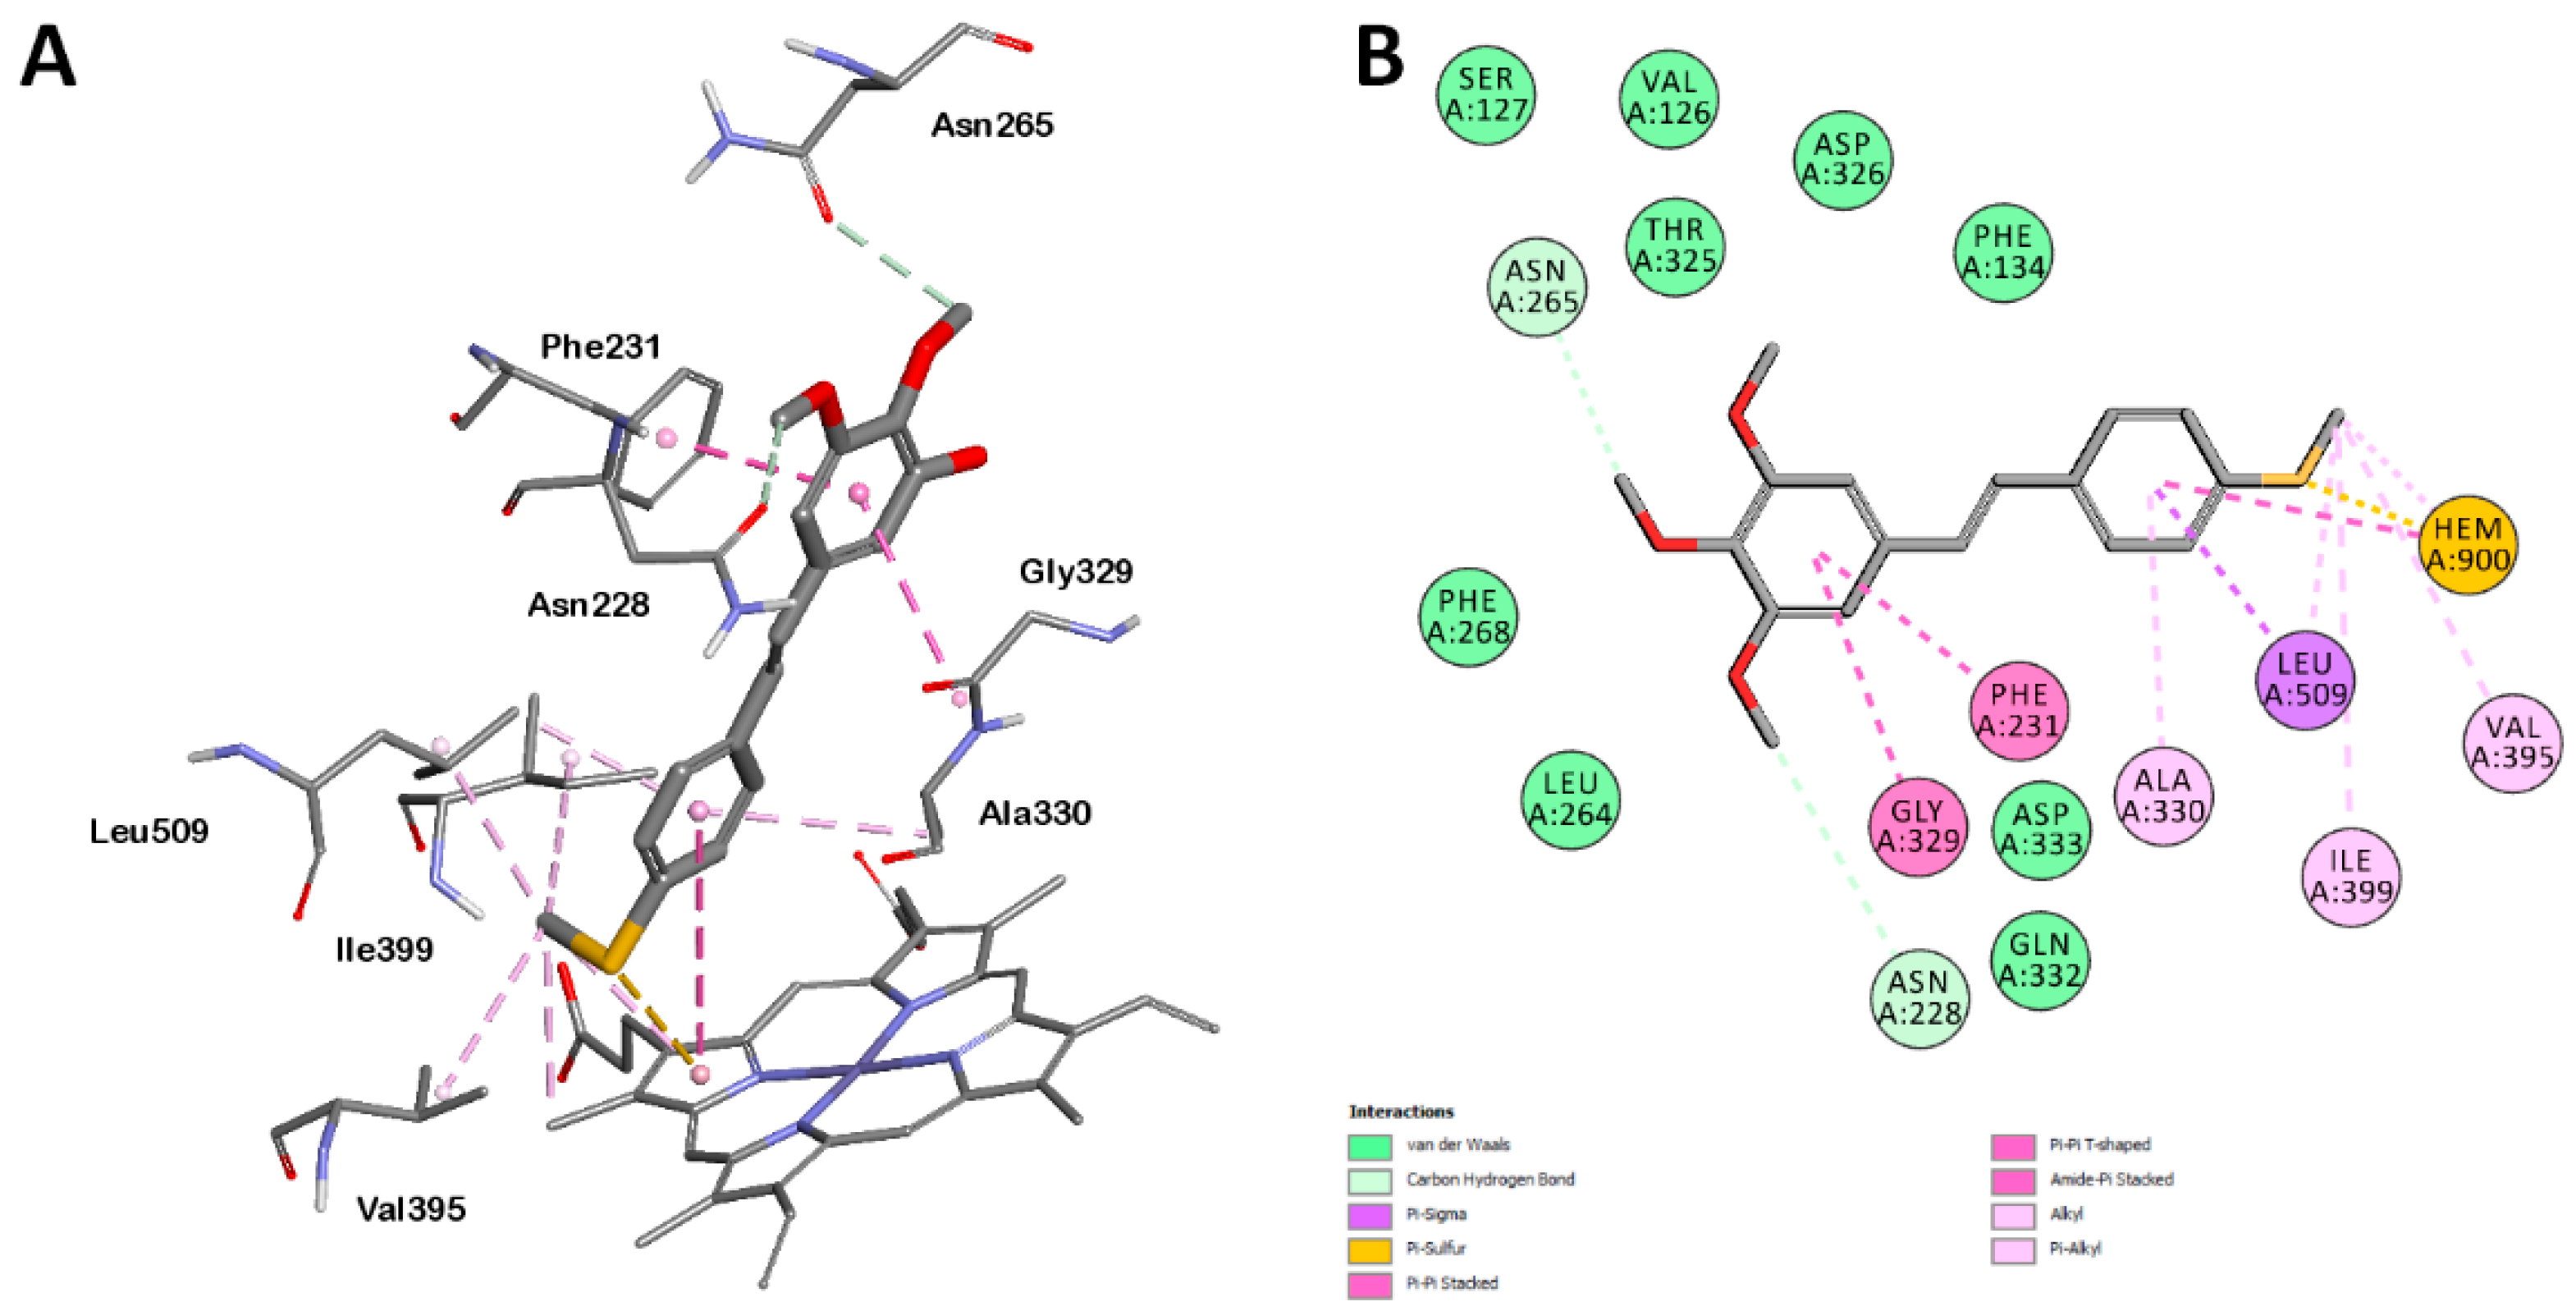
2.2.1. Orientation of Ligands in the Binding Site
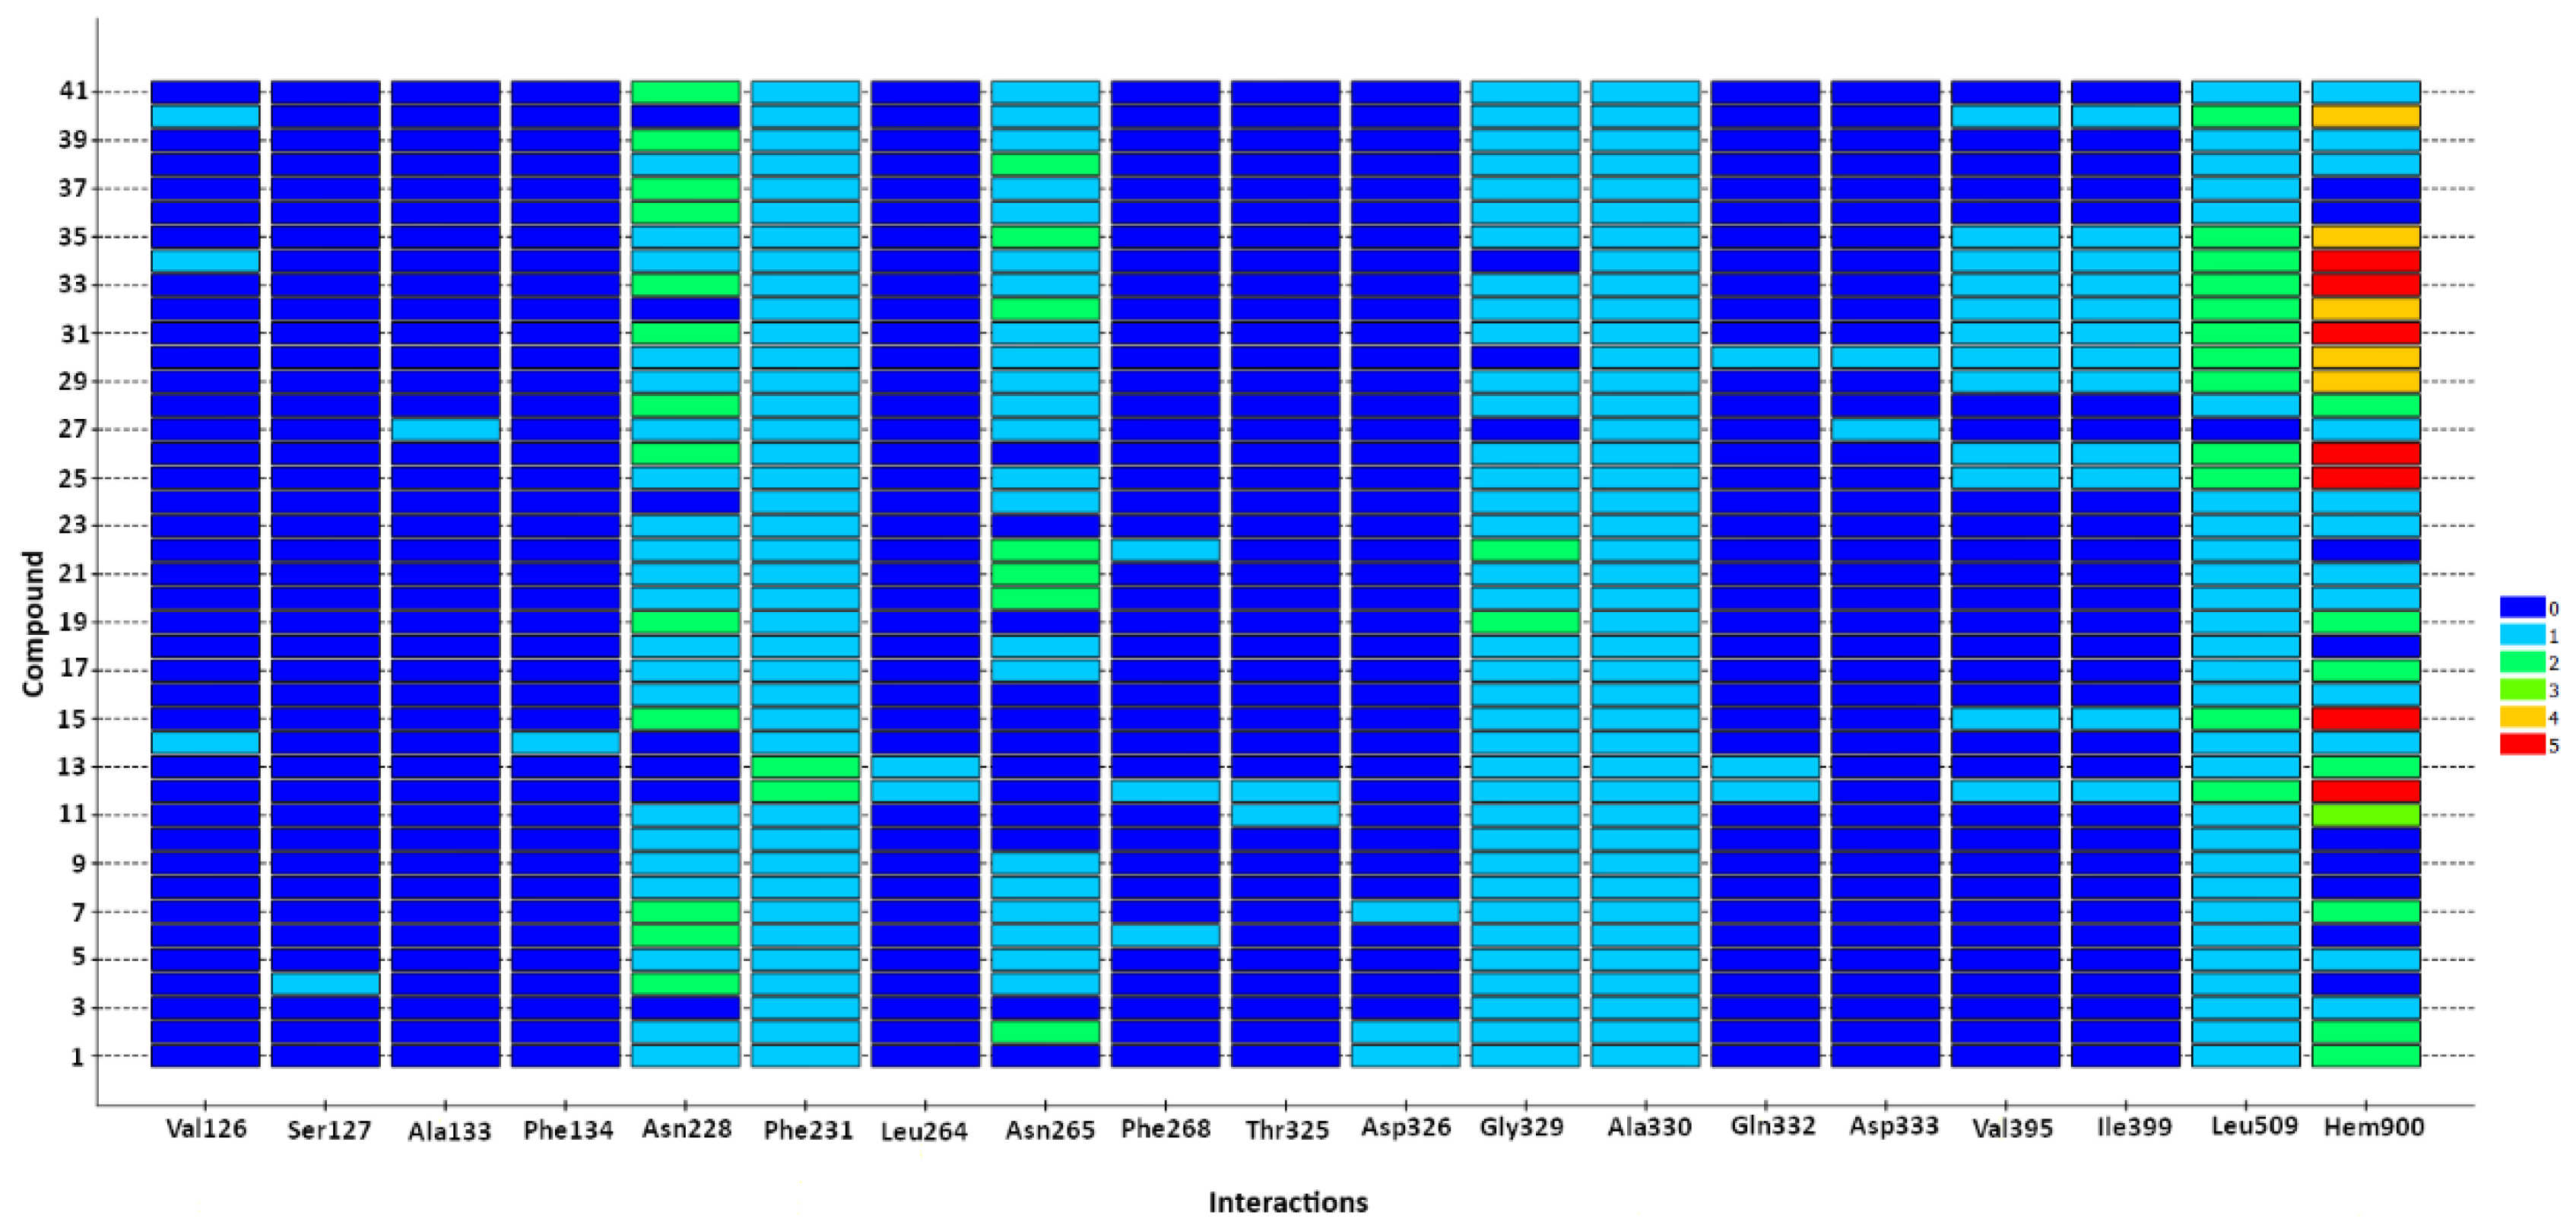
2.2.2. Protein–Ligand Interactions
3. Materials and Methods
3.1. Data Set
3.2. Molecular Docking
3.3. 3D-QSAR Modeling
4. Conclusions
Supplementary Materials
Author Contributions
Funding
Institutional Review Board Statement
Informed Consent Statement
Data Availability Statement
Conflicts of Interest
References
- Li, Y.; Cui, J.; Jia, J. The Activation of Procarcinogens by CYP1A1/1B1 and Related Chemo-Preventive Agents: A Review. Curr. Cancer Drug Targets 2021, 21, 21–54. [Google Scholar] [CrossRef] [PubMed]
- Hayes, C.L.; Spink, D.C.; Spink, B.C.; Cao, J.Q.; Walker, N.J.; Sutter, T.R. 17 beta-estradiol hydroxylation catalyzed by human cytochrome P450 1B1. Proc. Natl. Acad. Sci. USA 1996, 93, 9776–9781. [Google Scholar] [CrossRef] [PubMed]
- Sun, L. Recent advances in the development of AhR antagonists. RSC Med. Chem. 2021, 12, 902–914. [Google Scholar] [CrossRef]
- Szaefer, H.; Licznerska, B.; Baer-Dubowska, W. The Aryl Hydrocarbon Receptor and Its Crosstalk: A Chemopreventive Target of Naturally Occurring and Modified Phytochemicals. Molecules 2024, 29, 4283. [Google Scholar] [CrossRef]
- Teka, T.; Zhang, L.; Ge, X.; Li, Y.; Han, L.; Yan, X. Stilbenes: Source plants, chemistry, biosynthesis, pharmacology, application and problems related to their clinical Application-A comprehensive review. Phytochemistry 2022, 197, 113128. [Google Scholar] [CrossRef]
- Brown, K.; Theofanous, D.; Britton, R.G.; Aburido, G.; Pepper, C.; Sri Undru, S.; Howells, L. Resveratrol for the Management of Human Health: How Far Have We Come? A Systematic Review of Resveratrol Clinical Trials to Highlight Gaps and Opportunities. Int. J. Mol. Sci. 2024, 25, 747. [Google Scholar] [CrossRef]
- Sirerol, J.A.; Rodríguez, M.L.; Mena, S.; Asensi, M.A.; Estrela, J.M.; Ortega, A.L. Role of Natural Stilbenes in the Prevention of Cancer. Oxidative Med. Cell. Longev. 2016, 2016, 3128951. [Google Scholar] [CrossRef]
- Mendonça, E.L.S.S.; Xavier, J.A.; Fragoso, M.B.T.; Silva, M.O.; Escodro, P.B.; Oliveira, A.C.M.; Tucci, P.; Saso, L.; Goulart, M.O.F. E-Stilbenes: General Chemical and Biological Aspects, Potential Pharmacological Activity Based on the Nrf2 Pathway. Pharmaceuticals 2024, 17, 232. [Google Scholar] [CrossRef]
- Lin, W.S.; Leland, J.V.; Ho, C.T.; Pan, M.H. Occurrence, Bioavailability, Anti-inflammatory, and Anticancer Effects of Pterostilbene. J. Agric. Food Chem. 2020, 68, 12788–12799. [Google Scholar] [CrossRef]
- Zhang, Y.; Li, Y.; Sun, C.; Chen, X.; Han, L.; Wang, T.; Liu, J.; Chen, X.; Zhao, D. Effect of Pterostilbene, a Natural Derivative of Resveratrol, in the Treatment of Colorectal Cancer through Top1/Tdp1-Mediated DNA Repair Pathway. Cancers 2021, 13, 4002. [Google Scholar] [CrossRef]
- Mikstacka, R.; Dutkiewicz, Z. New Perspectives of CYP1B1 Inhibitors in the Light of Molecular Studies. Processes 2021, 9, 817. [Google Scholar] [CrossRef]
- Sridhar, J.; Liu, J.; Foroozesh, M.; Stevens, C.L. Insights on cytochrome p450 enzymes and inhibitors obtained through QSAR studies. Molecules 2012, 17, 9283–9305. [Google Scholar] [CrossRef] [PubMed]
- Sridhar, J.; Goyal, N.; Liu, J.; Foroozesh, M. Review of Ligand Specificity Factors for CYP1A Subfamily Enzymes from Molecular Modeling Studies Reported to-Date. Molecules 2017, 22, 1143. [Google Scholar] [CrossRef] [PubMed]
- Dutkiewicz, Z.; Mikstacka, R. Structure-based drug design for cytochrome P450 family 1 inhibitors. Bioinorg. Chem. Appl. 2018, 2018, 3924608. [Google Scholar] [CrossRef]
- Alam, S.; Khan, F. 3D-QSAR, Docking, ADME/Tox studies on Flavone analogs reveal anticancer activity through Tankyrase inhibition. Sci. Rep. 2019, 9, 5414. [Google Scholar] [CrossRef]
- Dong, J.; Zhang, Q.; Cui, Q.; Huang, G.; Pan, X.; Li, S. Flavonoids and Naphthoflavonoids: Wider Roles in the Modulation of Cytochrome P450 Family 1 Enzymes. ChemMedChem 2016, 11, 2102–2118. [Google Scholar] [CrossRef]
- Wu, G.; Robertson, D.H.; Brooks, C.L., 3rd; Vieth, M. Detailed analysis of grid-based molecular docking: A case study of CDOCKER–A CHARMM-based MD docking algorithm. J. Comp. Chem. 2003, 24, 1549–1562. [Google Scholar] [CrossRef]
- Gonzalez, J.; Marchand-Geneste, N.; Giraudel, J.L.; Shimada, T. Docking and QSAR comparative studies of polycyclic aromatic hydrocarbons and other procarcinogen interactions with cytochromes P450 1A1 and 1B1, SAR and QSAR. Environ. Res. 2012, 23, 87–109. [Google Scholar] [CrossRef]
- Raju, B.; Sapra, B.; Silakari, O. 3D-QSAR assisted identification of selective CYP1B1 inhibitors: An effective bioisosteric replacement/molecular docking/electrostatic complementarity analysis. Mol. Divers. 2023, 27, 2673–2693. [Google Scholar] [CrossRef]
- Dong, J.; Wang, Z.; Cui, J.; Meng, Q.; Li, S. Synthesis and structure-activity relationship studies of α-naphthoflavone derivatives as CYP1B1 inhibitors. Eur. J. Med. Chem. 2020, 187, 111938. [Google Scholar] [CrossRef]
- Piekuś-Słomka, N.; Zapadka, M.; Kupcewicz, B. Methoxy and methylthio-substituted trans-stilbene derivatives as CYP1B1 inhibitors—QSAR study with detailed interpretation of molecular descriptors. Arab. J. Chem. 2022, 15, 104204. [Google Scholar] [CrossRef]
- Raju, B.; Narendra, G.; Verma, H.; Kumar, M.; Sapra, B.; Kaur, G.; Jain, S.K.; Sandeep Chary, P.; Mehra, N.K.; Silakari, O. Scaffold hopping for designing of potent and selective CYP1B1 inhibitors to overcome docetaxel resistance: Synthesis and evaluation. J. Biomol. Struct. Dyn. 2024, 1–19. [Google Scholar] [CrossRef] [PubMed]
- Lei, Z.-N.; Tian, Q.; Teng, Q.-X.; Wurpel, J.N.D.; Zeng, L.; Pan, Y.; Chen, Z.-S. Understanding and targeting resistance mechanisms in Cancer. MedComm 2023, 4, e265. [Google Scholar] [CrossRef]
- Rochat, B.; Morsman, J.M.; Murray, G.I.; Figg, W.D.; McLeod, H.L. Human CYP1B1 and anticancer agent metabolism: Mechanism for tumor-specific drug inactivation? J. Pharmacol. Exp. Ther. 2001, 296, 537–541. [Google Scholar] [CrossRef]
- McFadyen, M.C.; Murray, G.I. Cytochrome P450 1B1: A novel anticancer therapeutic target. Future Oncol. 2005, 1, 259–263. [Google Scholar] [CrossRef]
- Norouzi-Barough, L.; Sarookhani, M.R.; Sharifi, M.; Moghbelinejad, S.; Jangjoo, S.; Salehi, R. Molecular mechanisms of drug resistance in ovarian cancer. J. Cell. Physiol. 2018, 233, 4546–4562. [Google Scholar] [CrossRef]
- Yada, E.; Kasajima, R.; Niida, A.; Imoto, S.; Miyano, S.; Miyagi, Y.; Sasada, T.; Wada, S. Possible role of cytochrome P450 1B1 in the mechanism of gemcitabine resistance in pancreatic cancer. Biomedicines 2021, 9, 1396. [Google Scholar] [CrossRef]
- Murray, G.I.; Taylor, M.C.; McFadyen, M.C.; McKay, J.A.; Greenlee, W.F.; Burke, M.D.; Melvin, W.T. Tumor-specific expression of cytochrome P450 CYP1B1. Cancer Res. 1997, 57, 3026–3031. [Google Scholar]
- Kim, S.; Ko, H.; Park, J.E.; Jung, S.; Lee, S.K.; Chun, Y.J. Design, synthesis, and discovery of novel trans-stilbene analogues as potent and selective human cytochrome P450 1B1 inhibitors. J. Med. Chem. 2002, 45, 160–164. [Google Scholar] [CrossRef]
- Chun, Y.J.; Lim, C.; Ohk, S.O.; Lee, J.M.; Lee, J.H.; Choi, S.; Kim, S. trans-Stilbenoids: Potent and selective inhibitors for human cytochrome P450 1B1. Med. Chem. Commun. 2011, 2, 402–405. [Google Scholar] [CrossRef]
- Mikstacka, R.; Rimando, A.M.; Dutkiewicz, Z.; Stefański, T.; Sobiak, S. Design, synthesis and evaluation of the inhibitory selectivity of novel trans-resveratrol analogues on human recombinant CYP1A1, CYP1A2 and CYP1B1. Bioorg. Med. Chem. 2012, 20, 5117–5126. [Google Scholar] [CrossRef] [PubMed]
- Mikstacka, R.; Wierzchowski, M.; Dutkiewicz, Z.; Gielara-Korzańska, A.; Korzański, A.; Teubert, A.; Sobiak, S.; Baer-Dubowska, W. 3,4,20-Trimethoxy-trans-stilbene—A potent CYP1B1 inhibitor. Med. Chem. Commun. 2014, 5, 496–501. [Google Scholar] [CrossRef]
- Wierzchowski, M.; Dutkiewicz, Z.; Gielara-Korzańska, A.; Korzański, A.; Teubert, A.; Teżyk, A.; Stefański, T.; Baer-Dubowska, W.; Mikstacka, R. Synthesis, biological evaluation and docking studies of trans-stilbene methylthio derivatives as cytochromes P450 family 1 inhibitors. Chem. Biol. Drug Des. 2017, 90, 1226–1236. [Google Scholar] [CrossRef] [PubMed]
- Golbraikh, A.; Tropsha, A. Beware of q2! J. Mol. Graph. 2002, 20, 269–276. [Google Scholar] [CrossRef]
- Golbraikh, A.; Shen, M.; Xiao, Z.Y.; Xiao, Y.D.; Lee, K.H.; Tropsha, A. Rational selection of training and test sets for the development of validated QSAR models. J. Comput. Aid. Mol. Des. 2003, 17, 241–253. [Google Scholar] [CrossRef]
- Roy, K. On Some Aspects of Validation of Predictive Quantitative Structure–Activity Relationship Models. Expert Opin. Drug Discov. 2007, 2, 1567–1577. [Google Scholar] [CrossRef]
- Roy, P.P.; Roy, K. On Some Aspects of Variable Selection for Partial Least Squares Regression Models. QSAR Comb. Sci. 2008, 27, 302–313. [Google Scholar] [CrossRef]
- Roy, P.P.; Paul, S.; Mitra, I.; Roy, K. On Two Novel Parameters for Validation of Predictive QSAR Models. Molecules 2009, 14, 1660–1701. [Google Scholar] [CrossRef]
- Negishi, M.; Uno, T.; Darden, T.A.; Sueyoshi, T.; Pedersen, L.G. Structural flexibility and functional versatility of mammalian P450 enzymes. FASEB J. 1996, 10, 683–689. [Google Scholar] [CrossRef]
- Pochapsky, T.C.; Kazanis, S.; Dang, M. Conformational plasticity and structure/function relationships in cytochromes P450. Antioxid. Redox Signal. 2010, 13, 1273–1296. [Google Scholar] [CrossRef]
- Poulos, T.L. Cytochrome P450 flexibility. Proc. Natl. Acad. Sci. USA 2003, 100, 13121–13122. [Google Scholar] [CrossRef] [PubMed]
- Li, J.; Zhou, Y.; Tang, Y.; Li, W.; Tu, Y. Dissecting the Structural Plasticity and Dynamics of Cytochrome P450 2B4 by Molecular Dynamics Simulations. J. Chem. Inf. Model. 2020, 60, 5026–5035. [Google Scholar] [CrossRef]
- Dutkiewicz, Z.; Mikstacka, R. Hydration and Structural Adaptations of the Human CYP1A1, CYP1A2, and CYP1B1 Active Sites by Molecular Dynamics Simulations. Int. J. Mol. Sci. 2023, 24, 11481. [Google Scholar] [CrossRef]
- Jaworska, J.; Nikolova-Jeliazkova, N.; Aldenberg, T. QSAR applicabilty domain estimation by projection of the training set descriptor space: A review. Altern. Lab. Anim. ATLA 2005, 33, 445–459. [Google Scholar] [CrossRef] [PubMed]
- Gramatica, P. Principles of QSAR models validation: Internal and external. QSAR Comb. Sci. 2007, 26, 694–701. [Google Scholar] [CrossRef]
- BIOVIA; Dassault Systèmes. Discovery Studio Release 2016; Dassault Systèmes: San Diego, CA, USA, 2016. [Google Scholar]

| Cmpd | Structure | IC50 (nM) | pIC50 (exp) | pIC50 (pred) | Residual |
|---|---|---|---|---|---|
| 1 | 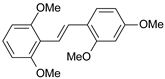 | 2 | 8.699 | 8.906 | −0.207 |
| 2 | 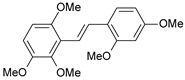 | 3 | 8.523 | 8.555 | −0.032 |
| 3 | 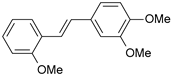 | 4 | 8.398 | 8.287 | 0.111 |
| 4 | 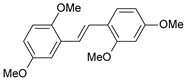 | 4 | 8.398 | 7.989 | 0.409 |
| 5 |  | 5 | 8.301 | 8.201 | 0.100 |
| 6 | 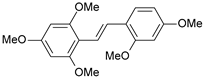 | 5 | 8.301 | 8.293 | 0.008 |
| 7 | 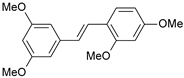 | 6 | 8.222 | 8.183 | 0.039 |
| 8 | 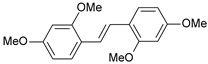 | 9 | 8.046 | 7.879 | 0.167 |
| 9 | 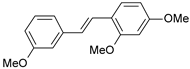 | 15 | 7.824 | 7.578 | 0.246 |
| 10 | 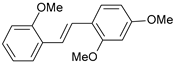 | 16 | 7.796 | 7.831 | −0.035 |
| 11 | 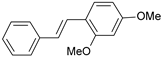 | 25 | 7.602 | 7.790 | −0.188 |
| 12 | 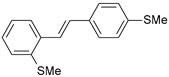 | 26 | 7.585 | 6.962 | 0.623 |
| 13 |  | 28 | 7.553 | 7.450 | 0.103 |
| 14 | 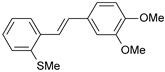 | 29 | 7.538 | 7.876 | −0.338 |
| 15 |  | 34 | 7.469 | 7.243 | 0.226 |
| 16 | 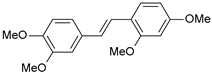 | 42 | 7.377 | 7.440 | −0.063 |
| 17 | 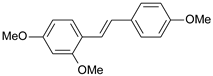 | 58 | 7.237 | 7.165 | 0.073 |
| 18 | 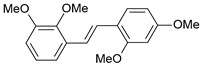 | 60 | 7.222 | 7.582 | −0.360 |
| 19 | 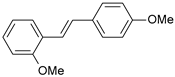 | 66 | 7.180 | 7.451 | −0.271 |
| 20 | 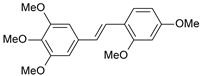 | 71 | 7.149 | 6.971 | 0.178 |
| 21 |  | 300 | 6.523 | 6.484 | 0.039 |
| 22 | 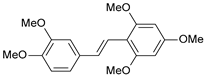 | 300 | 6.523 | 6.294 | 0.229 |
| 23 | 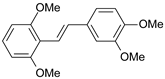 | 310 | 6.509 | 7.119 | −0.610 |
| 24 |  | 370 | 6.432 | 6.197 | 0.235 |
| 25 |  | 500 | 6.301 | 6.467 | −0.166 |
| 26 |  | 500 | 6.301 | 6.409 | −0.108 |
| 27 |  | 620 | 6.208 | 6.281 | −0.073 |
| 28 |  | 790 | 6.102 | 6.272 | −0.169 |
| 29 | 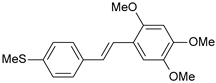 | 900 | 6.046 | 6.147 | −0.101 |
| 30 | 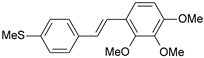 | 1000 | 6.000 | 6.036 | −0.036 |
| 31 | 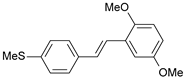 | 1100 | 5.959 | 6.234 | −0.275 |
| 32 | 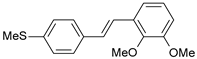 | 1100 | 5.959 | 6.068 | −0.109 |
| 33 |  | 1500 | 5.824 | 6.062 | −0.238 |
| 34 | 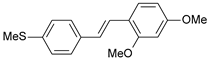 | 2000 | 5.699 | 5.873 | −0.174 |
| 35 | 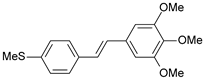 | 2600 | 5.585 | 5.657 | −0.072 |
| 36 | 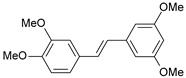 | 3000 | 5.523 | 5.405 | 0.118 |
| 37 | 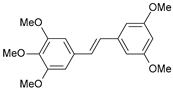 | 3200 | 5.495 | 5.172 | 0.323 |
| 38 | 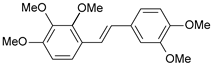 | 4170 | 5.380 | 5.353 | 0.027 |
| 39 | 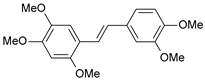 | 4440 | 5.353 | 5.432 | −0.079 |
| 40 | 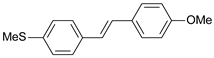 | 5500 | 5.260 | 5.270 | −0.010 |
| 41 | 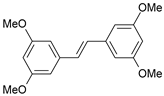 | 17,600 | 4.754 | 4.617 | 0.137 |
| Parameter | 3D-QSAR Model | Threshold Value |
|---|---|---|
| 0.554 | >0.5 | |
| 0.808 | >0.6 | |
| 0.801 | ||
| 0.795 | ||
| 0.009 | <0.1 | |
| 0.016 | <0.1 | |
| 0.007 | <0.3 | |
| 0.993 | ≤ 1.15 | |
| 1.005 | ≤ 1.15 | |
| 0.741 | >0.5 | |
| 0.717 | >0.5 |
Disclaimer/Publisher’s Note: The statements, opinions and data contained in all publications are solely those of the individual author(s) and contributor(s) and not of MDPI and/or the editor(s). MDPI and/or the editor(s) disclaim responsibility for any injury to people or property resulting from any ideas, methods, instructions or products referred to in the content. |
© 2025 by the authors. Licensee MDPI, Basel, Switzerland. This article is an open access article distributed under the terms and conditions of the Creative Commons Attribution (CC BY) license (https://creativecommons.org/licenses/by/4.0/).
Share and Cite
Dutkiewicz, Z.; Mikstacka, R. Molecular Docking Study and 3D-QSAR Model for Trans-Stilbene Derivatives as Ligands of CYP1B1. Int. J. Mol. Sci. 2025, 26, 1002. https://doi.org/10.3390/ijms26031002
Dutkiewicz Z, Mikstacka R. Molecular Docking Study and 3D-QSAR Model for Trans-Stilbene Derivatives as Ligands of CYP1B1. International Journal of Molecular Sciences. 2025; 26(3):1002. https://doi.org/10.3390/ijms26031002
Chicago/Turabian StyleDutkiewicz, Zbigniew, and Renata Mikstacka. 2025. "Molecular Docking Study and 3D-QSAR Model for Trans-Stilbene Derivatives as Ligands of CYP1B1" International Journal of Molecular Sciences 26, no. 3: 1002. https://doi.org/10.3390/ijms26031002
APA StyleDutkiewicz, Z., & Mikstacka, R. (2025). Molecular Docking Study and 3D-QSAR Model for Trans-Stilbene Derivatives as Ligands of CYP1B1. International Journal of Molecular Sciences, 26(3), 1002. https://doi.org/10.3390/ijms26031002