Article

Characterization of Terpenoids in Aromatic Plants Using Raman Spectroscopy and Gas Chromatography–Mass Spectrometry (GC–MS)

by
Milagros Granda-Santos
1,2,3,
Katherine Reyna-Gonzales
2,
Llisela Torrejón-Valqui
2,
Marvin G. Valle-Epquín
2,
Aline C. Caetano
3,
Jorge R. Díaz-Valderrama
3,
Efraín M. Castro-Alayo
2,
Ilse S. Cayo-Colca
1,
Jorge L. Maicelo
4 and
César R. Balcázar-Zumaeta
2,*
1
Programa Doctoral en Ciencias para el Desarrollo Sustentable, Escuela de Posgrado, Universidad Nacional Toribio Rodríguez de Mendoza de Amazonas, Chachapoyas 01001, Peru
2
Instituto de Investigación, Innovación y Desarrollo para el Sector Agrario y Agroindustrial (IIDAA), Facultad de Ingeniería y Ciencias Agrarias, Universidad Nacional Toribio Rodríguez de Mendoza de Amazonas, Chachapoyas 01001, Peru
3
Instituto de Investigación para el Desarrollo Sustentable de Ceja de Selva, Universidad Nacional Toribio Rodríguez de Mendoza de Amazonas, Calle Universitaria N° 304, Chachapoyas 01001, Peru
4
Facultad de Ingeniería Zootecnista, Biotecnología, Agronegocios y Ciencia de Datos, Universidad Nacional Toribio Rodríguez de Mendoza de Amazonas, Chachapoyas 01001, Peru
*
Author to whom correspondence should be addressed.
Int. J. Mol. Sci. 2025, 26(23), 11254; https://doi.org/10.3390/ijms262311254
Submission received: 22 October 2025 / Revised: 13 November 2025 / Accepted: 18 November 2025 / Published: 21 November 2025
(This article belongs to the Special Issue Molecular Insight into Plant Bioactive Compounds)

Abstract

The study characterized the essential oils of eight aromatic medicinal plants (Tagetes filifolia, Aloysia citrodora, Cymbopogon citratus, Eucalyptus globulus, Chamaemelum nobile, Piper aduncum, Minthostachys mollis, and Rosmarinus officinalis) using Raman spectroscopy and gas chromatography–mass spectrometry (GC–MS). Raman spectra allowed the identification of bands associated with C–H, C=C, C–O, and C=O bonds, evidencing the presence of monoterpenes, sesquiterpenes, and oxygenated compounds. GC–MS analysis confirmed these results, detecting 224 compounds, predominantly terpenoids. Among the major compounds, cis,cis-nepetalactone (30.16%), β-caryophyllene (up to 18.26%), citronellol (10.92%), citral, and linalool were found. The combination of both techniques made it possible to relate the chemical composition to the molecular structure. This showed that the differences between species are mainly due to the proportion of oxygenated compounds (citral, linalool, geraniol) compared with aromatic hydrocarbons (β-caryophyllene, D-limonene, β-pinene). Additionally, the presence of cis,cis-nepetalactone in M. mollis was reported for the first time, representing a significant chemical finding.

1. Introduction

Currently, the food, pharmaceutical, and cosmetic industries show a growing interest in the use of natural compounds, driven by the demand for safer, more sustainable products with proven bioactive properties [1,2]. In this context, aromatic and medicinal plants represent a direct source of essential oils—volatile mixtures mainly composed of terpenoids, phenylpropanoids, aldehydes, and ketones—whose composition determines their biological activity [3,4]. These oils, obtained from leaves and stems through steam distillation, exhibit antimicrobial, antioxidant, anti-inflammatory, and insecticidal activities derived from the combined action of their secondary metabolites [5,6].
Several aromatic species cultivated between 2500 and 3500 m above sea level (a.s.l.), such as Tagetes filifolia (anise), Aloysia citrodora (lemon verbena), Cymbopogon citratus (lemongrass), Eucalyptus globulus (eucalyptus), Piper aduncum (matico), Minthostachys mollis (poleo), Chamaemelum nobile (chamomile), and Rosmarinus officinalis (rosemary), contain essential oils with specific chemical compositions dominated by monoterpenes, sesquiterpenes, and oxygenated compounds associated with their biological effects [7,8,9]. In addition, these species are traditionally used in folk medicine and gastronomy for their digestive, sedative, and anti-inflammatory properties, as well as for their ability to modify the aroma and flavor of foods [10,11,12,13,14,15].
The chemical characterization of these oils is essential to understand the relationship between their chemical composition and bioactive properties. A detailed analysis of the metabolites present in different species allows the identification of variations in chemical profiles that reflect genetic, environmental, and methodological differences, providing a framework for studying chemical diversity and its biological effects [16,17]. For chemical characterization, several complementary techniques have been employed, as recently reported in studies on essential oils, including confocal Raman spectroscopy [18], Ultra-high-performance liquid chromatography (UHPLC) [19], gas chromatography–mass spectrometry (GC–MS) [20], Fourier-transform infrared spectroscopy (FTIR) [21] and nuclear magnetic resonance (NMR) [22]. Confocal Raman spectroscopy is a rapid, non-destructive technique that provides direct spectral information relative to aromatic rings, enabling the identification of characteristic compounds such as terpenes, phenols, and others [23]. Likewise, GC–MS is used to identify and quantify volatile compounds, allowing the verification of results obtained through Raman spectroscopy [24,25,26,27]. The integration of both techniques therefore provides a more comprehensive view of the chemical composition, as Raman spectroscopy offers structural information that can be confirmed by GC–MS, which reveals the identity and relative abundance of the components [28,29]. This dual analytical approach enhances the robustness of chemical characterization by integrating information on compound identity, abundance, and structural features within essential oils. Moreover, it enables the establishment of correlations between chemical composition and the bioactive properties of the food matrix [29,30].
In this context, the present study aimed to characterize the chemical and structural composition of essential oils obtained from eight aromatic medicinal plants using Raman spectroscopy and GC–MS analyses. These techniques were complemented by multivariate analyses to group the predominant terpenoids according to the compounds shared among species, which are previously known for their medical, cosmetic, and industrial relevance.

2. Results and Discussion

2.1. Analysis of Raman Spectral Data

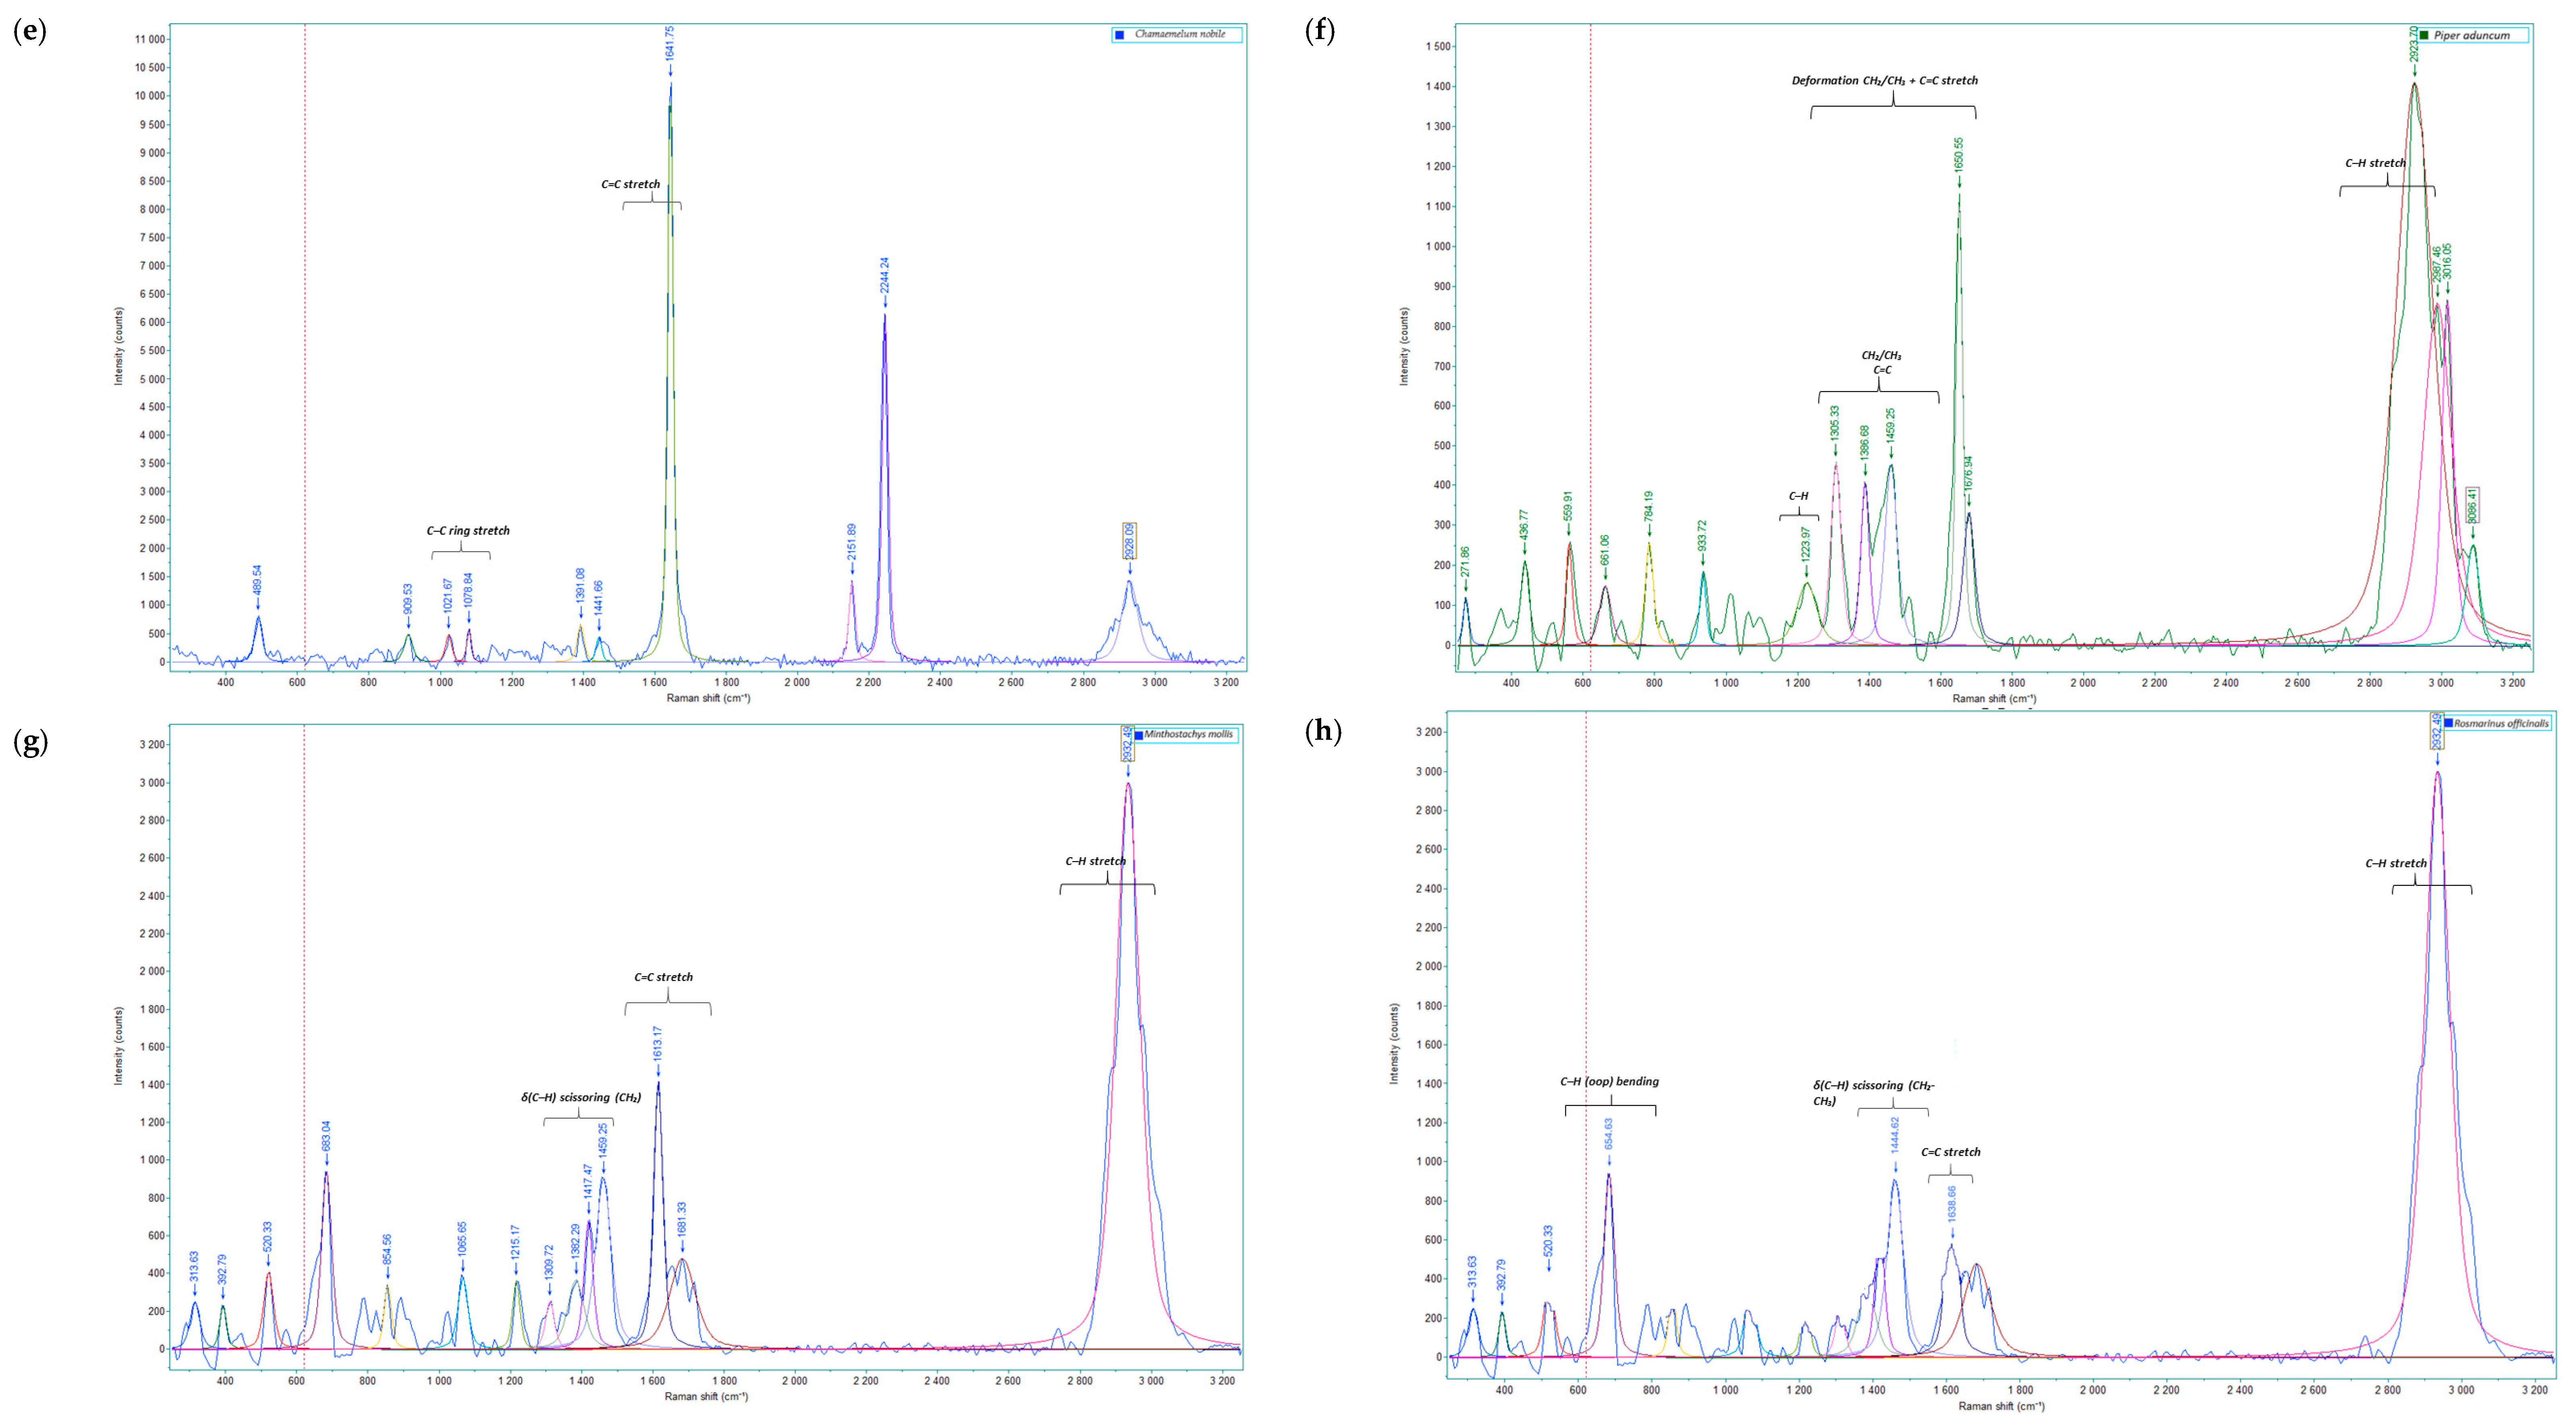
Raman spectroscopic analysis allowed the identification of the main vibrational bands associated with the predominant compounds present in the EO of T. filifolia, A. citrodora, E. globulus, C. citratus, C. nobile, P. aduncum, M. mollis, and R. officinalis (Figure 1 and Figure S2). The observed signals, reported here for the first time, reflected vibrational modes characteristic of C–H, C=C, C–O, and C=O bonds, which are linked to aromatic, olefinic, and functional structures typical of terpenoids, phenylpropanoids, and oxygenated compounds [5,31,32].
Raman bands identified in each essential oil are reported, aiming to associate the observed peaks with the functional groups and predominant metabolites of each species. In the essential oil of T. filifolia, vibrational modes were identified between 641 and 1656 cm−1. Signals in the 647–854 cm−1 range corresponded to out-of-plane C–H bending in cyclic rings, primarily associated with monoterpenes [24,33]. Vibrations between 1186 and 1318.5 cm−1 were assigned to C–H and C–O stretching, typical of esters, ketones, and aromatic phenols, and are linked to the presence of oxygenated phenylpropanoids [34]. Finally, bands in the 1609–1670 cm−1 range corresponded to C=C and C–H stretching, reflecting oxygenated aromatic compounds [21,27,35].
The essential oil of A. citrodora exhibited bands between 242 and 2916 cm−1. Signals below 750 cm−1 were associated with carbon skeleton deformations and out-of-plane C–H vibrations. C–O vibrations, typical of acyclic terpenic alcohols, were observed between 809 and 1154 cm−1, confirming the presence of oxygenated compounds in the oil [36,37]. Between 1310 and 1460 cm−1, C–O and CH2/CH3 deformations were observed, while bands at 1638–1680 cm−1 corresponded to C=C stretching of unsaturated compounds [34]. The high-intensity band at 2920–1930 cm−1 reflected C–H stretching vibrations associated with oxygenated monoterpenes, particularly alcohols or phenolic derivatives [36,37].
The essential oil of E. globulus showed peaks in the range of 550 to 2971 cm−1. Bands between 550 and 815 cm−1 were attributed to ring bending and out-of-plane C–H deformations characteristic of monocyclic terpenoids. Between 1170 and 1318 cm−1, C–H deformations of aromatic compounds were identified, whereas the band at 1457.05 cm−1 represented CH2/CH3 bending associated with aliphatic groups present in hydrocarbons and terpenoids. Finally, the signal at 2936.8 cm−1 corresponded to C-H stretching of unsaturated compounds such as alkenes and aromatic structures [23,33,38].
In the essential oil of C. citratus, bands between 1100 and 1340 cm−1 were related to symmetric CH3 deformations and C–C stretching (terpenic compounds), while bands at 1632–1681 cm−1 corresponded to C=C stretching of unsaturated aldehydes (citral isomers) [39,40]. The signal at 2928 cm−1 reflected C–H stretching, indicating the presence of conjugated aldehydes typical of monoterpenes or oxygenated phenylpropanoids, contributing to the citrus aroma and antioxidant capacity [41,42]. These signals are consistent with profiles reported for Cymbopogon oils with a citral-dominant profile [43].
In the essential oil of C. nobile, the band at 477.3 cm−1 was assigned to carbon skeleton bending modes, characteristic of cyclic and terpenic structures. Signals at 1021.7 and 1078.84 cm−1 corresponded to C–C stretching of the ring, indicating the presence of aromatic and cyclic rings typical of oxygenated monoterpenes and sesquiterpenes [44]. The C=C stretching at 1641.75 cm−1 indicated the presence of conjugated double bonds typical of aromatic sesquiterpenes. Finally, the peak at 2928.09 cm−1 corresponded to C-H stretching, consistent with oxygenated terpenoids [45].
The essential oil of P. aduncum exhibited bands between 262 and 770 cm−1, corresponding to carbon skeleton bending, and between 1294 and 1460 cm−1, associated with olefinic CH3 deformations. Between 1500 and 1600 cm−1, bending vibrations of CH2 and CH3 groups (δCH2/CH3) and C=C stretching were observed, corresponding to cyclic and unsaturated monoterpenes as well as oxygenated phenylpropanoids [45]. High-frequency bands at 1650.6, 2923.7, and 2987.4 cm−1 were attributed to C=C and aliphatic C–H stretching vibrations, which are characteristic of monoterpenes and sesquiterpenes. These signals, indicate the presence of oxygenated and unsaturated compounds typically found in this essential oil [46].
The essential oil of M. mollis was characterized by bands ranging from 303 to 2921 cm−1. Signals between 303 and 680 cm−1 were associated with ring deformations characteristic of α-pinene and limonene, while bands at 860 and 1065.65 cm−1 corresponded to out-of-plane C–H deformations and ν(C–C) + δ(C–H) stretching [47]. The band at 1309.72 cm−1 was assigned to C–O stretching, typical of alcohols, and the band at 1459.25 cm−1 was attributed to CH2 scissoring δ(C–H) [5]. Finally, signals at 2921 and 2940 cm−1 were assigned to aliphatic C–H stretching of cyclic monoterpenes, consistent with Raman profiles reported for essential oils of the genus Mentha [48].
The essential oil of R. officinalis exhibited peaks between 600 and 800 cm−1, attributed to ring deformations and out-of-plane C–H modes characteristic of cyclic monoterpenes such as α- and β-pinene, as well as 1,8-cineole [49,50]. Additionally, the signal at 1294.6 cm−1 was related to =CH wagging typical of olefinic bonds, while the band at 1378.9 cm−1 corresponded to CH2/CH3 bending associated with aliphatic chains of monoterpenes. The band at 1444.6 cm−1 was assigned to δ(C–H), also linked to the aliphatic skeleton. The band at 1638.7 cm−1 was attributed to C=C stretching, and the band at 2932.5 cm−1 to C–H stretching (double bond), both indicative of unsaturated structures characteristic of monoterpenes and sesquiterpenes present in the essential oil [50,51,52].

2.2. Multivariate Analysis of Raman Spectra

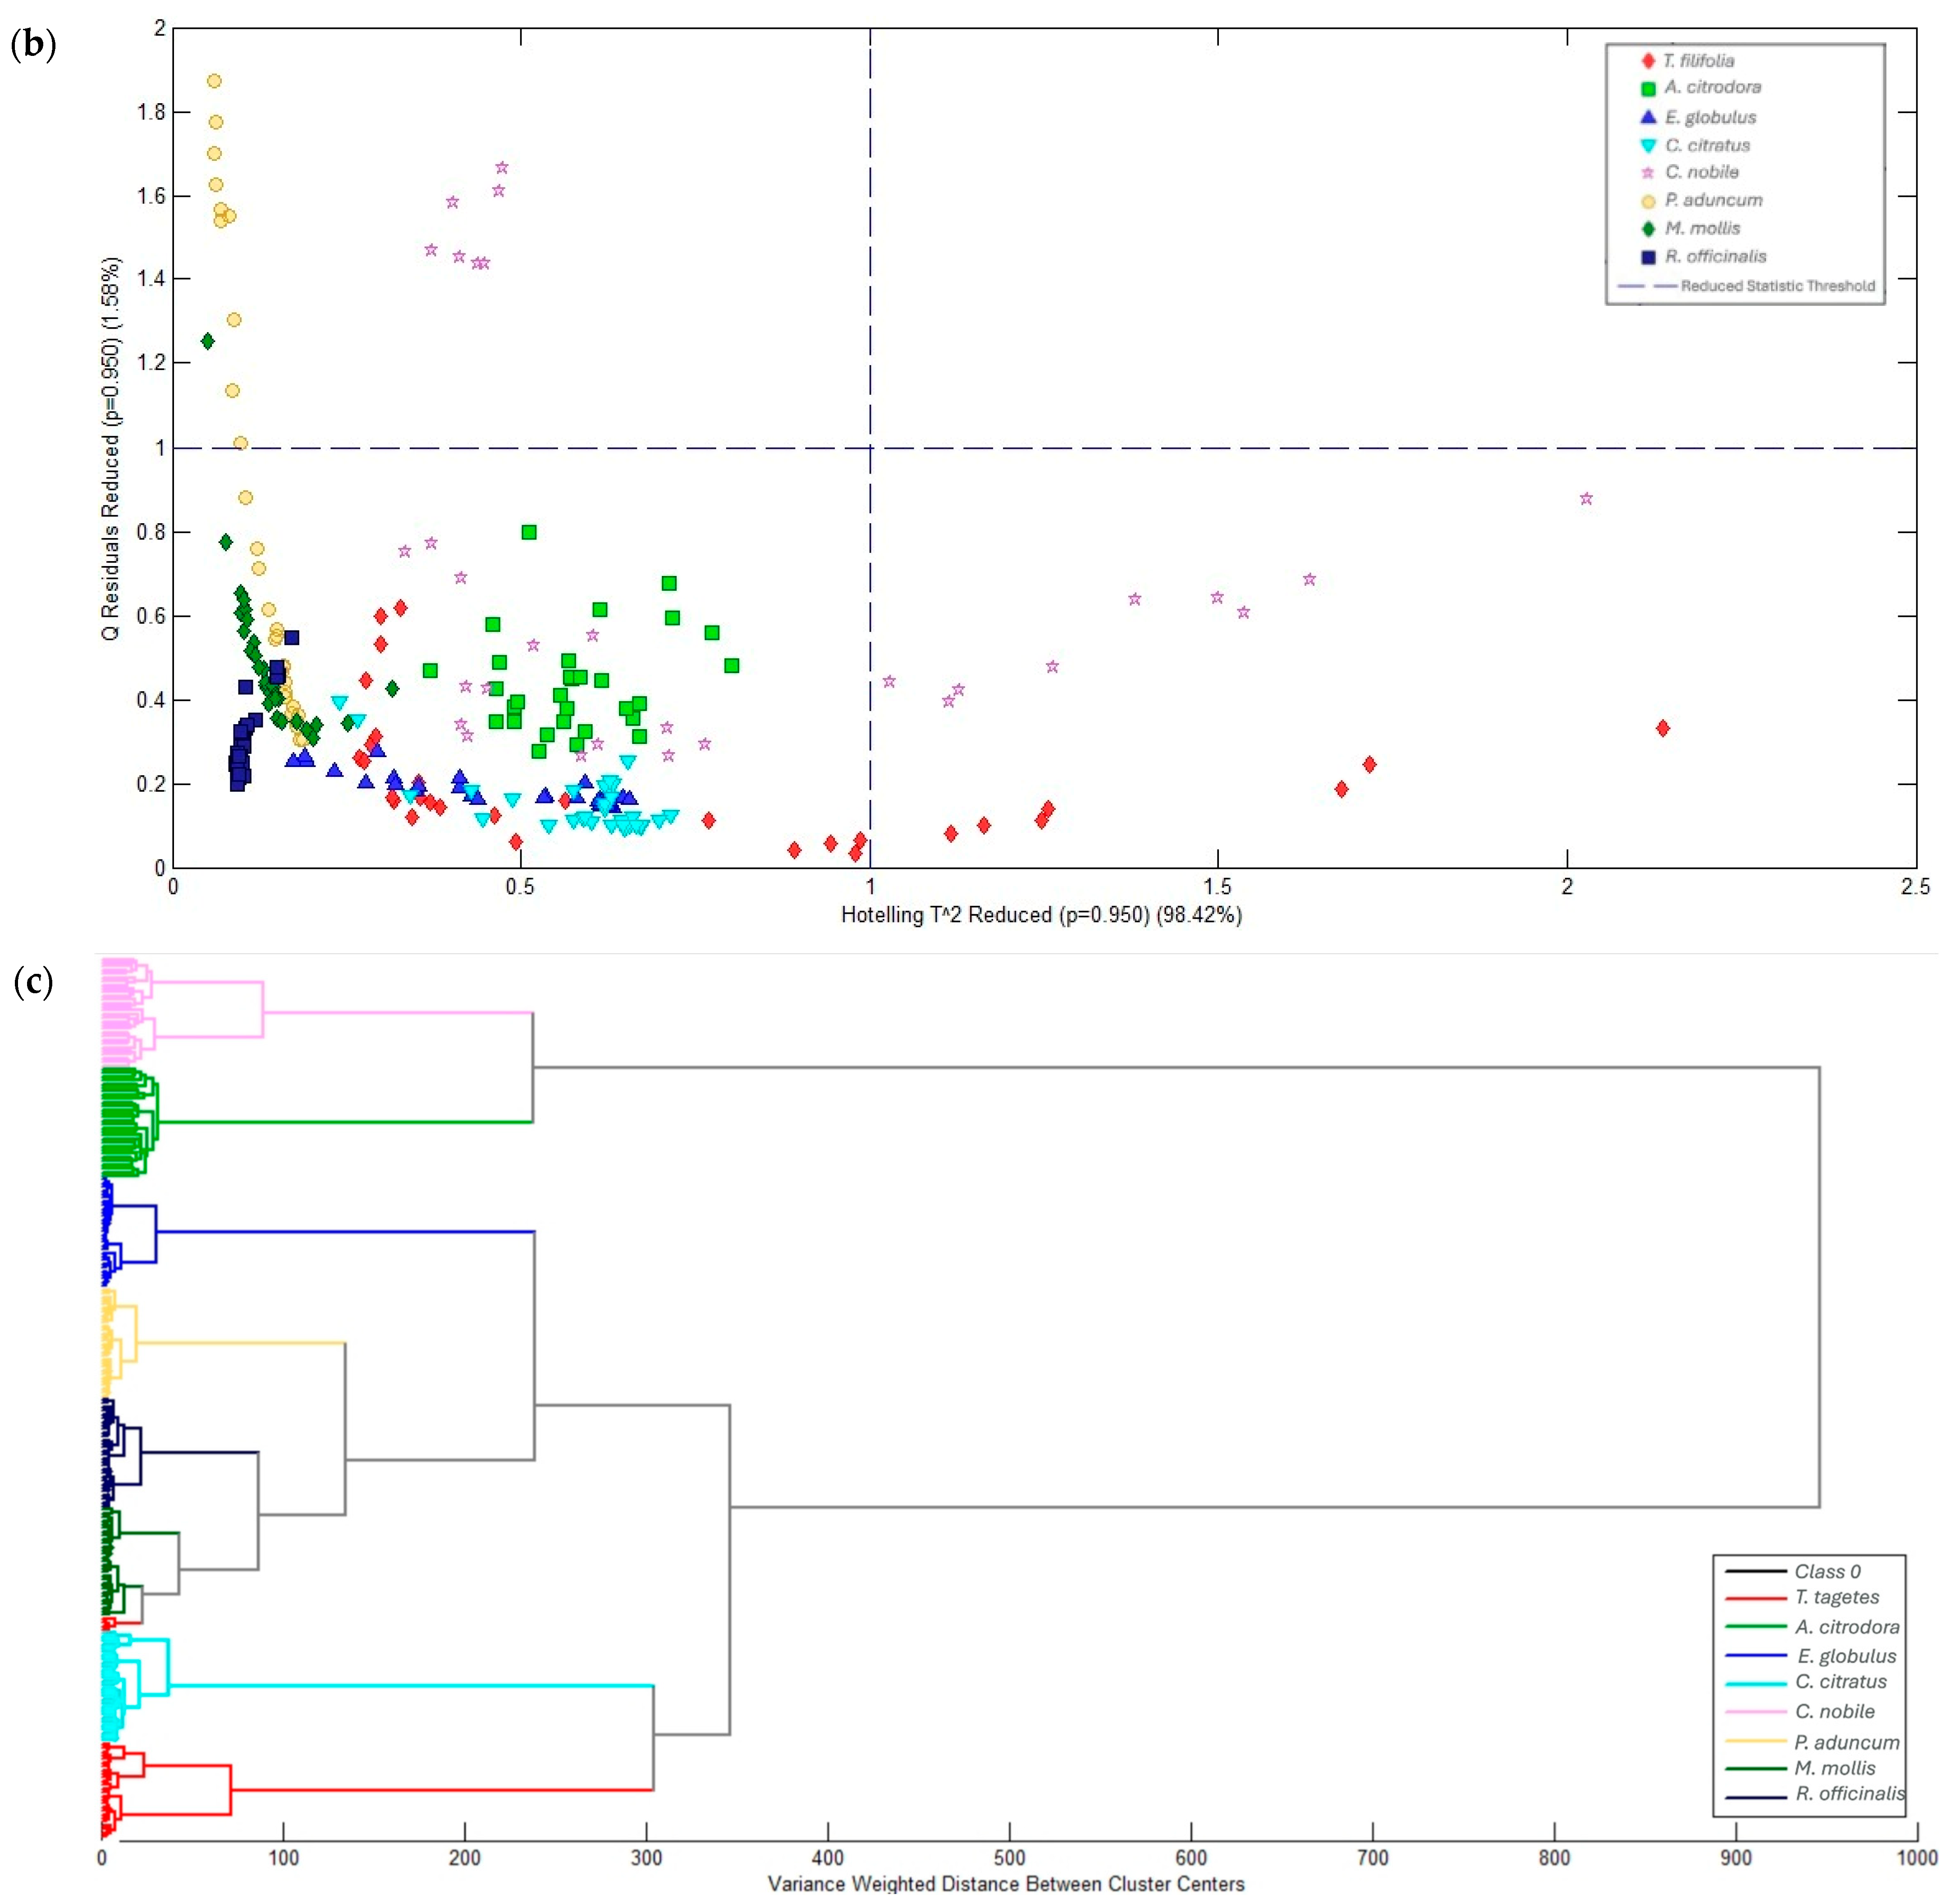
Principal component analysis (PCA) applied to the Raman spectra allowed a clear differentiation of the analyzed essential oils, showing a distinct separation between species (Figure 2a). The first two principal components, PC1 and PC2, collectively explained 75.73% of the total variance (40.25% and 35.48%, respectively), demonstrating the model’s adequate capacity to represent chemical differences between species.
The essential oils of E. globulus and R. officinalis formed closely related clusters, reflecting their structural similarity associated due to presence of oxygenated monoterpenes [23,50]. Similarly, M. mollis and P. aduncum, also clustered together, which is consistent with our results, as both share oxygenated functional groups (alcohols, ketones, and esters) and have a composition rich in monoterpenes and sesquiterpenes [53]. Another cluster, composed of C. citratus and A. citrodora, was identified, suggesting a high structural similarity between these oils, although distinct from the previously mentioned groups due to their greater separation in the projection plane. Finally, although T. filifolia was positioned close to M. mollis due to similarity in ester and alcohol content, the M. mollis oil exhibited a more dispersed distribution, likely associated with its complex composition of phenylpropanoids, unsaturated hydrocarbons, and terpenic rings [1,54], resulting in a more heterogeneous spectrum.
The Hotelling T2 versus residual Q plot (Figure 2b) allowed verification of the PCA model validity (95% confidence limit). The observed distribution shows that most species are located within the optimal fit region (lower left quadrant), indicating that the model adequately describes the variability of their chemical characteristics. The dispersion of C. nobile and T. filifolia in the lower right quadrant highlights chemical compositions that distinguish them from the rest. The absence of outliers in the critical region confirms that there are no observations with high influence (elevated T2) and high fitting error (high residual Q), supporting the stability and robustness of the PCA model.
Hierarchical cluster analysis (Figure 2c) complemented the PCA results by showing the similarity relationships between species through hierarchical clustering based on weighted variance distance. The dendrogram revealed the formation of two main groups. The first group consisted of A. citrodora and C. nobile, characterized by a predominance of oxygenated monoterpenes [55]. The second group included E. globulus, P. aduncum, R. officinalis, M. mollis, T. filifolia, and C. citratus, whose Raman signals were dominated by aromatic compounds and aliphatic C–H stretching [18,28,56].
This hierarchical organization was consistent with the chemical structure of the oils, as it clustered species with a high proportion of oxygenated monoterpenes together, while separating those dominated by aromatic or aliphatic compounds. Overall, the agreement between the results obtained from PCA, T2–Q, and HCA confirms that Raman spectroscopy, combined with multivariate analysis, constitutes an effective tool for discriminating essential oils based on their molecular composition and botanical origin.

2.3. Gas Chromatography–Mass Spectrometry (GC–MS) Results Analysis

After characterizing the essential oils (EO) using Raman spectroscopy, which allowed the identification of their main functional groups and vibrational profiles, chemical analysis was conducted by gas chromatography coupled with mass spectrometry (GC–MS). After characterizing the essential oils (EO) using Raman spectroscopy, which allowed the identification of their main functional groups and vibrational profiles, chemical analysis was conducted by gas chromatography coupled with mass spectrometry (GC–MS). This technique enables the precise identification, and a relative quantification of volatile compounds present in the EO, complementing the information obtained from Raman spectroscopy by providing data on the specific molecular composition of chemical families.
It is important to note that the GC-MS data correspond to semi-quantitative relative peak areas (%), obtained after signal normalization. Therefore, the reported values represent the relative abundance of each compound in the oil and should not be interpreted as absolute concentrations or gravimetric percentages. This method allows for a reliable comparison of the relative chemical composition between essential oils, although it does not consider the response factors of each detector.
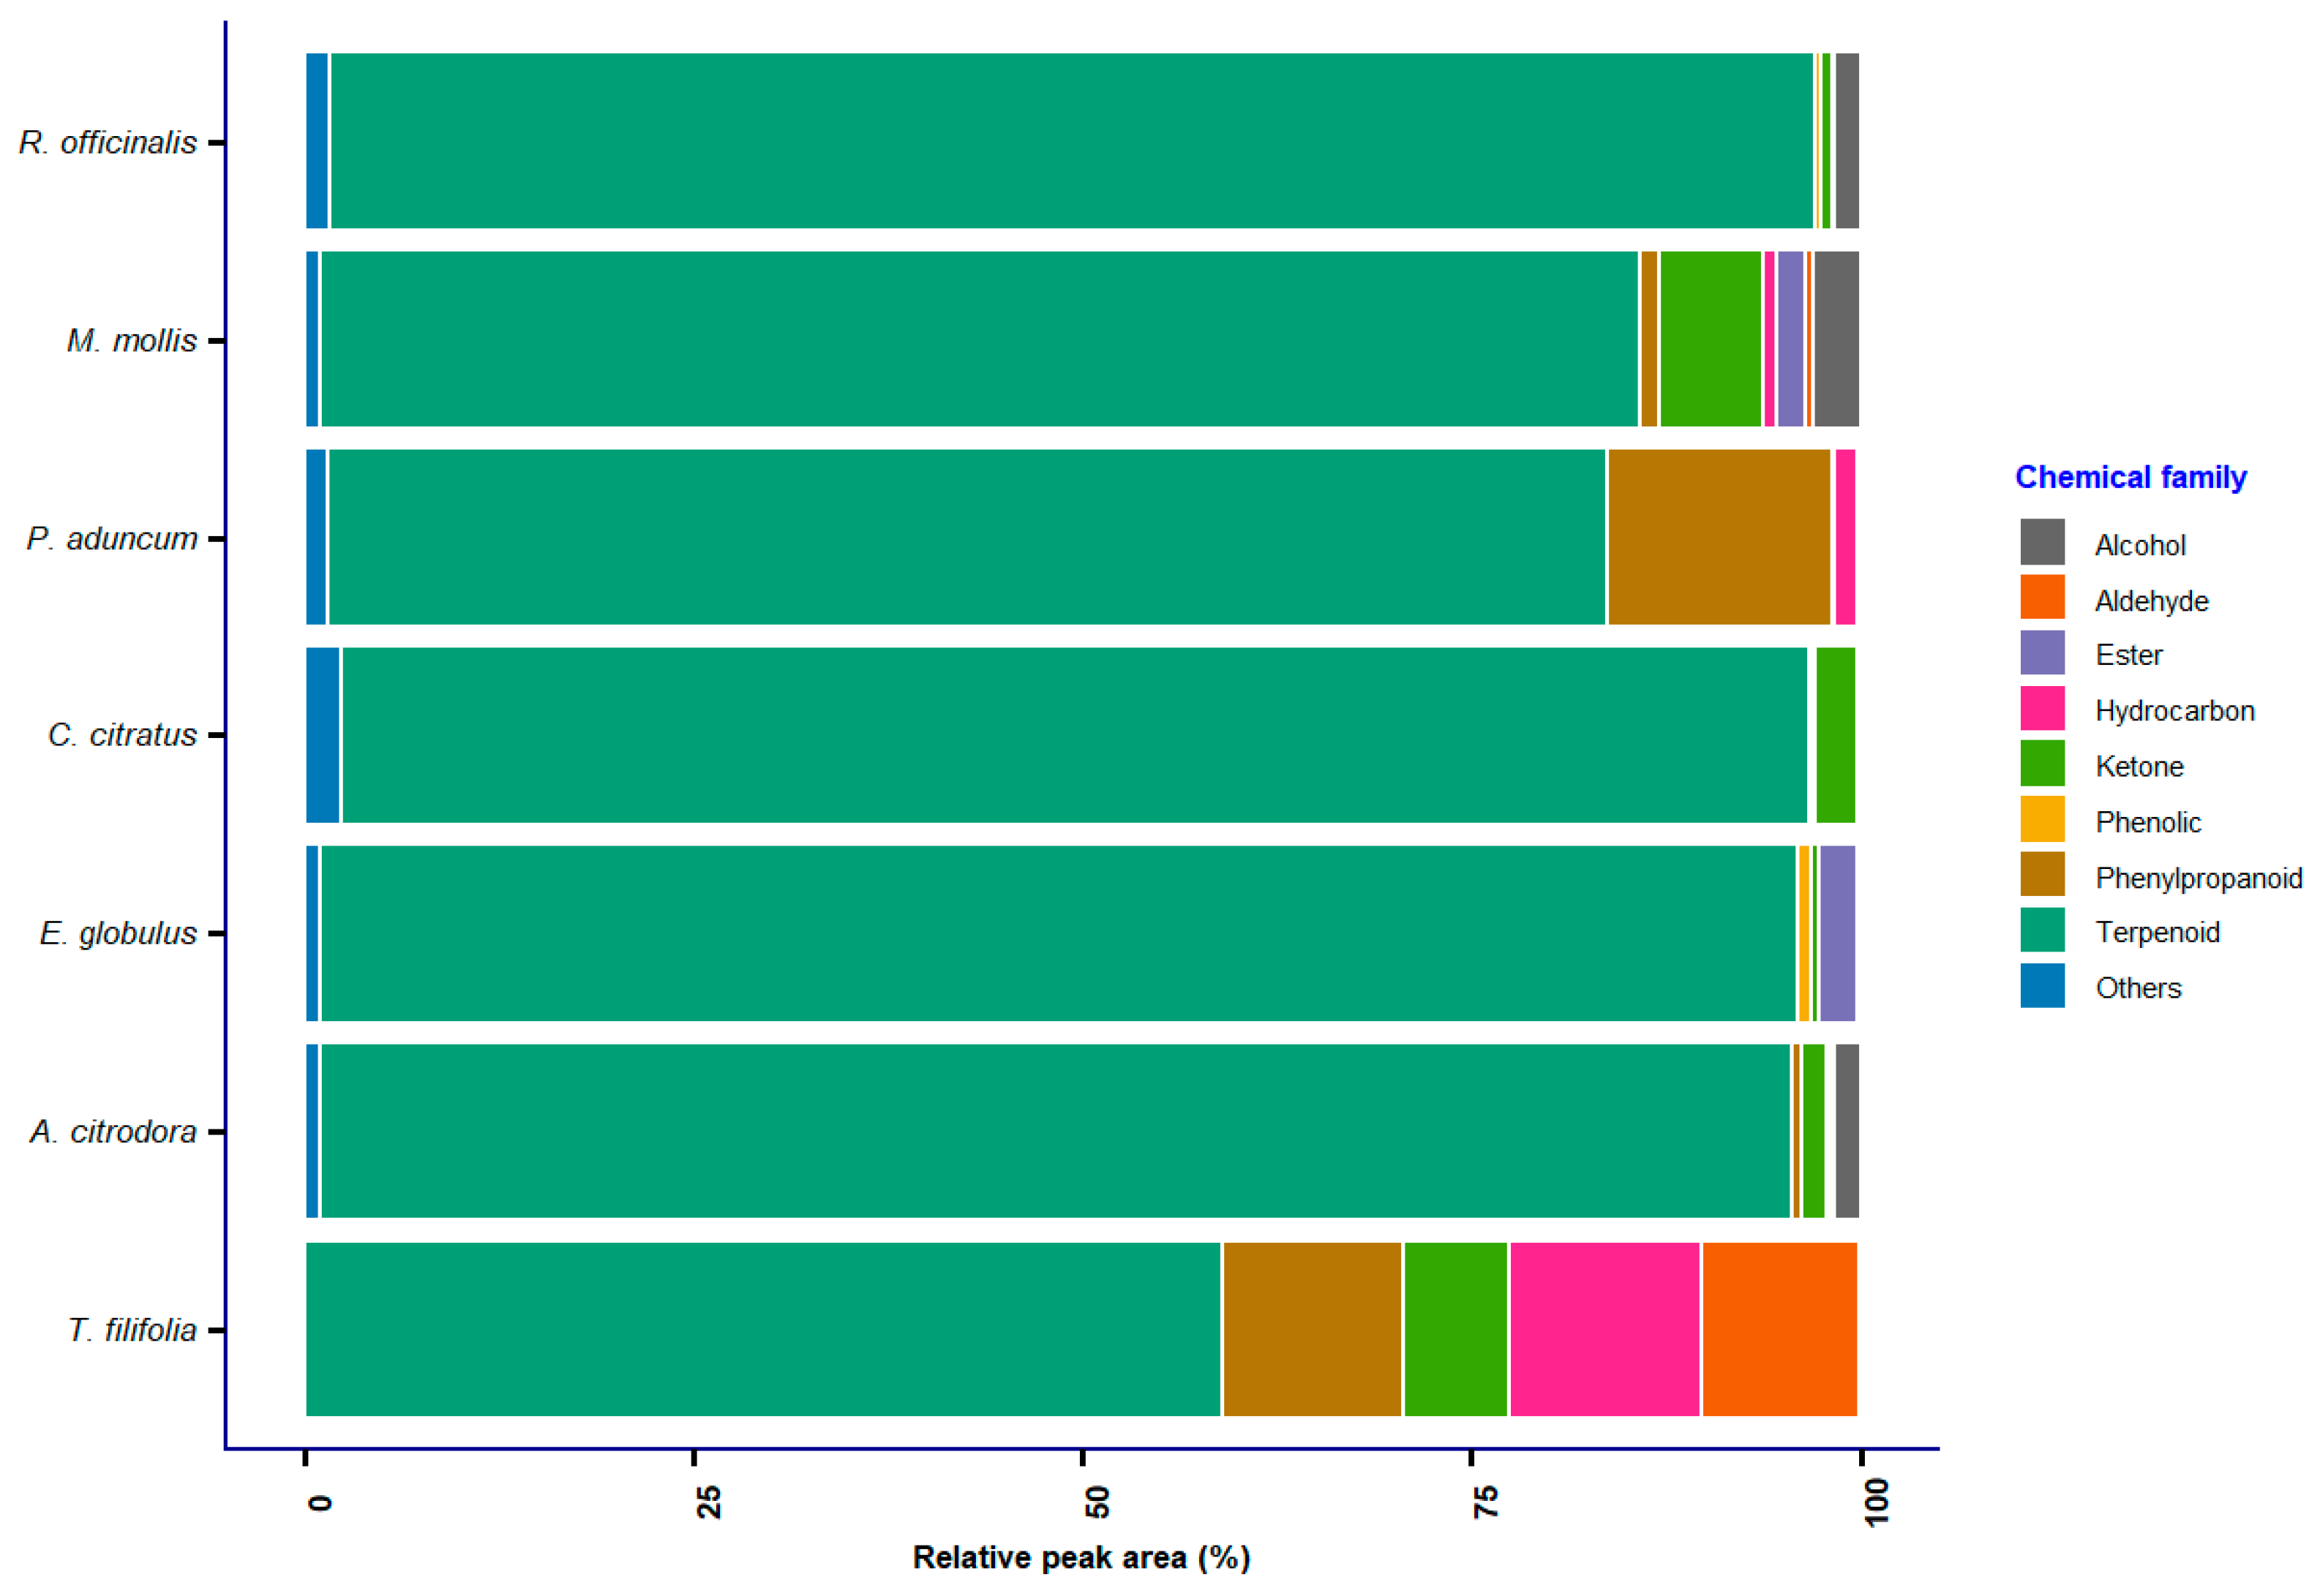
GC–MS analysis identified a total of 224 compounds (Table S1) belonging to nine chemical families: alcohols, aldehydes, esters, hydrocarbons, ketones, phenols, phenylpropanoids, terpenoids, and a residual group classified as “others,” in the EO of T. filifolia, A. citrodora, E. globulus, C. citratus, P. aduncum, M. mollis, and R. officinalis. In most essential oils, terpenoids constituted the predominant fraction, representing over 70% of the total relative peak area (Figure 3), followed by lower proportions of alcohols, hydrocarbons, ketones, and esters. This pattern aligns with the findings of Fenghour & Bouabida [25], who report terpenoids as the main constituents of EO, with abundant compounds such as α-curcumene (7.84–16.91%) in R. officinalis [10], β-cyclocitral (21.46% relative peak area), germacrene D (11.7–62.9% relative peak area), and β-caryophyllene (17.34% relative peak area) in P. aduncum [57], as well as α-terpinyl acetate and citral (17% relative peak area) in A. citrodora [58].
The essential oil of R. officinalis exhibited notable relative peak areas of D-limonene (8.59%), linalool (2.91%), α-terpinene (2.51%), and β-caryophyllene (18.26%) (Table 1). These values are higher than those reported by Alvarado-García et al. [53], who identified 10.76% relative peak area of β-caryophyllene in R. officinalis samples through GC–MS analysis. In contrast, Malik & Upadhyay [59] recorded only 1.54% relative peak area of this compound in EO from R. officinalis originating from India. Similarly, the essential oil of P. aduncum presented high semiquantitative contributions based on GC–MS signal intensity of β-caryophyllene (11%), D-limonene (4.59%), and β-pinene (3.37%), slightly higher than those reported by Jedidi et al. [60] in samples collected in northwestern Tunisia, where a β-caryophyllene relative peak area of 9.49% was reported.
The observed variations in β-caryophyllene relative peak area can be attributed to both environmental factors and post-harvest and processing conditions. On one hand, parameters such as temperature, humidity, altitude, and soil composition in the cultivation areas directly influence the synthesis and accumulation of terpenoids [10]. On the other hand, technological aspects related to drying and extraction methods also modify the chemical profile of the oil. In this regard, Mohammed et al. [61] demonstrated that prolonged drying of R. officinalis reduces the semiquantitative contribution of volatile compounds, mainly monoterpenes such as D-limonene, linalool, and α-terpinene, while also altering the proportion of sesquiterpenes such as β-caryophyllene. Similarly, Zhang et al. [62] showed that the extraction method (hydrodistillation, steam distillation, or solvent extraction) significantly modifies the EO relative peak areas, whereas Zheljazkov et al. [63] reported that both the distillation time and the sample condition (dry or fresh) affect the yield and bioactivity of R. officinalis essential oil.
Additionally, the part of the plant used for essential oil extraction is also a determining factor. In R. officinalis, it has been observed that young leaves concentrate higher levels of monoterpenes, whereas structural tissues such as stems and bark present lower proportions of these metabolites [64]. Similarly, in species of the genus Origanum, EO extracted from leaves show higher concentrations of volatile aromatic compounds, such as carvacrol (30.73%), thymol (18.81%), and β-caryophyllene (8.21%), compared to those obtained from stems, where the concentrations were lower (carvacrol 6.02%, thymol 3.46%, and β-caryophyllene, which was not detected) [65].
Likewise, in P. aduncum, the plant part also influences the semiquantitative profile of the essential oil. For instance, Valadares et al. [66] compared essential oils obtained from leaves and flowers, finding differences in the relative peak areas of β-caryophyllene (7.2% in flowers and 5.4% in leaves) and other minor compounds such as terpinen-4-ol and myrcene. Moreover, antifungal activity varied depending on the plant organ, as the oil obtained from flowers completely inhibited the growth of Sclerotinia sclerotiorum at doses above 30 µL, whereas the leaf essential oil required 50 µL to achieve 98.74% inhibition. These findings confirm that the distribution of monoterpenes and sesquiterpenes is closely associated with the structural characteristics of different plant organs, highlighting the importance of considering the plant part used in EO characterization.
The essential oil of M. mollis exhibited a unique composition, characterized by the dominant presence of cis,cis-nepetalactone at concentrations above 20%, a compound absent in the other evaluated EO in this study. The absence of β-caryophyllene, along with the predominance of this lactone, highlights the metabolic uniqueness of M. mollis oil compared to other members of the Lamiaceae family. This finding represents a significant chemical discovery, as this study constitutes the first report of cis,cis-nepetalactone in this species; previous investigations have not documented the presence of this lactone in M. mollis [1,54,67,68].The detection of this lactone in M. mollis essential oil differentiates the chemical composition of the plant, which is relevant from both a chemical and functional perspective. This finding suggests the existence of a population with distinct chemical characteristics, whose profile could be less toxic and potentially more bioactive than other M. mollis varieties dominated by pulegone [69,70].
Alongside nepetalactone, linalool (9.63%) and D-limonene (6.87%) were identified as relevant secondary components, with relative peak areas higher than those reported by Cravero Ponso et al. [1] for the same species (<5%). These oxygenated monoterpenes are known for their antibacterial, anti-inflammatory, anxiolytic, and contraceptive properties, reinforcing the bioactive potential of the essential oil. The differences in EO relative peak areas compared to previous studies are mainly attributed to natural variations in plant chemistry and the environmental conditions in which the plants grew, such as climate, soil type, and altitude. For example, van Baren et al. [54] reported marked variations in linalool relative peak areas (6–84%) among Argentine populations of M. mollis, while Quispe-Sanchez et al. [17] documented higher proportions of D-limonene (14.57%) and linalool (15.30%) in samples collected in the same Andean region as this study (Peru), suggesting that even under similar environmental conditions, significant differences can arise due to genetic, phenological, or methodological factors, including the collection period, which is associated with the plant’s developmental stage and seasonal environmental conditions.
Comparatively, the composition observed in this study differs from the classical profiles of M. mollis, where pulegone, menthone, and 1,8-cineole are the characteristic components [71,72,73,74]. The analysis of the essential oil of C. citratus allowed the identification of linalool (2.33%) and geraniol (6.06%) relative peak areas. Although the overall profile of the species is characterized by the predominance of citrals (a mixture of geranial and neral), the detection of these terpenoids at proportions above 1% is relevant due to their contribution to both the aroma and the bioactive properties of the oil essential. For instance, studies indicate that the presence of geraniol in C. citratus can enhance the antibacterial activity of the essential oil [1,15,54]. Monoterpenic alcohols have been shown to disrupt bacterial cell membrane integrity, promoting ion leakage and disorganization of enzymatic systems, thereby increasing efficacy against Gram-positive bacteria (Staphylococcus aureus and Bacillus subtilis) and Gram-negative bacteria (Escherichia coli, Pasteurella multocida) [28,75,76]. The absence or low relative peak areas of other chemical compounds (β-caryophyllene, myrcene, citral) in the essential oil may favor the stability of active components such as geraniol and linalool, preserving their antibacterial activity and preventing potential interactions that could reduce efficacy [77].
The essential oil of white E. globulus exhibited a chemical profile dominated by myrcene (8.49%), β-pinene (8.21%), and terpinen-4-ol (3.54%), relative peak areas higher than those reported in other species of the genus. For instance, Belhachemi et al. [78] reported the presence of these terpenoids in red E. globulus essential oil, albeit at lower relative peak areas (<2%). Similarly, dos Santos et al. [79] reported low β-pinene levels in lemon-scented E. globulus (1.98%), values much lower than those observed in the present study. Additionally, Ait benlabchir et al. [23] detected myrcene (1.51%) and terpinen-4-ol (2.43% in directly distilled oil and up to 15.24% in purified fractions) in white E. globulus essential oils, demonstrating that although these compounds are usually present at low to moderate relative peak areas, their values can vary widely depending on the fraction analyzed or the processing method applied.
In Mediterranean regions, a comparative analysis of E. globulus essential oil showed that myrcene and β-pinene rarely exceed 2–3%, while terpinen-4-ol remains below 5% [26]. Likewise, studies on commercial E. globulus oils indicate that these monoterpenes are secondary components: myrcene (<2%), β-pinene (1–2%), and terpinen-4-ol (1%) [80]. In contrast, the relative peak areas of these compounds in this study are significantly higher.
The high proportion of β-pinene and myrcene observed in the study could be explained by the presence of specific chemotypes of E. globulus, such as those characterized by the combinations γ-terpinene + o-cymene + β-pinene or α-pinene + 1,8-cineole. These chemotypes correspond to populations that produce essential oils with differentiated chemical profiles, resulting from genetic or environmental variations specific to each group [81]. Additionally, it is possible that the metabolic pathways responsible for monoterpene formation favored the production of β-pinene and myrcene in this population over other compounds. In this regard, it has been demonstrated in similar species, such as tea tree (Melaleuca alternifolia), that the activity of genes associated with the methylerythritol phosphate (MEP) pathway, which generates the precursors necessary for monoterpene synthesis, directly influences both the quantity and type of monoterpenes produced, supporting this possible explanation [82].
The essential oils of A. citrodora and T. filifolia, both recognized for their high content of biologically active monoterpenes, exhibited differentiated chemical compositions. In the essential oil of A. citrodora, the predominant compounds were citronellol (10.92%), β-caryophyllene (6.0%), and D-limonene (6.31%), whereas in T. filifolia, citral (2.35%), linalool (1.61%), and D-limonene (2.81%) were the main components. In the case of A. citrodora, β-caryophyllene and D-limonene were present at similar relative peak areas; however, D-limonene showed notable differences between the two oils, with a higher proportion in A. citrodora compared to T. filifolia.
In contrast with our findings, Al-Maharik et al. [10] reported for the essential oil of A. citrodora the presence of β-caryophyllene (0.62%), citral (10.79%), limonene (0.21%), and D-limonene (19.03%), along with other minor compounds such as 1-terpineol (0.07%), 4,4-dimethyl-2-butenolide (0.17%), α-thujone (0.16%), and ethyl 3-(2-furyl)propanoate (0.09%). Although the qualitative composition (the same compounds) partially coincides with that of our study, the quantitative differences in relative peak areas could be explained by the effects of cultivation factors such as temperature and light intensity, which modulate the expression of genes encoding terpene synthases enzymes that determine both the biosynthetic pathway and the proportion in which precursors are converted into different monoterpenes [83,84].
For instance, it has been demonstrated that the expression of monoterpene biosynthetic genes can vary depending on the time of day, increasing around midday when light and temperature are higher, coinciding with peaks in the production of terpenoids such as D-limonene or linalool in lavender [23]. Similarly, studies in other species, including alpine plants [85] and sandalwood [86], have observed that abrupt changes in temperature or radiation levels affect volatile terpene emission, as lighter or less-oxygenated compounds can be lost or rearranged in response to thermal stress. Therefore, it is likely that in the analyzed population of A. citrodora, local conditions—such as high daytime temperatures or intense irradiance—favored the biosynthetic preference toward monoterpenes like D-limonene or citral, resulting in higher relative peak areas than those reported by Al-Maharik et al. [10].
Similarly, Rashid et al. [30] reported in the same species levels of β-caryophyllene (5.09%), D-limonene (18.80%), and linalool (0.38%). In this case, the relative peak area of β-caryophyllene was comparable to that observed in our study, suggesting that this compound exhibits low variation throughout the plant’s vegetative cycle; however, this assumption remains to be verified. In contrast, the variations observed in D-limonene and linalool could be explained by differences in the availability of precursor compounds in the plant and by changes induced by temperature and solar radiation. Recent studies have demonstrated that environmental and physiological conditions directly modify the proportion of these compounds [87]. For example, in Zanthoxylum bungeanum, D-limonene content increases under higher temperature and solar radiation, whereas linalool decreases under the same conditions, indicating an inverse relationship between these two compounds [88,89].
Moreover, Dumitrescu et al. [90] analyzed the essential oil of T. filifolia, identifying linalool (1.90%) and D-limonene (10.01%) as the main components. Compared to our results, the relative peak area of linalool was similar, whereas D-limonene was considerably higher. Beyond extraction methodological differences, this variation can be attributed to several physiological factors, such as leaf characteristics and soil properties, which directly influence the relative peak area of the essential oil. In particular, the physiological maturity and position of leaves on the stem at harvest significantly affect the proportion of monoterpenes. In plants such as geranium, younger leaves exhibit higher biosynthetic activity and accumulate greater levels of alcohols like linalool, whereas older leaves tend to present a more hydrocarbon-rich profile, with predominance of limonene [91]. Additionally, soil properties, especially pH and mineral composition, modify the availability of essential nutrients and the efficiency of enzymes involved in monoterpene synthesis [92].
Unlike the other essential oils, the essential oil of C. nobile could not be characterized by GC–MS due to its low extraction yield and the high viscosity of the resulting concentrate (Table S2), which exhibited a pasty and dense consistency, that prevented adequate volatilization during chromatographic analysis. This behavior can be attributed to the predominance of higher molecular weight and less volatile compounds, such as oxygenated sesquiterpenes, high-molecular-weight esters, or traces of natural waxes [93,94], which hinder their detection and separation by gas chromatography.

2.4. Multivariate Analysis of GC-MS Data

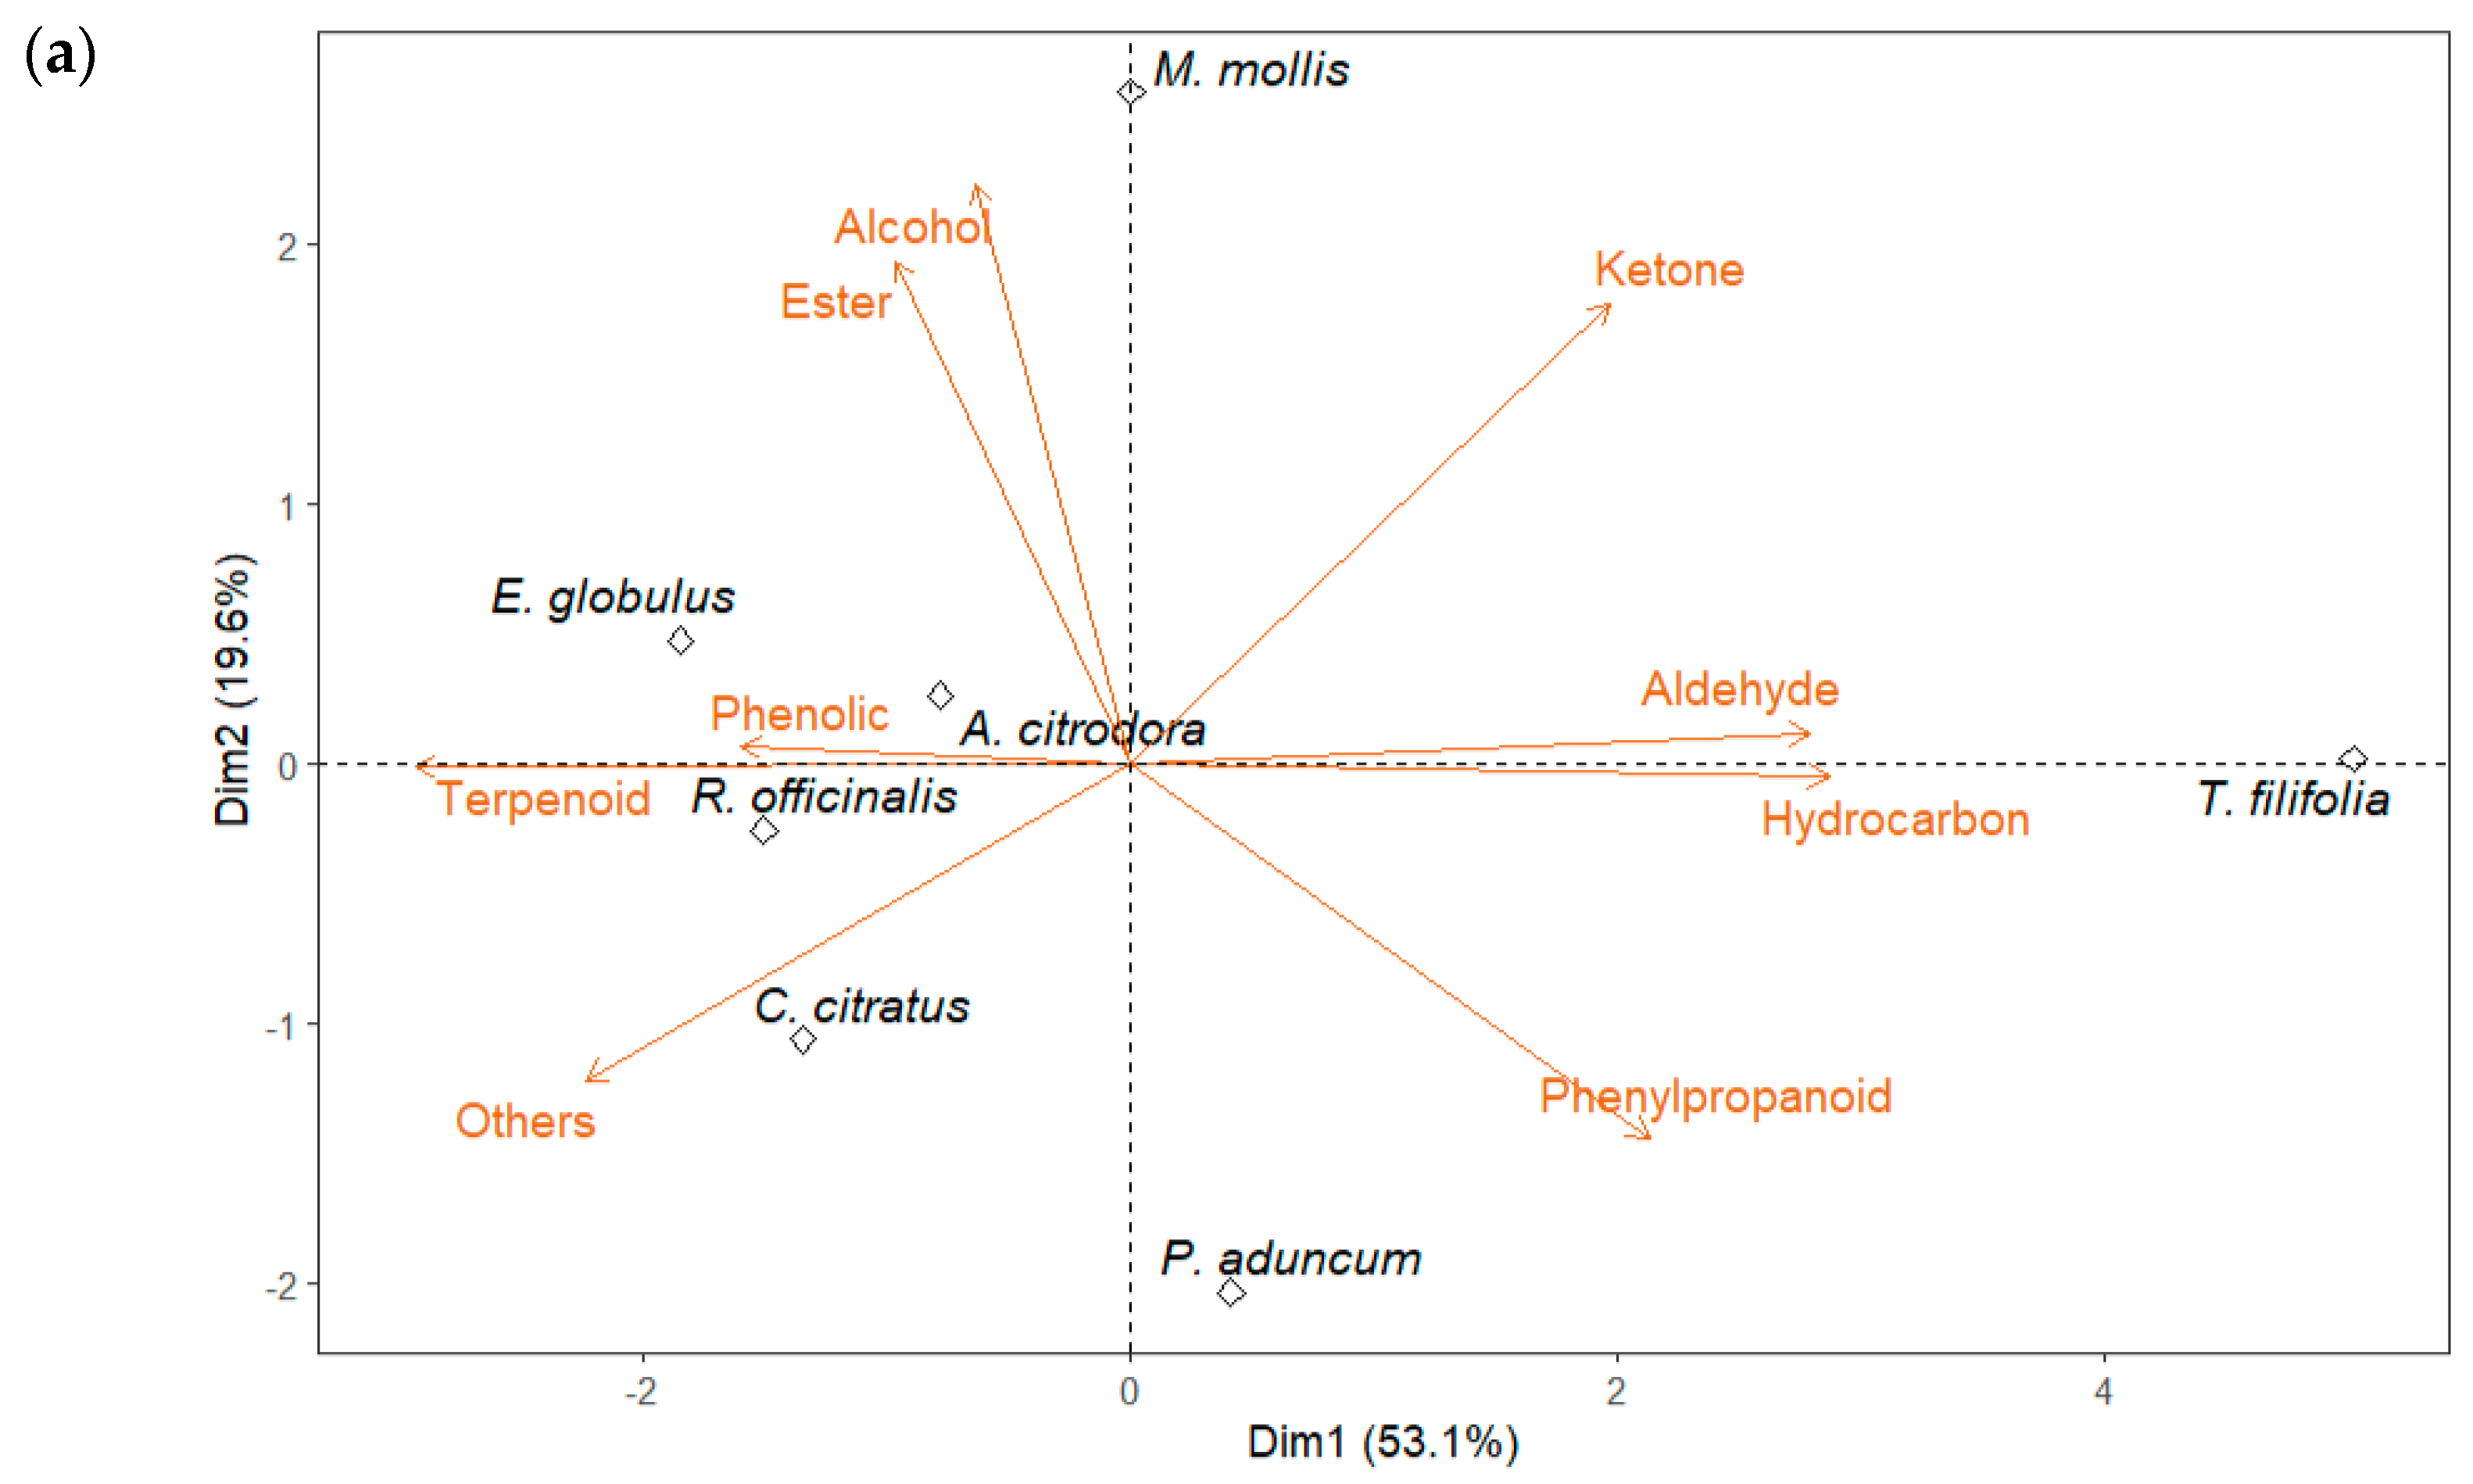
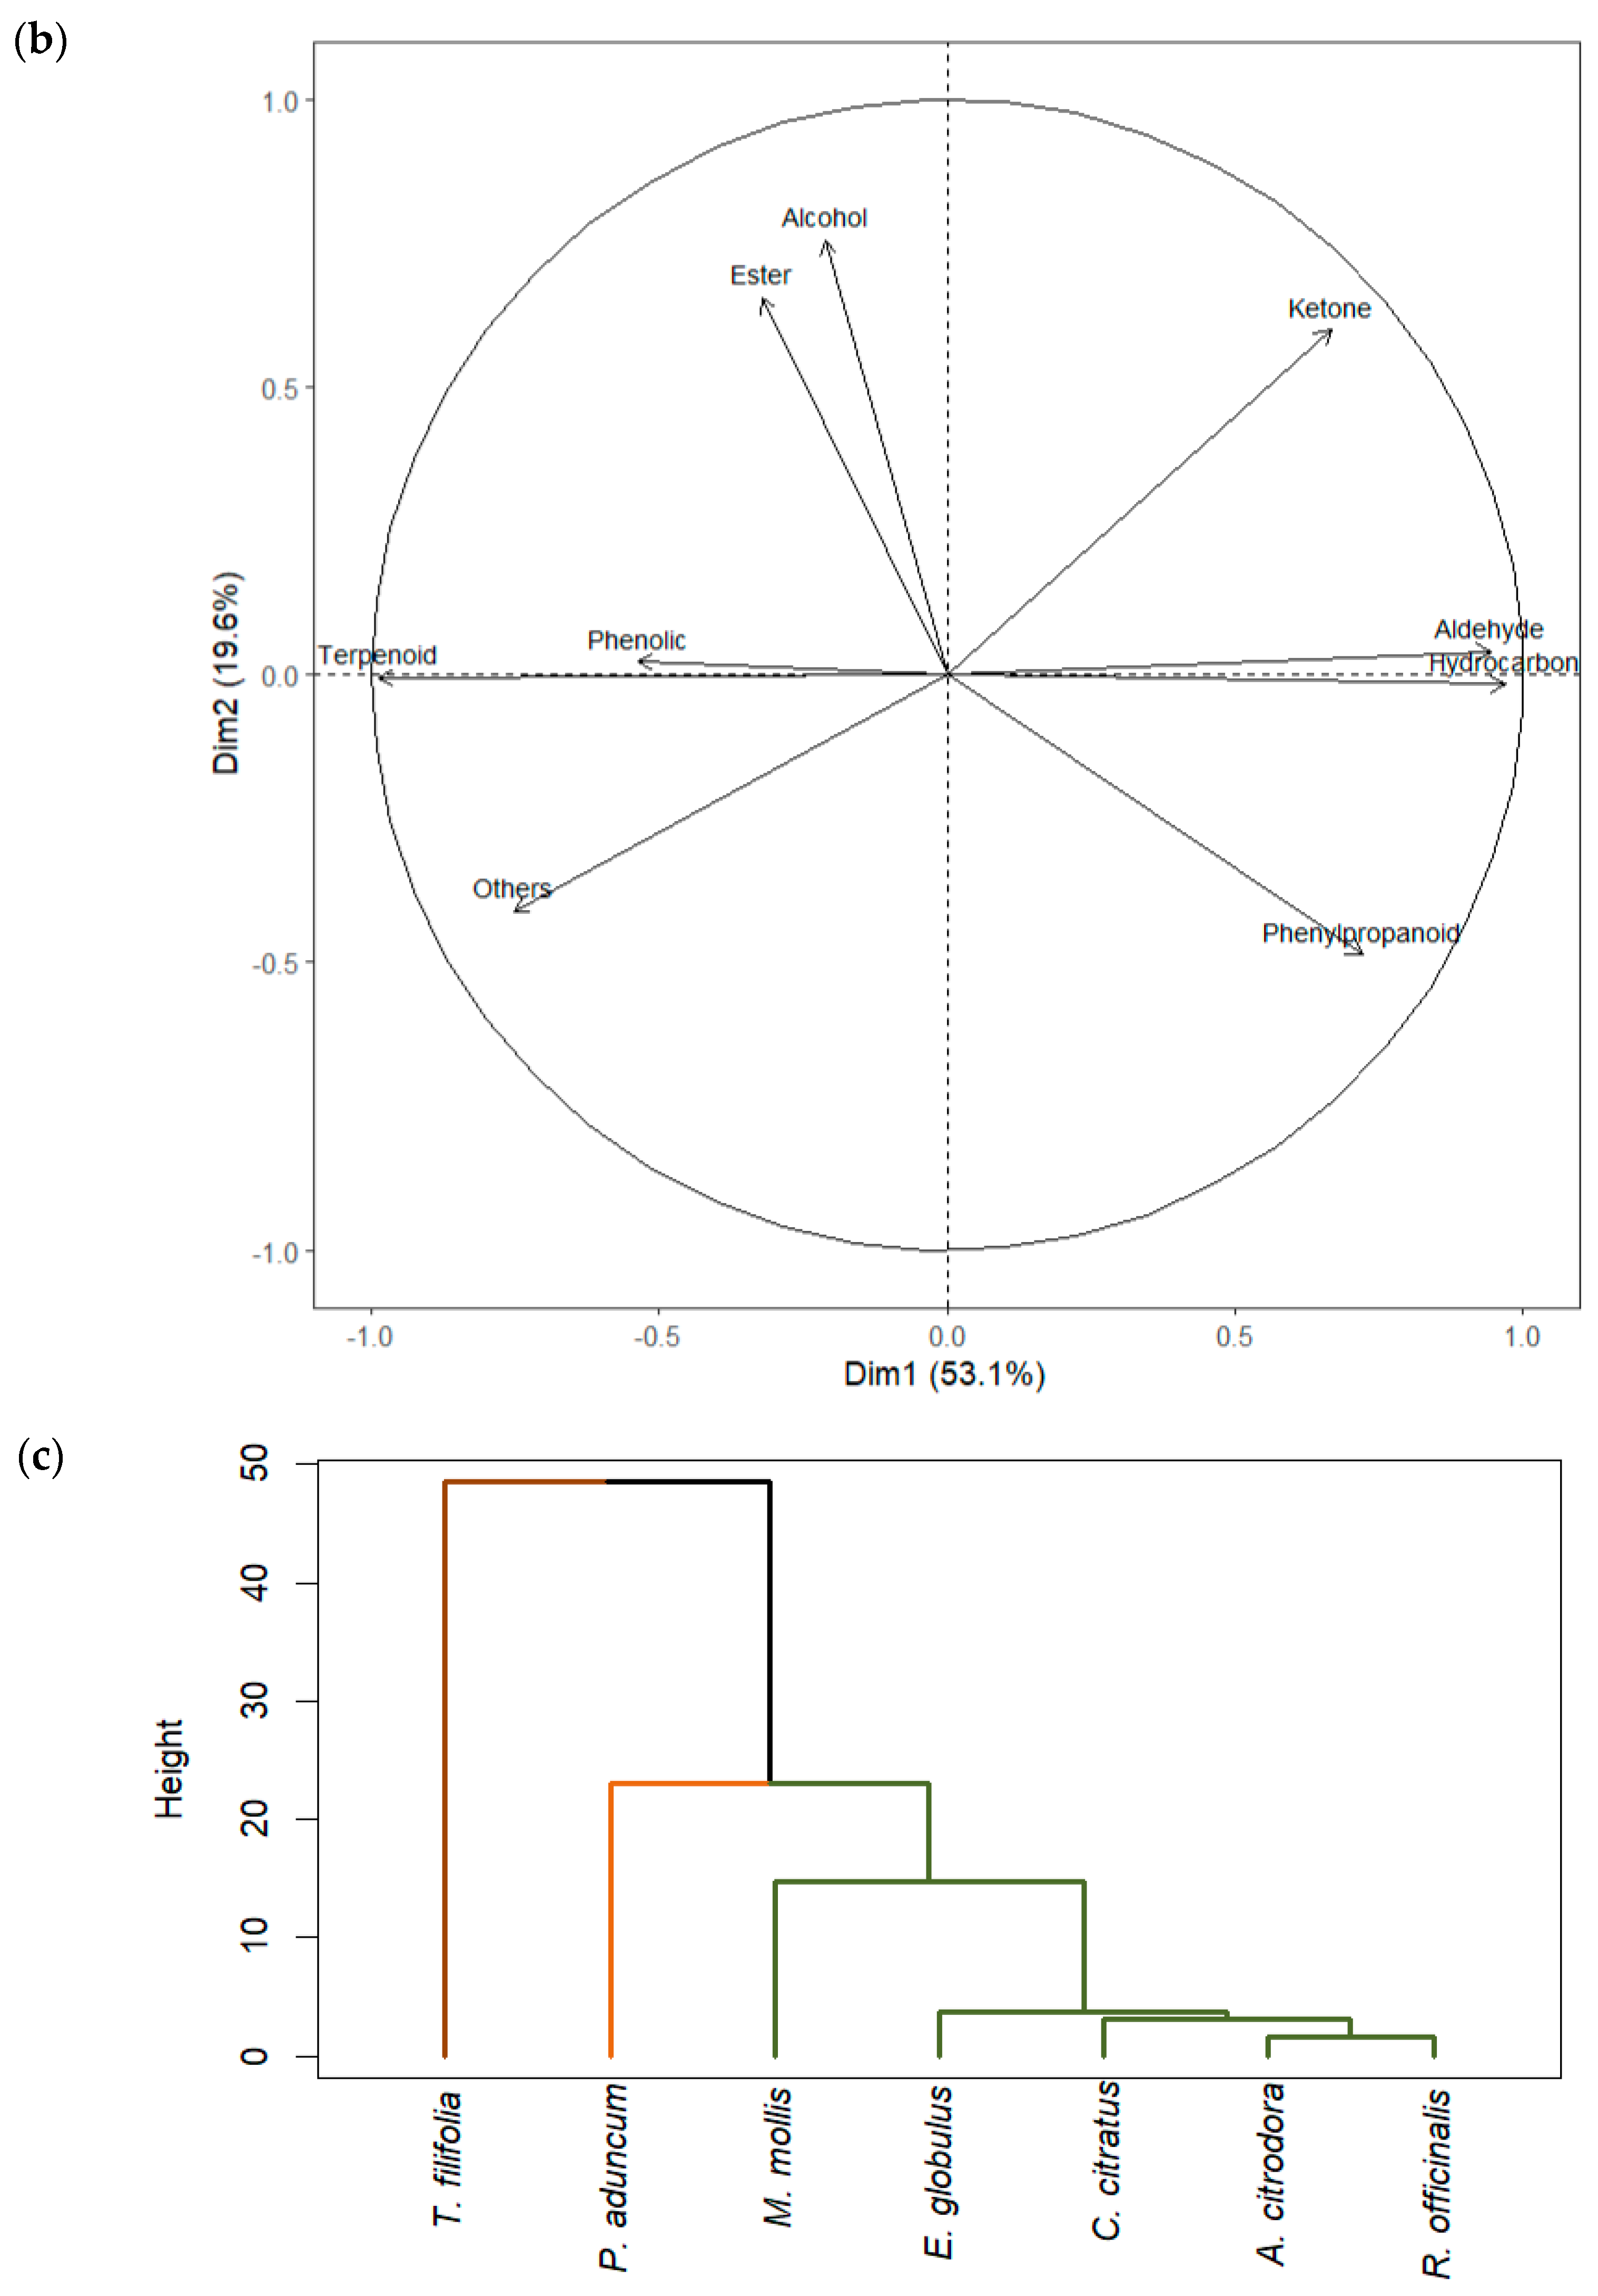
Multivariate analysis using Principal Component Analysis (PCA) and Hierarchical Cluster Analysis (HCA) allowed the identification of chemical relationships among the essential oils evaluated and the determination of the functional groups responsible for their differentiation. Overall, the first two dimensions of the PCA (Figure 4) explained 72.7% of the total variance (PC1 = 53.1% and PC2 = 19.6%), demonstrating an adequate representation of the chemical variability of the samples.
The essential oil of T. filifolia was projected at the far right, close to the vectors of aldehydes and hydrocarbons, indicating a composition rich in these compounds and a clear differentiation from the other oils. In contrast, M. mollis was located at the upper part of the plot, associated with the vectors of alcohols and esters, suggesting a composition dominated by more polar oxygenated metabolites [95,96]. The oils of E. globulus and R. officinalis clustered in the left region, linked to terpenoids and phenolic compounds, consistent with their characteristic content of oxygenated monoterpenes, in agreement with Čmiková et al. [97], who highlight 1,8-cineole as a main component. P. aduncum was projected in the lower right quadrant, defined by phenylpropanoids, while C. citratus was positioned toward the lower left quadrant, in the area associated with the “others” group, suggesting a distinctive chemical profile with minor or species-specific compounds.
These groupings observed in the PCA were confirmed by hierarchical cluster analysis (Figure 4c), which revealed three main levels of chemical similarity. The oil of T. filifolia exhibited a singular profile dominated by aldehydes and hydrocarbons, based on relative peak areas (%). Secondly, P. aduncum formed an independent group, consistent with its predominance of phenylpropanoids [98]. Finally, the cluster formed by M. mollis, E. globulus, C. citratus, A. citrodora, and R. officinalis showed the highest similarity, reflecting a more homogeneous composition based on terpenoids and alcohols, as reported in this study.
The multivariate analysis demonstrated that the differences in the distribution of essential oils are driven by the chemical nature of their dominant metabolites. Thus, PCA and cluster analysis not only confirmed the consistency among the reported chemical compositions but also facilitated the identification of characteristic patterns that distinguish each species based on its profile of terpenoids, phenylpropanoids, aldehydes, or alcohols.
During the spectroscopic analysis, additional bands within the 200–3100 cm−1 range were also identified, associated with families such as aldehydes, esters, alcohols, and organic acids. Complementarily, the GC–MS analysis allowed the detection of compounds from diverse families, including ketones and phenylpropanoids, in addition to the major terpenoids. However, these metabolites were not discussed in detail in the present study because their relative concentrations were considerably lower, and the main focus was on the characterization and interpretation of the major metabolites (primarily terpenoids), as they largely determine the chemical profile, bioactive properties, and variability among species.
It should be noted that the hierarchical classification obtained from Raman spectroscopy (Figure 2c) differs from the GC–MS data (Figure 4c). This is understandable, given that Raman detects vibrational characteristics related to functional groups and molecular structures, while GC–MS provides semi-quantitative information on specific volatile compounds [99]. Therefore, the classification patterns obtained with each technique should be interpreted in a complementary manner, rather than combined directly.

2.5. Limitations and Future Perspectives

The complementary analysis of Raman spectroscopy and gas chromatography–mass spectrometry (GC–MS) enabled the identification of the main metabolites in the EO of P. anisum, A. citrodora, E. globulus, C. citratus, M. chamomilla, P. aduncum, M. mollis, and R. officinalis. Terpenoids were detected that clearly differentiate each species. In P. anisum, citrals (2.35%) and D-limonene (2.81%) were observed. In A. citrodora, citronellol (10.92%) and β-caryophyllene (6%) were predominant, whereas E. globulus was characterized by myrcene (8.49%) and β-pinene (8.21%). C. citratus showed geraniol (6%), and P. aduncum was distinguished by β-caryophyllene (11%). M. mollis was notable for a high semiquantitative contribution based on GC–MS signal intensity of cis,cis-nepetalactone (30.16%), while R. officinalis exhibited a predominance of β-caryophyllene (18.26%).
The high content of these terpenoids suggests the anti-inflammatory, antioxidant, sedative, muscle-relaxant, antimicrobial, and antitumor properties attributed to these plants [78,100]. For example, β-caryophyllene has been described as an insecticidal agent, a bacterial biofilm inhibitor, and a modulator of apoptosis in cancer cells [101,102]. Additionally, da Costa Sobral et al. [103] demonstrated that the combination of β-caryophyllene with drugs such as pregabalin enhances seizure control, whereas Nunes et al. [104] reported that camu camu essential oil, rich in (E)-caryophyllene (14.02–34.31%), exhibits anticancer and anti-inflammatory potential by inhibiting tumor cells and reducing inflammatory processes in vitro.
The discovery of cis,cis-nepetalactone in the essential oil of M. mollis represents the first record of this lactone in the species. Its presence indicates the existence of populations with distinct chemical profiles, likely influenced by genetic or environmental factors affecting the production of bioactive compounds [77,105]. This finding opens new research avenues to evaluate how genetics and environmental conditions influence the production of cis,cis-nepetalactone and other bioactive compounds in M. mollis. Understanding these factors could allow the identification of previously unstudied varieties with higher semiquantitative contributions based on GC–MS signal intensity of functional metabolites and low toxicity risk. Additionally, these essential oils could have applications in natural cosmetics and aromatherapy, particularly due to their antimicrobial, anti-inflammatory properties and characteristic fresh aroma, further highlighting their functional and commercial potential [67,106].
Given that reports of nepetalactone in Lamiaceae family are scarce, it is recommended to confirm its structural identification through retention index comparison, co-injection with authentic standards, and the use of complementary techniques such as GC-MS/MS or NMR [107,108,109]. This approach will validate the authenticity of the compound and consolidate its role as a chemical marker distinguishing M. mollis in Peru.
Although the techniques employed enabled the characterization of the essential oils, Raman spectroscopy showed limitations in differentiating structural isomers or stereoisomers and could not detect compounds or chemical families present at very low concentrations. Likewise, GC–MS encountered difficulties with dense or low-volatility oils, such as that of C. nobile, restricting the complete identification of all constituents. Future studies are therefore recommended to optimize analytical methods for detecting minor or low-volatility compounds not captured by current techniques; to investigate how environmental conditions in different growing areas may influence the biosynthesis of volatile compounds—potentially leading to the formation of distinct ecotypes; and to evaluate the industrial applications of these essential oils in light of their unique chemical composition and bioactive properties.

3. Materials and Methods

3.1. Plant Material and Sampling

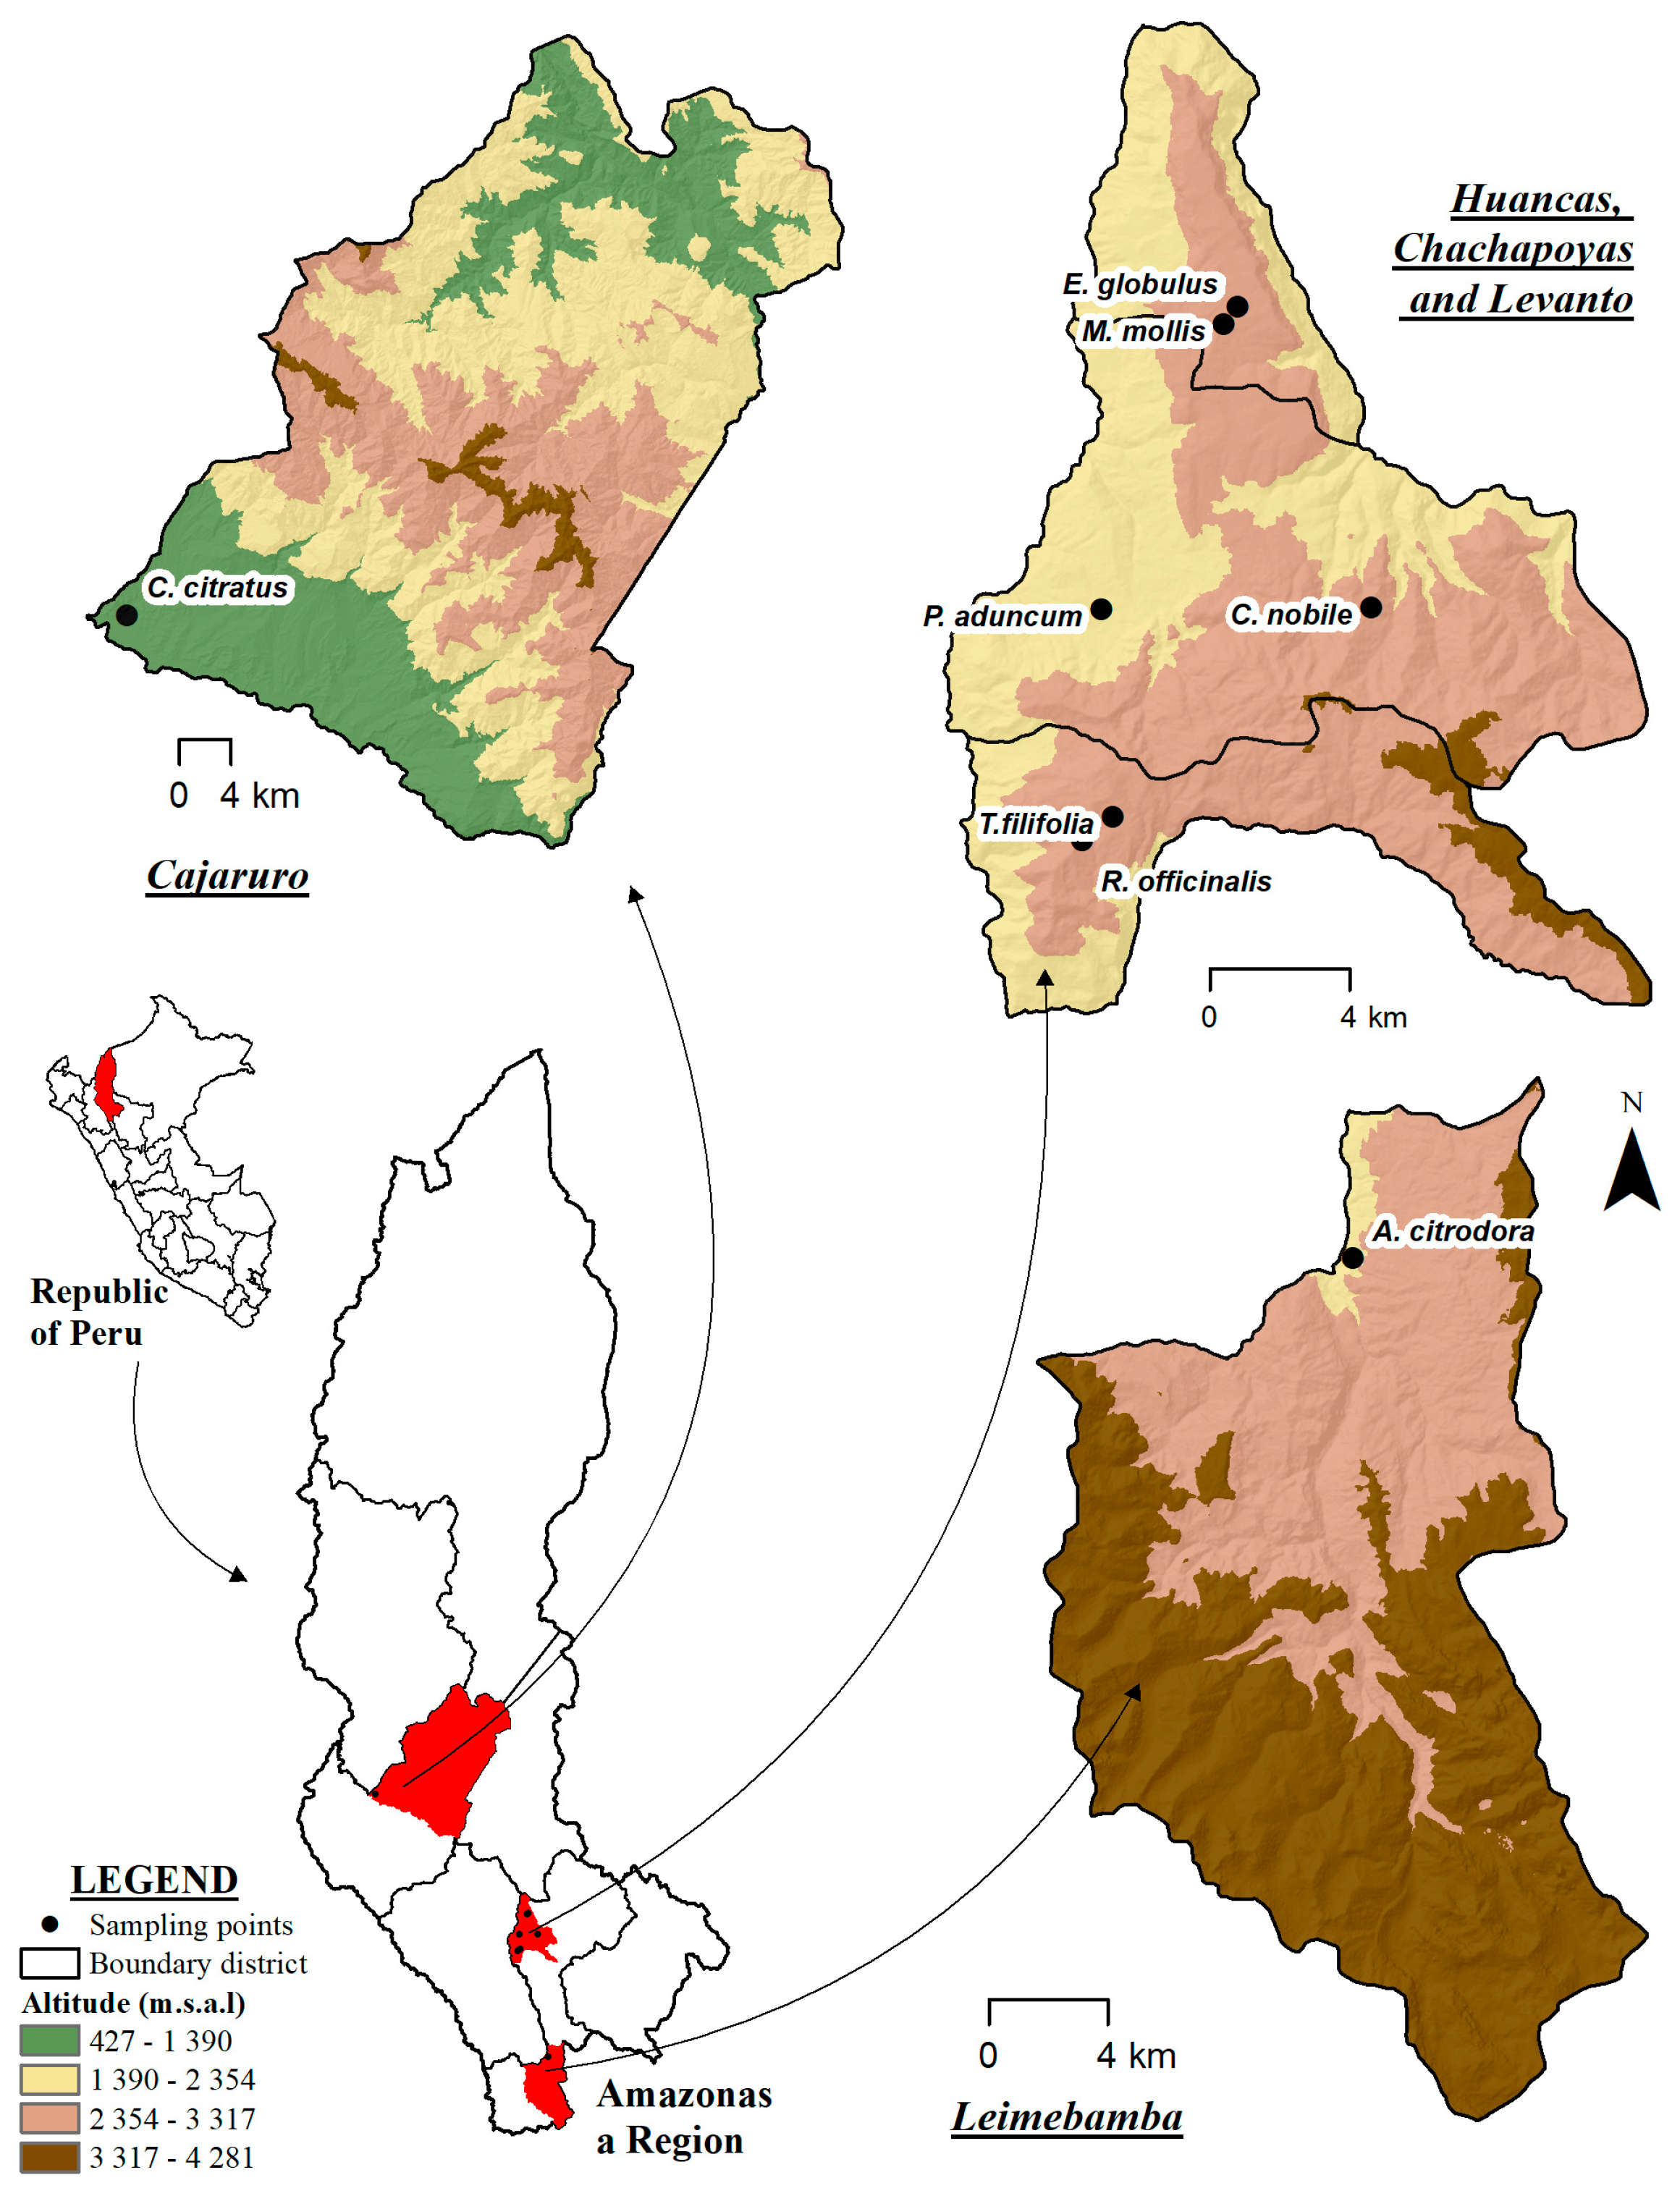
Eight species of aromatic medicinal plants were studied, as detailed in Table 2. The analyzed species were anise (T. filifolia), lemon verbena (A. citrodora), eucalyptus (E. globulus), lemongrass (C. citratus), matico (P. aduncum), poleo (M. mollis), and rosemary (R. officinalis) (Figure 5 and Figure S1). The taxonomic identification of the species was verified by the Kuelap Herbarium of the Universidad Nacional Toribio Rodríguez de Mendoza (UNTRM). Plant material was collected during the peak flowering stage, obtaining stems, leaves, and flowers depending on the species, between February and March 2024, in the Amazonas region, Peru. The species T. filifolia, E. globulus, C. citratus, M. mollis, C. nobile, P. aduncum, and R. officinalis were collected directly from the field, whereas A. citrodora was purchased fresh from the central market of Chachapoyas. For each species, 15 kg of plant material were collected, distributed in three replicates of 5 kg each. The collected leaves were transported in containers to the Engineering Laboratory of UNTRM for washing and subsequent air-drying at 21 °C, with an average drying time of two days, prior to distillation.

3.2. Essential Oil Extraction (EO)

The extraction of essential oils (EO) from the eight aromatic medicinal plants was performed following the procedure described by Vasquez-Gomez et al. [110], with minor modifications. Steam distillation was carried out using a TECNAL TE-2761 apparatus (Piracicaba, Brazil) at a temperature of 130 °C. For each species, 15 kg of plant material were processed in three independent replicates, with a distillation time of 4 h per sample. The water–oil mixture obtained after distillation was cooled to 1 °C to promote phase separation (aqueous and oily layers). The essential oil phase was then carefully decanted and collected for each species. The EO were stored in amber glass vials with airtight caps at 4 °C until analysis.
The essential oil yield (Table S1) was calculated according to Barbosa et al. [57] using the following equation
Y % = V W 100
where Y is the essential oil yield (%, v/w), V is the volume of essential oil obtained (mL), and W is the weight of the plant material used (g).

3.3. Raman Spectral Data Acquisition

Raman spectra of the essential oils from the eight aromatic medicinal plants were acquired using a Horiba XploRA Plus confocal Raman microscope system (Horiba Scientific, Montpellier, France), equipped with an Olympus BX41 microscope (Olympus, Tokyo, Japan) and a 50× long working distance (LWD) objective. Excitation was performed with a 532 nm laser operating at 40 mW power, using a 1200 lines/mm diffraction grating. The Raman signal was detected with a charge-coupled device (CCD) detector, covering an extended spectral range from 100 to 5000 cm−1 with a spectral resolution of 3 cm−1 [111].
For each measurement, approximately 20 µL of essential oil was placed in an aluminum crucible. Spectra were recorded with an integration time of 5 s and 10 spectral accumulations, yielding a total of 30 spectra per sample. To minimize sample heterogeneity, three independent replicates were analyzed for each essential oil, resulting in a total of 90 spectra per species. Raman peaks were assigned according to previously published literature.

3.4. Chemical Characterization by Gas Chromatography–Mass Spectrometry (GC–MS)

The chemical composition of the essential oils (EO) was determined using gas chromatography coupled with mass spectrometry (GC–MS) (GC System 7890B, MSD 5977B, Agilent Technologies, Santa Clara, CA, USA) following Adams [112]. The EO were diluted (1 μL of essential oil + 49 μL of hexane), and 0.5 μL of the resulting solution was injected in splitless mode. Chromatographic separation was performed on a DB-5MS UI capillary column (60 m × 0.25 mm × 1.0 μm). Helium was used as the carrier gas at a constant flow rate of 1 mL/min. The injector, detector, transfer line, and ion source were maintained at 220, 150, 240, and 280 °C, respectively. The oven temperature was set at 60 °C, then increased at a rate of 3 °C/min up to 246 °C and held for 15 min. Mass spectra were recorded in scan mode over a mass range of 40–600 m/z. Detected compounds were identified by comparison with the National Institute of Standards and Technology Library (NIST Library 17). Data were deconvoluted using MassHunter Unknowns Analysis software (version 10.1 build 10.1.733.0, Agilent Technologies), considering a similarity index ≥ 80%. The linear retention index (LRI) was calculated to confirm compound identification by injecting a commercial n-alkane standard mixture containing (C8–C20, ~40 mg/L each, in hexane, Supelco, Sigma-Aldrich, St. Louis, MO, USA) under the same chromatographic conditions applied to the essential oil samples.
The data obtained by GC-MS were processed by integrating the areas of the peaks of the total ion chromatogram (TIC) corresponding to each compound. The areas were normalized with respect to the total signal and expressed as relative peak areas (%), which provided semi-quantitative information that was subsequently used in multivariate analyses (PCA and HCA).

3.5. Analysis of Raman and GC–MS Spectral Data

Raman spectral data from the essential oils of the eight aromatic medicinal plants were preprocessed following the protocols described by Castro-Alayo et al. [113]. The preprocessing included data smoothing, baseline correction (200–3100 cm−1), vector normalization, and substrate removal using Solo+MIA 8.1 software (Eigenvector Research, Inc., Wenatchee, WA, USA).
Subsequently, a principal component analysis (PCA) was performed to reduce data dimensionality and visualize clustering patterns among the essential oils based on their chemical composition. Hotelling’s T2 and Q residual statistics were computed at a 95% confidence level to identify and remove anomalous spectra considered as outliers. Additionally, a hierarchical cluster analysis (HCA) was conducted to complement the PCA and confirm the formation of distinct groups among the essential oils. The combination of these multivariate methods enabled the identification of similarity patterns and validation of the obtained groupings.
For the multivariate processing of GC–MS data, the detected compounds were classified according to their chemical families, and PCA and HCA were again applied using RStudio software (version 4.3.3, Boston, MA, USA). This approach facilitated the identification of similarity patterns, visualization of clustering based on chemical composition, and verification of group consistency, thereby complementing the results obtained from Raman analysis.

4. Conclusions

The integration of Raman spectroscopic and chromatographic (GC–MS) analyses enabled a comprehensive characterization of essential oils obtained from eight aromatic medicinal species (T. filifolia, A. citrodora, C. citratus, E. globulus, C. nobile, P. aduncum, M. mollis, and R. officinalis). The results revealed that interspecific differences were primarily associated with the relative proportion of oxygenated compounds (alcohols, aldehydes, and esters) versus aromatic hydrocarbons and terpenoids. Raman spectra exhibited characteristic bands corresponding to C–H, C=C, C–O, and C=O stretching vibrations, reflecting the presence of aromatic and olefinic structures typical of mono- and sesquiterpenes. These findings were corroborated by GC–MS, which identified 224 compounds across nine chemical families, with terpenoids predominating (>70% in most species). Major metabolites included β-caryophyllene (18.26% and 11% in R. officinalis and P. aduncum, respectively), citronellol (10.92% in A. citrodora), citral (2.35% in T. filifolia), geraniol (6.06% in C. citratus), β-pinene and myrcene (8.21% and 8.49% in E. globulus), and cis,cis-nepetalactone (30.16% in M. mollis). The detection of cis,cis-nepetalactone in M. mollis constitutes a significant scientific contribution, representing the first report of this lactone in the species and opening new perspectives for research on its structure and biological potential. Furthermore, the observed correlation between vibrational profiles and GC–MS quantifications highlights the effectiveness of the complementary Raman and GC–MS approach as a rapid, reproducible, and non-destructive method for essential oil characterization.

Supplementary Materials

The following supporting information can be downloaded at: https://www.mdpi.com/article/10.3390/ijms262311254/s1.

Author Contributions

Conceptualization, M.G.-S., E.M.C.-A., J.L.M. and J.R.D.-V.; methodology, M.G.-S., L.T.-V., E.M.C.-A., M.G.V.-E. and A.C.C.; software, M.G.-S., K.R.-G., L.T.-V., A.C.C. and E.M.C.-A.; validation, M.G.-S., E.M.C.-A., J.L.M. and C.R.B.-Z.; formal analysis, M.G.-S., K.R.-G., L.T.-V., E.M.C.-A. and A.C.C.; investigation, M.G.-S., E.M.C.-A., J.R.D.-V. and J.L.M.; resources, M.G.-S., E.M.C.-A. and J.L.M.; data curation, M.G.-S., K.R.-G., M.G.V.-E. and C.R.B.-Z.; writing—original draft preparation, M.G.-S., K.R.-G., E.M.C.-A., I.S.C.-C. and C.R.B.-Z.; writing—review and editing, M.G.-S., K.R.-G., I.S.C.-C., J.R.D.-V., J.L.M. and C.R.B.-Z.; visualization, M.G.-S., K.R.-G., L.T.-V., M.G.V.-E., E.M.C.-A.; supervision, I.S.C.-C., E.M.C.-A., J.R.D.-V. and J.L.M.; project administration, M.G.-S., J.L.M. and C.R.B.-Z.; funding acquisition, M.G.-S., J.L.M. and C.R.B.-Z. All authors have read and agreed to the published version of the manuscript.

Funding

This research was funded by Consejo Nacional de Ciencia, Tecnología e Innovación (Concytec) hrough the PROCIENCIA Program in the framework of “Tesis de Pregrado y Postgrado en Ciencia, Tecnología e Innovación Tecnológica (E073-2023-01)”, according to Grant N° PE501085393-2023-PROCIENCIA. The APC was funded by Vicerrectorado de Investigación–Universidad Nacional Toribio Rodríguez de Mendoza de Amazonas.

Institutional Review Board Statement

Not applicable.

Informed Consent Statement

Not applicable.

Data Availability Statement

The raw data supporting the conclusions of this article will be made available by the authors on request.

Acknowledgments

The authors thank the Laboratorio de Biotecnología Agroindustrial Laboratoriode Ingeniería, Laboratorio de Investigación en Ingeniería de los Alimentos y Poscosecha of the Universidad Nacional Toribio Rodríguez de Mendoza de Amazonas, and Instituto de Investigación para el Desarrollo Sustentable de Ceja de Selva (UNTRM, Perú).

Conflicts of Interest

The authors declare no conflicts of interest.

References

  1. Cravero Ponso, C.; Juncos, N.S.; Di Francisco, G.; Olmedo, H.R. Antioxidant efficiency of Minthostachys mollis (Benth) Griseb. essential oil with low pulegone/MENT relation in combination with BHT. Food Biosci. 2025, 68, 106787. [Google Scholar] [CrossRef]
  2. Wawoczny, A.; Gillner, D. The Most Potent Natural Pharmaceuticals, Cosmetics, and Food Ingredients Isolated from Plants with Deep Eutectic Solvents. J. Agric. Food Chem. 2023, 71, 10877–10900. [Google Scholar] [CrossRef] [PubMed]
  3. Bolouri, P.; Salami, R.; Kouhi, S.; Kordi, M.; Asgari Lajayer, B.; Hadian, J.; Astatkie, T. Applications of Essential Oils and Plant Extracts in Different Industries. Molecules 2022, 27, 8999. [Google Scholar] [CrossRef]
  4. Damtie, D. A Review Article on the Antimicrobial and Antioxidant Essential Oils of Aromatic Plants in Ethiopia. J. Herb. Med. 2024, 48, 100948. [Google Scholar] [CrossRef]
  5. Aimad, A.; Sanae, R.; Anas, F.; Abdelfattah, E.M.; Bourhia, M.; Mohammad Salamatullah, A.; Alzahrani, A.; Alyahya, H.K.; Albadr, N.A.; Abdelkrim, A.; et al. Chemical Characterization and Antioxidant, Antimicrobial, and Insecticidal Properties of Essential Oil from Mentha pulegium L. Evid. Based Complement. Alt. Med. 2021, 2021, 1108133. [Google Scholar] [CrossRef]
  6. Nabi, M.H.B.; Ahmed, M.M.; Mia, M.S.; Islam, S.; Zzaman, W. Essential Oils: Advances in Extraction Techniques, Chemical Composition, Bioactivities, and Emerging Applications. Food Chem. Adv. 2025, 8, 101048. [Google Scholar] [CrossRef]
  7. Lawson, S.K.; Satyal, P.; Setzer, W.N. The Volatile Phytochemistry of Seven Native American Aromatic Medicinal Plants. Plants 2021, 10, 1061. [Google Scholar] [CrossRef] [PubMed]
  8. Mirković, S.; Martinović, M.; Tadić, V.M.; Nešić, I.; Jovanović, A.S.; Žugić, A. Antimicrobial and Antioxidant Activity of Essential Oils from Selected Pinus Species from Bosnia and Herzegovina. Antibiotics 2025, 14, 677. [Google Scholar] [CrossRef]
  9. Mukaila, Y.O.; Pfukwa, T.M.; Fawole, O.A. Essential Oils from South African Indigenous Plants: Extraction Techniques, Phytochemistry, Biological Activities and Applications. S. Afr. J. Bot. 2025, 180, 774–794. [Google Scholar] [CrossRef]
  10. Al-Maharik, N.; Salama, Y.; Al-Hajj, N.; Jaradat, N.; Jobran, N.T.; Warad, I.; Hamdan, L.; Alrob, M.A.; Sawafta, A.; Hidmi, A. Chemical Composition, Anticancer, Antimicrobial Activity of Aloysia citriodora Palau Essential Oils from Four Different Locations in Palestine. BMC Complement. Med. Ther. 2024, 24, 94. [Google Scholar] [CrossRef]
  11. Elangovan, S.; Mudgil, P. Antibacterial Properties of Eucalyptus Globulus Essential Oil against MRSA: A Systematic Review. Antibiotics 2023, 12, 474. [Google Scholar] [CrossRef]
  12. Monzote, L.; Scull, R.; Cos, P.; Setzer, W.N. Essential Oil from Piper aduncum: Chemical Analysis, Antimicrobial Assessment, and Literature Review. Medicines 2017, 4, 49. [Google Scholar] [CrossRef]
  13. Nieto, G.; Ros, G.; Castillo, J. Antioxidant and Antimicrobial Properties of Rosemary (Rosmarinus officinalis L.): A Review. Medicines 2018, 5, 98. [Google Scholar] [CrossRef]
  14. Olivas-Méndez, P.; Chávez-Martínez, A.; Santellano-Estrada, E.; Guerrero Asorey, L.; Sánchez-Vega, R.; Rentería-Monterrubio, A.L.; Chávez-Flores, D.; Tirado-Gallegos, J.M.; Méndez-Zamora, G. Antioxidant and Antimicrobial Activity of Rosemary (Rosmarinus officinalis) and Garlic (Allium sativum) Essential Oils and Chipotle Pepper Oleoresin (Capsicum annum) on Beef Hamburgers. Foods 2022, 11, 2018. [Google Scholar] [CrossRef]
  15. Valková, V.; Ďúranová, H.; Galovičová, L.; Borotová, P.; Vukovic, N.L.; Vukic, M.; Kačániová, M. Cymbopogon citratus Essential Oil: Its Application as an Antimicrobial Agent in Food Preservation. Agronomy 2022, 12, 155. [Google Scholar] [CrossRef]
  16. El-Kased, R.F.; El-Kersh, D.M. GC–MS Profiling of Naturally Extracted Essential Oils: Antimicrobial and Beverage Preservative Actions. Life 2022, 12, 1587. [Google Scholar] [CrossRef] [PubMed]
  17. Quispe-Sanchez, L.; Mestanza, M.; Oliva-Cruz, M.; Rimarachín, N.; Caetano, A.C.; Chuquizuta, T.; Goñas, M.; Gill, E.R.A.; Chavez, S.G. Oxidative Stability and Physicochemical Changes of Dark Chocolates with Essential Oils Addition. Heliyon 2023, 9, e18139. [Google Scholar] [CrossRef]
  18. Huang, X.; Li, H.; Ruan, Y.; Li, Z.; Yang, H.; Xie, G.; Yang, Y.; Du, Q.; Ji, K.; Yang, M. An Integrated Approach Utilizing Raman Spectroscopy and Chemometrics for Authentication and Detection of Adulteration of Agarwood Essential Oils. Front. Chem. 2022, 10, 1036082. [Google Scholar] [CrossRef] [PubMed]
  19. Elshibani, F.A.; Farouk, A.; Naili, E.E.; Mahmoud, E.; Othman, A.; Mohammed, H.A.; Elkazza, N.; Sharkasi, M.A.; Alzunaidy, N.A. GC-MS and HPLC Chemical Profile, Antioxidant, Anti-Acetylcholinesterase, and Anti-Diabetic Activities of Libyan Salvia Lanigera Herb Extract and Essential Oil. Sci. Rep. 2025, 15, 31853. [Google Scholar] [CrossRef] [PubMed]
  20. Gamal El-Din, M.I.; Youssef, F.S.; Altyar, A.E.; Ashour, M.L. GC/MS Analyses of the Essential Oils Obtained from Different Jatropha Species, Their Discrimination Using Chemometric Analysis and Assessment of Their Antibacterial and Anti-Biofilm Activities. Plants 2022, 11, 1268. [Google Scholar] [CrossRef]
  21. Sander, A.; Bival Štefan, M.; Radetić, A.; Petračić, A.; Kučić Grgić, D.; Cvetnić, M.; Parlov Vuković, J. Advanced Spectroscopic Characterization, Antioxidant and Antibacterial Activity Evaluation, and Trace Metal Analyses of Essential Oils from Star Anise, Nutmeg, Clove, Oregano, Bay Leaves, and Lemon Peel. Appl. Sci. 2024, 14, 11094. [Google Scholar] [CrossRef]
  22. Zhao, J.; Wang, M.; Lee, J.; Khan, I.A. Characterization, differentiation, and adulteration detection of peppermint essential oil: An NMR approach. J. Pharm. Biomed. Anal. 2025, 263, 116941. [Google Scholar] [CrossRef]
  23. Ait benlabchir, A.; Fikri-Benbrahim, K.; Moutawalli, A.; Alanazi, M.M.; Halmoune, A.; Benkhouili, F.Z.; Oubihi, A.; Kabra, A.; Hanoune, E.; Assila, H.; et al. GC–MS Characterization and Bioactivity Study of Eucalyptus globulus Labill. (Myrtaceae) Essential Oils and Their Fractions: Antibacterial and Antioxidant Properties and Molecular Docking Modeling. Pharmaceuticals 2024, 17, 1552. [Google Scholar] [CrossRef] [PubMed]
  24. El-Kersh, D.M.; Mostafa, N.M.; Fayez, S.; Al-Warhi, T.; Abourehab, M.A.S.; Eldehna, W.M.; Salem, M.A. GC-MS Metabolites Profiling of Anethole-Rich Oils by Different Extraction Techniques: Antioxidant, Cytotoxicity and in-Silico Enzymes Inhibitory Insights. J. Enzyme Inhib. Med. Chem. 2022, 37, 1974–1986. [Google Scholar] [CrossRef]
  25. Fenghour, H.; Bouabida, H. GC/MS Analysis, Antimicrobial, Fungicidal Activities and Toxicity of Rosmarinus Officinalis Essential Oil Plant from Algeria. Pol. J. Environ. Stud. 2025, 34, 2665–2672. [Google Scholar] [CrossRef] [PubMed]
  26. Ieri, F.; Cecchi, L.; Giannini, E.; Clemente, C.; Romani, A. GC-MS and HS-SPME-GC×GC-TOFMS Determination of the Volatile Composition of Essential Oils and Hydrosols (By-Products) from Four Eucalyptus Species Cultivated in Tuscany. Molecules 2019, 24, 226. [Google Scholar] [CrossRef] [PubMed]
  27. Qasem, A. GC-MS Analysis, Antimicrobial Activity, and Genotoxicity of Pimpinella Anisum Essential Oil: In Vitro, ADMET and Molecular Docking Investigations. Phyton 2025, 94, 809–824. [Google Scholar] [CrossRef]
  28. Huang, W.; Wang, Y.; Tian, W.; Cui, X.; Tu, P.; Li, J.; Shi, S.; Liu, X. Biosynthesis Investigations of Terpenoid, Alkaloid, and Flavonoid Antimicrobial Agents Derived from Medicinal Plants. Antibiotics 2022, 11, 1380. [Google Scholar] [CrossRef]
  29. Oliveira, M.F.L.D.; Pinheiro, J.F.; Freitas, A.S.; Mendonça, C.D.J.S.; Silva, G.S.D.; Sousa, E.R.D. Exploratory Analysis of Adulterant Detection in Essential Oils Using Infrared Spectroscopy and Chemometric Tools. J. Essent. Oil Res. 2025, 37, 357–367. [Google Scholar] [CrossRef]
  30. Rashid, H.M.; Mahmod, A.I.; Afifi, F.U.; Talib, W.H. Antioxidant and Antiproliferation Activities of Lemon Verbena (Aloysia citrodora): An In Vitro and In Vivo Study. Plants 2022, 11, 785. [Google Scholar] [CrossRef]
  31. Abd-Elhafeez, E.M.A.; Ramadan, B.R.; Abou-El-Hawa, S.H.M.; Rashwan, M.R.A. Chemical Composition and Antimicrobial Activity of Anise and Fennel Essential Oils. Assiut J. Agric. Sci. 2023, 54, 127–140. [Google Scholar] [CrossRef]
  32. Siatis, N.G.; Kimbaris, A.C.; Pappas, C.S.; Tarantilis, P.A.; Daferera, D.J.; Polissiou, M.G. Rapid Method for Simultaneous Quantitative Determination of Four Major Essential Oil Components from Oregano (Oreganum Sp.) and Thyme (Thymus Sp.) Using FT-Raman Spectroscopy. J. Agric. Food Chem. 2005, 53, 202–206. [Google Scholar] [CrossRef]
  33. Baranska, M.; Schulz, H.; Reitzenstein, S.; Uhlemann, U.; Strehle, M.A.; Krüger, H.; Quilitzsch, R.; Foley, W.; Popp, J. Vibrational Spectroscopic Studies to Acquire a Quality Control Method of Eucalyptus Essential Oils. Biopolymers 2005, 78, 237–248. [Google Scholar] [CrossRef]
  34. Jentzsch, P.V.; Ramos, L.A.; Ciobotă, V. Handheld Raman Spectroscopy for the Distinction of Essential Oils Used in the Cosmetics Industry. Cosmetics 2015, 2, 162–176. [Google Scholar] [CrossRef]
  35. Murphy, B.J.; Wilson, T.M.; Ziebarth, E.A.; Bowerbank, C.R.; Carlson, R.E. Authentication of Fennel, Star Anise, and Anise Essential Oils by Gas Chromatography (GC/MS) and Stable Isotope Ratio (GC/IRMS) Analyses. Plants 2024, 13, 214. [Google Scholar] [CrossRef] [PubMed]
  36. Henry, M.S. Chemical Composition and Bioactivity of Essential Oils from Lippia Alba and Aloysia Citrodora. Rev. Latinoam. Quím. 2024, 51, 13–15. [Google Scholar] [CrossRef]
  37. Sprea, R.M.; Fernandes, L.H.M.; Pires, T.C.S.P.; Calhelha, R.C.; Rodrigues, P.J.; Amaral, J.S. Volatile Compounds and Biological Activity of the Essential Oil of Aloysia aitrodora Paláu: Comparison of Hydrodistillation and Microwave-Assisted Hydrodistillation. Molecules 2023, 28, 4528. [Google Scholar] [CrossRef]
  38. Shala, A.Y.; Gururani, M.A. Phytochemical Properties and Diverse Beneficial Roles of Eucalyptus globulus Labill.: A Review. Horticulturae 2021, 7, 450. [Google Scholar] [CrossRef]
  39. Agnish, S.; Sharma, A.D.; Kaur, I. Nanoemulsions (O/W) Containing Cymbopogon pendulus Essential Oil: Development, Characterization, Stability Study, and Evaluation of in Vitro Anti-Bacterial, Anti-Inflammatory, Anti-Diabetic Activities. BioNanoScience 2022, 12, 540–554. [Google Scholar] [CrossRef]
  40. Noorbakhsh, F.; Ghasemi, M.M.; Maghbool, M.; Sorouri, M.; Firooziyan, S.; Osanloo, M. Preparation, Characterization, and Antibacterial Evaluation of Nanoemulsions and Chitosan Nanoparticles Containing Lemongrass Essential Oil and Citral against Staphylococcus aureus and Pseudomonas aeruginosa. BioNanoScience 2025, 15, 210. [Google Scholar] [CrossRef]
  41. Khasanah, L.U.; Ariviani, S.; Purwanto, E.; Praseptiangga, D. Chemical composition and citral content of essential oil of lemongrass (Cymbopogon citratus (DC.) Stapf) leaf waste prepared with various production methods. J. Agric. Food Res. 2025, 19, 101570. [Google Scholar] [CrossRef]
  42. Silva, T.L.M.D.; Rosa, G.I.D.; Santos, M.A.L.D.; Graf, S.L.; Maia, B.H.L.D.N.S.; Beltrame, F.L.; Ferrari, P.C. Lemongrass Essential Oil (Cymbopogon citratus (DC) Stapf.) Seasonal Evaluation and Microencapsulation by Spray-Drying. Braz. Arch. Biol. Technol. 2023, 66, e23230016. [Google Scholar] [CrossRef]
  43. Rösch, P.; Popp, J.; Kiefer, W. Raman and Surface Enhanced Raman Spectroscopic Investigation on Lamiaceae Plants. J. Mol. Struct. 1999, 480–481, 121–124. [Google Scholar] [CrossRef]
  44. Schulz, H.; Baranska, M.; Belz, H.-H.; Rösch, P.; Strehle, M.A.; Popp, J. Chemotaxonomic Characterisation of Essential Oil Plants by Vibrational Spectroscopy Measurements. Vib. Spectrosc. 2004, 35, 81–86. [Google Scholar] [CrossRef]
  45. Vargas Jentzsch, P.; Ciobotă, V. Raman Spectroscopy as an Analytical Tool for Analysis of Vegetable and Essential Oils. Flavour Fragr. J. 2014, 29, 287–295. [Google Scholar] [CrossRef]
  46. Santos, F.A.D.; Iulianelli, G.C.V.; Tavares, M.I.B. The Use of Cellulose Nanofillers in Obtaining Polymer Nanocomposites: Properties, Processing, and Applications. Mat. Sci. Appl. 2016, 7, 257–294. [Google Scholar] [CrossRef]
  47. Kampasakali, E.; Nakas, A.; Mertzanidis, D.; Kokkini, S.; Assimopoulou, A.N.; Christofilos, D. μ-Raman Determination of Essential Oils’ Constituents from Distillates and Leaf Glands of Origanum Plants. Molecules 2023, 28, 1221. [Google Scholar] [CrossRef]
  48. Vargas Jentzsch, P.; Sandoval Pauker, C.; Zárate Pozo, P.; Sinche Serra, M.; Jácome Camacho, G.; Rueda-Ayala, V.; Garrido, P.; Ramos Guerrero, L.; Ciobotă, V. Raman Spectroscopy in the Detection of Adulterated Essential Oils: The Case of Nonvolatile Adulterants. J. Raman Spectrosc. 2021, 52, 1055–1063. [Google Scholar] [CrossRef]
  49. Barak, T.H.; Bölükbaş, E.; Bardakcı, H. Evaluation of Marketed Rosemary Essential Oils (Rosmarinus officinalis L.) in Terms of European Pharmacopoeia 10.0 Criteria. Turk J. Pharm. Sci. 2023, 20, 253–260. [Google Scholar] [CrossRef] [PubMed]
  50. Micić, D.; Đurović, S.; Riabov, P.; Tomić, A.; Šovljanski, O.; Filip, S.; Tosti, T.; Dojčinović, B.; Božović, R.; Jovanović, D.; et al. Rosemary Essential Oils as a Promising Source of Bioactive Compounds: Chemical Composition, Thermal Properties, Biological Activity, and Gastronomical Perspectives. Foods 2021, 10, 2734. [Google Scholar] [CrossRef]
  51. Omar, J.; Sarmiento, A.; Olivares, M.; Alonso, I.; Etxebarria, N. Quantitative Analysis of Essential Oils from Rosemary in Virgin Olive Oil Using Raman Spectroscopy and Chemometrics. J. Raman Spectrosc. 2012, 43, 1151–1156. [Google Scholar] [CrossRef]
  52. Székely-Szentmiklósi, I.; Rédai, E.M.; Vlad, R.-A.; Szabó, Z.; Kovács, B.; Gergely, A.-L.; Albert, C.; Székely-Szentmiklósi, B.; Sipos, E. Microencapsulation of Salvia officinalis L. Essential Oil by Complex Coacervation Technology. Stud. UBB Chem. 2024, 69, 221–241. [Google Scholar] [CrossRef]
  53. Alvarado-García, P.; Soto-Vásquez, M.; Jara-Aguilar, D.; Gavidia-Valencia, J.; Guzmán-Rodríguez, N.; Rodrigo-Villanueva, E.; Beltrán, I. Antidepressant, Anxiolytic, and Antioxidant Properties of Piper Aduncum Essential Oil from Northern Peru. Pharmacogn. J. 2024, 16, 1252–1258. [Google Scholar] [CrossRef]
  54. van Baren, C.M.; Di Leo Lira, P.; Elechosa, M.A.; Molina, A.M.; Juárez, M.A.; Martínez, A.; Perelman, S.; Bandoni, A.L. New insights into the chemical biodiversity of Minthostachys mollis in Argentina. Biochem. Syst. Ecol. 2014, 57, 374–383. [Google Scholar] [CrossRef]
  55. de Luna, A.V.; Fagundes, T.D.S.F.; Ramos, Y.J.; de Araújo, M.H.; Muzitano, M.F.; Calixto, S.D.; Simão, T.L.B.V.; de Queiroz, G.A.; Guimarães, E.F.; Marques, A.M.; et al. UHPLC-HRMS/MS Chemical Fingerprinting of the Bioactive Partition from Cultivated Piper aduncum L. Molecules 2024, 29, 1690. [Google Scholar] [CrossRef] [PubMed]
  56. Strehle, K.R.; Rösch, P.; Berg, D.; Schulz, H.; Popp, J. Quality Control of Commercially Available Essential Oils by Means of Raman Spectroscopy. J. Agric. Food Chem. 2006, 54, 7020–7026. [Google Scholar] [CrossRef]
  57. Barbosa, A.J.C.; Bezerra, J.J.L.; de Araujo, H.L.S.; da Luz, M.A.; França, J.F.; Barbosa, M.F.D.S.; da Silva, M.V.; de Menezes Torres, M.D.C. Chemical Composition, Antibacterial Activity, and Antibiotic-Potentiating Effect Mediated by the Essential Oil of the Leaves of Croton urticifolius Lam. (Euphorbiaceae). Pharmacol. Res. Nat. Prod. 2025, 8, 100369. [Google Scholar] [CrossRef]
  58. Recio-Cázares, S.L.; López-Malo, A.; Ramírez-Corona, N.; Palou, E. Relationship Between the Chemical Composition and Transport Properties with the Antimicrobial Activity of Essential Oil from Leaves of Mexican Lippia (Aloysia citriodora) Extracted by Hydro-Distillation. Biointerface Res. Appl. Chem. 2023, 13, 560. [Google Scholar] [CrossRef]
  59. Malik, P.; Upadhyay, P. GC-MS Chemical profile, Antioxidant Activity, and Sun Protection Factor of Essential Oil of Tea Tree (Melaleuca alternifolia) and Rosemary (Rosmarinus officinalis L.). Orient. J. Chem. 2022, 38, 1266–1275. [Google Scholar] [CrossRef]
  60. Jedidi, S.; Aloui, F.; Selmi, H.; Jdaidi, N.; Ghribi, S.; Sebai, H. Phytochemical Profile and Antioxidant Properties of Essential Oils Isolated from the Aerial Parts of Rosmarinus officinalis L. Cultivated in Northwestern of Tunisia. Mor. J. Agric. Sci. 2022, 3, 229–233. [Google Scholar] [CrossRef]
  61. Mohammed, H.A.; Al-Omar, M.S.; Mohammed, S.A.A.; Aly, M.S.A.; Alsuqub, A.N.A.; Khan, R.A. Drying Induced Impact on Composition and Oil Quality of Rosemary Herb, Rosmarinus officinalis Linn. Molecules 2020, 25, 2830. [Google Scholar] [CrossRef]
  62. Zhang, G.; Ma, Z.; Piao, Y.; Li, N.; Bian, C.; Ren, C.; Gao, M.; Yue, W.; Guan, T. Revealing the Potential of Star Anise Essential Oil: Comparative Analysis and Optimization of Innovative Extraction Methods for Enhanced Yield, Aroma Characteristics, Chemical Composition, and Biological Activities. Food Sci. Nutr. 2024, 12, 9540–9554. [Google Scholar] [CrossRef]
  63. Zheljazkov, V.D.; Astatkie, T.; Zhalnov, I.; Georgieva, T.D. Method for Attaining Rosemary Essential Oil with Differential Composition from Dried or Fresh Material. J. Oleo Sci. 2015, 64, 485–496. [Google Scholar] [CrossRef]
  64. Bellumori, M.; Innocenti, M.; Congiu, F.; Cencetti, G.; Raio, A.; Menicucci, F.; Mulinacci, N.; Michelozzi, M. Within-Plant variation in Rosmarinus officinalis L. terpenes and phenols and their antimicrobial activity against the rosemary phytopathogens alternaria alternata and Pseudomonas viridiflava. Molecules 2021, 26, 3425. [Google Scholar] [CrossRef] [PubMed]
  65. Han, F.; Ma, G.; Yang, M.; Yan, L.; Xiong, W.; Shu, J.; Zhao, Z.; Xu, H. Chemical Composition and Antioxidant Activities of Essential Oils from Different Parts of the Oregano. J. Zhejiang Univ. Sci. B. 2017, 18, 79–84. [Google Scholar] [CrossRef]
  66. Valadares, A.C.F.; Alves, C.C.F.; Alves, J.M.; De Deus, I.P.B.; De Oliveira Filho, J.G.; Dos Santos, T.C.L.; Dias, H.J.; Crotti, A.E.M.; Miranda, M.L.D. Essential Oils from Piper aduncum Inflorescences and Leaves: Chemical Composition and Antifungal Activity against Sclerotinia sclerotiorum. An. Acad. Bras. Ciênc. 2018, 90, 2691–2699. [Google Scholar] [CrossRef]
  67. Meza, E.T.V.; Vasquez-Kool, J.; Sánchez, N.I.C.; Vieira, A.; Rodrigues, R.A.F.; Sartoratto, A.; Granados, A.D.P.F.; Tello, C.L.M.; Ruiz, A.L.T.G. Chemical Composition and Anti-Proliferative Activity of Essential Oils from Some Medicinal Plants from Cachicadán, Región La Libertad, Perú. Nat. Prod. Res. 2024, 38, 2145–2150. [Google Scholar] [CrossRef] [PubMed]
  68. Peralta-Canchis, L.P.; Schneid Kroning, I.; Zandoná, G.P.; Kleinubing, N.R.; Larre Oliveira, T.; Florentini, Á.M.; Valmor Rombaldi, C. Chemical composition of Minthostachys setosa (Briquet) and Piper elongatum (Vahl) essential oils, antistaphylococcal activity and effect on Staphylococcus aureus biofilm removal. Biocatal. Agric. Biotech. 2024, 58, 103170. [Google Scholar] [CrossRef]
  69. Ghosh, A.; Zhu, E.V.; Wang, H.; Zurek, L.; Zhu, J.J. Antibacterial Activities of Nepetalactones Against Public Health-Related Pathogens. Nat. Prod. Commun. 2021, 16, 1934578X211004875. [Google Scholar] [CrossRef]
  70. Voigt, V.; Franke, H.; Lachenmeier, D.W. Risk Assessment of Pulegone in Foods Based on Benchmark Dose–Response Modeling. Foods 2024, 13, 2906. [Google Scholar] [CrossRef]
  71. Assaggaf, H.; El Hachlafi, N.; Elbouzidi, A.; Taibi, M.; Benkhaira, N.; El Kamari, F.; Alnasseri, S.M.; Laaboudi, W.; Bouyahya, A.; Ardianto, C.; et al. Unlocking the combined action of Mentha pulegium L. essential oil and Thym honey: In vitro pharmacological activities, molecular docking, and in vivo anti-inflammatory effect. Heliyon 2024, 10, e31922. [Google Scholar] [CrossRef]
  72. Kokkini, S.; Hanlidou, E.; Karousou, R.; Lanaras, T. Variation of Pulegone Content in Pennyroyal (Mentha pulegium L.) Plants Growing Wild in Greece. J. Essent. Oil Res. 2002, 14, 224–227. [Google Scholar] [CrossRef]
  73. Luís, Â.; Domingues, F. Screening of the Potential Bioactivities of Pennyroyal (Mentha pulegium L.) Essential Oil. Antibiotics 2021, 10, 1266. [Google Scholar] [CrossRef] [PubMed]
  74. Mollaei, S.; Ebadi, M.; Hazrati, S.; Habibi, B.; Gholami, F.; Sourestani, M.M. Essential oil variation and antioxidant capacity of Mentha pulegium populations and their relation to ecological factors. Biochem. Syst. Ecol. 2020, 91, 104084. [Google Scholar] [CrossRef]
  75. Fajdek-Bieda, A.; Pawlińska, J.; Wróblewska, A.; Łuś, A. Evaluation of the Antimicrobial Activity of Geraniol and Selected Geraniol Transformation Products against Gram-Positive Bacteria. Molecules 2024, 29, 950. [Google Scholar] [CrossRef]
  76. Khwaza, V.; Aderibigbe, B.A. Antibacterial Activity of Selected Essential Oil Components and Their Derivatives: A Review. Antibiotics 2025, 14, 68. [Google Scholar] [CrossRef]
  77. Sahal, G.; Woerdenbag, H.J.; Hinrichs, W.L.J.; Visser, A.; Tepper, P.G.; Quax, W.J.; Van Der Mei, H.C.; Bilkay, I.S. Antifungal and biofilm inhibitory effect of Cymbopogon citratus (lemongrass) essential oil on biofilm forming by Candida tropicalis isolates; an in vitro study. J. Ethnopharmacol. 2020, 246, 112188. [Google Scholar] [CrossRef]
  78. Belhachemi, A.; Maatoug, M.; Canela-Garayoa, R. GC-MS and GC-FID analyses of the essential oil of Eucalyptus camaldulensis grown under greenhouses differentiated by the LDPE cover-films. Ind. Crops Prod. 2022, 178, 114606. [Google Scholar] [CrossRef]
  79. dos Santos, J.F.; Possate, M.E.D.; Almeida, M.B.D.; Melo, E.M.D.; Furtado, R.A.; Santos, L.D.S.M.; Honório, I.C.G.; de Almeida-Junior, S. Anticoagulant activity of Eucalyptus essential oils: An in vitro approach and a bioinformatics-based pharmacokinetic-pharmacodynamic analysis. J. Pharmacol. Toxicol. Methods 2025, 135, 108381. [Google Scholar] [CrossRef]
  80. Luís, Â.; Duarte, A.P.; Pereira, L.; Domingues, F. Chemical Profiling and Evaluation of Antioxidant and Anti-Microbial Properties of Selected Commercial Essential Oils: A Comparative Study. Medicines 2017, 4, 36. [Google Scholar] [CrossRef]
  81. Barbosa, L.C.A.; Filomeno, C.A.; Teixeira, R.R. Chemical Variability and Biological Activities of Eucalyptus spp. Essential Oils. Molecules 2016, 21, 1671. [Google Scholar] [CrossRef] [PubMed]
  82. Webb, H.; Lanfear, R.; Hamill, J.; Foley, W.J.; Külheim, C. The Yield of Essential Oils in Melaleuca alternifolia (Myrtaceae) Is Regulated through Transcript Abundance of Genes in the MEP Pathway. PLoS ONE 2013, 8, e60631. [Google Scholar] [CrossRef] [PubMed]
  83. Friedel, M.; Frotscher, J.; Nitsch, M.; Hofmann, M.; Bogs, J.; Stoll, M.; Dietrich, H. Light Promotes Expression of Monoterpene and Flavonol Metabolic Genes and Enhances Flavour of Winegrape Berries (Vitis vinifera L. Cv. Riesling). Aust. J. Grape Wine Res. 2016, 22, 409–421. [Google Scholar] [CrossRef]
  84. Seira, E.; Poulaki, S.; Hassiotis, C.; Poulios, S.; Vlachonasios, K.E. Gene Expression of Monoterpene Synthases Is Affected Rhythmically during the Day in Lavandula angustifolia Flowers. Physiologia 2023, 3, 433–441. [Google Scholar] [CrossRef]
  85. Dobhal, P.; Kant Purohit, V.; Chandra, S.; Rawat, S. Climate-induced changes in essential oil production and terpene composition in alpine aromatic plants. Plant Stress 2024, 12, 100445. [Google Scholar] [CrossRef]
  86. Zhang, X.; Niu, M.; Teixeira da Silva, J.A.; Zhang, Y.; Yuan, Y.; Jia, Y.; Xiao, Y.; Li, Y.; Fang, L.; Zeng, S.; et al. Identification and Functional Characterization of Three New Terpene Synthase Genes Involved in Chemical Defense and Abiotic Stresses in Santalum album. BMC Plant Biol. 2019, 19, 115. [Google Scholar] [CrossRef]
  87. Malik, T.G.; Sahu, L.K.; Gupta, M.; Mir, B.A.; Gajbhiye, T.; Dubey, R.; Clavijo McCormick, A.; Pandey, S.K. Environmental Factors Affecting Monoterpene Emissions from Terrestrial Vegetation. Plants 2023, 12, 3146. [Google Scholar] [CrossRef]
  88. Wu, Y.; Zhuo, Z.; Qian, Q.; Xu, D. Chemotaxonomic Variation of Volatile Components in Zanthoxylum Bungeanum Peel and Effects of Climate on Volatile Components. BMC Plant Biol. 2024, 24, 793. [Google Scholar] [CrossRef]
  89. Zhang, T.; Zheng, Y.; Fu, C.; Yang, H.; Liu, X.; Qiu, F.; Wang, X.; Wang, Z. Chemical Variation and Environmental Influence on Essential Oil of Cinnamomum camphora. Molecules 2023, 28, 973. [Google Scholar] [CrossRef]
  90. Dumitrescu, E.; Muselin, F.; Tîrziu, E.; Folescu, M.; Dumitrescu, C.S.; Orboi, D.M.; Cristina, R.T. Pimpinella anisum L. Essential Oil a Valuable Antibacterial and Antifungal Alternative. Plants 2023, 12, 2428. [Google Scholar] [CrossRef]
  91. Eiasu, B.K.; Dyafta, V.; Araya, H.T. Effect of Leaf Age on Essential Oil Yield and Composition in Rose-Scented Geranium. Hort. Sci. 2022, 57, 1524–1528. [Google Scholar] [CrossRef]
  92. Oğuz, I.K.; Kaplan, M. El efecto de la altitud y las propiedades del suelo sobre los componentes de aceites esenciales en la salvia turca (Salvia fruticosa Mill.). Bol. Latinoam. Caribe Plantas Med. Aromát. 2023, 22, 204–213. [Google Scholar] [CrossRef]
  93. Benković-Lačić, T.; Orehovec, I.; Mirosavljević, K.; Benković, R.; Ćavar Zeljković, S.; Štefelová, N.; Tarkowski, P.; Salopek-Sondi, B. Effect of Drying Methods on Chemical Profile of Chamomile (Matricaria chamomilla L.) Flowers. Sustainability 2023, 15, 15373. [Google Scholar] [CrossRef]
  94. Slavik, B.; Roehrer, S.; Loos, H.M.; Minceva, M.; Buettner, A. Isolation of Sesquiterpenoids from Matricaria chamomilla by Means of Solvent Assisted Flavor Evaporation and Centrifugal Partition Chromatography. Anal. Bioanal. Chem. 2021, 413, 4387–4396. [Google Scholar] [CrossRef]
  95. Rojas-Molina, J.O.; Pino, J.A.; Cevallos-Carvajal, E.R.; Zambrano-Ochoa, Z.E.; Vaca-Castro, C.E.; Molina-Borja, F.A.; Mena-Herrera, K.R. Aceite esencial de hojas de Minthostachys mollis [HBK] Griseb. del Ecuador: Extracción, composición química, capacidad antioxidante y actividad antimicrobiana. Bol. Latinoam. Caribe Plantas Med. Aromát. 2024, 23, 437–447. [Google Scholar] [CrossRef]
  96. Ruiz-Durán, J.; Torres, R.; Stashenko, E.E.; Ortiz, C. Antifungal and Antibiofilm Activity of Colombian Essential Oils against Different Candida Strains. Antibiotics 2023, 12, 668. [Google Scholar] [CrossRef]
  97. Čmiková, N.; Galovičová, L.; Schwarzová, M.; Vukic, M.D.; Vukovic, N.L.; Kowalczewski, P.Ł.; Bakay, L.; Kluz, M.I.; Puchalski, C.; Kačániová, M. Chemical Composition and Biological Activities of Eucalyptus globulus Essential Oil. Plants 2023, 12, 1076. [Google Scholar] [CrossRef] [PubMed]
  98. Morocho, V.; Chamba, A.; Pozo, P.; Montalván, M.; Suárez, A.I. Chemical Characterization and Enantioselective Analysis of Tagetes filifolia Lag. Essential Oil and Crude Extract. Plants 2024, 13, 1921. [Google Scholar] [CrossRef]
  99. Cebi, N.; Arici, M.; Sagdic, O. The Famous Turkish Rose Essential Oil: Characterization and Authenticity Monitoring by FTIR, Raman and GC–MS Techniques Combined with Chemometrics. Food Chem. 2021, 354, 129495. [Google Scholar] [CrossRef]
  100. Khaiper, M.; Poonia, P.K.; Dhanda, S.K.; Beniwal, R.; Verma, P.; Nasir, M. Seasonal variation in chemical composition and bioactivity of Eucalyptus tereticornis leaf essential oil. Biochem. Syst. Ecol. 2025, 121, 104988. [Google Scholar] [CrossRef]
  101. Niu, Y.; Xu, L.; Qiao, M.; Wang, Y. The Anti-Depression Effect and Mechanism of Harmonious rosemary Essential Oil and Its Application in Microcapsules. Materials Today Bio 2025, 31, 101546. [Google Scholar] [CrossRef]
  102. Raffo, A.; Baiamonte, I.; De Benedetti, L.; Lupotto, E.; Marchioni, I.; Nardo, N.; Cervelli, C. Exploring volatile aroma and non-volatile bioactive compounds diversity in wild populations of rosemary (Salvia rosmarinus Schleid.). Food Chem. 2023, 404, 134532. [Google Scholar] [CrossRef] [PubMed]
  103. da Costa Sobral, K.G.; Neuberger, B.; Mello, F.K.; Mallmann, M.P.; Sampaio, T.B.; Oliveira, M.S. Anticonvulsant Activity of β-Caryophyllene in Association with Pregabalin in a Seizure Model in Rats. Epilepsy Res. 2022, 179, 106842. [Google Scholar] [CrossRef]
  104. Nunes, J.D.A.; Teixeira, L.L.; Nascimento, W.M.O.; Lopes, D.C.F.; da Silva, J.K.R.; Pinto, L.C.; Santos, P.V.L.; Figueiredo, P.L.B. Seasonal variation on chemical composition and in vitro cytotoxic and anti-inflammatory activities of Myrciaria dubia (Kunth) McVaugh essential oil from Amazon. Biochem. Syst. Ecol. 2025, 121, 105001. [Google Scholar] [CrossRef]
  105. Sánchez-Tito, M.A.; Cartagena-Cutipa, R.; Flores-Valencia, E.; Collantes Díaz, I. Chemical composition and antimicrobial activity of essential oil from Minthostachys mollis against oral pathogens. Rev. Cuba Estomatol. 2025, 58, e3647. [Google Scholar]
  106. Juncos, N.S.; Cravero, C.F.; Grosso, N.R.; Olmedo, R.H. Pulegone/MENT ratio as an indicator of antioxidant activity for the selection of industrial cultivars of peperina with high antioxidant potential. Ind. Crops Prod. 2024, 216, 118770. [Google Scholar] [CrossRef]
  107. Aničić, N.; Gašić, U.; Lu, F.; Ćirić, A.; Ivanov, M.; Jevtić, B.; Dimitrijević, M.; Anđelković, B.; Skorić, M.; Nestorović Živković, J.; et al. Antimicrobial and Immunomodulating Activities of Two Endemic Nepeta Species and Their Major Iridoids Isolated from Natural Sources. Pharmaceuticals 2021, 14, 414. [Google Scholar] [CrossRef]
  108. Batume, C.; Mulongo, I.M.; Ludlow, R.; Ssebaale, J.; Randerson, P.; Pickett, J.A.; Mukisa, I.M.; Scofield, S. Evaluating Repellence Properties of Catnip Essential Oil against the Mosquito Species Aedes Aegypti Using a Y-Tube Olfactometer. Sci. Rep. 2024, 14, 2269. [Google Scholar] [CrossRef] [PubMed]
  109. Srivastava, A.; Gupta, S.; Singh, S.; Verma, R.S.; Srivastava, R.K.; Gupta, A.K.; Lal, R.K. Genetic Variability and Elite Line Selection for High Essential Oil and Nepetalactone Content in Catmint (Nepeta cataria L.). Am. J. Plant Sci. 2021, 12, 1135–1154. [Google Scholar] [CrossRef]
  110. Vasquez-Gomez, K.L.; Mori-Mestanza, D.; Caetano, A.C.; Idrogo-Vasquez, G.; Culqui-Arce, C.; Auquiñivin-Silva, E.A.; Castro-Alayo, E.M.; Cruz-Lacerna, R.; Perez-Ramos, H.A.; Balcázar-Zumaeta, C.R.; et al. Exploring Chemical Properties of Essential Oils from Citrus Peels Using Green Solvent. Heliyon 2024, 10, e40088. [Google Scholar] [CrossRef]
  111. Balcázar-Zumaeta, C.R.; Maicelo-Quintana, J.L.; Salón-Llanos, G.; Barrena, M.; Muñoz-Astecker, L.D.; Cayo-Colca, I.S.; Torrejón-Valqui, L.; Castro-Alayo, E.M. A Novel Technique Using Confocal Raman Spectroscopy Coupled with PLS-DA to Identify the Types of Sugar in Three Tropical Fruits. App. Sci. 2024, 14, 8476. [Google Scholar] [CrossRef]
  112. Adams, R.P. Identification of Essential Oil Components by Gas Chromatography/Mass Spectrometry, 4.1 ed.; Allured Business Media: Carol Stream, IL, USA, 2017. [Google Scholar]
  113. Castro-Alayo, E.M.; Torrejón-Valqui, L.; Cayo-Colca, I.; Cárdenas-Toro, F.P. Evaluation of the Miscibility of Novel Cocoa Butter Equivalents by Raman Mapping and Multivariate Curve Resolution–Alternating Least Squares. Foods 2021, 10, 3101. [Google Scholar] [CrossRef] [PubMed]
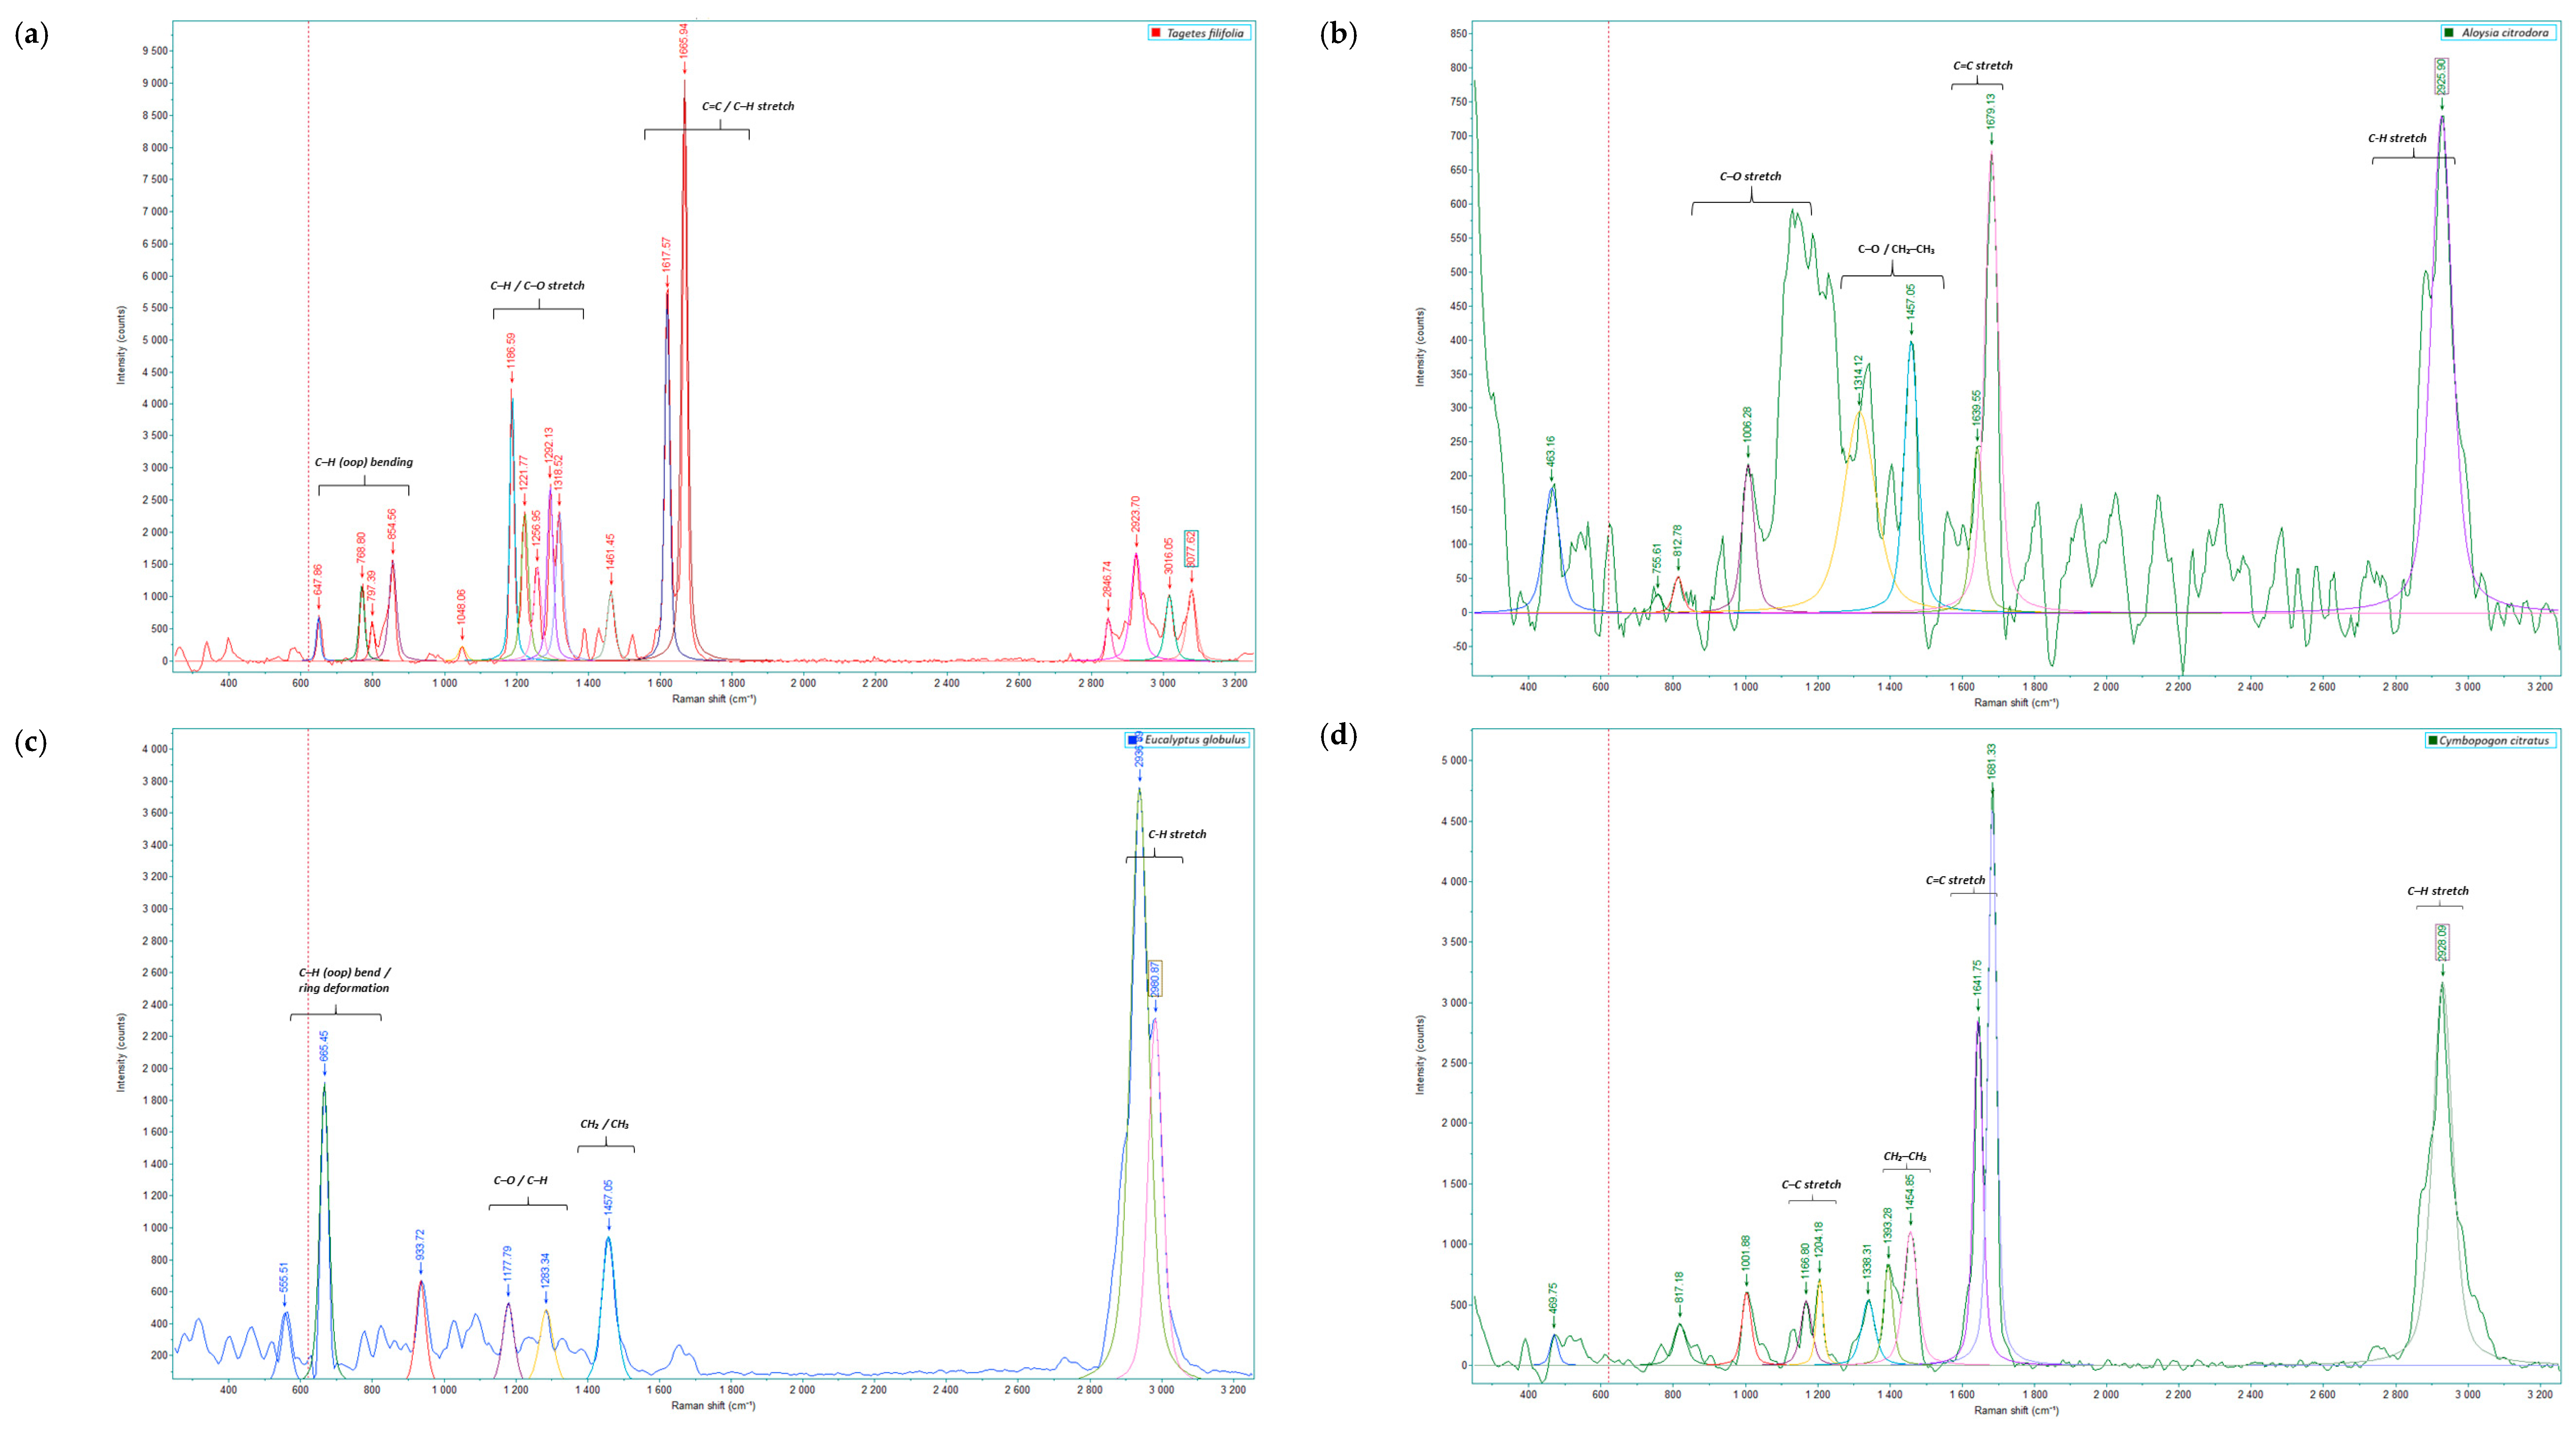
Figure 1. Representative Raman spectra of (a) Tagetes filifolia, (b) Aloysia citrodora, (c) Eucalyptus globulus, (d) Cymbopogon citratus, (e) Chamaemelum nobile, (f) Piper aduncum, (g) Minthostachys mollis, and (h) Rosmarinus officinalis in the spectral region of 200–3100 cm−1. The average spectra for each essential oil are presented in Figure S2 of the Supplementary Material.
Ijms 26 11254 g001aIjms 26 11254 g001b
Figure 2. Principal Component Analysis (PCA) and Hierarchical Classification of Plant Samples: (a) PCA scores, (b) Q vs Hotelling’s T2 in the PCA model, and (c) dendrogram.
Ijms 26 11254 g002aIjms 26 11254 g002b
Figure 3. Distribution of chemical families identified in essential oils by GC–MS analysis.
Ijms 26 11254 g003
Figure 4. Principal Component Analysis: (a) biplot of individuals and explanatory variables, and (b) correlation circle, and Hierarchical Analysis: (c) dendrogram.
Ijms 26 11254 g004aIjms 26 11254 g004b
Figure 5. Growth location of aromatic plants.
Ijms 26 11254 g005
Table 1. Areas of relative peaks (%) of the main terpenoids identified in the essential oils of seven medicinal species.
GroupCompoundR. officinalisM. mollisP. aduncumC. citratusE. globulusA. citrodoraT. filifolia
Terpenoidcis,cis-Nepetalactone0.0030.160.000.000.000.000.00
α-terpinene2.510.001.350.000.130.000.00
Citral0.000.000.000.000.400.002.35
Myrcene0.000.390.000.008.490.000.58
Sabinene0.490.860.000.000.000.000.00
β-caryophyllene18.260.0011.000.220.006.000.00
Citronellol0.000.000.000.000.0010.920.00
Linalool2.919.630.332.330.900.591.61
Terpinen-4-ol0.000.002.030.003.540.150.00
Thymol0.002.040.000.000.000.000.00
D-limonene8.596.874.590.280.006.312.81
Eucalyptol0.000.290.000.000.001.420.35
Geraniol0.000.000.006.063.133.170.39
β-pinene0.000.003.370.008.210.000.91
The table shows the relative peak areas (%) of the main terpenoids detected in essential oils by GC–MS, derived from signal normalization. The values represent semi-quantitative data.
Table 2. Taxonomic and geographical characterization of aromatic medicinal plants.
Common NameScientific NameAbbreviationBotanical FamilyGrowth HabitGeographical OriginLatitude–Longitude
AniseTagetes filifoliaT.filifoliaAsteraceaeHerbChachapoyas-Levanto−6.30625, −77.8987
Lemon verbenaAloysia citrodoraA. citrodoraVerbenaceaeChachapoyas-Leymebamba−6.7023, −77.7966
EucalyptusEucalyptus globulusE. globulusMyrtaceaeShrubChachapoyas-Huancas−6.17500, −77.7966
LemongrassCymbopogon citratusC. citratusPoaceaeHerbUtcubamba-Bagua Grande−5.7329, −78.4279
MaticoPiper aduncumP. aduncumPiperaceaeShrubChachapoyas-Chachapoyas−6.2528, −77.9016
Chamomilechamaemelum nobileC. nobileAsteraceaeHerb−6.2523, −77.8325
PennyroyalMinthostachys mollisM. mollisLamiaceaeShrub−6.1795, −77.8702
RosemaryRosmarinus officinalisR. officinalisLamiaceaeHerbChachapoyas-Levanto−6.3121, −77.9066
Disclaimer/Publisher’s Note: The statements, opinions and data contained in all publications are solely those of the individual author(s) and contributor(s) and not of MDPI and/or the editor(s). MDPI and/or the editor(s) disclaim responsibility for any injury to people or property resulting from any ideas, methods, instructions or products referred to in the content.