Comprehensive Computational Study of a Novel Chromene-Trione Derivative Bioagent: Integrated Molecular Docking, Dynamics, Topology, and Quantum Chemical Analysis
Abstract
1. Introduction
2. Result and Discussion
2.1. Molecular Geometry
2.2. Structural Properties
2.3. Vibrational Assignments
2.3.1. C-H Vibration
2.3.2. Carbon=Carbon, Carbon–Carbon, and Carbon–Carbon–Carbon Vibration
2.3.3. Methyl Group (CH3) Vibrations
2.3.4. C=O Vibration
2.4. HOMO-LUMO Analysis
2.5. Global Chemical Reactivity Descriptors (GCRD)
2.6. MEP Analysis
2.7. Natural Bond Orbital Analysis
2.8. Mulliken Charge Calculation
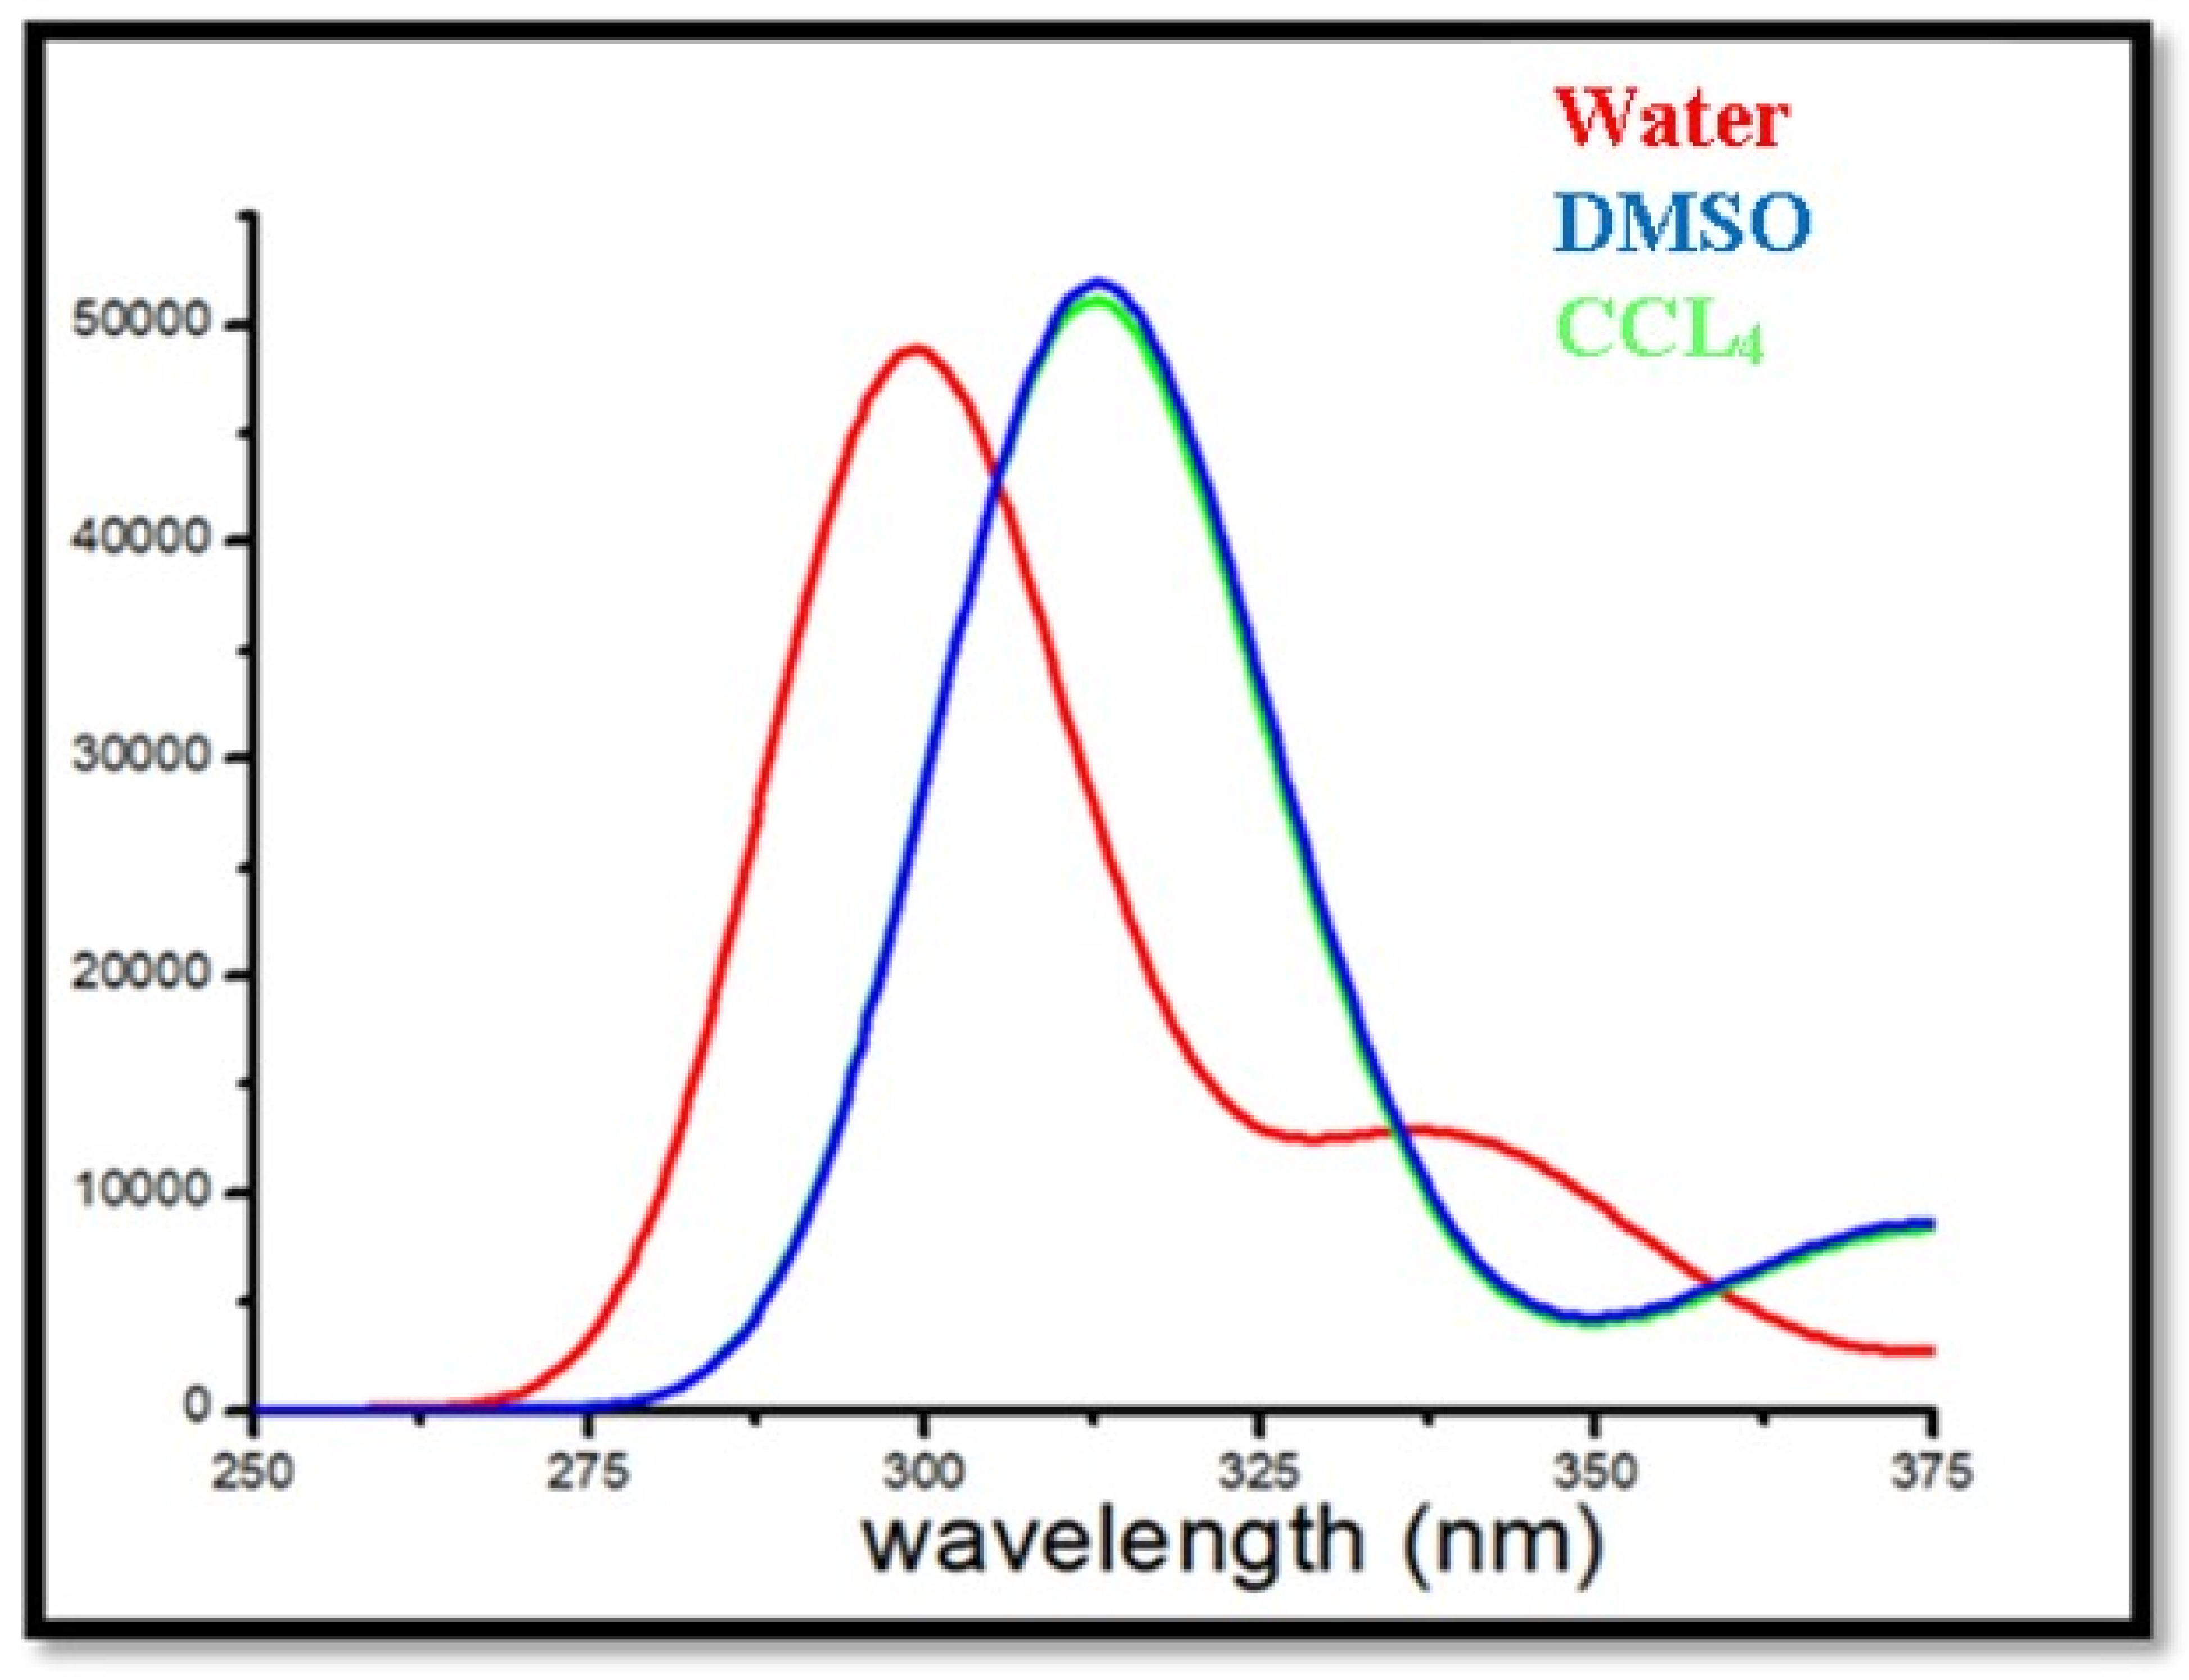
2.9. UV-Visible Spectra
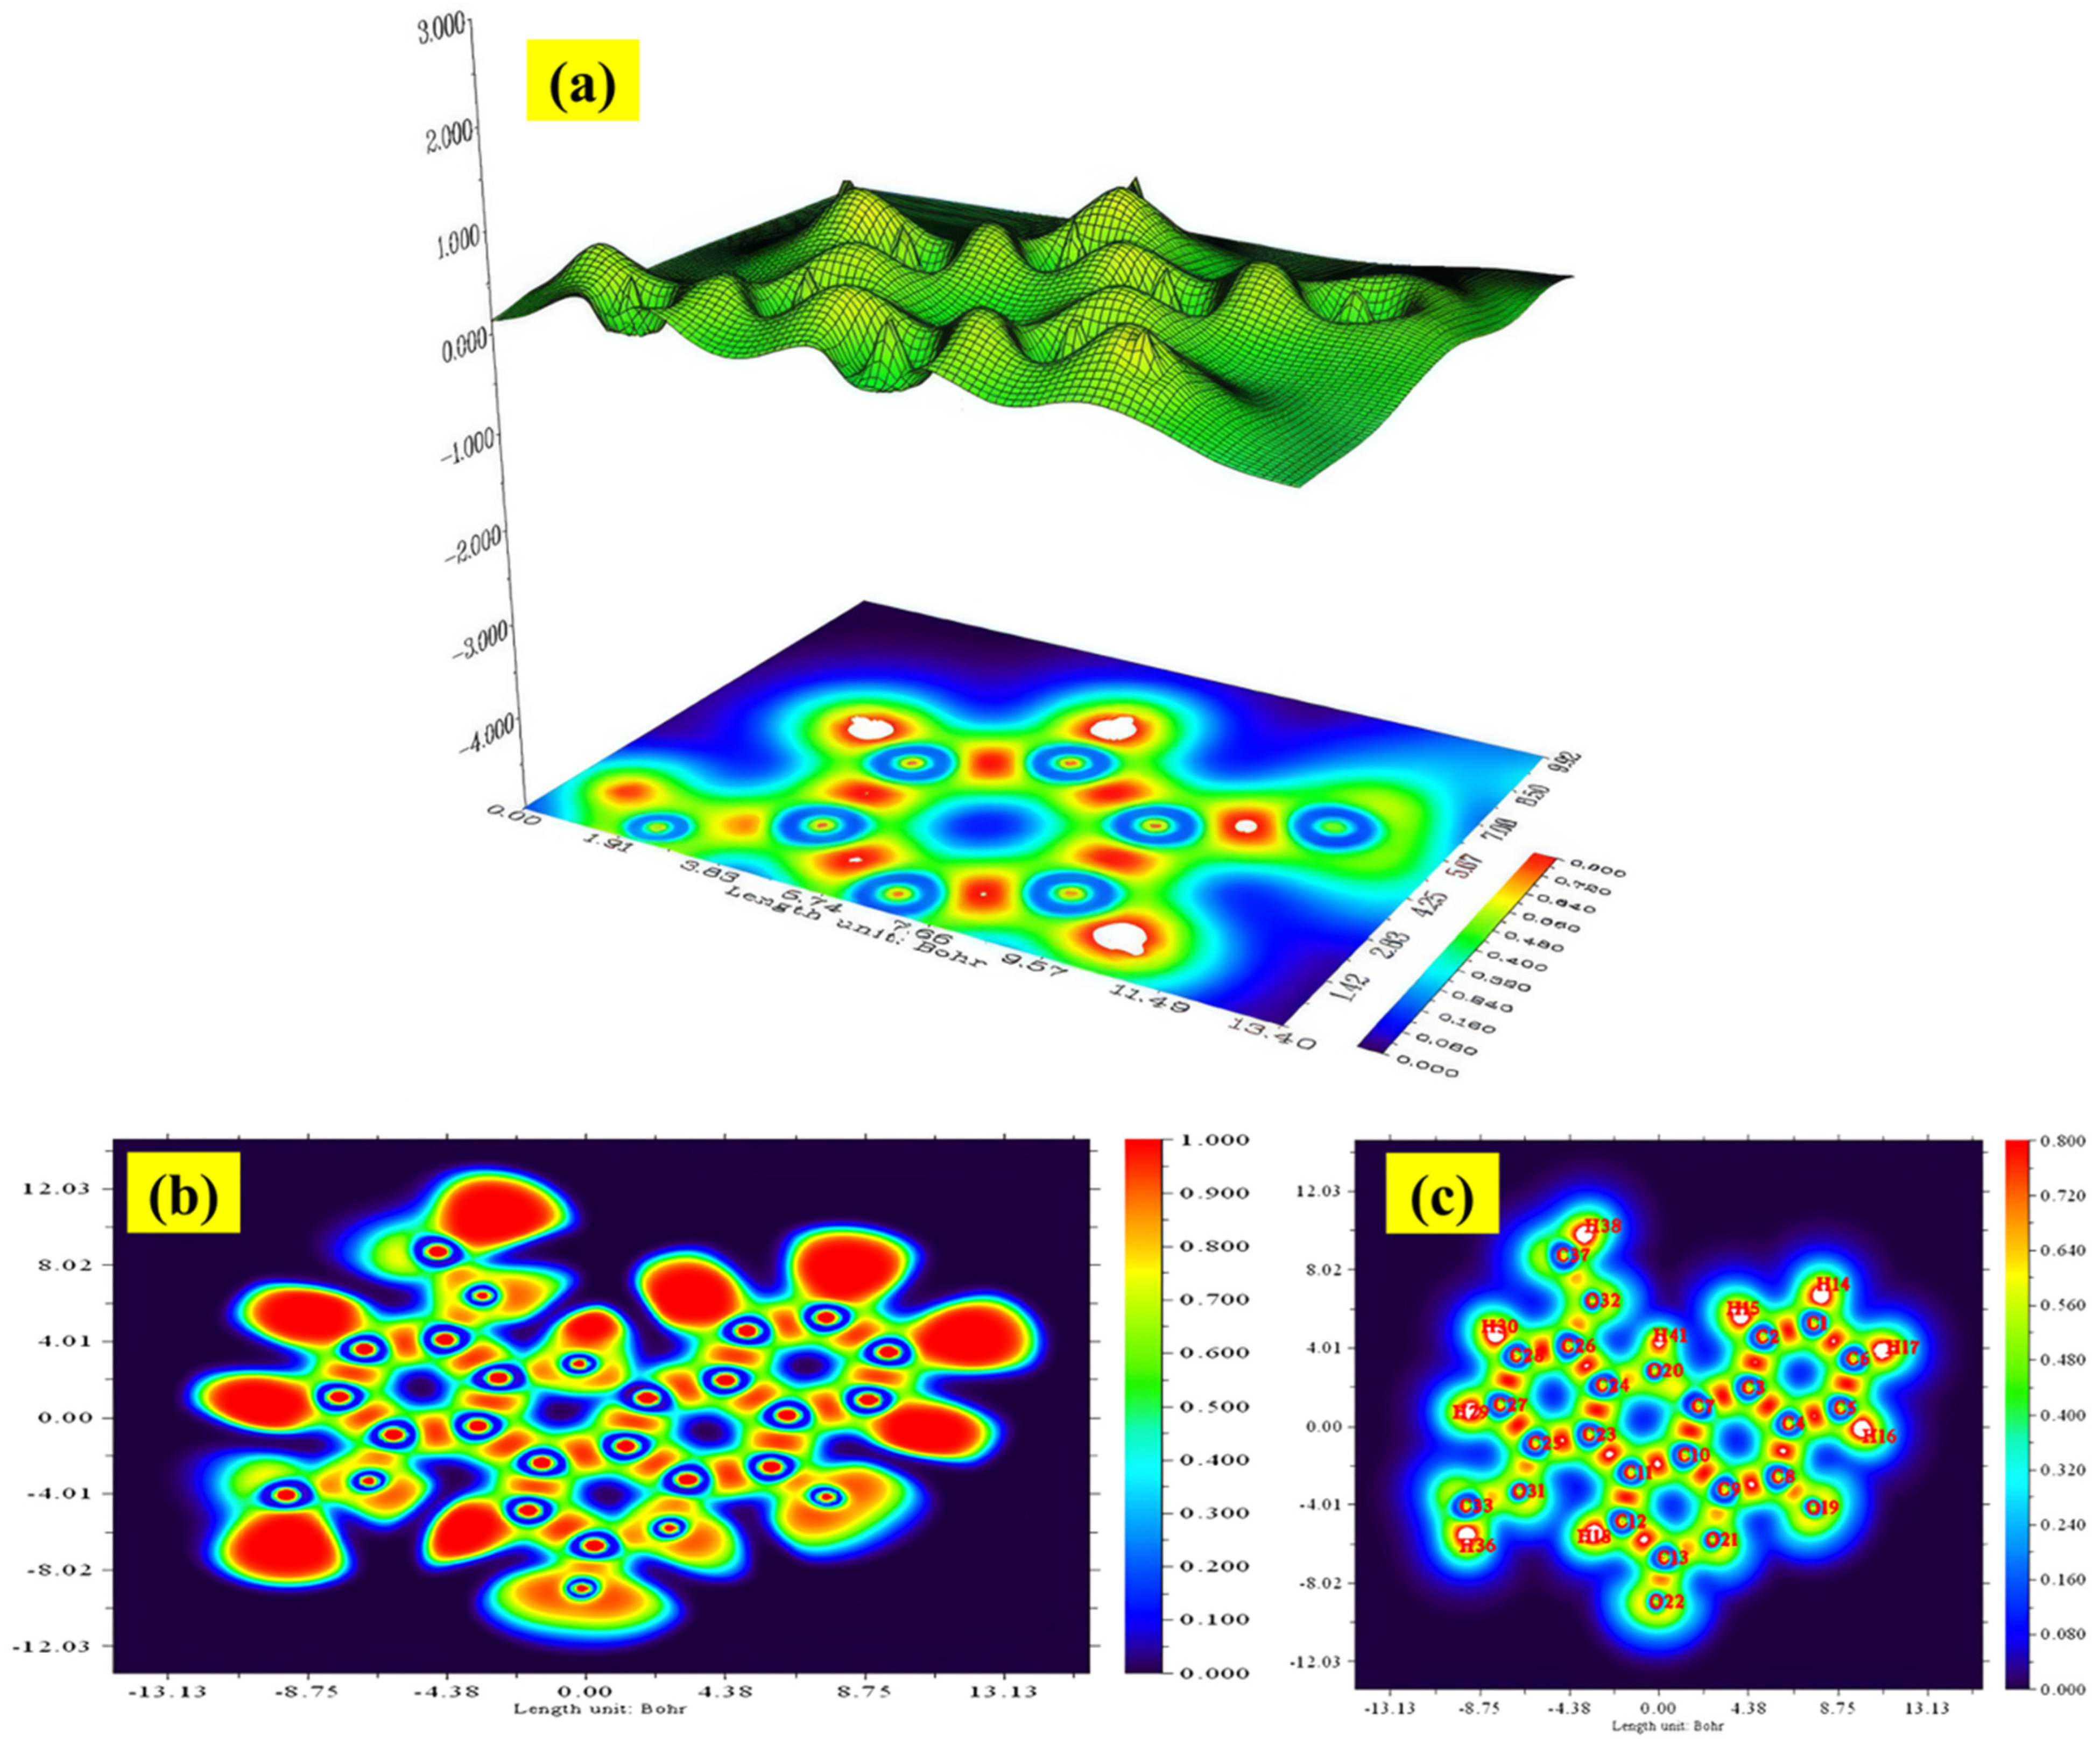
2.10. ELF and LOL Analysis
2.11. RDG Analysis
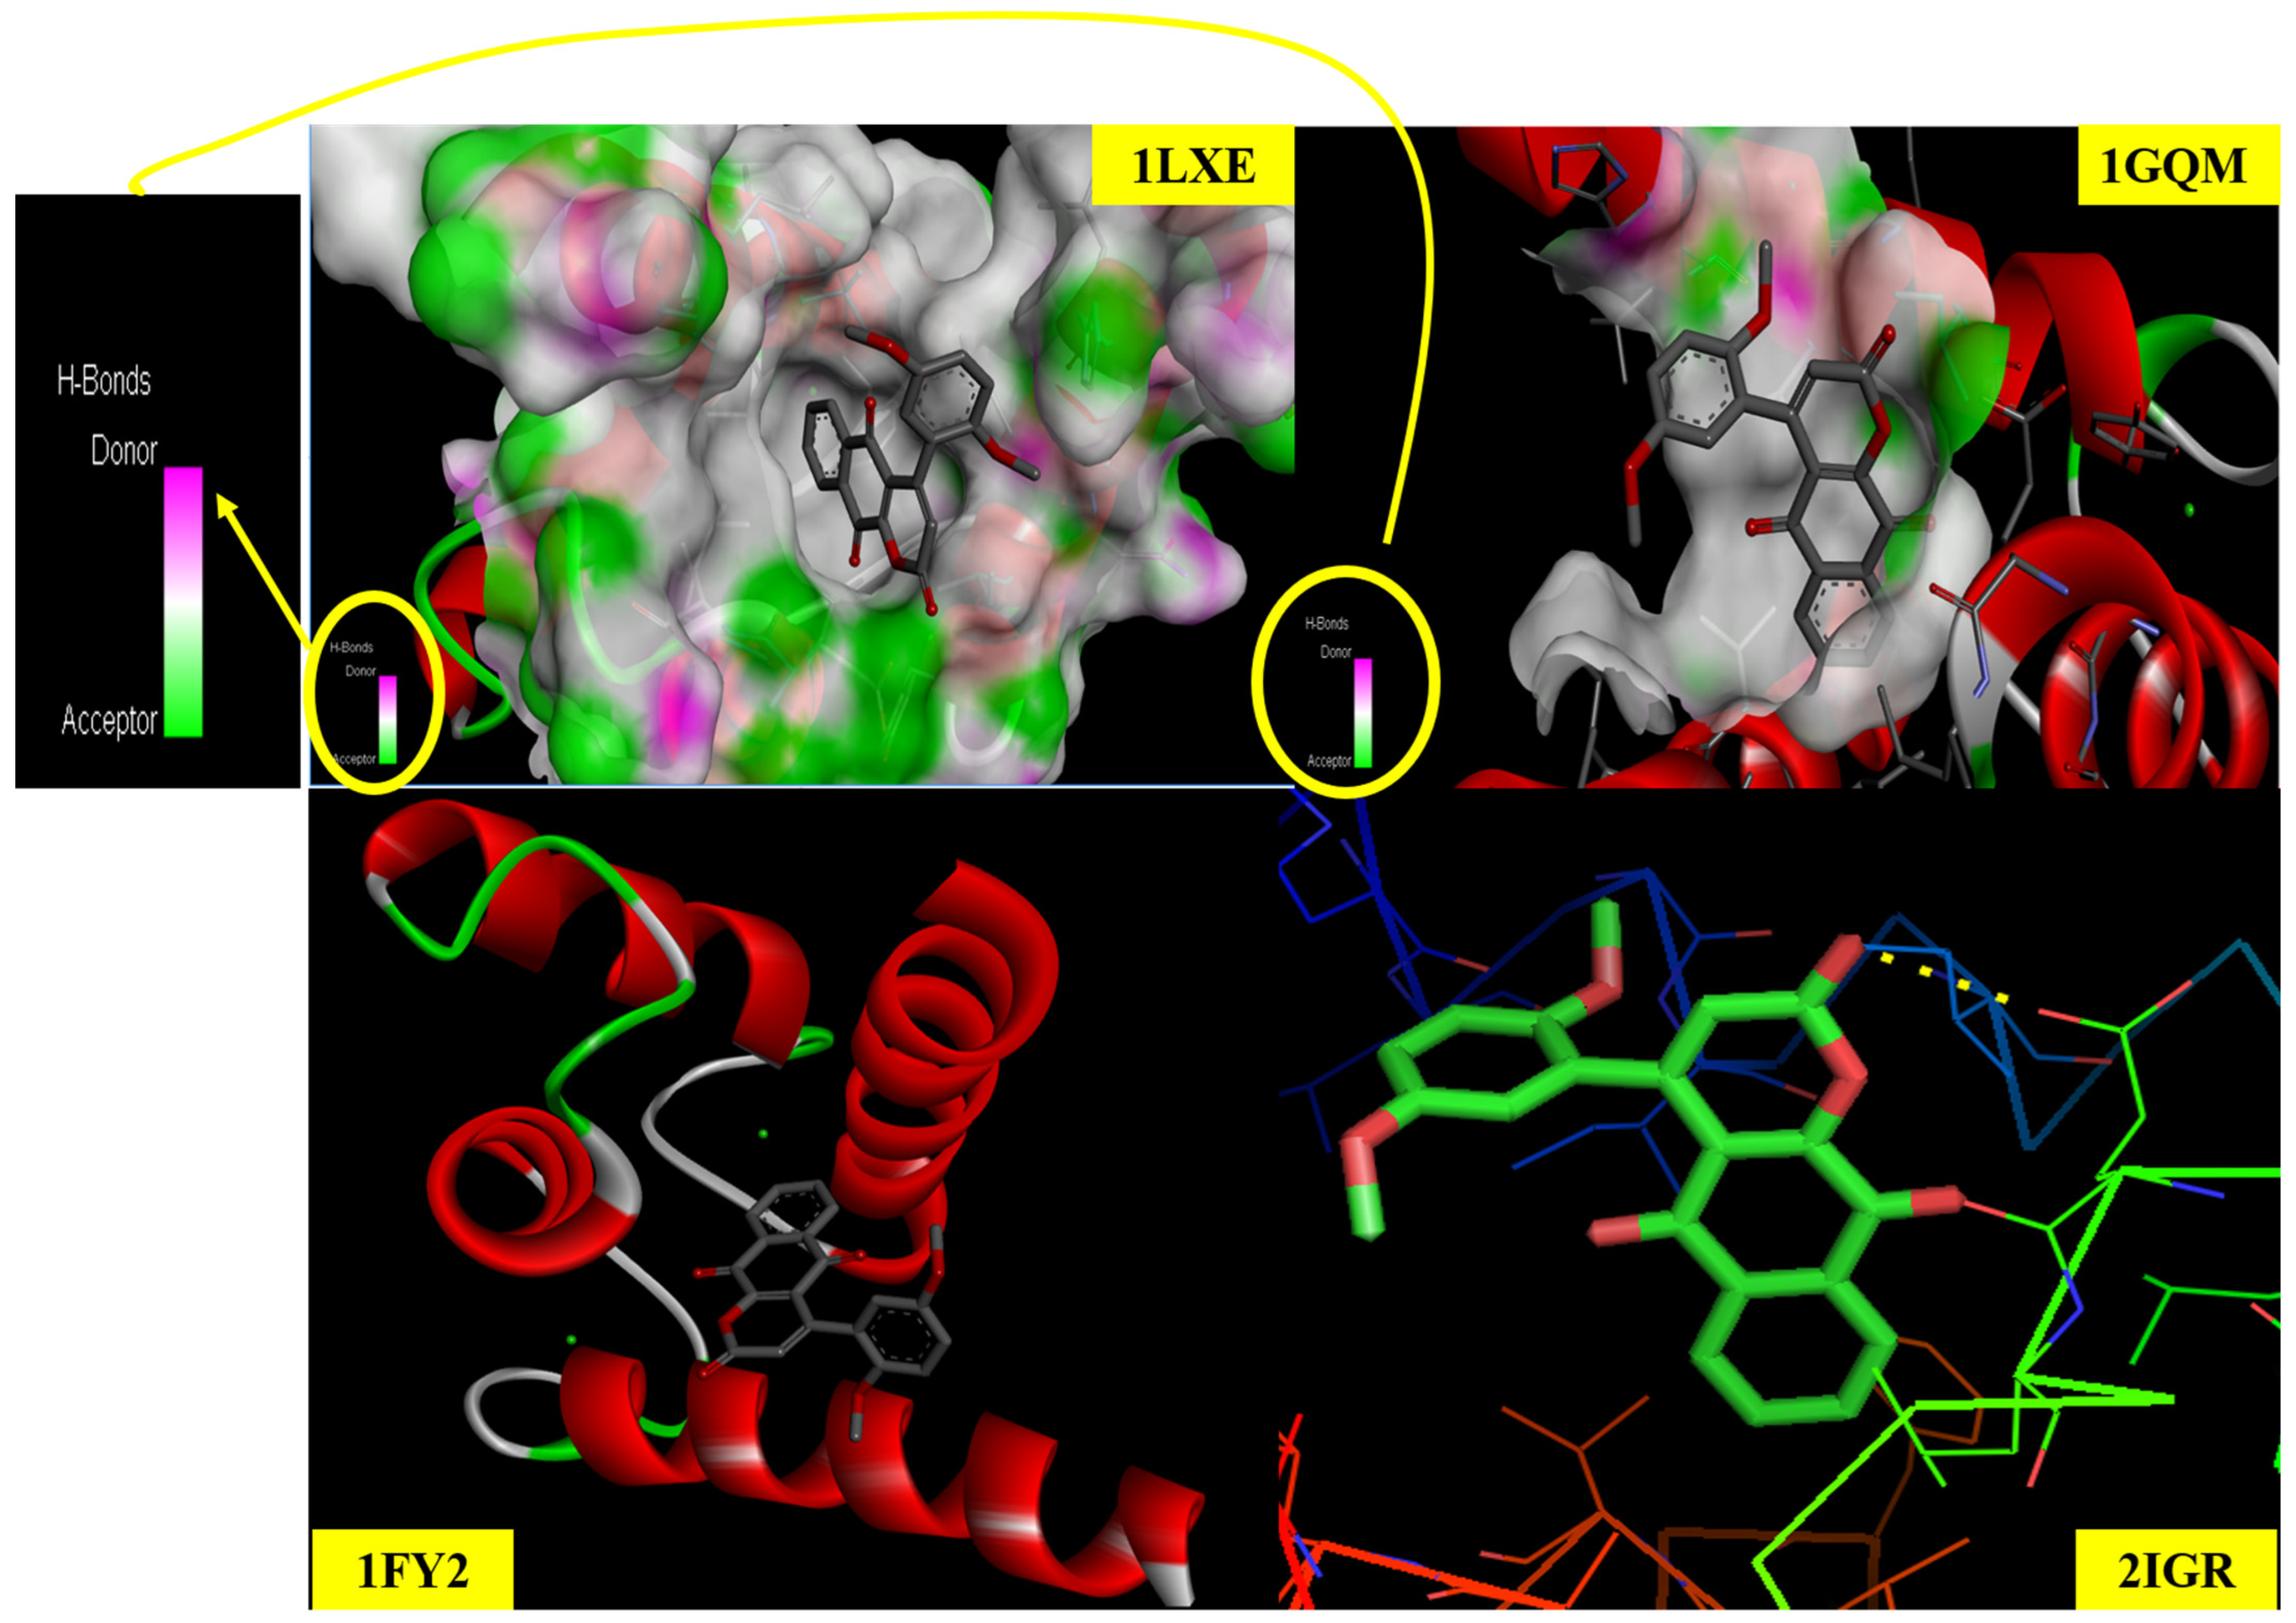
2.12. Molecular Docking Studies
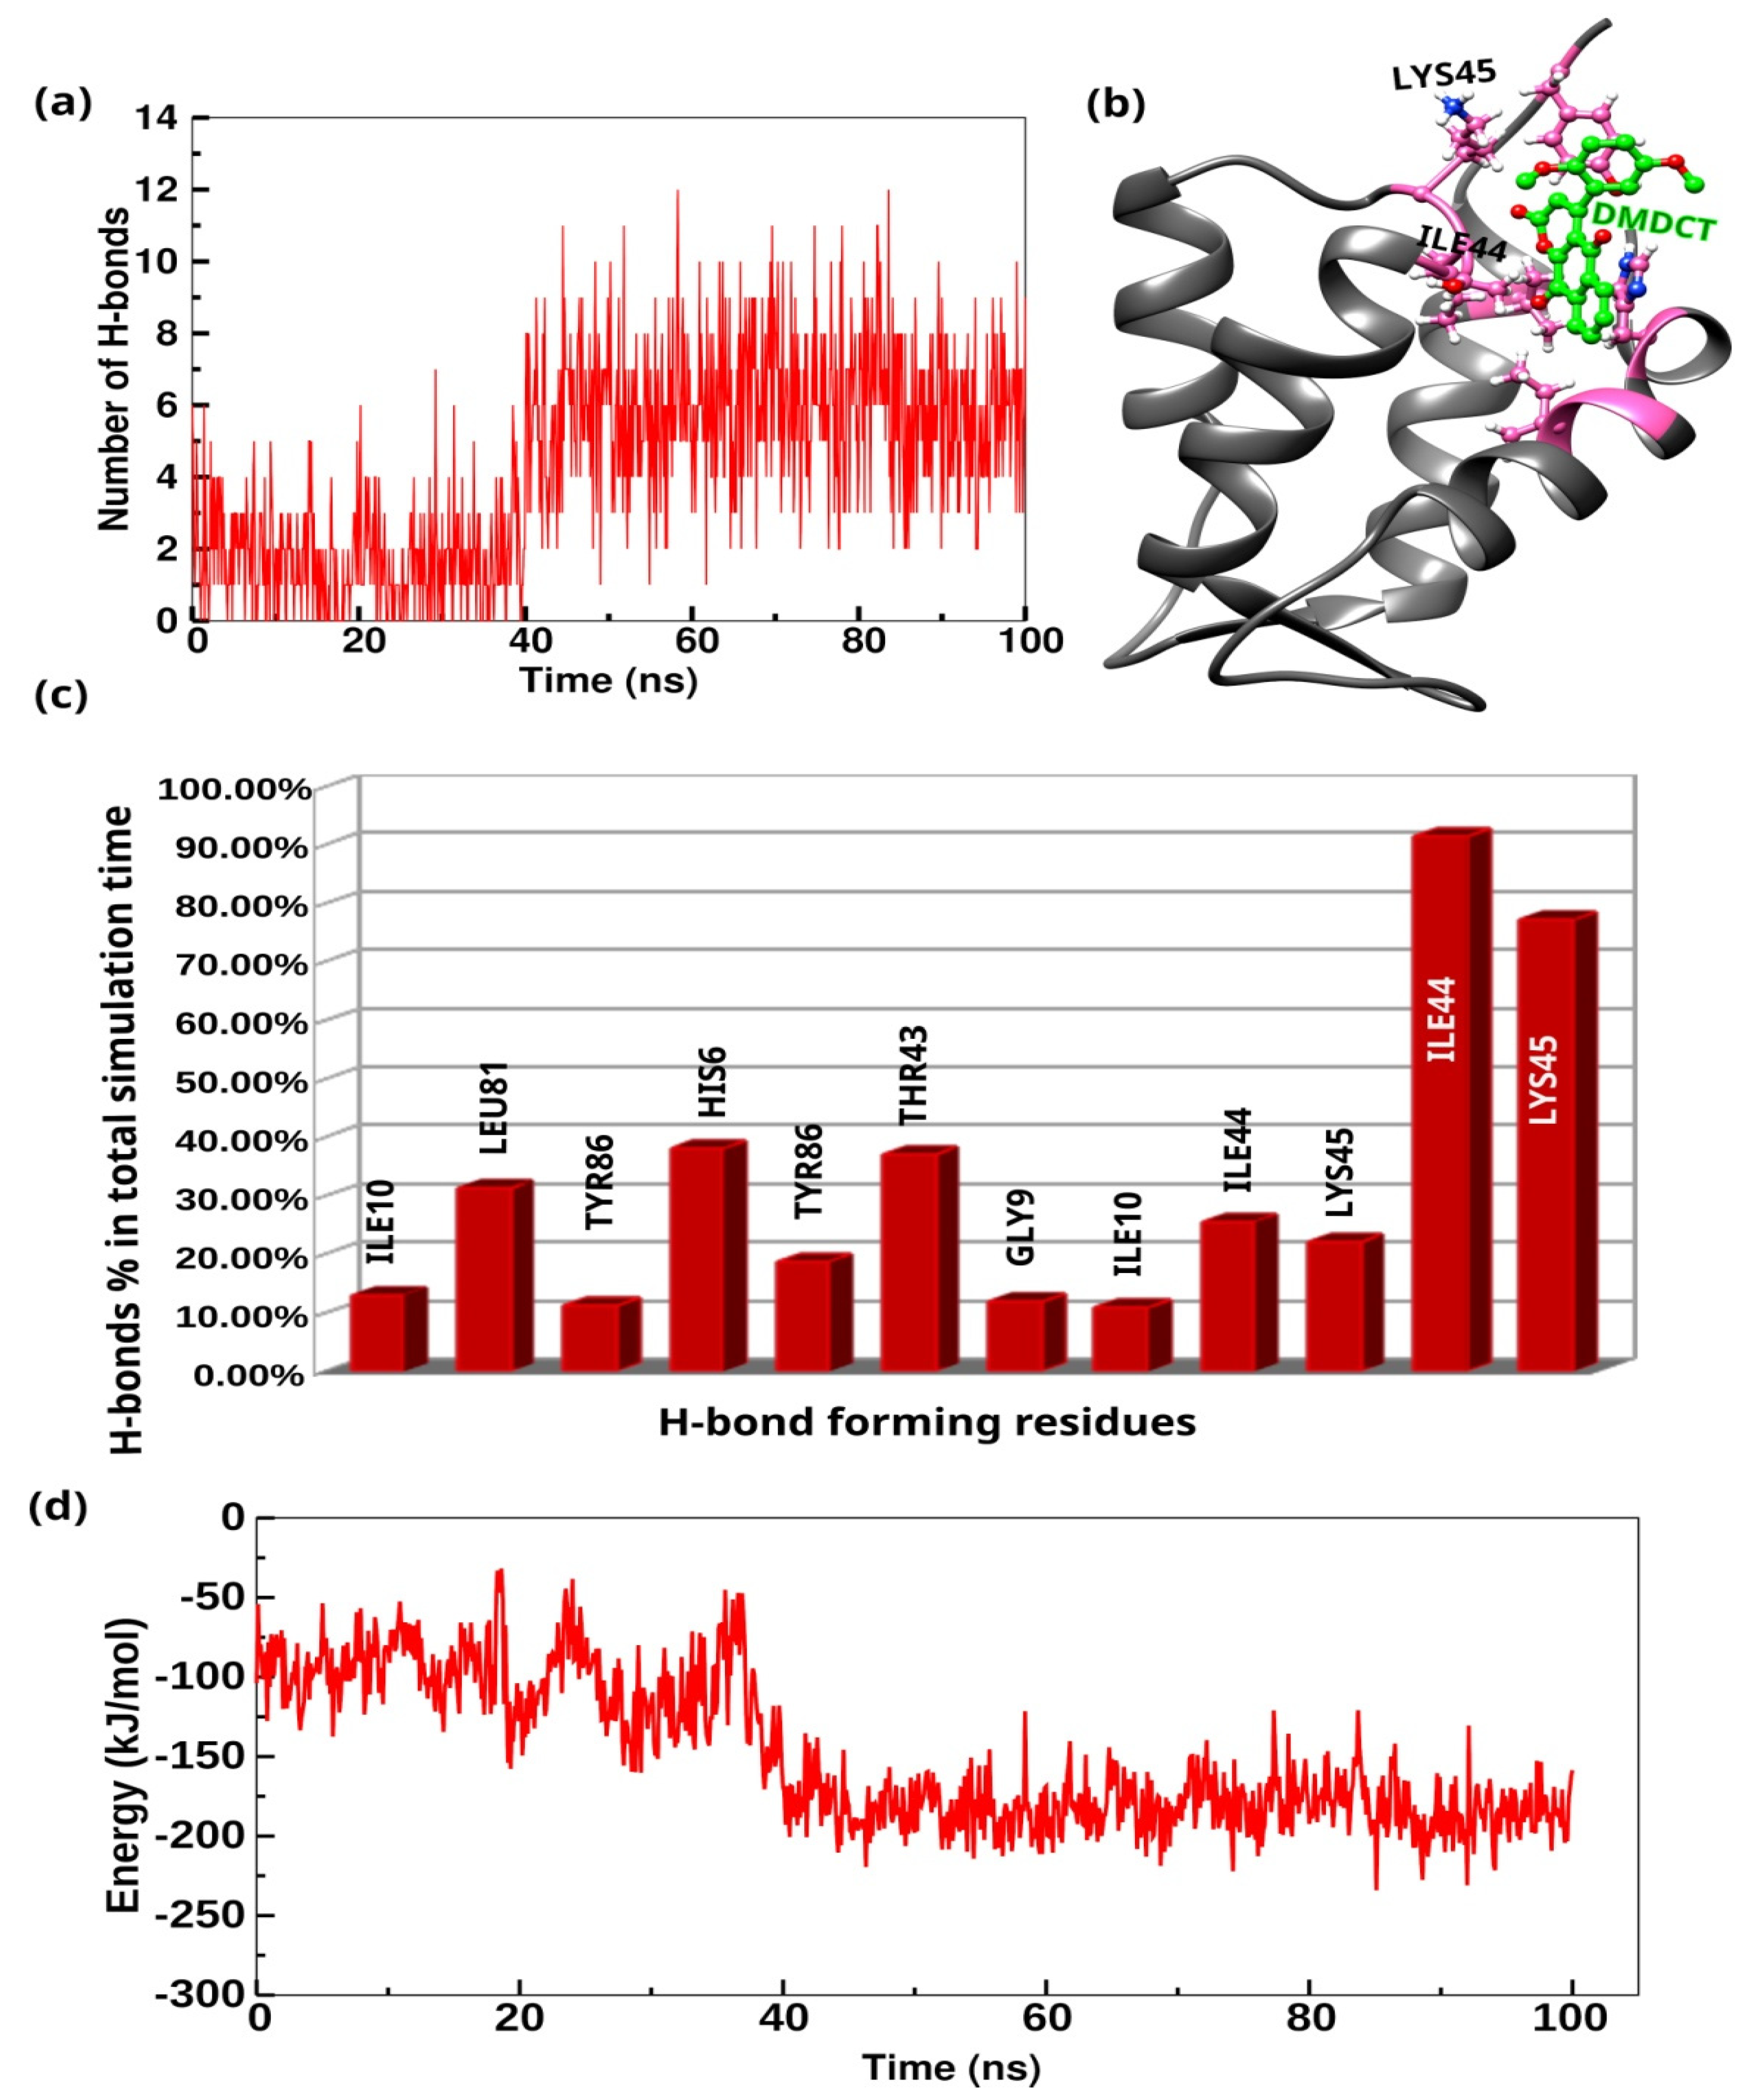
2.13. MD Simulations
3. Experimental Method
4. Computational Method
4.1. Density Functional Theory
4.2. MD (Molecular Docking) Studies
4.3. MD Simulations
4.4. Topological Investigations Studies
5. Conclusions
Author Contributions
Funding
Institutional Review Board Statement
Informed Consent Statement
Data Availability Statement
Conflicts of Interest
Abbreviations
| Rg | Radius of Gyration |
| MD | Molecular dynamics |
| PDB | Protein Data Bank |
| HOMO | Highest Occupied Molecular Orbital |
| MEP | Molecular Electrostatic Potential |
| LUMO | Energy of the lowest unoccupied molecular orbital |
| LHE | Light harvesting efficiency |
| E_LUMO | Lowest Unoccupied Molecular Orbital |
| PED | potential energy distribution |
| SPC | Simple Point Charge |
| DFT | Density Functional Theory |
| LOL | Localized Orbital Locator |
| RMSF | Root-mean-square fluctuation |
| RMSD | Root-mean-square deviation |
| LGA | Lamarckian Genetic Algorithm |
| ELF | Electron Localization Function |
| NBO | Natural Bond Orbital |
| E_HOMO | Energy of the highest unoccupied molecular orbital |
| FMO | Frontier molecular orbital |
| PME | Particle Mesh Ewald |
References
- da Silva, A.J.; Buarque, C.D.; Brito, F.V.; Aurelian, L.; Macedo, L.F.; Malkas, L.H.; Hickey, R.J.; Lopes, D.V.; Noël, F.; Murakami, Y.L.; et al. Synthesis and preliminary pharmacolgical evaluation of new (±) 1,4-naphthoquinones structurally related to lapachol. Bioorganic Med. Chem. 2002, 10, 2731–2738. [Google Scholar] [CrossRef]
- Mofakham, H.; Ghadari, R.; Shaabani, A.; Pedarpour, M.; Ghasemi, S. “On-water” organic synthesis: L-proline catalyzed synthesis of pyrimidine-2,4-dione-, benzo[g]- and dihydropyrano [2,3-g]chromene derivatives in aqueous media. J. Iran. Chem. Soc. 2013, 10, 307–317. [Google Scholar] [CrossRef]
- Verma, V.S.; Badwaik, H.R.; Vaishnav, Y.; Alexander, A. Synthesis, characterization, molecular modelling and biological evaluation of substituted benzo (h) Chromene-3-carboxylate derivatives as a potential agent for the treatment of hyperlipidemia. Indian J. Pharm. Sci. 2022, 84, 453–464. [Google Scholar] [CrossRef]
- Kajal, C.; Prima, F. Callypyrones from marine Callyspongiidae sponge Callyspongiadiffusa: Antihypertensive bis-γ-pyrone polypropionates attenuate angiotensinconverting enzyme. Nat. Prod. Res. 2021, 35, 5801–5812. [Google Scholar] [CrossRef]
- Mayada, M.E.; Nermeen, A.E.; Ahmed, M.A.; Ahmed, M.B.; Khaled, M.D.; Sameh, S.E.; Mostafa, M.S.; Safwat, A.A. In vivo determination of analgesic and anti-inflammatory activities of isolated compounds from Cleome amblyocarpa and molecular modelling for the top active investigated compounds. RSC Adv. 2024, 14, 24503–24515. [Google Scholar] [CrossRef]
- Mohd, K.H.; Mohammad, F.K.; Shahnaaz, K.; Abdullah, G.A.; Chromenes, M.S. Phytomolecules with immense therapeutic potential. In Plant-derived Bioactives: Chemistry and Mode of Action; Springer: Singapore, 2020; pp. 185–204. [Google Scholar] [CrossRef]
- Maddahi, M.; Asghari, S.; Pasha, G.F. A facile one-pot green synthesis of novel 2- amino-4 H-chromenes: Antibacterial and antioxidant evaluation. Res. Chem. Intermed. 2023, 49, 253–272. [Google Scholar] [CrossRef]
- Triveena, M.R.; Maha, A.E.; Eman, A.F. Synthetic coumarin derivatives with anticoagulation and antiplatelet aggregation inhibitory effects. Med. Chem. Res. 2023, 32, 2269–2278. [Google Scholar] [CrossRef]
- Babitha, T.D.; Raja, B.; Sathianarayanan, S.; Baskar, V.; Muthu, T.; Ginson, G.; Maksim, R.; Gokhan, Z.; Monica, G.; Domenico, M.; et al. Inhibitory Potential of Chromene Derivatives on Structural and Non-Structural Proteins of Dengue Virus. Viruses 2022, 14, 2656. [Google Scholar] [CrossRef]
- Hari, M.; Ehtesham, J.; Mohammad, R.; Nasimul, H. Recent advancements in chromone as a privileged scaffold towards the development of small molecules for neurodegenerative therapeutics. RSC Med. Chem. 2022, 13, 258–279. [Google Scholar] [CrossRef]
- Ghomashi, S.; Ghomashi, R.; Damavandi, M.S.; Fakhar, Z.; Mousavi, S.Y.; Jazi, A.S.; Gharaghani, S.; Massah, A.R. Evaluation of antibacterial, cytotoxicity, and apoptosis activity of novel chromene-sulfonamide hybrids synthesized under solvent-free conditions and 3D-QSAR modeling studies. Sci. Rep. 2024, 14, 12878. [Google Scholar] [CrossRef]
- Fouda, A.M.; Hassan, A.H.; Eliwa, E.M.; Ahmed, H.E.A.; Al-Dies, A.M.; Omar, A.M.; Nassar, H.S.; Halawa, A.H.; Aljuhani, N.; El-Agrody, A.M. Targeted potent antimicrobial benzochromene-based analogues: Synthesis, computational studies, and inhibitory effect against 14α-demethylase and DNA gyrase. Bioorganic Chem. 2020, 105, 104387. [Google Scholar] [CrossRef] [PubMed]
- El-Wahab, A.H.F.A.; Borik, R.M.; Al-Dies, A.M.; Fouda, A.M.; Mohamed, H.M.; El-Eisawy, R.A.; Sharaf, M.H.; Alzahrani, A.Y.A.; Elhenawy, A.A.; El-Agrody, A.M. Targeted potent antimicrobial and antitumor oxygen-heterocyclic-based pyran analogues: Synthesis and computational studies. Sci. Rep. 2024, 14, 9862. [Google Scholar] [CrossRef] [PubMed]
- Murali, K.V.; Rambabu, B.; Vishnu, T.; Vani, T.; Lakshmi, S.B.; Vijjulatha, M. Antioxidant and antimicrobial activities of 4H-Chromene based indole-pyrimidine hybrids: Synthesis and molecular docking studies. Chem. Biodivers. 2024, 21, e202401583. [Google Scholar] [CrossRef]
- Zhao, W.; Wang, B.; Liu, Y.; Fu, L.; Sheng, L.; Zhao, H.; Lu, Y.; Zhang, D. Design, synthesis, and biological evaluation of novel 4H-chromen-4-one derivatives as antituberculosis agents against multidrug-resistant tuberculosis. Eur. J. Med. Chem. 2020, 189, 112075. [Google Scholar] [CrossRef]
- Surendra, B.L.; Rajendra, P.Y.; Srinath, N.; Richie, R.B.; Venu, S.G.; Bontha, V.S.L.; Rahman, M.M.; Afzal, B.S. Antitubercular activity assessment of fluorinated chalcones, 2- minopyridine-3-carbonitrile and 2-amino-4H-pyran-3-carbonitrile derivatives: In vitro, molecular docking and in-silico drug likeliness studies. PLoS ONE 2022, 17, e0265068. [Google Scholar] [CrossRef]
- Lei, C.; Behnaz, A.; Ning, C.; Hongwei, L.; Chunyan, Z.; Pengfei, L.; Juan, Z. TiO2/ZnWO3 with improved photocatalytic performance in the preparation of chromeno [4,3-b]chromenes, as cardiovascular drugs. J. Mol. Struct. 2025, 1322, 140596. [Google Scholar] [CrossRef]
- Florian, S.; Madeleine, G.; Matthias, R.; Ion, A.; Bernhard, B.; Rainer, S.; Thomas, M. New naphthopyran analogues of LY290181 as potential tumor vascular-disrupting agents. Eur. J. Med. Chem. 2019, 163, 160–168. [Google Scholar] [CrossRef]
- Niloofar, J.; Ali, A.; Ehsan, S.; Mohammad, A.L.; Fatemeh, S.; Mohammad, M.; Bagher, A.; Aida, I.; Hojjat, R.; Gholamreza, H.; et al. Synthesis and evaluation of nitrochromene derivatives as potential antileishmanial therapeutics through biological and computational studies. Sci. Rep. 2025, 15, 2571. [Google Scholar] [CrossRef]
- Naya, L.R.; Elizama, S.S.; Francisco, R.M.F.; Ticiana, M.A.; Edilberto, R.S.; Ana, B.A.; Maria, J.M.; Luzia, K.A.M.L.; Almeida, M.L. Amburana cearensis (Cumaru) and its active principles as source of anti-Leishmania drugs: Immunomodulatory activity of Coumarin (1,2-Benzopyrone). Biomedicines 2025, 13, 979. [Google Scholar] [CrossRef]
- Smith, C.W.; Bailey, J.M.; Billingham, M.E.J.; Chandrasekhar, S.; Dell, C.P.; Harvey, A.K.; Hicks, C.A.; Kingston, A.E.; Wishart, G.N. The anti-rheumatic potential of a series of 2,4-disubstituted-4H-naphtho [1,2-b]pyran-3-carbonitriles. Bioorganic Med. Chem. Lett. 1995, 5, 2783–2788. [Google Scholar] [CrossRef]
- Dmitry, I.P.; Denis, S.Z.; Viktoriya, M.R.; Eduard, T.O. Chromone derivatives suppress neuroinflammation and improve mitochondrial function in the sporadic form of Alzheimer’s disease under experimental conditions, Iran. J. Basic Med. Sci. 2022, 25, 871–881. [Google Scholar] [CrossRef]
- Zhi, X.; Qingtai, C.; Yan, Z.; Changli, L. Coumarin-based derivatives with potential anti-HIV activity. Fitoterapia 2021, 150, 104863. [Google Scholar]
- Arnab, M.; Satyajit, S.; Arisha, A.; Sujisha, S.N.; Siddhartha, S.G.; Abu-Taleb, K. Lproline-catalysed synthesis of chromeno [2,3-b]chromene from 4-hydroxy-2Hchromene-2-thione and an anti-proliferative study. Org. Biomol. Chem. 2024, 22, 5333–5345. [Google Scholar] [CrossRef]
- Mahmoud, N.M.Y.; Usama, F.; Nabil, M.Y. Synthesis and anticancer activity of novel Chromene derivatives, Chromeno [2,3-d][1,3]Oxazines, and Chromeno [2,3-d] pyrimidines. Med. Chem. 2023, 19, 578–585. [Google Scholar]
- Elgaafary, M.; Fouda, A.M.; Mohamed, H.M.; Hamed, A.; El-Mawgoud, H.K.A.; Jin, L.; Ulrich, J.; Simmet, T.; Syrovets, T.; El-Agrody, A.M. Synthesis of β-enaminonitrile linked 8-methoxy-1H-benzo[f]chromene moieties and analysis of their antitumor mechanisms. Front. Chem. 2021, 9, 759148. [Google Scholar] [CrossRef]
- El Gaafary, M.; Lehner, J.; Fouda, A.M.; Hamed, A.; Ulrich, J.; Simmet, T.; Syrovets, T.; El-Agrody, A.M. Synthesis and evaluation of antitumor activity of 9-methoxy-1H-benzo[f]- chromene derivatives. Bioorganic Chem. 2021, 116, 105402. [Google Scholar] [CrossRef]
- Viji, A.; Balachandran, V.; Babiyana, S.; Narayana, B.; Saliyan, V.V. Molecular docking and quantum chemical calculations of 4-methoxy-{2-[3-(4-chlorophenyl)-5-(4-(propane-2-yl) PHENYL)-4, 5-dihydro-1H-pyrazol-1-yl]- 1, 3-thiazol-4-yl}phenol. J. Mol. Struct. 2020, 1203, 127452. [Google Scholar] [CrossRef]
- Silverstein, M.; Basseler, G.C.; Morill, G. Spectrometric Identical Cation of Organic Compound; Wiley: New York, NY, USA, 1981. [Google Scholar]
- Raja, B.; Balachandran, V.; Revathi, B.; Karabacak, M.; Periandy, S. Spectroscopic (FT-IR, FT-Raman, NMR and UV–Vis), structural, NBO and HOMO–LUMO analysis of 4-chlorobenzonitrile by quantum chemical methods. Spectrochim. Acta Part A Mol. Biomol. Spectrosc. 2015, 138, 283–295. [Google Scholar] [CrossRef]
- Krishnakumar, V.; Surumbarkuzhali, N.; Muthunatesan, S. Scaled quantum chemical studies on the vibrational spectra of 4-bromo benzonitrile. Spectrochim. Acta A 2009, 71, 1810–1813. [Google Scholar] [CrossRef]
- Altun, A.; Golcuk, K.; Kumru, M. Theoretical and Experimental Studies of Vibrational Spectra of m-Methylaniline. J. Mol. Struct. 2003, 625, 17–24. [Google Scholar] [CrossRef]
- Krishnakumar, K. FTIR and FT-Raman spectra and normal coordinate analysis of 4-chlorobenzoic acid. Indian J. Pure Appl. Phys. 2003, 41, 95–98. [Google Scholar]
- Singh, N.P.; Yadav, R.V. Vibrational spectra and normal coordinate analysis of 2-nitroaniline. Indian J. Phys. B 2001, 75, 347–355. [Google Scholar]
- Selvamani, C.; Balachandran, V.; Karabacak, M.; Periandy, S. FT-IR, FT-Raman, NMR and UV–visible spectroscopic investigation, first-order hyperpolarizability, HOMO–LUMO, NBO and thermodynamic analysis of 4-fluoro-2-methylaniline using quantum chemical calculations. Spectrochim. Acta Part A Mol. Biomol. Spectrosc. 2014, 132, 110–120. [Google Scholar] [CrossRef]
- Dollish, F.R. Characteristic Raman Frequencies of Organic Compounds; Fateley, W.G., Bentley, F.F., Eds.; Wiley: New York, NY, USA, 1974. [Google Scholar]
- Shanmugapriya, N.; Revathi, B.; Balachandran, V. Spectroscopic (FT-IR, FT-Raman, NMR and UV), HOMO–LUMO, NBO and thermodynamic analysis of 2,4-dimethoxybenzoic acid by quantum chemical methods. Heliyon 2021, 7, e07634. [Google Scholar] [CrossRef] [PubMed]
- Sivakumar, C.; Revathi, B.; Balachandran, V.; Karabacak, M.; Murugavel, P. Combined experimental and theoretical investigation on the vibrational, electronic, NBO, HOMO–LUMO, and MEP analyses of 2,3-difluoroaniline. J. Mol. Struct. 2021, 1224, 129286. [Google Scholar] [CrossRef]
- Benzon, K.B.; Balachandran, V.; Revathi, B.; Karabacak, M. FT-IR, FT-Raman, NMR and UV–visible spectra, HOMO–LUMO, NBO and thermodynamic investigation of 3-chloro-2-fluoroaniline using DFT methods. Spectrochim. Acta Part A Mol. Biomol. Spectrosc. 2015, 1425, 359–370. [Google Scholar] [CrossRef]
- Shana Praveen, S.; Balachandran, V.; Revathi, B.; Karabacak, M. FT-IR, FT-Raman, NMR and UV–Vis spectra, NBO, HOMO–LUMO, MEP and thermodynamic studies of 2-methoxybenzoic acid by DFT calculations. J. Mol. Struct. 2016, 1115, 94–104. [Google Scholar] [CrossRef]
- Al-Tamimi, A.-M.S.; Mary, Y.S.; Hassan, H.M.; Resmi, K.; El-Emam, A.A.; Narayana, B.; Sarojini, B. Sarojini Study on the structure, vibrational analysis and molecular docking of fluorophenyl derivatives using FT-IR and density functional theory computations. J. Mol. Struct. 2018, 1164, 172–179. [Google Scholar] [CrossRef]
- Viji, A.; Balachandran, V.; Babiyana, S.; Narayana, B.; Salian, V.V. FT-IR and FT-Raman investigation, quantum chemical studies, molecular docking study and antimicrobial activity studies on novel bioactive drug of 1-(2,4-Dichlorobenzyl)-3-[2-(3-(4-chlorophenyl)-5-(4-(propan-2-yl)phenyl-4,5-dihydro-1H-pyrazol-1-yl]-4-oxo-4,5-dihydro-1,3-thiazol-5(4H)-ylidence]-2,3-dihydro-1H-indol-2-one. J. Mol. Struct. 2020, 1215, 128244. [Google Scholar] [CrossRef]
- Lee, C.; Yang, W.; Parr, R.G. Development of the Colle-Salvetti Correlation-Energy Formula into a Functional of the Electron Density. Phys. Rev. B 1988, 37, 785–789. [Google Scholar] [CrossRef]
- Yu, J.; Su, N.Q.; Yang, W. Describing Chemical Reactivity with Frontier Molecular Orbitalets. JACS Au 2022, 2, 1383–1394. [Google Scholar] [CrossRef] [PubMed]
- Dennington, R.; Kerth, T.; Millam, J. GaussView, Version 5; Semicham. Inc.: Shawnee Mission, KS, USA, 2009. [Google Scholar]
- Sharma, K.; Melavanki, R.; Patil, S.S.; Kusanur, R.; Patil, N.R.; Shelar, V.M. Spectroscopic behavior, FMO, NLO and NBO analysis of two novel Aryl Boronic Acid derivatives: Experimental and Theoretical Insights. J. Mol. Struct. 2019, 1181, 474–487. [Google Scholar] [CrossRef]
- Soto, C.A.T.; Costa, A.C., Jr.; Ramos, J.M.; Vieira, L.S.; Rost, N.C.V.; Versiane, O.; Rangel, J.L.; Mondragón, M.A.; Raniero, L.; Martin, A.A. Surface enhanced Raman scattering, electronic spectrum, natural bond orbital, and mulliken charge distribution in the normal modes of diethyldithiocarbamate copper (II) complex,[Cu (DDTC)2]. Spectrochim. Acta A Mol. Biomol. Spectrosc. 2013, 116, 546–555. [Google Scholar] [CrossRef] [PubMed]
- Viji, A.; Revathi, B.; Balachandran, V.; Babiyana, S.; Narayana, B.; Salian, V.V. Analysis of spectroscopic, quantum chemical calculations, molecular docking, RDG, ELF, anticancer and antimicrobial activity studies on bioactive molecule 2-[3-(4-Chlorophenyl)-5-(4-(propane-2-yl) phenyl-4,5-dihydro-1H-pyrazol-1-yl]-4-(4-methoxyphenyl)-1,3-thiazol. Chem. Data Collect. 2020, 30, 100585. [Google Scholar] [CrossRef]
- Frisch, M.J.; Trucks, G.W.; Schlegel, H.B.; Scuseria, G.E.; Robb, M.A.; Cheeseman, J.R.; Scalmani, G.; Barone, V.; Mennucci, B.; Petersson, G.A.; et al. Gaussian 09, Revision D.01; Gaussian, Inc.: Wallingford, CT, USA, 2013. [Google Scholar]
- Morris, G.M.; Huey, R.; Lindstrom, W.; Sanner, M.F.; Belew, R.K.; Goodsell, D.S.; Olson, A.J. AutoDock4 and AutoDockTools4: Automated docking with selective receptor flexibility. J. Comput. Chem. 2009, 30, 2785–2791. [Google Scholar] [CrossRef]
- Abraham, M.J.; Murtola, T.; Schulz, R.; Páll, S.; Smith, J.C.; Hess, B.; Lindahl, E. GROMACS: High performance molecular simulations through multi-level parallelism from laptops to supercomputers. SoftwareX 2015, 1, 19–25. [Google Scholar] [CrossRef]
- Berendsen, H.J.C.; Van Der Spoel, D.; Van Drunen, R. GROMACS: A message-passing parallel molecular dynamics implementation. Comput. Phys. Commun. 1995, 91, 43–56. [Google Scholar] [CrossRef]
- Hess, B.; Kutzner, C.; van der Spoel, D.; Lindahl, E. GROMACS 4: Algorithms for highly efficient, load-balanced, and scalable molecular simulation. J. Chem. Theory Comput. 2008, 4, 435–447. [Google Scholar] [CrossRef]
- Lindahl, E.; Hess, B.; van der Spoel, D. GROMACS 3.0: A package for molecular simulation and trajectory analysis. Mol. Model. Annu. 2001, 7, 306–317. [Google Scholar] [CrossRef]
- Pronk, S.; Páll, S.; Schulz, R.; Larsson, P.; Bjelkmar, P.; Apostolov, R.; Shirts, M.R.; Smith, J.C.; Kasson, P.M.; Van Der Spoel, D.; et al. GROMACS 4.5: A high-throughput and highly parallel open source molecular simulation toolkit. Bioinformatics 2013, 29, 845–854. [Google Scholar] [CrossRef]
- Van Der Spoel, D.; Lindahl, E.; Hess, B.; Groenhof, G.; Mark, A.E.; Berendsen, H.J. GROMACS: Fast, flexible, and free. J. Comput. Chem. 2005, 26, 1701–1718. [Google Scholar] [CrossRef]
- Pettersen, E.F.; Goddard, T.D.; Huang, C.C.; Couch, G.S.; Greenblatt, D.M.; Meng, E.C.; Ferrin, T.E. UCSF Chimera—A visualization system for exploratory research and analysis. J. Comput. Chem. 2004, 25, 1605–1612. [Google Scholar] [CrossRef]
- Huang, J.; Rauscher, S.; Nawrocki, G.; Ran, T.; Feig, M.; de Groot, B.L.; Grubmüller, H.; MacKerell, A.D., Jr. CHARMM36m: An improved force field for folded and intrinsically disordered proteins. Nat. Methods 2017, 14, 71–73. [Google Scholar] [CrossRef]
- Vanommeslaeghe, K.; MacKerell, A.D., Jr. Automation of the CHARMM General Force Field (CGenFF) I: Bond perception and atom typing. J. Chem. Inf. Model. 2012, 52, 3144–3154. [Google Scholar] [CrossRef] [PubMed]
- Jorgensen, W.L.; Chandrasekhar, J.; Madura, J.D.; Impey, R.W.; Klein, M.L. Comparison of simple potential functions for simulating liquid water. J. Chem. Phys. 1983, 79, 926–935. [Google Scholar] [CrossRef]
- Bussi, G.; Donadio, D.; Parrinello, M. Canonical sampling through velocity rescaling. J. Chem. Phys. 2007, 126, 014101. [Google Scholar] [CrossRef]
- Parrinello, M.; Aneesur, R. Polymorphic transitions in single crystals: A new molecular dynamics method. J. Appl. Phys. 1981, 52, 7182–7190. [Google Scholar] [CrossRef]
- Darden, T.; Darrin, Y.; Lee, P. Particle mesh Ewald: An N log (N) method for Ewald sums in large systems. J. Chem. Phys. 1993, 98, 10089–10092. [Google Scholar] [CrossRef]
- Hess, B.; Bekker, H.; Berendsen, H.J.; Fraaije, J.G. LINCS: A linear constraint solver for molecular simulations. J. Comput. Chem. 1997, 18, 1463–1472. [Google Scholar] [CrossRef]
- Humphrey, W.; Dalke, A.; Schulten, K. VMD: Visual molecular dynamics. J. Mol. Graph. 1996, 14, 33–38. [Google Scholar] [CrossRef]
- Lu, T.; Chen, F. Multiwfn: A multifunctional wavefunction analyzer. J. Comput. Chem. 2012, 33, 580–592. [Google Scholar] [CrossRef]
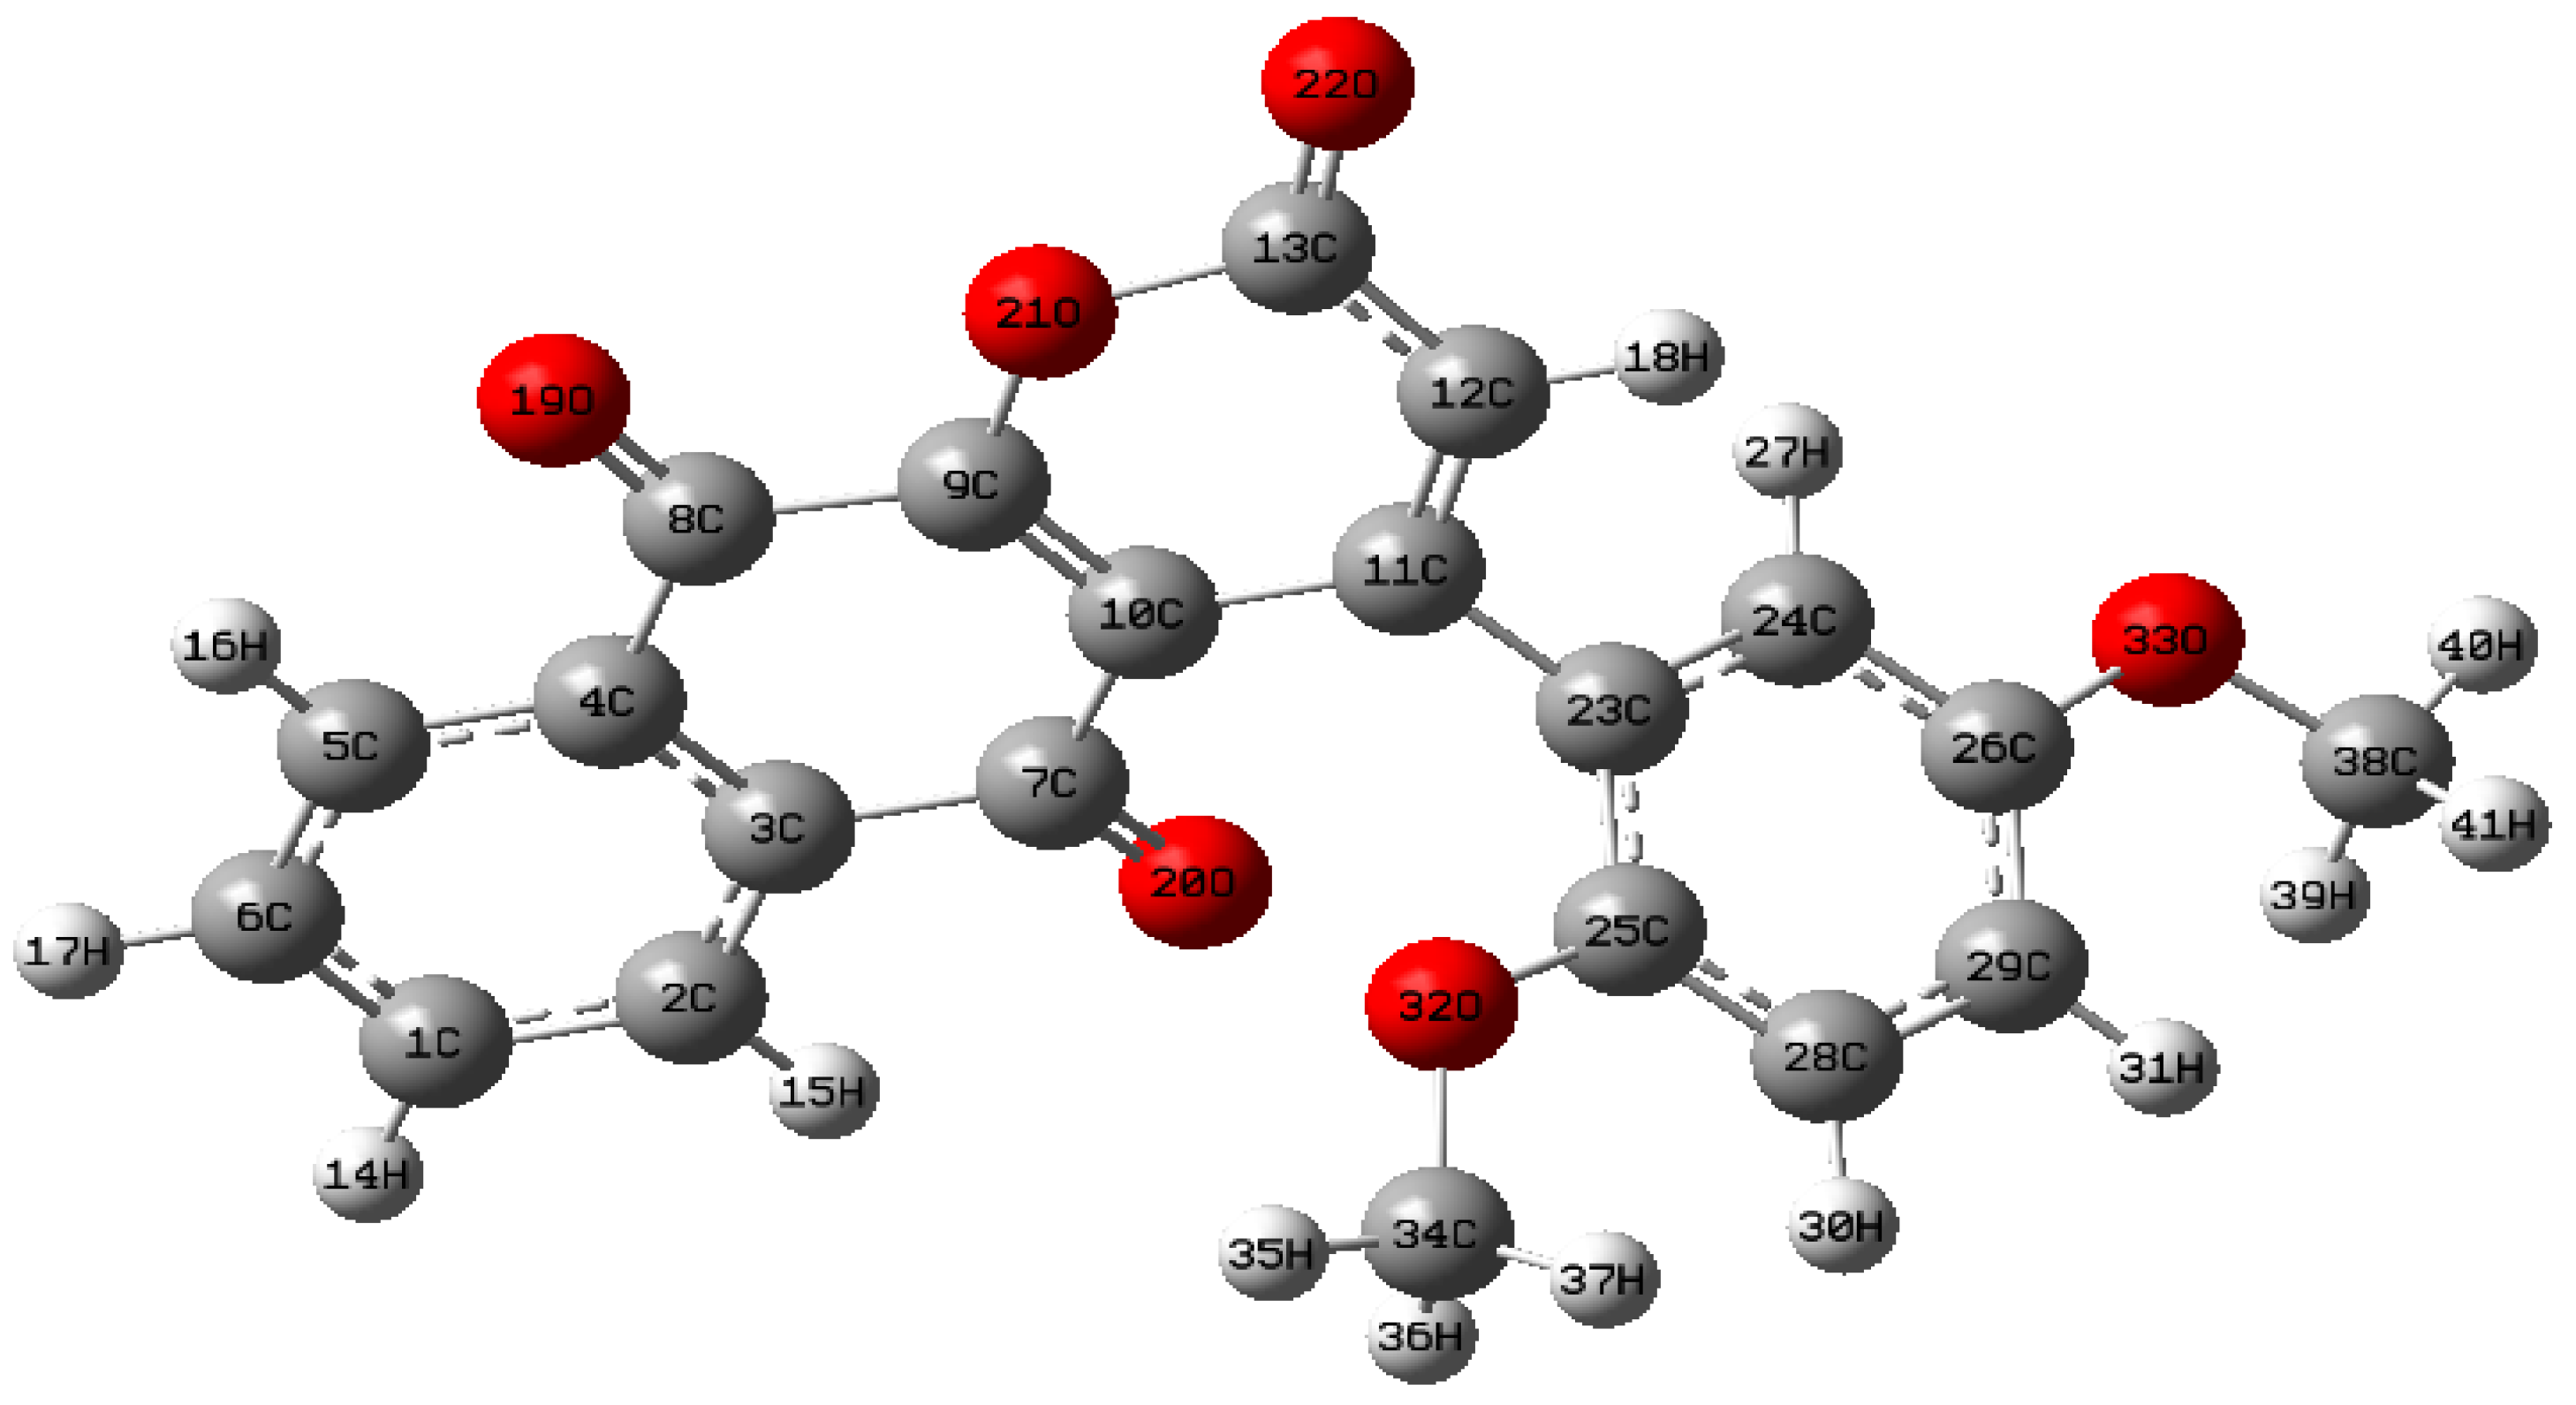
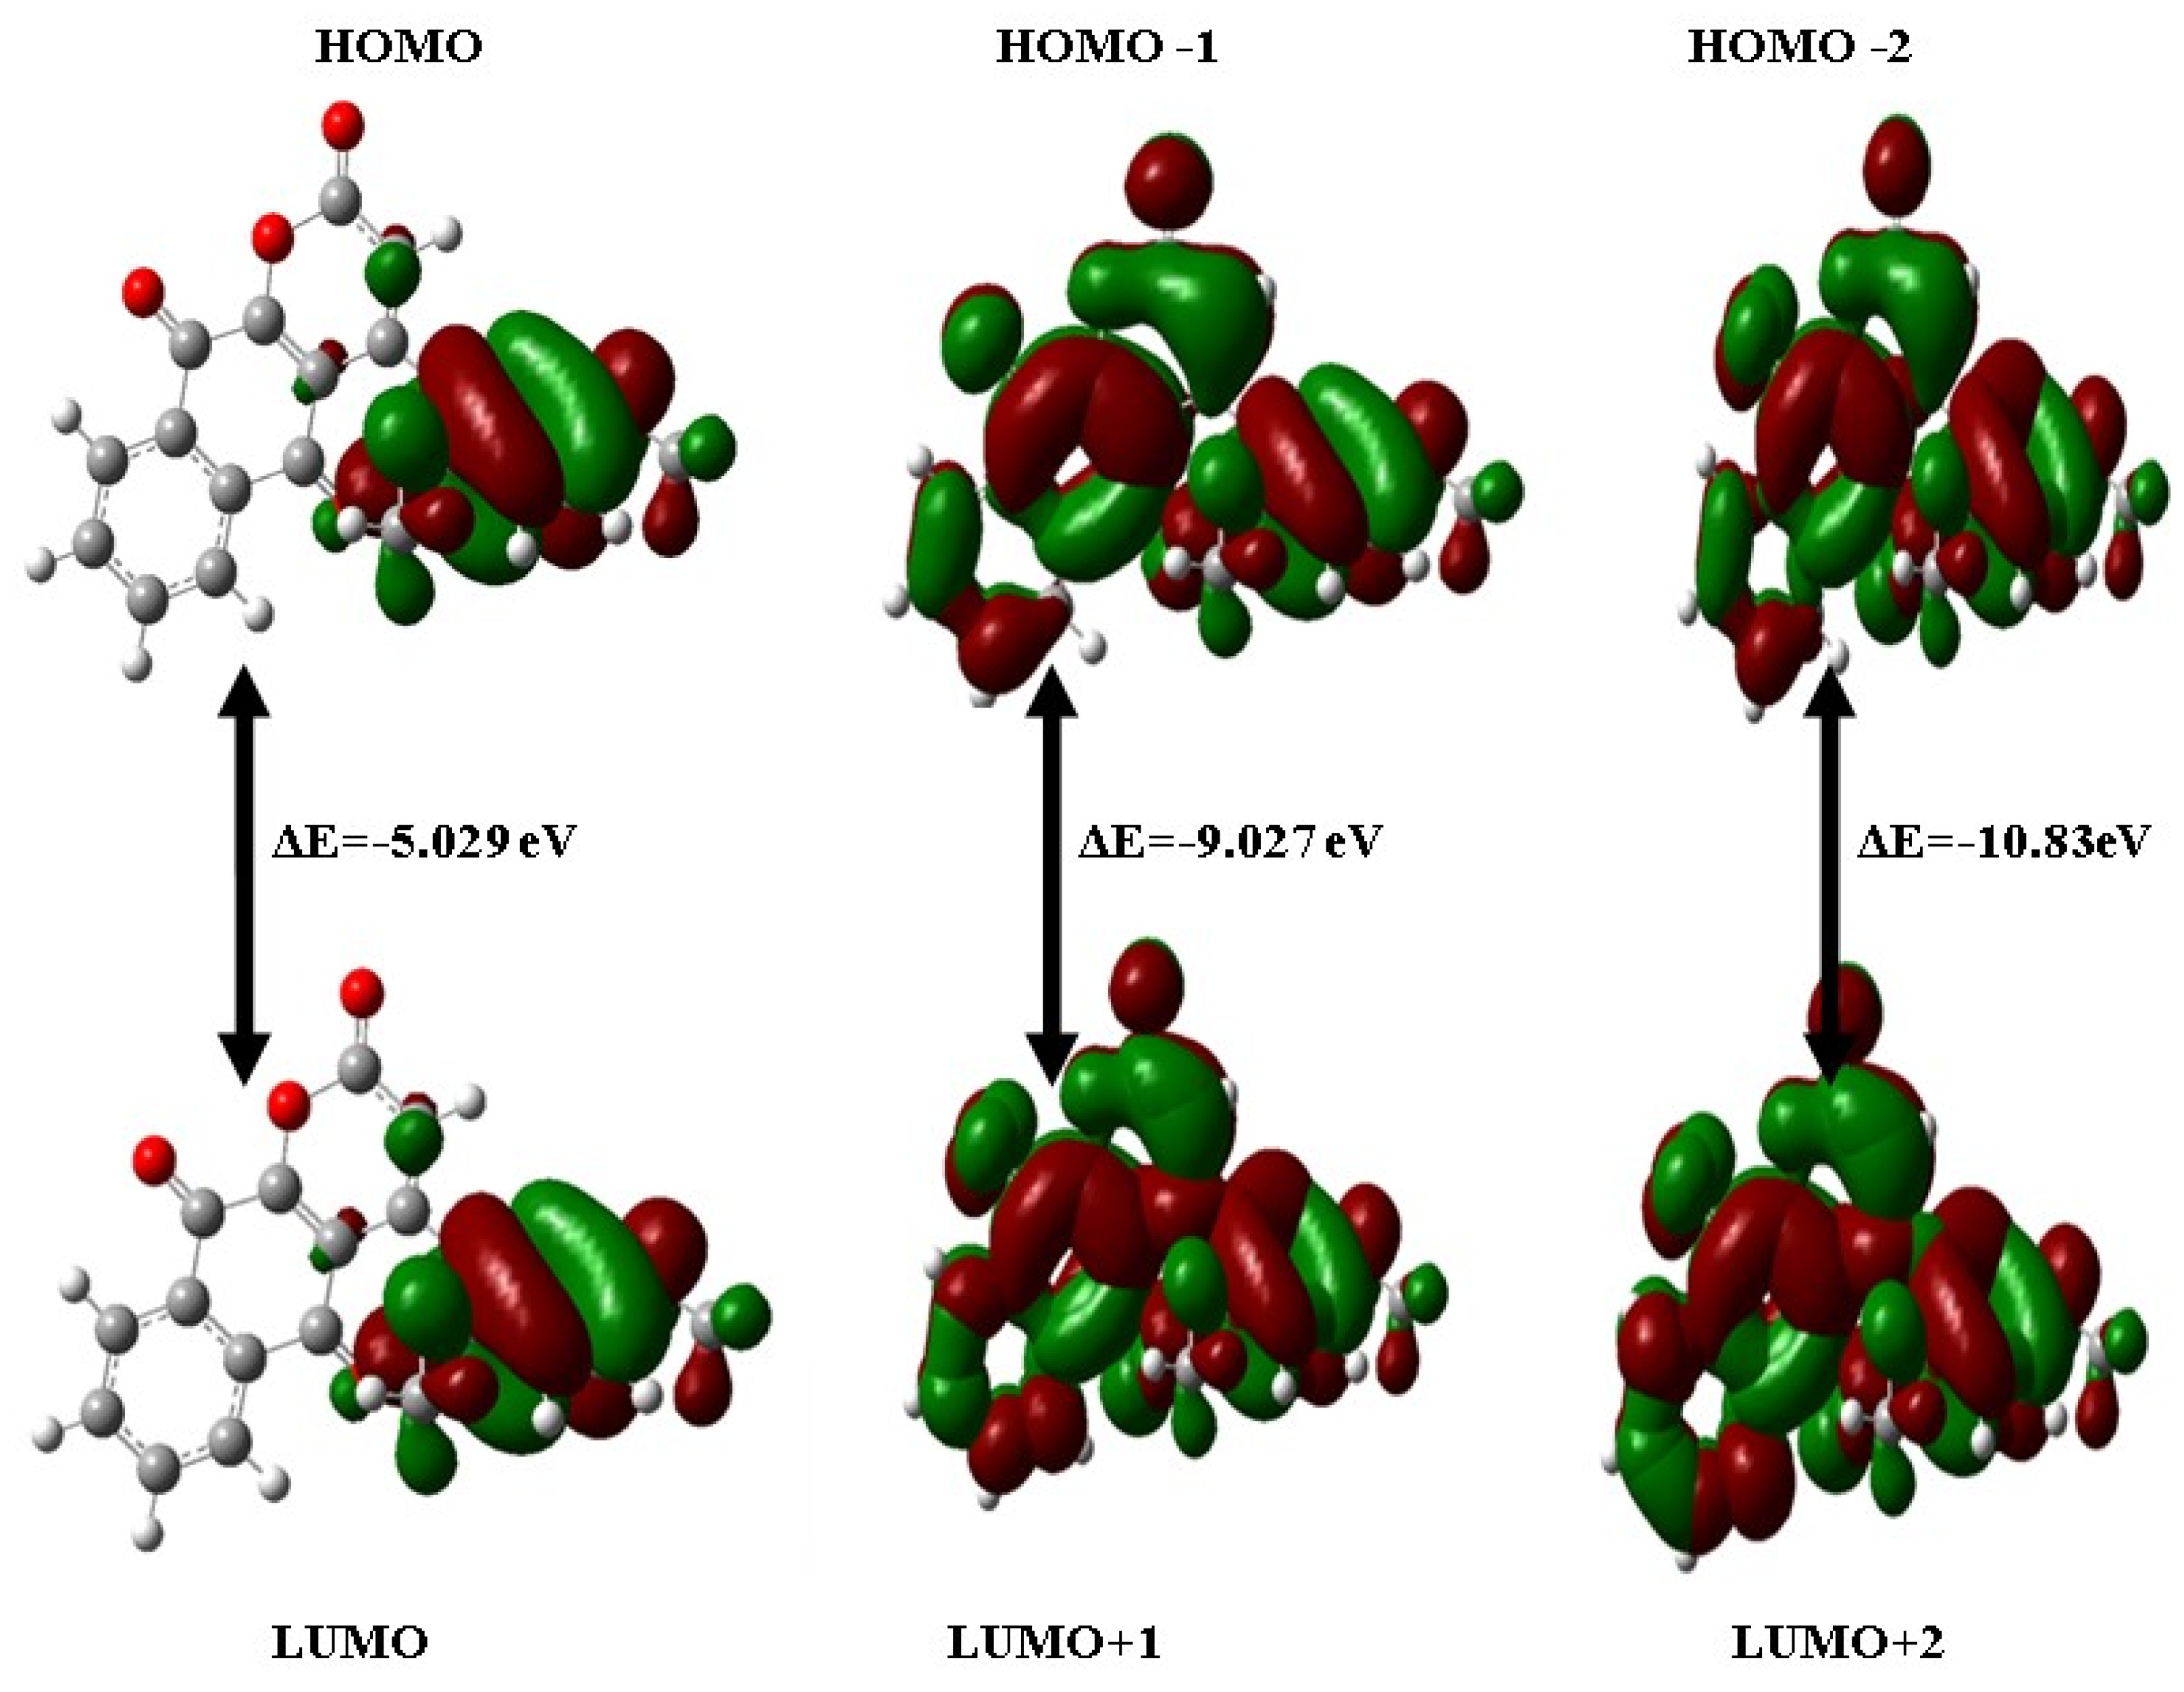
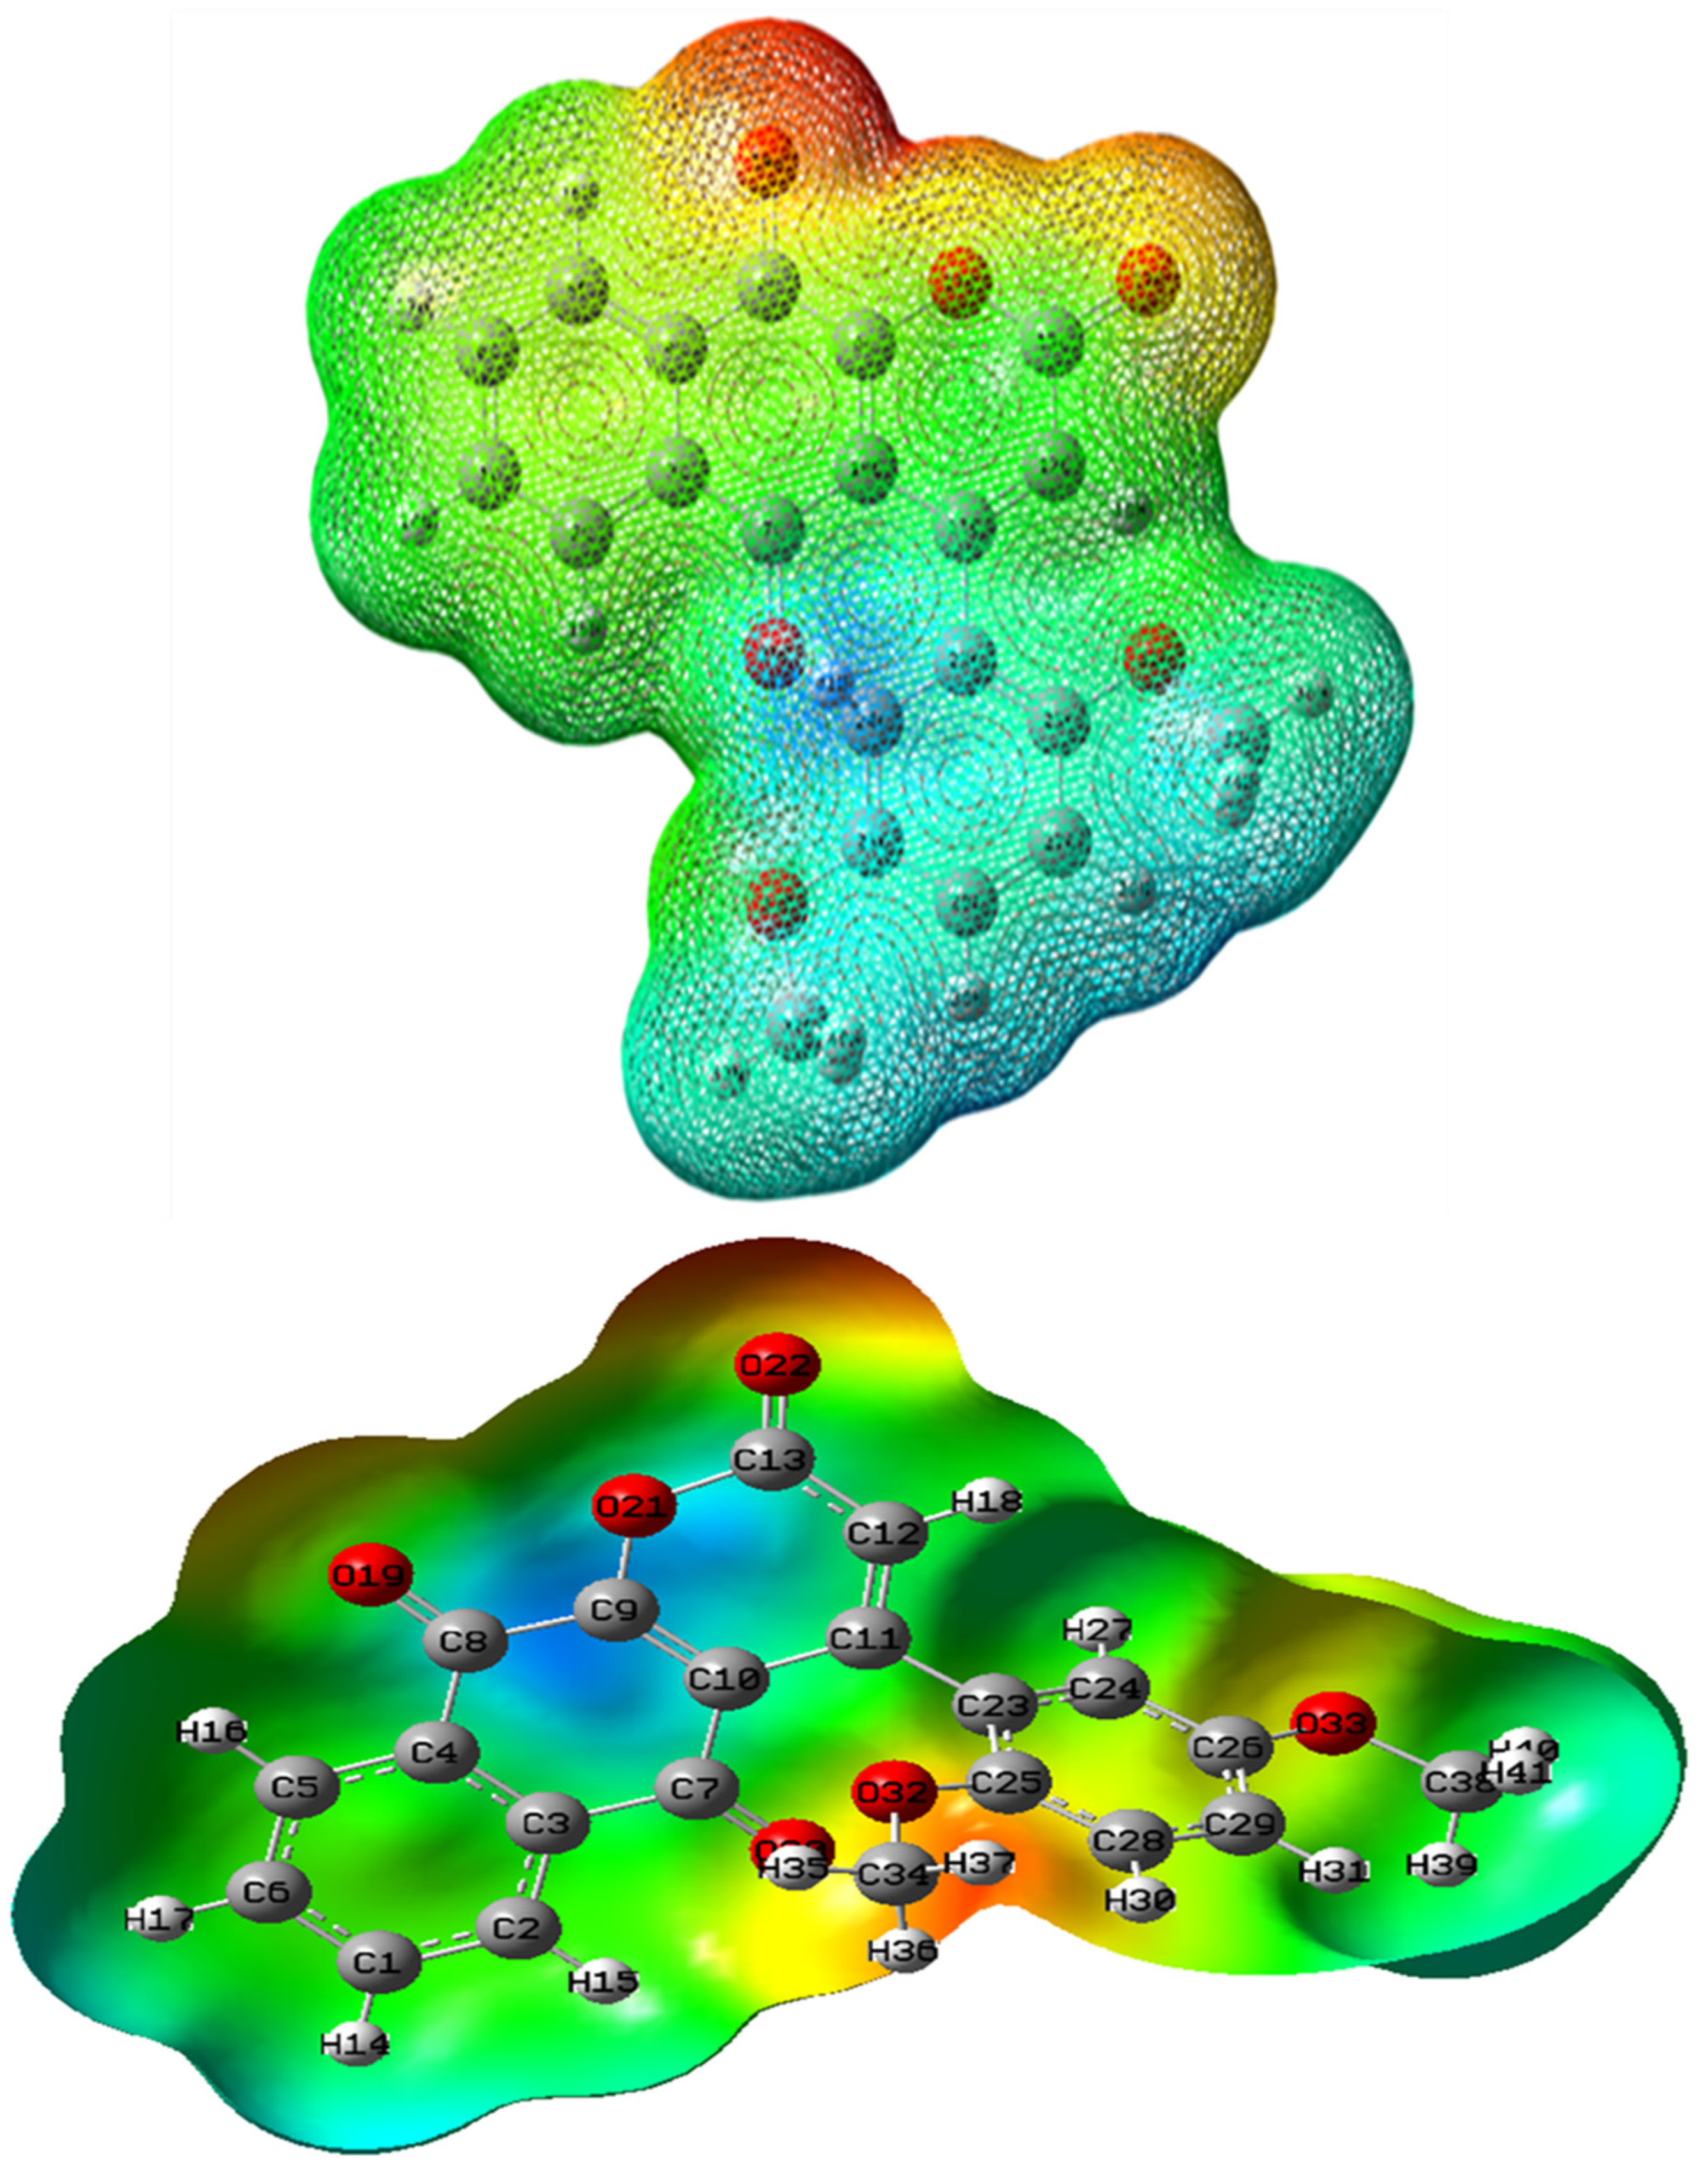
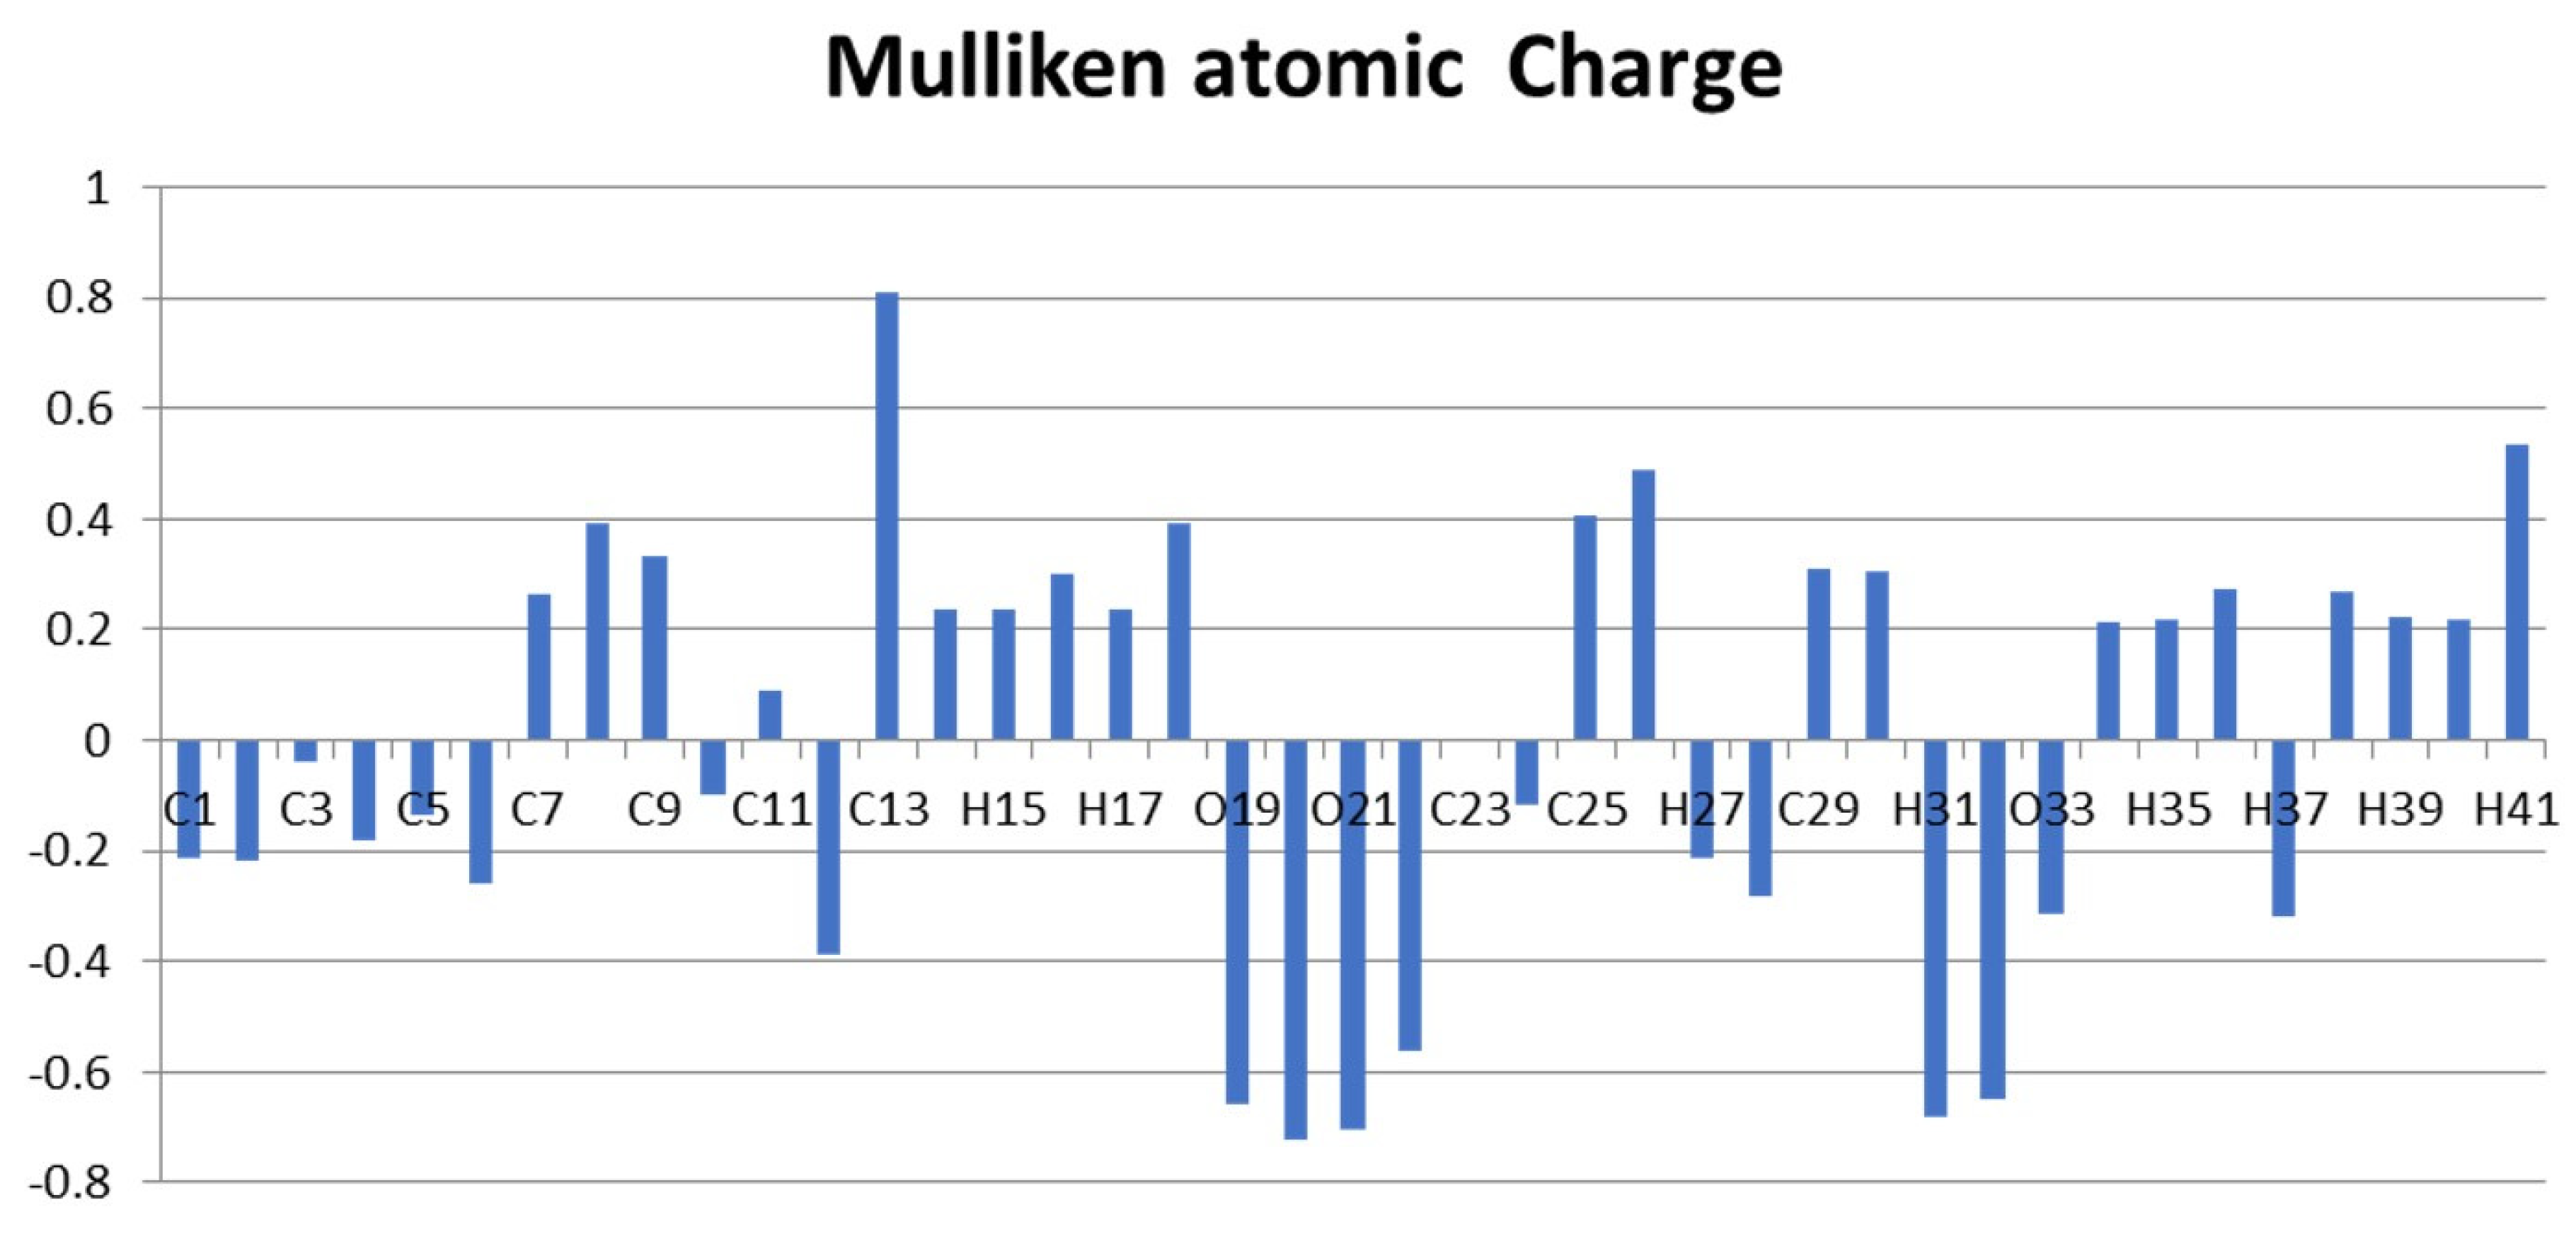


| Bond Length (A0): | |||
|---|---|---|---|
| C1-C2 | 1.36 | C13-O21 | 1.36 |
| C1-C6 | 1.43 | C13-O22 | 1.43 |
| C1-H14 | 1.10 | C23-C24 | 1.40 |
| C2-C3 | 1.43 | C23-C25 | 1.39 |
| C2-15 | 1.10 | C24-C26 | 1.39 |
| C3-C4 | 1.43 | C24-H27 | 1.10 |
| C3-C7 | 1.40 | C25-C28 | 1.40 |
| C4-C5 | 1.43 | C25-O32 | 1.43 |
| C4-C8 | 1.40 | C26-C29 | 1.40 |
| C5-C6 | 1.36 | C26-O33 | 1.43 |
| C5-H16 | 1.10 | C28-C29 | 1.39 |
| C6-H17 | 1.10 | C28-H30 | 1.10 |
| C7-C10 | 1.40 | C29-H31 | 1.10 |
| C7-O20 | 1.43 | O32-C34 | 1.43 |
| C8-C9 | 1.40 | O33-C38 | 1.43 |
| C8-O19 | 1.43 | C34-H35 | 1.07 |
| C9-C10 | 1.43 | C34-H36 | 1.07 |
| C9-O21 | 1.43 | C34-H37 | 1.07 |
| C10-C11 | 1.43 | C38-H39 | 1.07 |
| C11-C12 | 1.36 | C38-H40 | 1.07 |
| C11-C23 | 1.54 | C38-H41 | 1.07 |
| C12-C13 | 1.43 | C23-C25 | 1.39 |
| C12-H18 | 1.10 | C24-C26 | 1.39 |
| Bond Angle (0): | |||
| C2-C1-C6 | 120.4 | C12-C13-O21 | 120.4 |
| C2-C1-H14 | 121.0 | C12-C13-O22 | 118.6 |
| C6-C1-H14 | 118.6 | C21-C13-O22 | 121.0 |
| C1-C2-C3 | 120.8 | C9-O21-C13 | 120.8 |
| C1-C2-H15 | 121.2 | C11-C23-C24 | 120.0 |
| C3-C2-H15 | 118.1 | C11-C23-C25 | 120.0 |
| C2-C3-C4 | 118.8 | C24-C23-C25 | 120.0 |
| C2-C3-C7 | 121.7 | C23-C24-C26 | 120.0 |
| C4-C3-C7 | 119.5 | C23-C24-H27 | 120.0 |
| C3-C4-C5 | 118.8 | C26-C24-H27 | 120.0 |
| C3-C4-C8 | 119.5 | C23-C25-C28 | 120.0 |
| C5-C4-C8 | 121.7 | C23-C25-O32 | 120.0 |
| C4-C5-C6 | 120.8 | C28-C25-O32 | 120.0 |
| C4-C5-H16 | 118.1 | C24-C26-C29 | 120.0 |
| C6-C5-H16 | 121.2 | C24-C26-O33 | 120.0 |
| C1-C6-C5 | 120.4 | C29-C26-O33 | 120.0 |
| C1-C6-H17 | 118.6 | C25-C28-C29 | 120.0 |
| C5-C6-H17 | 121.0 | C25-C28-H30 | 120.0 |
| C3-C7-C10 | 121.0 | C29-C28-H30 | 120.0 |
| C3-C7-O20 | 119.5 | C26-C29-C28 | 120.0 |
| C10-C7-O20 | 119.5 | C26-C29-H31 | 120.0 |
| C4-C8-C9 | 121.0 | C28-C29-H31 | 120.0 |
| C4-C8-O19 | 119.5 | C25-O32-C34 | 109.5 |
| C9-C8-O19 | 119.5 | C26-O33-C38 | 109.5 |
| C8-C9-C10 | 119.5 | O32-C34-H35 | 109.5 |
| C8-C9-O21 | 121.7 | O32-C34-H36 | 109.5 |
| C10-C9-O21 | 118.8 | O32-C34-H37 | 109.5 |
| C7-C10-C9 | 119.5 | H35-C34-H36 | 109.5 |
| C7-C10-C11 | 121.7 | H35-C34-H37 | 109.5 |
| C9-C10-C11 | 118.8 | H36-C34-H37 | 109.5 |
| C10-C11-C12 | 120.8 | O33-C38-H39 | 109.5 |
| C10-C11-C23 | 119.6 | O33-C38-H40 | 109.5 |
| C12-C11-C23 | 119.6 | O33-C38-H41 | 109.5 |
| C11-C12-C13 | 120.4 | H39-C38-H40 | 109.5 |
| C11-C12-H18 | 121.0 | H39-C38-H41 | 109.5 |
| C13-C12-H18 | 118.6 | H40-C38-H41 | 109.5 |
| Dihedral Angle (0): | |||
| C6-C1-C2-C3 | 0.16 | C9-C10-C11-C23 | −179.94 |
| C6-C1-C2-H15 | 179.97 | C10-C11-C12-C13 | −0.1 |
| H14-C1-C2-C3 | −179.85 | C10-C11-C12-H18 | 179.96 |
| H14-C1-C2-H15 | −0.04 | C23-C11-C12-C13 | 179.9 |
| C2-C1-C6-C5 | 0 | C23-C11-C12-H18 | −0.04 |
| C2-C1-C6-H17 | 179.91 | C10-C11-C23-C24 | 89.99 |
| H14-C1-C6-C5 | −179.98 | C10-C11-C23-C25 | −90.01 |
| H14-C1-C6-H17 | −0.08 | C12-C11-C23-C24 | −90.01 |
| C1-C2-C3-C4 | −0.25 | C12-C11-C23-C25 | 89.99 |
| C1-C2-C3-C7 | 179.76 | C11-C12-C13-O21 | 0.08 |
| H15-C2-C3-C4 | 179.93 | C11-C12-C13-O22 | 180 |
| H15-C2-C3-C7 | −0.05 | H18-C12-C13-O21 | −179.98 |
| C2-C3-C4-C5 | 0.18 | H18-C12-C13-O22 | −0.06 |
| C2-C3-C4-C8 | −179.92 | C12-C13-O21-C9 | −0.02 |
| C7-C3-C4-C5 | −179.83 | O22-C13-O21-C9 | −179.94 |
| C7-C3-C4-C8 | 0.06 | C11-C23-C24-C26 | −179.97 |
| C2-C3-C7-C10 | −179.95 | C11-C23-C24-H27 | −0.05 |
| C2-C3-C7-O20 | −0.02 | C25-C23-C24-C26 | 0.03 |
| C4-C3-C7-C10 | 0.06 | C25-C23-C24-H27 | 179.95 |
| C4-C3-C7-O20 | 180 | C11-C23-C25-C28 | −179.98 |
| C3-C4-C5-C6 | −0.03 | C11-C23-C25-O32 | −0.01 |
| C3-C4-C5-H16 | −179.98 | C24-C23-C25-C28 | 0.01 |
| C8-C4-C5-C6 | −179.92 | C24-C23-C25-O32 | 179.99 |
| C8-C4-C5-H16 | 0.13 | C23-C24-C26-C29 | −0.06 |
| C3-C4-C8-C9 | −0.1 | C23-C24-C26-O33 | 179.96 |
| C3-C4-C8-O19 | 180 | H27-C24-C26-C29 | −179.98 |
| C5-C4-C8-C9 | 179.79 | H27-C24-C26-O33 | 0.04 |
| C5-C4-C8-O19 | −0.11 | C23-C25-C28-C29 | −0.04 |
| C4-C5-C6-C1 | −0.07 | C23-C25-C28-H30 | 179.98 |
| C4-C5-C6-H17 | −179.97 | O32-C25-C28-H30 | 0 |
| H16-C5-C6-C1 | 179.88 | C23-C25-O32-C34 | −155.32 |
| H16-C5-C6-H17 | −0.02 | C28-C25-O32-C34 | 24.66 |
| C3-C7-C10-C9 | −0.15 | C24-C26-C29-C28 | 0.03 |
| C3-C7-C10-C11 | 179.9 | C24-C26-C29-H31 | −180 |
| O20-C7-C10-C9 | 179.92 | O33-C26-C29-C28 | −179.98 |
| O20-C7-C10-C11 | −0.03 | O33-C26-C29-H31 | −0.02 |
| C4-C8-C9-C10 | 0.01 | C24-C26-O33-C38 | 140.96 |
| C4-C8-C9-O21 | −179.92 | C29-C26-O33-C38 | −39.02 |
| O19-C8-C9-C10 | 179.91 | C25-C28-C29-C26 | 0.01 |
| O19-C8-C9-O21 | −0.02 | C25-C28-C29-H31 | −179.96 |
| C8-C9-C10-C7 | 0.12 | H30-C28-C29-C26 | −180 |
| C8-C9-C10-C11 | −179.94 | H30-C28-C29-H31 | 0.03 |
| O21-C9-C10-C7 | −179.95 | C25-O32-C34-H35 | 168.25 |
| O21-C9-C10-C11 | 0 | C25-O32-C34-H36 | −71.75 |
| C8-C9-O21-C13 | 179.91 | C25-O32-C34-H37 | 48.25 |
| C10-C9-O21-C13 | −0.02 | C26-O33-C38-H39 | 75.05 |
| C7-C10-C11-C12 | −179.99 | C26-O33-C38-H40 | −164.95 |
| C7-C10-C11-C23 | 0.01 | C26-O33-C38-H41 | −44.95 |
| C9-C10-C11-C12 | 0.07 |
| Species | Observed Frequency (cm−1) | Calculated Frequency (cm−1) | Vibrational Assignments | |
|---|---|---|---|---|
| Infrared | Raman | Scaled | ||
| A | 3076 | 3075 | νCH | |
| A | 3068 | 3067 | νCH | |
| A | 3044 | 3046 | νCH | |
| 3022 | νCH | |||
| 2008 | 3011 | νCH | ||
| 3001 | 3002 | νCH | ||
| A | 2985 | νCH | ||
| 2968 | 2971 | νCH | ||
| 2946 | 2945 | νassCH3 | ||
| 2928 | 2730 | νassCH3 | ||
| 2921 | νassCH3 | |||
| 2914 | 2915 | νassCH3 | ||
| 2867 | νassCH3 | |||
| 2835 | 2837 | 2836 | νassCH2 | |
| 1795 | 1795 | 1798 | νCO | |
| 1682 | 1682 | 1683 | νCO | |
| 1675 | νCO | |||
| 1657 | 1659 | 1658 | νCC | |
| 1642 | 1645 | νCC | ||
| 1619 | νCC | |||
| 1592 | 1594 | 1573 | νCO | |
| 1575 | νCO | |||
| 1553 | δCH | |||
| 1522 | δCH | |||
| 1501 | 1500 | νCO | ||
| 1489 | νCC | |||
| 1478 | νCO | |||
| 1461 | 1459 | 1460 | νCO | |
| 1452 | νCO | |||
| 1441 | 1440 | δOpb CH3 | ||
| 1427 | δOpb CH3 | |||
| 1419 | 1420 | δCH | ||
| 1402 | δCH | |||
| 1381 | δCO | |||
| 1364 | 1364 | 1365 | δCO | |
| 1347 | δCO | |||
| 1331 | 1330 | δipb CH3 | ||
| 1315 | 1316 | δipb CH3 | ||
| 1303 | 1300 | νCC | ||
| 1275 | 1275 | δCH | ||
| 1267 | 1265 | δCO | ||
| 1238 | δCO | |||
| 1223 | 1225 | νCC | ||
| 1213 | δCO | |||
| 1206 | 1208 | 1206 | δCO | |
| 1192 | νCC | |||
| 1183 | 1180 | νCC | ||
| 1171 | νCC | |||
| 1162 | 1165 | 1164 | νCC | |
| 1143 | νCC | |||
| 1135 | νCC | |||
| 1125 | 1123 | δsb CH3 | ||
| 1063 | δcb CH3 | |||
| 1044 | 1042 | δCH | ||
| 1034 | 1033 | δCH | ||
| 1025 | 1025 | γCO | ||
| 1013 | γCO | |||
| 1001 | γCO | |||
| 985 | 987 | 986 | δopr CH3 | |
| 951 | 950 | γOO | ||
| 936 | 937 | γCO | ||
| 925 | δ CH3 CH3 | |||
| 910 | 912 | δCH | ||
| 876 | 875 | νCC | ||
| 862 | νCC | |||
| 852 | 850 | γCO | ||
| 820 | 823 | γCO | ||
| 791 | νCC | |||
| 768 | 770 | νCC | ||
| 752 | 757 | 755 | δipr CH3 | |
| 747 | δipr CH3 | |||
| 740 | νCC | |||
| 733 | νCC | |||
| 720 | 721 | νCC | ||
| 702 | 700 | νCC | ||
| 689 | νCC | |||
| 680 | 677 | 678 | νCC | |
| 659 | γCH | |||
| 645 | γCH | |||
| 623 | γCC | |||
| 608 | 608 | γCH | ||
| 584 | 585 | γCH | ||
| 563 | 563 | γCH | ||
| 535 | 538 | δring | ||
| 514 | γCH | |||
| 492 | 492 | γCH | ||
| 471 | 470 | γCH | ||
| 465 | 467 | δring | ||
| 451 | δring | |||
| 438 | 435 | δring | ||
| 425 | δring | |||
| 411 | δring | |||
| 389 | γCC | |||
| 371 | δring | |||
| 359 | γring | |||
| 332 | γring | |||
| 307 | γring | |||
| 285 | δring | |||
| 271 | Butter fly | |||
| 253 | Butter fly | |||
| 241 | δring | |||
| 220 | γring | |||
| 206 | γring | |||
| 195 | γring | |||
| 173 | γring | |||
| 180 | γring | |||
| 165 | γring | |||
| 145 | τring | |||
| 123 | τring | |||
| 117 | γring | |||
| 93 | δring | |||
| 81 | δring | |||
| 68 | δring | |||
| 47 | δring | |||
| 35 | γring | |||
| 27 | γring | |||
| 15 | γring | |||
| Molecular | Energy | Energy Gap (eV) | I (eV) | A (eV) | η (eV) | χ (eV) | υ (eV) | µ (eV) | ω (eV) |
|---|---|---|---|---|---|---|---|---|---|
| Properties | (a.u) | ||||||||
| HOMO | −0.22286 | −5.029 | 0.22286 | 0.03805 | 0.0924 | 0.13045 | 10.8225 | −0.13045 | 0.092 |
| LUMO | −0.03805 | ||||||||
| LUMO + 2 | 0.08333 | ||||||||
| HOMO − 1 | −0.3058 | −9.027 | 0.3058 | 0.02592 | 0.16586 | 0.13994 | 6.02918 | −0.13994 | 0.059 |
| LUMO + 1 | 0.02592 | ||||||||
| HOMO − 2 | −0.31473 | −10.83 | 0.31473 | −0.08333 | 0.19903 | 0.1157 | 5.0243 | −0.1157 | 0.0336 |
| LUMO + 2 | 0.08333 |
| Band Orbital | Occupancies | EDA% | EDB% | Polarization Coefficient of Bond Orbital | Hybrid | S (%) | P (%) | |
|---|---|---|---|---|---|---|---|---|
| I Atom | II Atom | |||||||
| C1-C2 | 1.98013–0.01490 | 49.68 | 50.32 | 0.7048 | 0.7094 | SP1.77 | 36.15 | 63.85 |
| C1-C6 | 1.97984–0.01723 | 50.47 | 49.53 | 0.7104 | 0.7038 | SP1.95 | 33.92 | 66.08 |
| C2-C3 | 1.97197–0.02273 | 47.62 | 52.38 | 0.6901 | 0.7238 | SP2.06 | 32.66 | 67.34 |
| C3-C4 | 1.95865–0.03097 | 51.51 | 48.49 | 0.7177 | 0.6964 | SP1.96 | 33.81 | 66.19 |
| C3-C7 | 1.96856–0.02442 | 49.93 | 50.07 | 0.7066 | 0.7076 | SP2.05 | 32.83 | 67.17 |
| C4-C5 | 1.97108–0.02281 | 52.32 | 47.68 | 0.7233 | 0.6905 | SP1.92 | 34.27 | 65.73 |
| C4-C8 | 1.97268–0.03450 | 52.45 | 47.55 | 0.7242 | 0.6895 | SP1.89 | 34.59 | 65.41 |
| C5-C6 | 1.98078–0.01461 | 49.77 | 50.23 | 0.7055 | 0.7088 | SP1.75 | 36.34 | 63.66 |
| C7-C10 | 1.96895–0.02785 | 48.23 | 51.77 | 0.6945 | 0.7195 | SP1.62 | 38.17 | 61.83 |
| C7-O20 | 1.98895–0.02565 | 27.03 | 72.97 | 0.5199 | 0.8542 | SP3.86 | 20.57 | 79.43 |
| C8-C9 | 1.98041–0.03206 | 48.01 | 51.99 | 0.6929 | 0.7211 | SP1.81 | 35.55 | 64.45 |
| C8-O19 | 1.98591–0.00898 | 43.79 | 56.21 | 0.6617 | 0.7497 | SP2.71 | 26.97 | 73.03 |
| C9-C10 | 1.96499–0.03228 | 46.38 | 53.62 | 0.6810 | 0.7323 | SP1.86 | 34.99 | 65.01 |
| C9-021 | 1.98588–0.02521 | 31.63 | 68.37 | 0.5624 | 0.8269 | SP3.20 | 23.78 | 76.22 |
| C10-C11 | 1.97023–0.02796 | 49.68 | 50.32 | 0.7048 | 0.7094 | SP2.18 | 31.46 | 68.54 |
| C11-C12 | 1.97403–0.02274 | 52.42 | 47.58 | 0.7240 | 0.6898 | SP1.61 | 38.33 | 61.67 |
| C11-C23 | 1.96904–0.02814 | 47.02 | 52.98 | 0.6857 | 0.7278 | SP2.56 | 28.09 | 71.91 |
| C12-C13 | 1.98424–0.03379 | 52.65 | 47.35 | 0.7256 | 0.6881 | SP2.11 | 32.20 | 67.80 |
| C13-O21 | 1.99265–0.05963 | 30.56 | 69.44 | 0.5528 | 0.8333 | SP2.67 | 27.22 | 72.78 |
| C13-O22 | 1.99096–0.01979 | 41.87 | 58.13 | 0.6470 | 0.7625 | SP2.14 | 31.88 | 68.12 |
| O20-C24 | 1.86519–0.04415 | 64.32 | 35.68 | 0.8020 | 0.5973 | SP2.88 | 25.74 | 74.26 |
| C23-C24 | 1.96447–0.02870 | 48.98 | 51.02 | 0.6999 | 0.7142 | SP1.98 | 33.51 | 66.49 |
| C23-C25 | 1.96957–0.02476 | 51.39 | 48.61 | 0.7169 | 0.6972 | SP1.85 | 35.11 | 64.89 |
| C24-C26 | 1.96617–0.02731 | 52.17 | 47.83 | 0.7223 | 0.6916 | SP1.50 | 39.97 | 60.03 |
| C25-C27 | 1.97902–0.02202 | 49.94 | 50.06 | 0.7067 | 0.7075 | SP1.65 | 37.68 | 62.32 |
| C25-O31 | 1.99016–0.02311 | 34.90 | 65.10 | 0.5908 | 0.8068 | SP3.08 | 24.52 | 75.48 |
| C26-C28 | 1.97444–0.02088 | 50.56 | 49.44 | 0.7110 | 0.7032 | SP1.57 | 38.96 | 61.04 |
| C26-O32 | 1.98985–0.02061 | 35.74 | 64.26 | 0.5978 | 0.8016 | SP3.11 | 24.34 | 75.66 |
| C27-C28 | 1.97308–0.01800 | 49.99 | 50.01 | 0.7071 | 0.7071 | SP1.83 | 35.29 | 64.71 |
| O31-C33 | 1.99357–0.00515 | 69.23 | 30.77 | 0.8320 | 0.5547 | SP2.53 | 28.30 | 71.70 |
| O32-C37 | 1.99361–0.00375 | 69.28 | 30.72 | 0.8323 | 0.5543 | SP2.44 | 29.07 | 70.93 |
| Donor NBO (i) | ED(i) e | Acceptor NBO (j) | ED (j) e | E(2) kcal/mol | E(j)-E(i) a.u. | F(i,j) a.u. |
|---|---|---|---|---|---|---|
| σ C1-C2 | 1.98013 | σ* C2-C3 | 0.95499 | 5.02 | 1.74 | 0.083 |
| π C1-C2 | 1.79066 | π* C3-C7 | 0.33282 | 36.68 | 0.44 | 0.126 |
| σ C1-C6 | 1.97984 | σ* C1-C2 | 0.88828 | 4.42 | 1.79 | 0.079 |
| σ C1-H14 | 1.98487 | σ* C2-C3 | 0.69559 | 4.75 | 1.48 | 0.075 |
| σ C2-C3 | 1.97197 | σ* C3-C4 | 0.89351 | 5.91 | 1.7 | 0.09 |
| σ C2-H15 | 1.98440 | σ* C1-C6 | 0.69421 | 3.93 | 1.49 | 0.068 |
| σ C3-C4 | 1.95865 | σ* C3-C7 | 0.89084 | 5.77 | 1.71 | 0.089 |
| π C3-C7 | 1.68109 | π* C9-C10 | 0.35425 | 55.66 | 0.47 | 0.15 |
| σ C4-C5 | 1.97108 | σ* C4-C8 | 0.87139 | 6.63 | 1.74 | 0.096 |
| σ C4-C8 | 1.97268 | σ* C4-C5 | 0.92384 | 6.44 | 1.73 | 0.094 |
| π C5-C6 | 1.75574 | LPσ C4 | 0.31189 | 53.37 | 0.24 | 0.133 |
| σ C5-H16 | 1.98143 | σ* C1-C6 | 0.66643 | 4.74 | 1.47 | 0.074 |
| σ C6-H17 | 1.98483 | σ* C1-C2 | 0.68152 | 3.16 | 1.58 | 0.063 |
| σ C7-C10 | 1.96895 | σ* C3-C7 | 0.98067 | 8 | 1.8 | 0.107 |
| σ C7-O20 | 1.98895 | σ* C9-C10 | 1.23056 | 1.54 | 2 | 0.05 |
| σ C8-C9 | 1.98041 | σ* C9-C10 | 0.94869 | 5.46 | 1.72 | 0.087 |
| σ C8-O19 | 1.98591 | σ* C3-C4 | 0.88766 | 3.52 | 1.7 | 0.069 |
| π C9-C10 | 1.71142 | LPσ* C8 | 0.34716 | 67.39 | 0.34 | 0.159 |
| σ C9-O21 | 1.98588 | σ* C7-C10 | 1.09962 | 1.86 | 1.9 | 0.053 |
| σ C10-C11 | 1.97023 | σ* C11-C12 | 0.95750 | 6.86 | 1.8 | 0.1 |
| σ C11-C12 | 1.97403 | σ* C10-C11 | 1.01857 | 7.97 | 1.75 | 0.106 |
| π C11-C12 | 1.81365 | π* C13-O22 | 0.39575 | 35.58 | 0.49 | 0.121 |
| σ C11-C23 | 1.96904 | σ* C23-C25 | 0.90300 | 3.73 | 1.64 | 0.07 |
| σ C12-C13 | 1.98424 | σ* C11-C23 | 0.97728 | 5.62 | 1.53 | 0.083 |
| σ C12-H18 | 1.97133 | σ* C10-C11 | 0.72813 | 5.77 | 1.46 | 0.082 |
| σ C13-O21 | 1.99265 | σ* C8-C9 | 1.19856 | 2.03 | 2.05 | 0.058 |
| σ C13-O22 | 1.99096 | σ* C11-C12 | 0.97399 | 2.69 | 1.82 | 0.063 |
| π C13-O22 | 1.96408 | π* C11-C12 | 0.40948 | 12.12 | 0.56 | 0.076 |
| σ C23-C24 | 1.96447 | σ* C24-C26 | 1.06814 | 6.64 | 1.78 | 0.097 |
| π C23-C24 | 1.62979 | π* C26-C28 | 0.47461 | 39.47 | 0.53 | 0.13 |
| σ C23-C25 | 1.96957 | σ* C25-C27 | 1.06092 | 5.79 | 1.78 | 0.091 |
| σ C24-C26 | 1.96617 | σ* C23-C24 | 1.09459 | 8.02 | 1.8 | 0.107 |
| σ C25-C27 | 1.97902 | σ* C23-C25 | 1.05789 | 6.52 | 1.8 | 0.097 |
| π C25-C27 | 1.60918 | π* C23-C24 | 0.41544 | 66.65 | 0.42 | 0.156 |
| σ C25-O31 | 1.99016 | σ* C23-C24 | 1.13212 | 2.04 | 1.84 | 0.055 |
| σ C26-C28 | 1.97444 | σ* O20-C24 | 1.06436 | 7.09 | 1.37 | 0.088 |
| π C26-C28 | 1.66248 | π* C25-C27 | 0.43109 | 47.22 | 0.49 | 0.136 |
| σ C26-O32 | 1.98985 | σ* C23-C24 | 1.14113 | 1.91 | 1.85 | 0.053 |
| σ C27-C28 | 1.97308 | σ* C25-O31 | 1.04167 | 4.59 | 1.46 | 0.073 |
| σ C27-H29 | 1.97890 | σ* C23-C25 | 0.81087 | 4 | 1.55 | 0.07 |
| σ C28-H30 | 1.97669 | σ* C24-C26 | 0.80388 | 4.35 | 1.51 | 0.072 |
| σ O31-C33 | 1.99357 | σ* C23-C25 | 1.11124 | 3.97 | 1.85 | 0.077 |
| σ O32-C37 | 1.99361 | σ* C24-C26 | 1.12540 | 3.9 | 1.83 | 0.076 |
| σ C33-H34 | 1.99466 | σ* C27-H29 | 0.79099 | 0.86 | 1.39 | 0.031 |
| σ C33-H35 | 1.99469 | σ* C27-H29 | 0.79059 | 0.82 | 1.39 | 0.03 |
| σ C33-H36 | 1.99233 | σ* C25-O31 | 0.77809 | 3.13 | 1.2 | 0.055 |
| σ C37-H38 | 1.99227 | σ* C26-O32 | 0.78510 | 3.23 | 1.19 | 0.055 |
| σ C37-H39 | 1.99493 | σ* C37-H38 | 0.79634 | 0.81 | 1.49 | 0.031 |
| σ C37-H40 | 1.99490 | σ* C28-H30 | 0.79738 | 0.81 | 1.39 | 0.03 |
| LPσ O19 | 1.98865 | σ* C4-C8 | 0.97085 | 2.15 | 1.84 | 0.056 |
| LPσ O20 | 1.96990 | σ* C23-C24 | 0.88670 | 5.57 | 1.6 | 0.084 |
| LPσ O31 | 1.95396 | σ* C12-H18 | 0.88864 | 17.58 | 1.59 | 0.15 |
| LPπ O21 | 1.76389 | π* C13-O22 | 0.45550 | 83.46 | 0.55 | 0.194 |
| LPπ O32 | 1.87472 | π* C26-C28 | 0.54998 | 39.31 | 0.6 | 0.144 |
| LPπ O31 | 1.89710 | π* C25-C27 | 0.54984 | 29.88 | 0.61 | 0.128 |
| π* C1-C2 | 0.01490 | π* C5-C6 | 0.89676 | 150.22 | 0.02 | 0.108 |
| π* C23-C24 | 0.02870 | π* C25-C27 | 0.70832 | 174.07 | 0.06 | 0.135 |
| π* C26-C28 | 0.02088 | π* C25-C27 | 0.71241 | 536.32 | 0.01 | 0.116 |
| LP(3) O19 | 1.63920 | LPσ* C8 | 0.21450 | 211.21 | 0.21 | 0.214 |
| Atom | Mulliken Atomic Charge | Atom | Mulliken Atomic Charge |
|---|---|---|---|
| C1 | −0.211 | O22 | −0.561 |
| C2 | −0.216 | C23 | 0.001 |
| C3 | −0.040 | C24 | −0.118 |
| C4 | −0.183 | C25 | 0.406 |
| C5 | −0.137 | C26 | 0.490 |
| C6 | −0.259 | H27 | −0.213 |
| C7 | 0.262 | C28 | −0.283 |
| C8 | 0.393 | C29 | 0.310 |
| C9 | 0.334 | H30 | 0.304 |
| C10 | −0.099 | H31 | −0.679 |
| C11 | 0.089 | O32 | −0.648 |
| C12 | −0.389 | O33 | −0.314 |
| C13 | 0.811 | C34 | 0.215 |
| H14 | 0.236 | H35 | 0.218 |
| H15 | 0.237 | H36 | 0.272 |
| H16 | 0.302 | H37 | −0.320 |
| H17 | 0.235 | C38 | 0.268 |
| H18 | 0.392 | H39 | 0.225 |
| O19 | −0.658 | H40 | 0.219 |
| O20 | −0.723 | H41 | 0.536 |
| O21 | −0.704 |
| Derivative | Energy (eV) | Wave Length (nm) | Osc. Strength | Symmetry | Major Contributions | Minor Contribution | LHE |
|---|---|---|---|---|---|---|---|
| benazene | 2.296 | 539 | 0.0971 | Singlet-sym | HOMO-LUMO (90%) | H-1-LUMO (3%) | 0.2003 |
| 3.307 | 374 | 0.1186 | Singlet-sym | HOMO-L + 1 (78%) | HOMO-L + 2 (8%) | 0.2389 | |
| 3.965 | 312 | 0.1162 | Singlet-sym | H-1-LUMO (56%) | H-1-L+1 (11%) | 0.2347 | |
| CCl4 | 2.285 | 542 | 0.0961 | Singlet-sym | HOMO-LUMO (91%) | HOMO-L + 2 (8%) | 0.1985 |
| 3.304 | 375 | 0.1148 | Singlet-sym | HOMO-L + 1 (78%) | H-1-L+1 (10%) | 0.2322 | |
| 3.968 | 312 | 0.706 | Singlet-sym | H-1-LUMO (56%) | H-4-LUMO (14%) | 0.8032 | |
| DMSO | 3.046 | 406 | 0.0906 | Singlet-sym | HOMO-LUMO (90%) | H-5-LUMO (4%) | 0.1882 |
| 3.659 | 338 | 0.17 | Singlet-sym | HOMO-L + 1 (80%) | H-5-LUMO (3%) | 0.3239 | |
| 4.147 | 298 | 0.6729 | Singlet-sym | H-1-LUMO (47%) | HOMO-L + 2 (4%) | 0.7876 | |
| Ethonal | 3.0100 | 411 | 0.0864 | Singlet-sym | HOMO-LUMO (90%) | H-5-LUMO (4%) | 0.1804 |
| 3.644 | 340 | 0.1596 | Singlet-sym | HOMO-L + 1 (80%) | H-1-LUMO (2%) | 0.3075 | |
| 4.152 | 298 | 0.6668 | Singlet-sym | H-4-LUMO (30%) | H-1-L+1 (8%) | 0.7846 | |
| Methonal | 3.0305 | 409 | 0.0855 | Singlet-sym | HOMO-LUMO (90%) | H-5-LUMO (3%) | 0.1787 |
| 3.657 | 339 | 0.1568 | Singlet-sym | HOMO-L + 1 (80%) | H-1LUMO (2%) | 0.3030 | |
| 4.162 | 297 | 0.683 | Singlet-sym | H-1-LUMO (46%) | H-2-LUMO (2%) | 0.7925 | |
| Water | 3.067 | 404 | 0.0874 | Singlet-sym | HOMO-LUMO (90%) | H-5-LUMO (4%) | 0.1822 |
| 3.676 | 337 | 0.1601 | Singlet-sym | HOMO-L + 1 (80%) | H-5-LUMO (3%) | 0.3083 | |
| 4.165 | 297 | 0.6554 | Singlet-sym | H-1-LUMO (46%) | HOMO-L + 2 (4%) | 0.7788 HO |
| Ligand | Conformer | 1gqm | 1FY2 | 1lxe | 2IGR | ||||
|---|---|---|---|---|---|---|---|---|---|
| B.E (Kcal/mol) | Inhibition Const. (µm) | B.E (Kcal/mol) | Inhibition Const. (µm) | B.E (Kcal/mol) | Inhibition Const. (µm) | B.E (Kcal/mol) | Inhibition Const. (µm) | ||
| DMCT | 1 | −7.32 | 4.28 | −6.93 | 8.35 | −6.67 | 12.89 | −7.00 | 7.45 |
| 2 | −7.27 | 4.70 | −6.01 | 37.5 | −5.15 | 167.89 | −7.73 | 2.17 | |
| 3 | −7.57 | 2.82 | −5.90 | 46.96 | −5.27 | 144.24 | −6.99 | 7.49 | |
| 4 | −7.27 | 4.67 | −7.08 | 6.43 | −5.96 | 43.12 | −7.58 | 2.77 | |
| 5 | −7.09 | 6.34 | −6.37 | 21.33 | −5.89 | 48.18 | −6.99 | 4.49 | |
| 6 | −6.71 | 12.02 | −7.11 | 6.17 | −5.21 | 152.38 | −6.99 | 7.52 | |
| 7 | −7.36 | 4.01 | −6.27 | 25.40 | −5.69 | 67.61 | −6.96 | 7.96 | |
| 8 | −7.29 | 4.55 | −6.55 | 15.89 | −5.44 | 102.44 | −7.38 | 3.83 | |
| 9 | −7.14 | 5.83 | −5.46 | 99.05 | −5.23 | 147.40 | −7.13 | 5.98 | |
| 10 | −7.33 | 4.22 | −7.03 | 7.03 | −5.48 | 96.67 | −6.99 | 7.53 | |
| 9 Ligand | Protein PDB ID (1fy2) | Protein PDB ID (1xe) | Protein PDB ID (2igr) | Protein PDB ID (1gqm) | ||||
|---|---|---|---|---|---|---|---|---|
| Residues | Bond Distance | Residues | Bond Distance | Residues | Bond Distance | Residues | Bond Distance | |
| DMCT | A:ILE:170 | 5.07 | A:GLV:82 | 3.94 | TRP A: 12 | 2.54 | ALA H: 78 | 3.93 |
| A:GLY:173 | 1.98 | A:THR:83 | 2.69 | LYS A: 16 | 5.38 | ALA J: 62 | 3.43 | |
| A:HIS:24 | 3.20 | A:VAL:80 | 5.43 | LYS A: 26 | 2.03 | LYS H: 82 | 3.06 | |
| A:GLN:175 | 3.07 | A:LYS:81 | 1.99 | TRP A: 25 | 5.07 | ILE H: 79 | 2.91 | |
| A:ASN:172 | 2.21 | A:LYS:105 | 2.05 | LYS A: 26 | 3.94 | ALA H: 78 | 4.90 | |
| Estimated inhibition const (µm) | 6.17 | 12.89 | 2.17 | 2.82 | ||||
| Binding Energy | −7.11 | −6.67 | −7.73 | −7.57 | ||||
Disclaimer/Publisher’s Note: The statements, opinions and data contained in all publications are solely those of the individual author(s) and contributor(s) and not of MDPI and/or the editor(s). MDPI and/or the editor(s) disclaim responsibility for any injury to people or property resulting from any ideas, methods, instructions or products referred to in the content. |
© 2025 by the authors. Licensee MDPI, Basel, Switzerland. This article is an open access article distributed under the terms and conditions of the Creative Commons Attribution (CC BY) license (https://creativecommons.org/licenses/by/4.0/).
Share and Cite
Sivaprakash, P.; Viji, A.; Krishnaveni, S.; Kavya, K.M.; Lee, D.; Kim, I. Comprehensive Computational Study of a Novel Chromene-Trione Derivative Bioagent: Integrated Molecular Docking, Dynamics, Topology, and Quantum Chemical Analysis. Int. J. Mol. Sci. 2025, 26, 9661. https://doi.org/10.3390/ijms26199661
Sivaprakash P, Viji A, Krishnaveni S, Kavya KM, Lee D, Kim I. Comprehensive Computational Study of a Novel Chromene-Trione Derivative Bioagent: Integrated Molecular Docking, Dynamics, Topology, and Quantum Chemical Analysis. International Journal of Molecular Sciences. 2025; 26(19):9661. https://doi.org/10.3390/ijms26199661
Chicago/Turabian StyleSivaprakash, P., A. Viji, S. Krishnaveni, K. M. Kavya, Deokwoo Lee, and Ikhyun Kim. 2025. "Comprehensive Computational Study of a Novel Chromene-Trione Derivative Bioagent: Integrated Molecular Docking, Dynamics, Topology, and Quantum Chemical Analysis" International Journal of Molecular Sciences 26, no. 19: 9661. https://doi.org/10.3390/ijms26199661
APA StyleSivaprakash, P., Viji, A., Krishnaveni, S., Kavya, K. M., Lee, D., & Kim, I. (2025). Comprehensive Computational Study of a Novel Chromene-Trione Derivative Bioagent: Integrated Molecular Docking, Dynamics, Topology, and Quantum Chemical Analysis. International Journal of Molecular Sciences, 26(19), 9661. https://doi.org/10.3390/ijms26199661


