2.1. DES Preparation
A series of deep eutectic solvents (DESs) was prepared using choline acetate (ChOAc), L-carnitine (L-carn) and L-proline (L-pro) hydrogen bond acceptors (HBAs) and using ethylene glycol (EG), glycerol (Gly) and levulinic acid (LevA) as hydrogen bond donors (HBDs) (
Table 1). These investigated solvent mixtures are undoubtedly less notorious compared to the more traditional choline chloride or betaine-based DESs. However, all the considered solvents (
Table 1) have already been reported in various studies as DESs [
18,
23,
29,
40,
41,
42,
43,
44,
45,
46,
47,
48,
49].
In 2023, Omar et al. [
18] report an extensive database of DESs and their physical properties. Among the various mixtures reported, L-Carn:EG, Pro:LevA, Pro:Gly, ChOAc:EG, and ChOAc:Gly are reported as DESs. A mixture of ChOAc and LevA was reported as DES for the dissolution of hemicellulose present in Kraft pulp [
8]. In addition, the DES L-Carn:LevA was used as an additive to increase the solubility of curcumin. DES based on levulinic acid produced the best results, outperforming lactic and pyruvic acid [
42]. Similarly, DES L-Carn:EG and L-Carn:Gly have been used effectively to extract gingerols from ginger powder using ultrasonication [
46].
The non-ideality of the eutectic mixture is not strictly related to the HBA:HBD ratio but it is intrinsic of the HBA-HBD couple (the exact melting point is strictly related to the ratio, while the phase diagram has to be non-ideal in throughout the range). Having this in mind, it can be stated that the herein proposed mixtures are eligible DES mixtures, even though they are not always present in compositions reported in the literature.
The DESs were prepared by mixing the selected hydrogen bond acceptors (HBAs) and hydrogen bond donors (HBDs) both in 1:2 and in 1:3 ratios (
Table 1). The preparation was carried out at room temperature for ChOAc-based DESs and the L-Pro:LevA 1:3 DES, and at 40 °C or 60 °C for carnitine-based DESs and L-Pro:gly DES until homogeneous liquids were obtained. Given the significant impact of the water content on the physico-chemical characteristics of the final mixtures, ChOAc, EG, Gly, and LevA were thoroughly dried under vacuum prior to use. L-carn and L-pro were acquired in an anhydrous form, and no further drying was required. After the preparation, the resulting DESs were subjected to additional drying under vacuum, and their H
2O content was determined using Karl Fischer titration prior to all measurements. The water content was found to be below 400 ppm for DESs containing LevA and between 400 and 600 ppm for those containing EG and Gly. The purity and correct molar ratios of the DESs were confirmed via
1H-NMR spectroscopy (
Figures S1–S8, Supporting Information). Notably, the precipitation of white crystals was found to occur in the L-Pro:LevA 1:2 system after a few days from its preparation, even after extended stirring and heating up to 80 °C; thus, this system was excluded from further investigation.
2.2. Density
The study of DESs densities is particularly interesting due to its connection to other physical and optical properties [
19]. Yet, differently from more commonly diffused DESs, as the ones based on choline chloride or betaine HBAs, density data concerning L-carnitine-, choline acetate- and L-proline-based systems are much more scarce in the literature and, to the best of our knowledge, density values are not available in the literature for any of the proposed DESs [
18,
50]. While the preparation of the DESs L-carn:EG 1:3, ChAcO:EG 1:2, ChAcO:Gly 1:2 and 1:3, and of L-pro:LevA and L-Pro:Gly DESs (respectively, in 1:2 and 1:2.5) has been reported [
23,
28,
29,
47,
51], no density measurements were performed in the published studies.
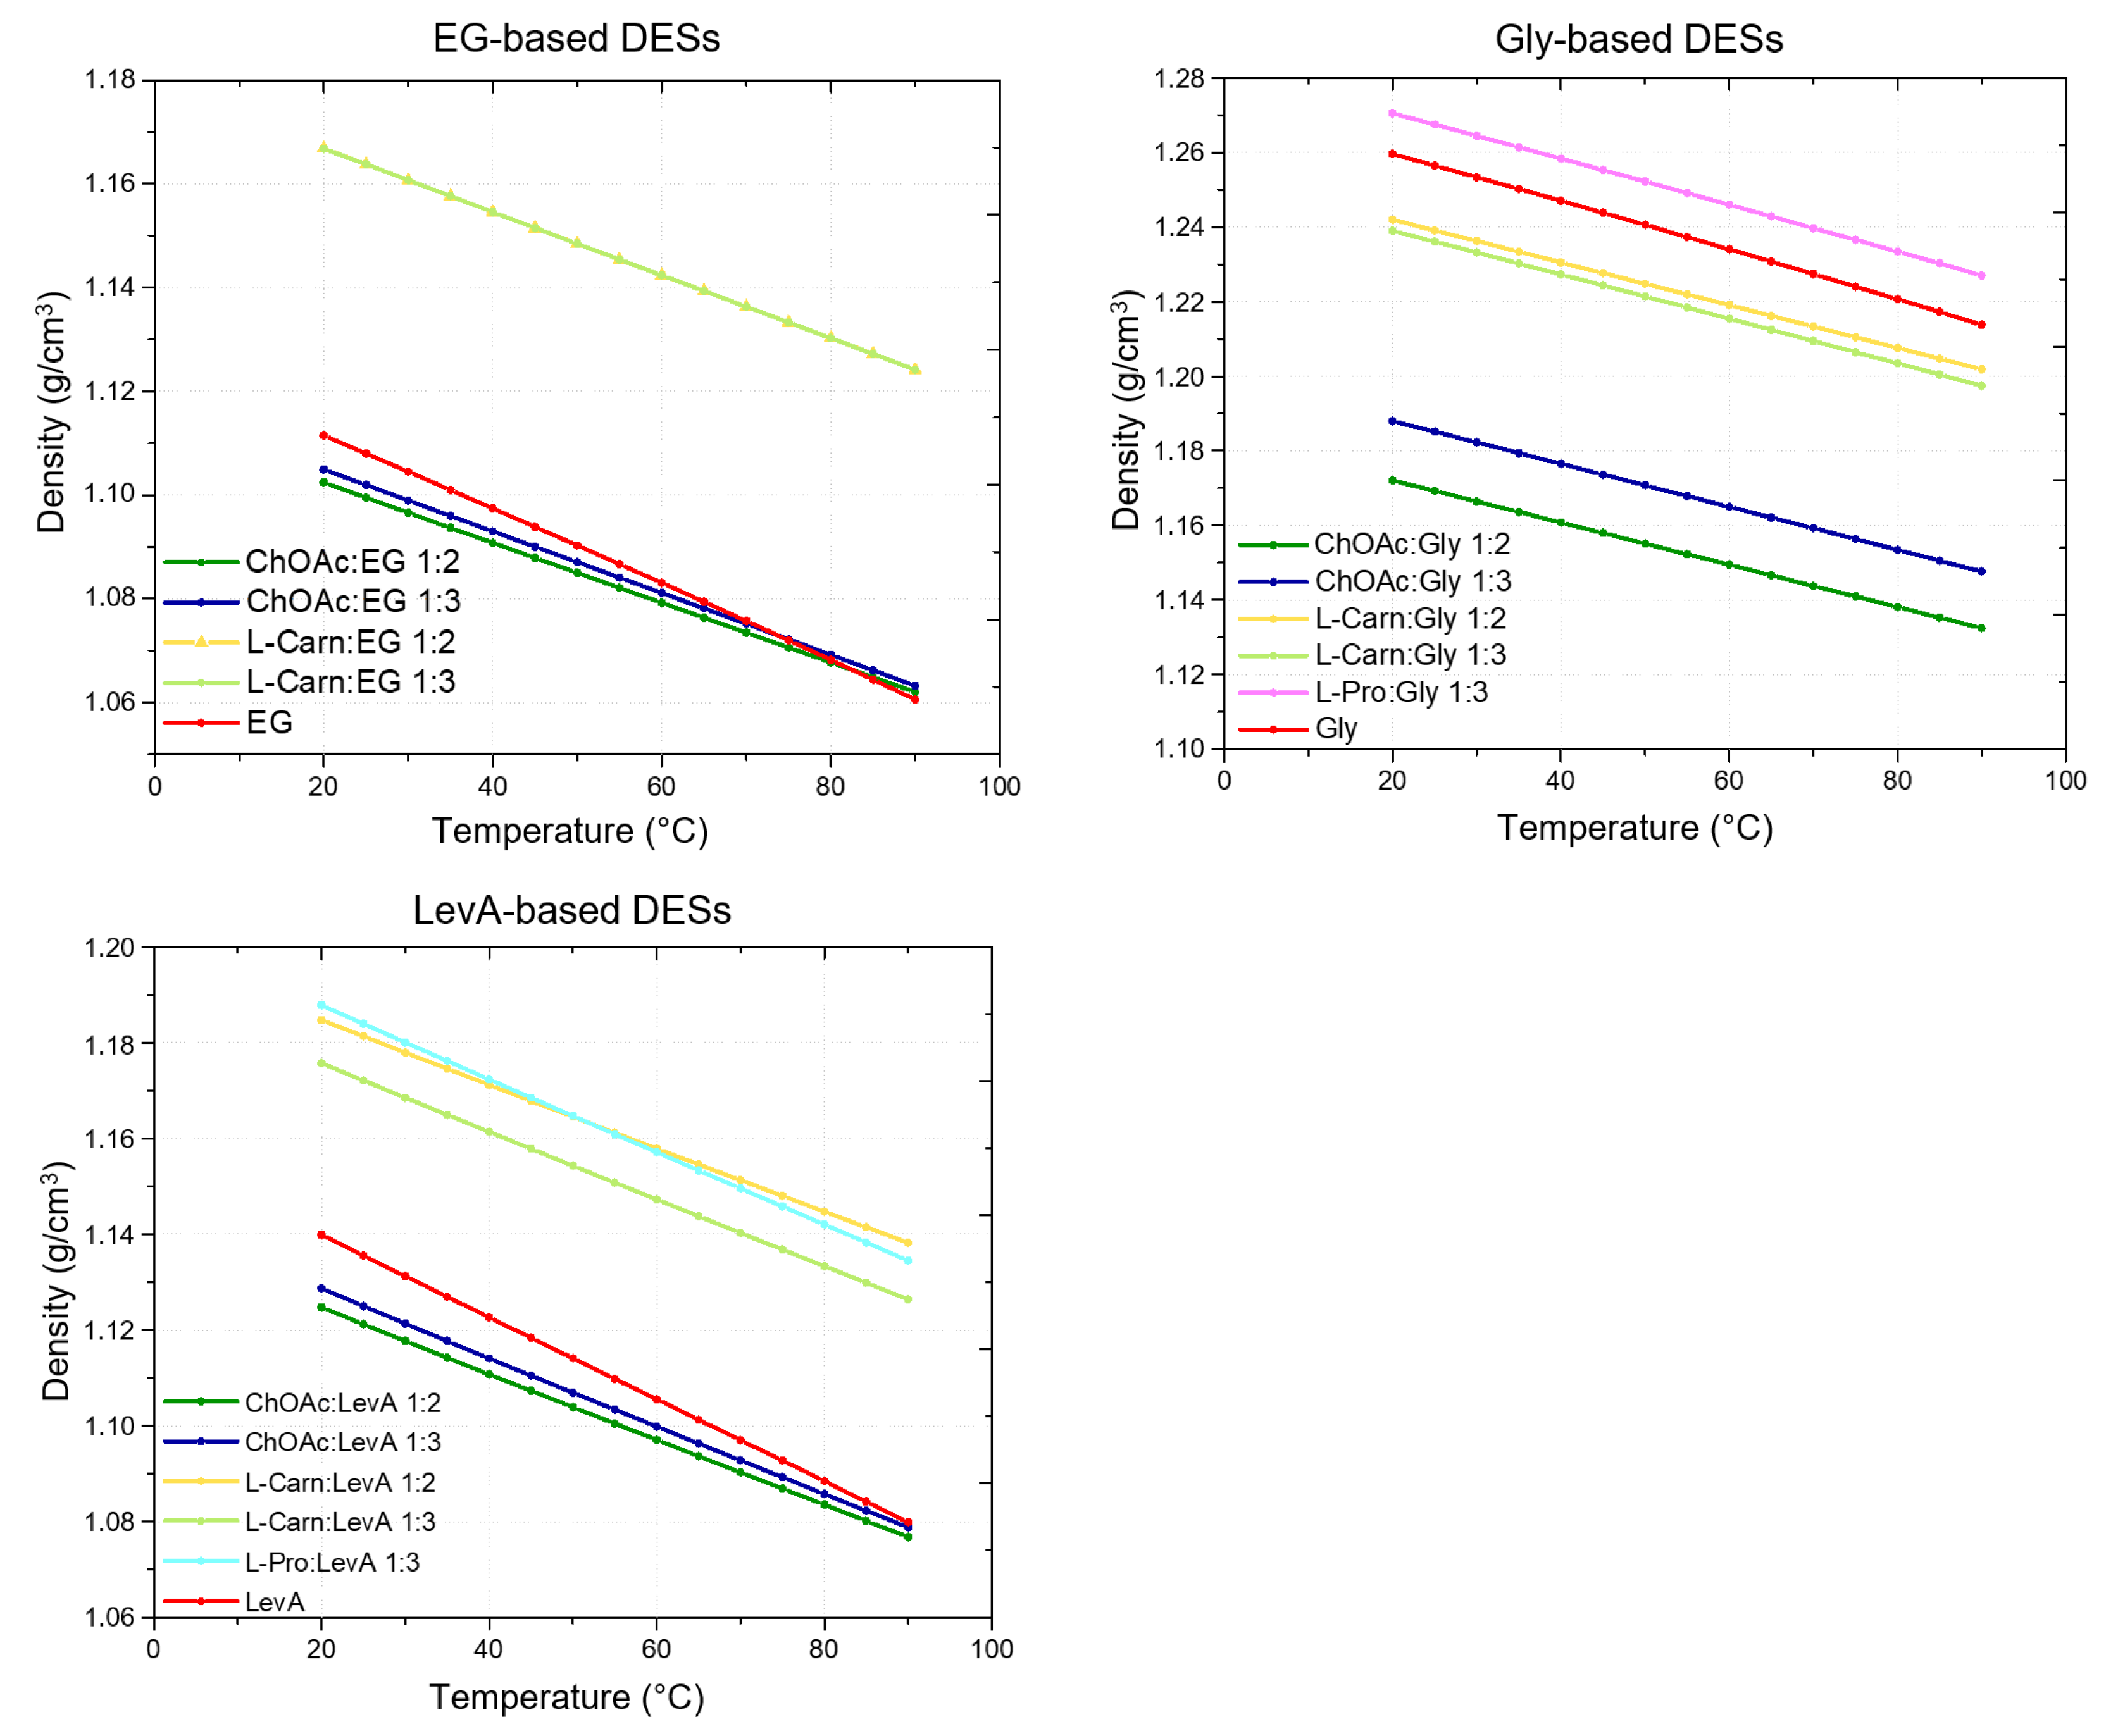
For each investigated DES, its density was measured at 5 °C intervals over the 20–90 °C temperature range (
Figure 1). The results are reported in
Tables S1–S3 (Supporting Information). In all cases, the obtained densities exceeded that of water and exhibited a linear decrease with the growth of the temperature, as illustrated in
Figure 1. The temperature dependence was accurately described by linear regression, yielding R
2 values consistently greater than 0.9999 across the entire range (
Figures S9–S15, Supporting Information). The corresponding slopes and intercepts of the linear fits for each DES and molar ratio are summarized in
Table 2. Additionally, the densities of the pure HBDs were measured and compared to those of the corresponding DESs.
From the obtained results it clearly emerges that both the HBA and the HBD, as well as their ratio, are important for defining the density of the resulting DES. Concerning the effect of the HBA, ChOAc was found to yield the less dense systems in comparison with the other tested HBAs, for each HBD. Interestingly, ChOAc:EG and ChOAc:LevA DESs were the only ones exhibiting lower density compared to the pure HBD. Only at higher temperatures (85 °C and 90 °C) was it possible to observe an inversion of this trend for ChOAc:EG systems, with the pure EG resulting slightly less dense (
Figure 1). L-pro-based DESs, on the other hand, were found to be the densest ones for each employed HBD (
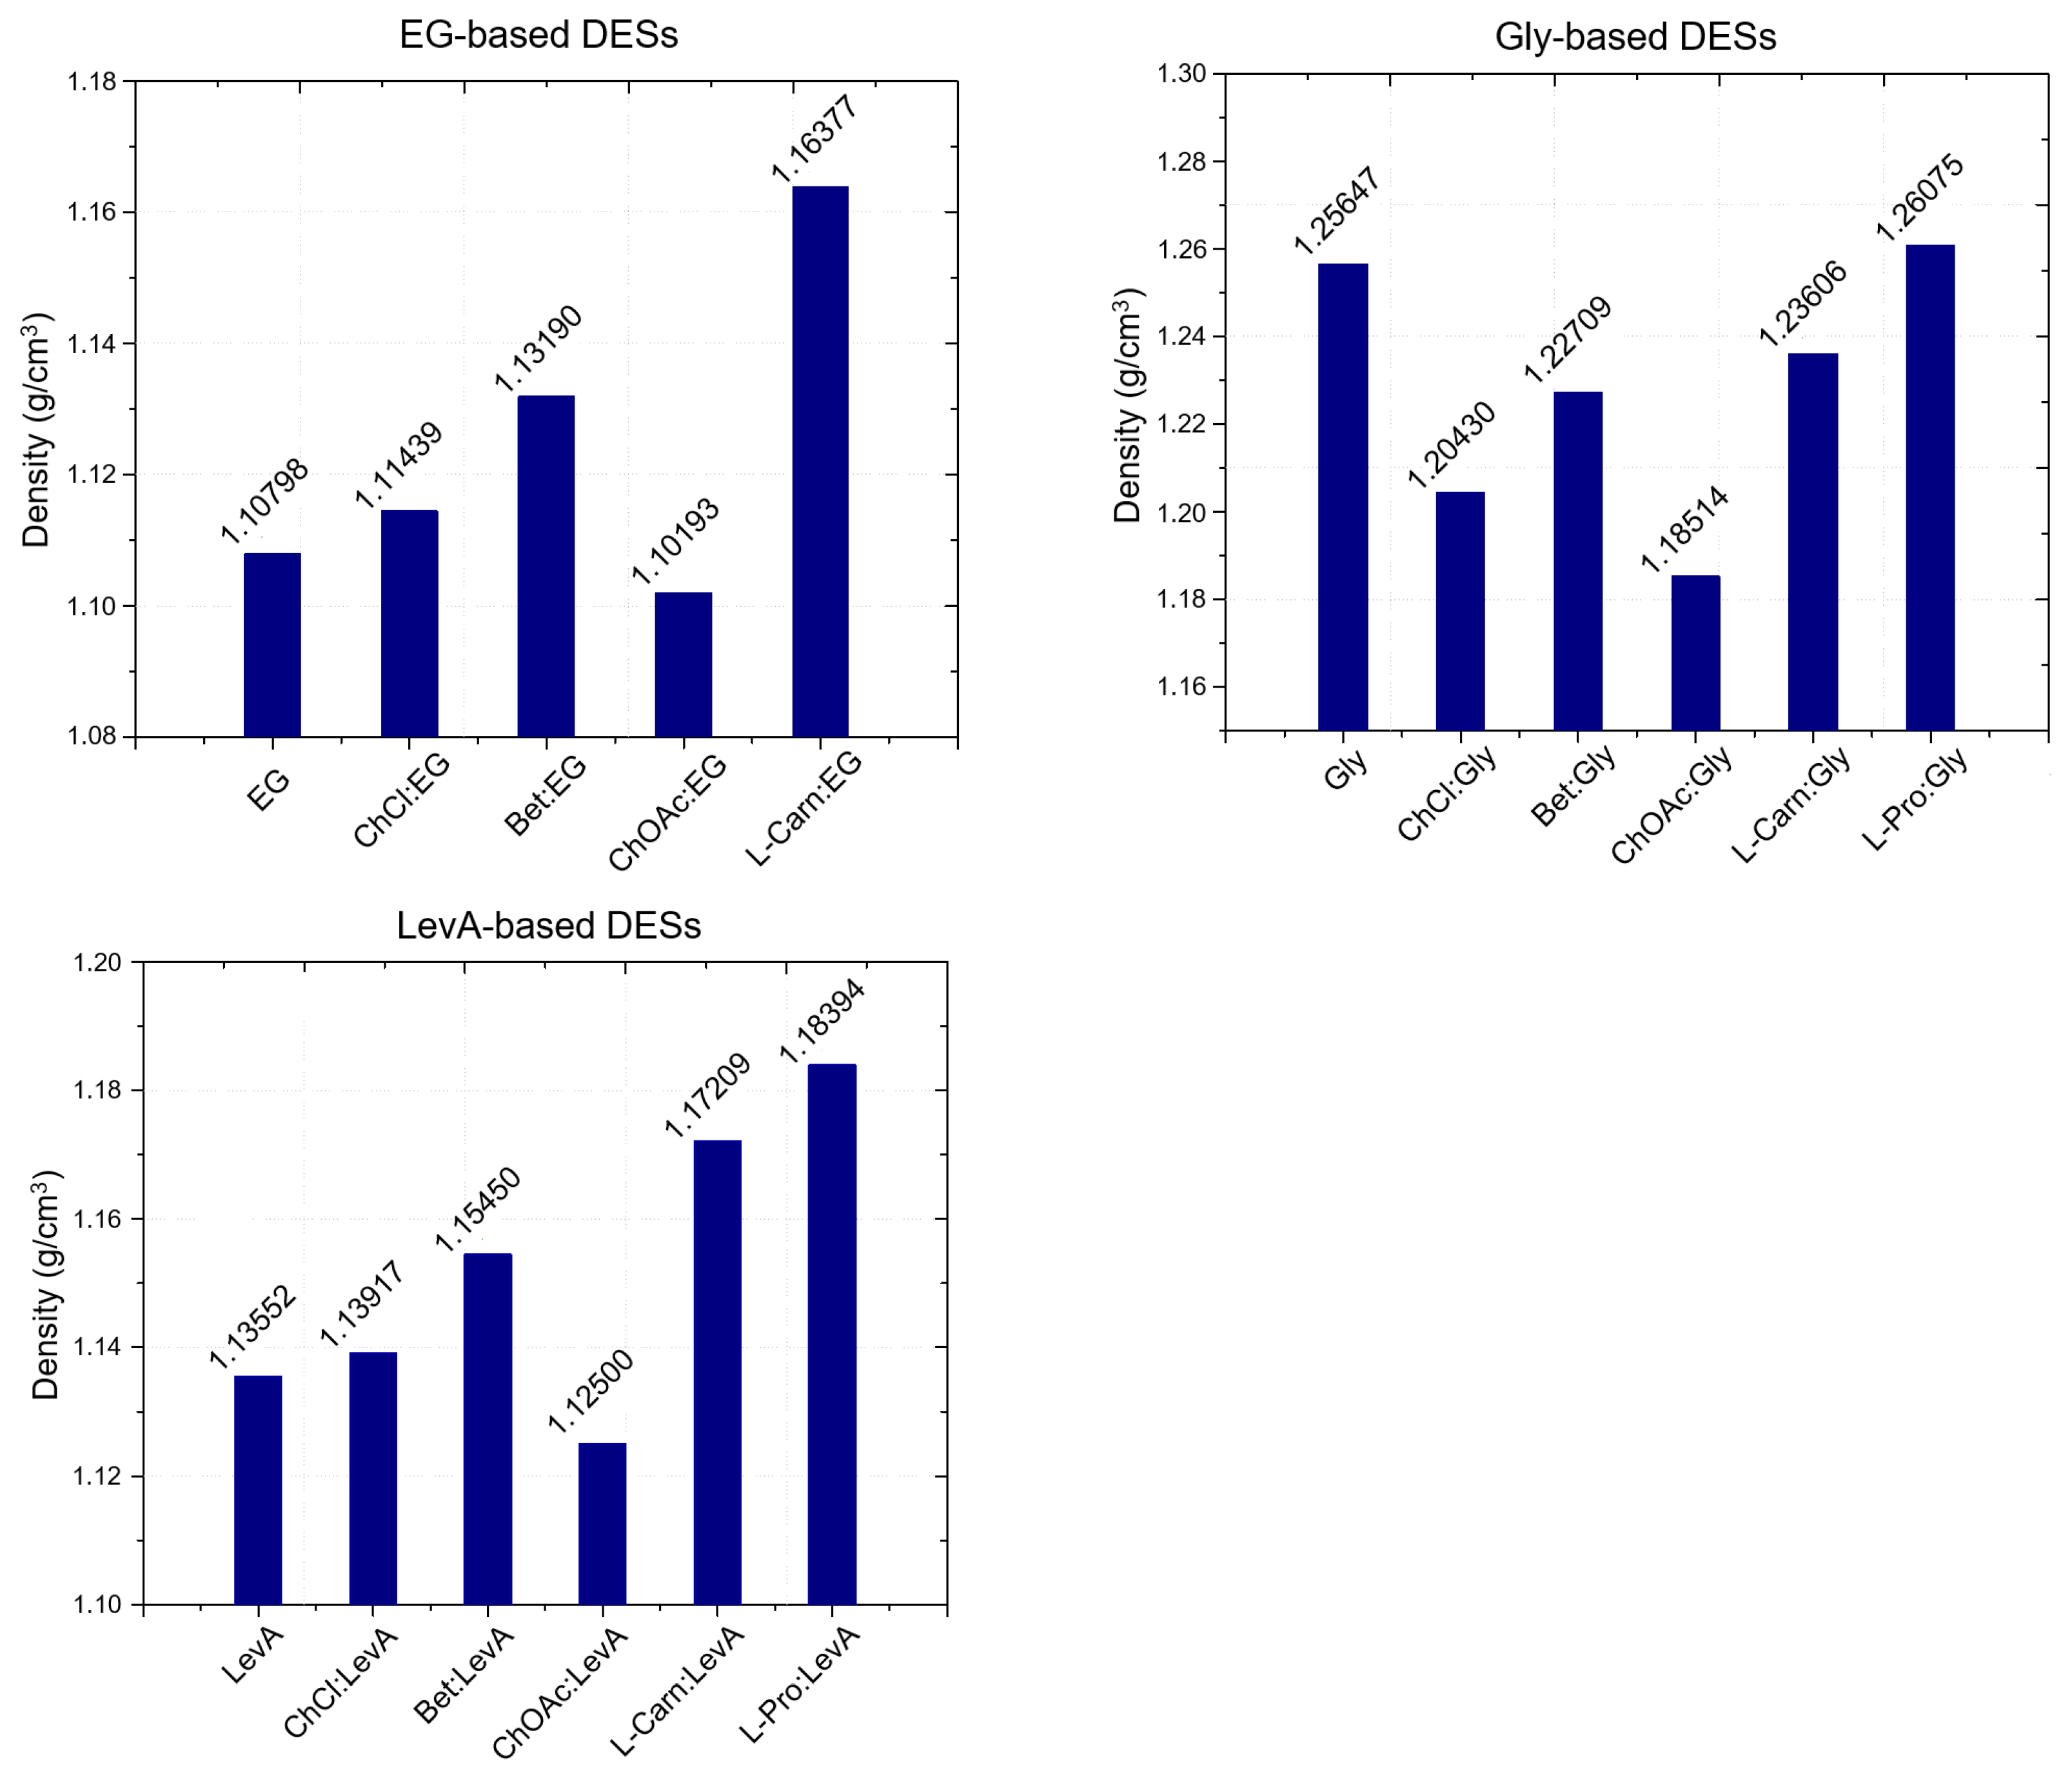
Figure 1). An exception to this general behavior could be found at higher temperatures, with L-carn:LevA 1:2 becoming denser than Pro:LevA 1:3 at temperatures above 50 °C. L-pro:Gly 1:3 was also found to be the only Gly-based DES displaying higher density than pure glycerol. Finally, L-carn-based DESs manifested an intermediate behavior, with density values comprised between the extremes represented by ChOAc and L-pro systems for each HBD (with the only exception, above mentioned, represented by the temperature driven density inversion between L-carn:LevA 1:2 and L-pro:LevA 1:3). By comparing the density values at room temperature with literature data for similar DESs (
Figure 2), it is possible to observe that the L-carn HBA yields denser DESs than the closely related betaine, for all the considered HBD (EG, Gly and LevA), while ChOAc consistently yield less dense DESs compared to those obtained with choline chloride (ChCl). The HBA density order can be resumed, including literature data, as ChOAc < ChCl < Bet < L-Carn < L-Pro.
Concerning the effect of the HBD, the reported data point out an evident direct relationship between the density of the HBD and the density of the resulting DES. For the same HBA, the DESs based on EG, the less dense HBD, have been found to display lower densities compared to DESs based on Gly and LevA, with the resulting density following the order EG < LevA < Gly (
Figure 1 and
Figure 2). Regarding the role of the HBA:HBD ratio, on the other hand, the obtained data do not point out any clear relationship with the density, and its effect appears strictly depending on the nature of both the HBA and the HBD. In the tested EG-based systems, the density differences between 1:2 and 1:3 HBA:HBD ratios were found to be minimal, with a slightly lower density observed for ChOAc:EG 1:2 compared to its 1:3 counterpart, while no significant differences were observable for the L-carn systems. When using Gly as HBD, on the other hand, ChOAc:Gly 1:2 displayed a significantly lower density compared to the 1:3 system, while a minimal increase in density was observed passing from the 1:2 to the 1:3 ratio for the L-carn:Gly system (
Figure 1). LevA-based DESs displayed a similar behavior, but in this case, the density differences were more evident for the L-carn:LevA DESs and minimal for ChOAc:LevA DESs (
Figure 1).
The increase in density observed passing from EG-based DESs to Gly-based ones, can be ascribed to the increase in the number of –OH functional groups in the hydrogen bond donor (HBD). As it is reported in the literature, this enhances the possibilities for hydrogen bond formation, thereby leading to higher system densities, underlining the critical role of intermolecular interactions in determining density [
12,
52,
53]. This trend has been extensively documented by Basaiahgari et al., who observed that DESs composed of benzyltrialkylammonium chloride as the hydrogen bond acceptor (HBA) and EG as the HBD exhibited lower densities compared to systems using diethylene glycol, triethylene glycol, or Gly as HBD [
54]. This rationalization is hardly applicable to the Lev-A systems, considering the different functional groups featured by levulinic acid, where instead of the hydroxyl groups, a carboxylic acid group and a carbonyl group are present. Neglecting other possible contributions to the density, it may be concluded that the hydrogen bonding property of Lev-A lies somewhere in between the ones of EG and Gly. Finally, the effect of the –OH groups on density can also be appreciated observing the density differences recorded between Bet and L-carn-based DESs, with L-carn-based systems, featuring a further –OH group on the HBA, manifesting a higher viscosity comapred to the related Bet DESs. Finally, the number of hydrogen bonds is affected by the HBA:HBD ratio, with higher numbers of hydrogen bonds reducing the free spaces available, and consequently increases the density of DESs [
52,
53]. According to the hole theory, the density and other physical properties of DESs are strongly influenced by the size, shape, and spatial arrangement of their molecular constituents. The molecular structure of DESs may contain voids or “holes”, the size of which directly affects the overall density of the system [
55]. This concept may further explain the observed differences based on the HBAs: the smaller zwitterionic or neutral nature of betaine, L-carnitine and proline can result in more compact molecular arrangements than those formed with the bulkier salt, ChOAc and ChCl salt [
19].
Finally, some observations can be made on the variation in density as a function of temperature. As already mentioned above, the obtained data are perfectly fitted by the linear model:
ρ =
AT +
B, where
A represents the slope of the linear dependence between the density and the temperature, and
B the density at 0 °C (the obtained parameters are reported in
Table 2, and the fittings are reported in
Supporting Information, Figures S9–S15). A quantity often considered in the analysis of the temperature dependence of density is the thermal expansion coefficient
β, defined as
which expresses the ease with which a liquid expands when heated under constant pressure. Considering the linear relationship found between density and temperature for all the considered systems, Equation (1) can be simply rewritten, in terms of A and B parameters, as
Unlike what was observed for density, where the influence of the HBA:HBD ratio was not clearly rationalizable, the effect of the ratio on β appears much more evident. For all six considered couples of DESs with equal HBA and HBD but different molar ratio, β grows passing from the 1:2 to the 1:3 molar ratio, meaning that the density of the considered 1:3 DESs reduces faster than the density of the corresponding 1:2 DESs along with the increase in temperature (with LevA systems being the ones where this effect is more evident). This trend is confirmed by literature data previously reported by our research group, where it was found to be applicable to the 1:4. molar ratio as well. Concerning the effect of the DES constituents on β, the role of the HBD appears to be preeminent. From the HBD imparting the lowest dependence of density from temperature to the highest, the trend can be summarized as Gly < EG < LevA. A dependence of β from the HBA type was also observed, even if not as evident as for the HBD. L-proline-based DESs displayed the highest β for each tested HBD, while with the same HBA and molar ratio, ChOAc was found to yield DESs with slightly higher β than the one obtained with L-carn. By comparing the results obtained for ChOAc and L-carn-based DESs in the current work and the literature data reported by our research group about ChCl and Bet-based DESs, it can be observed that the DESs featuring ChOAc as HBA display a higher β compared to ChCl-based DESs (in the same molar ratio with the HBD), while the DESs featuring L-carn as HBA display a lower β compared to Bet-based DESs (in the same molar ratio with the HBD).
Eventually, another quantity closely related to density worth mentioning is represented by the molar volume, described by the following equation
where and
ρ and M
DES represent the density and the molar mass of the DES, respectively. M
DES was calculated as a sum of products between the molar mass of each DES component and its term of the molar ratio
for a DES with HBA:HBD ratio of n
HBA:n
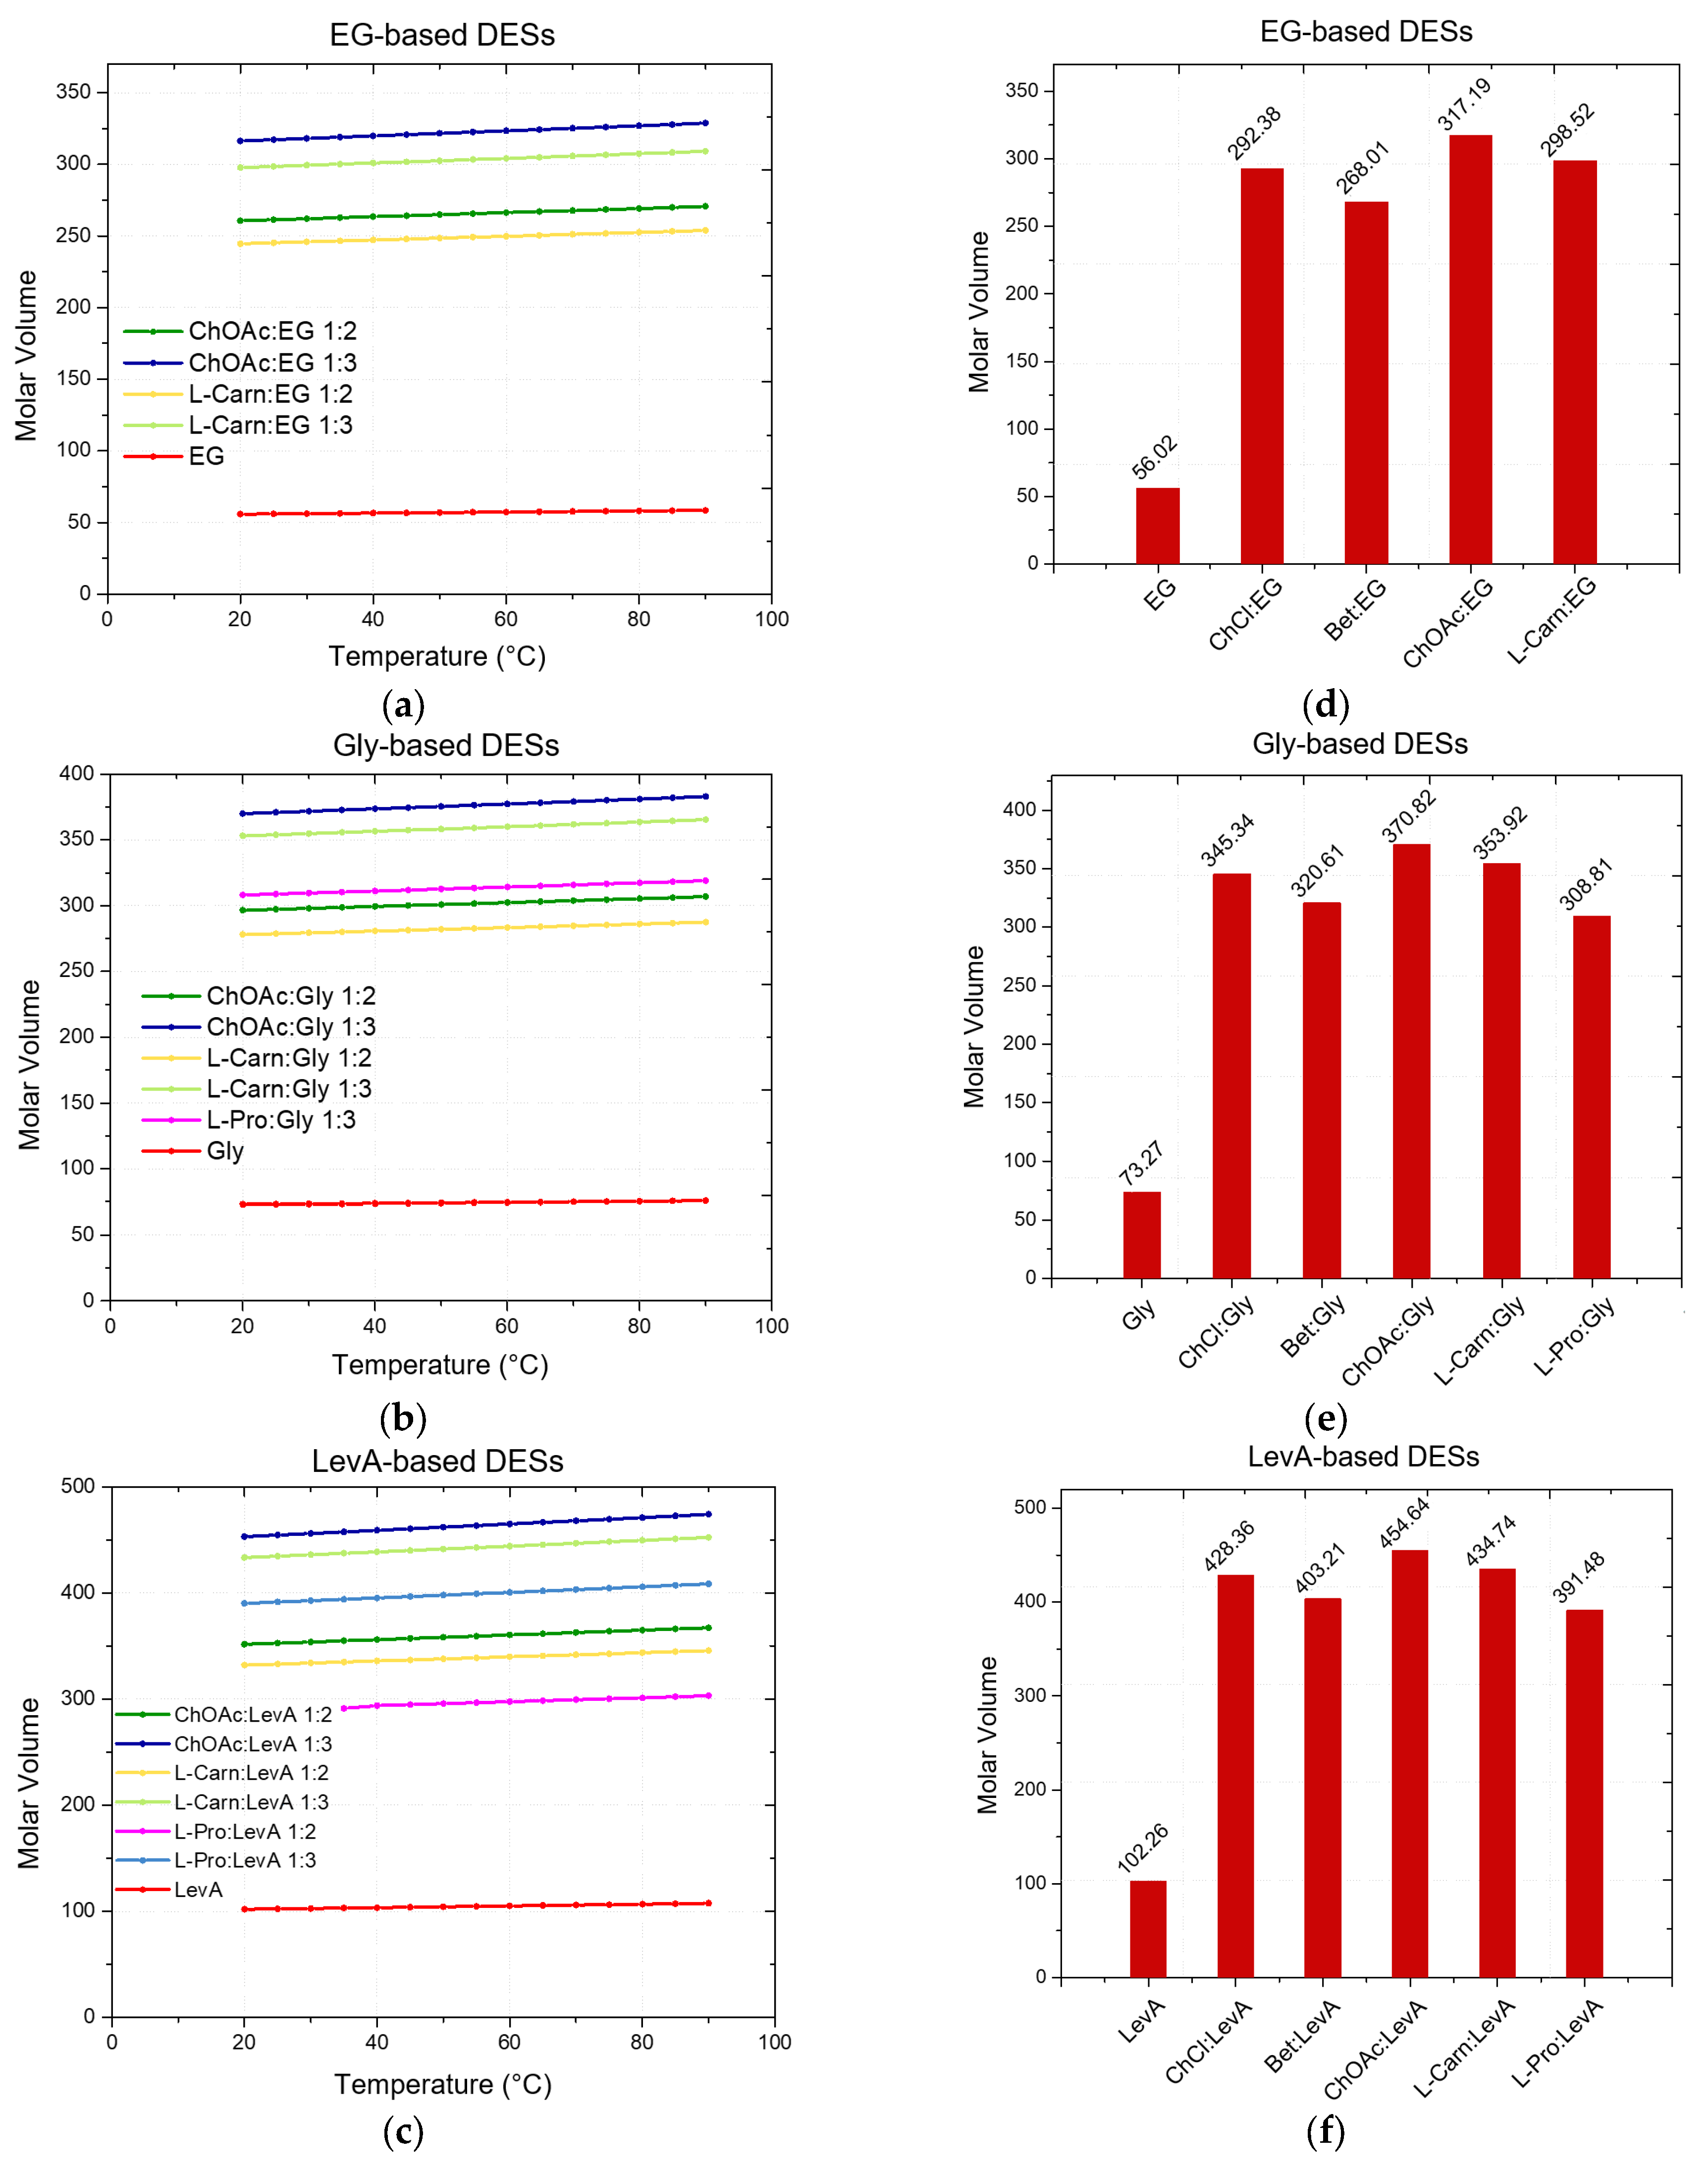
HBD. The obtained results, displayed in
Figure 3 (and summarized in
Supporting Information, Tables S4–S6), show a strong dependence of the molar volume on the molar ratio of the DES (due to the term n
HBD×M
HBD), with the DESs 1:3 displaying a higher molar volume compared to the 1:2 DESs.
Besides the role of the molar ratio, the effects of both HBA and HBD on the definition of the molar volume of each DES can be easily summarized. Concerning the effect of the HBD, the trend follows the molar volume of the pure HBDs: EG < Gly < LevA, with DESs based on the same HBA but different HBD displaying increasing molar volumes according to this order. An equally clear trend can be found for HBAs. Including the data reported in the literature in a previous work, the trend L-Pro < Bet < ChCl < L-carn < ChOAc describes the observed trend for the molar volumes of DESs sharing the same HBD. Finally, following the decrease in density along with the temperature increase described above, the molar volume of each considered DES was found to increase when temperature increased.
2.3. Viscosity
Viscosity represents a fundamental parameter which contributes to the definition of the transport properties of a DES and, therefore, it is a key factor for the assessment of its applicability as a reaction or extraction medium, with a particular relevance from an industrial perspective. Similarly to what was previously mentioned about density, for viscosity, no data were available in the literature about the investigated DESs at the best of our knowledge [
18]. The only exception is represented by the DES ChAcO:Gly 1:2, for which the value of viscosity at 50 °C has been reported [
23].
Initially, to assess the general flow behavior of the considered DESs, viscosity was measured in the shear rates range from 1 s
−1 to 1000 s
−1 (except of L-carn:Gly systems), at 20 °C. The high viscosity displayed by L-carn:Gly 1:2 and L-carn:Gly 1:3 DESs suggested the adoption of a narrower shear rate range (from 1 s
−1 to 100 s
−1), with both the DESs exhibiting Newtonian range in this interval. The flow curves of each considered DES showed a typical Newtonian behavior at lower rates, exhibiting constant viscosity values independent from the shear rate applied and from its duration. However, more viscous solvents such as glycol-containing DESs and L-Carn:LevA 1:2 did not display a Newtonian liquids behavior at higher shear rates, where a viscosity decrease could be observed, pointing out the rising of a shear-thinning behavior. This behavior is consistent with literature data [
19,
56] and it indicates that, at a microscopic level, DESs systems can be regarded as formed by liquid phase aggregates which become weakened or disrupted at high shear rates. For the test in function of temperature, the viscosity was analyzed at the constant shear rate of 50 s
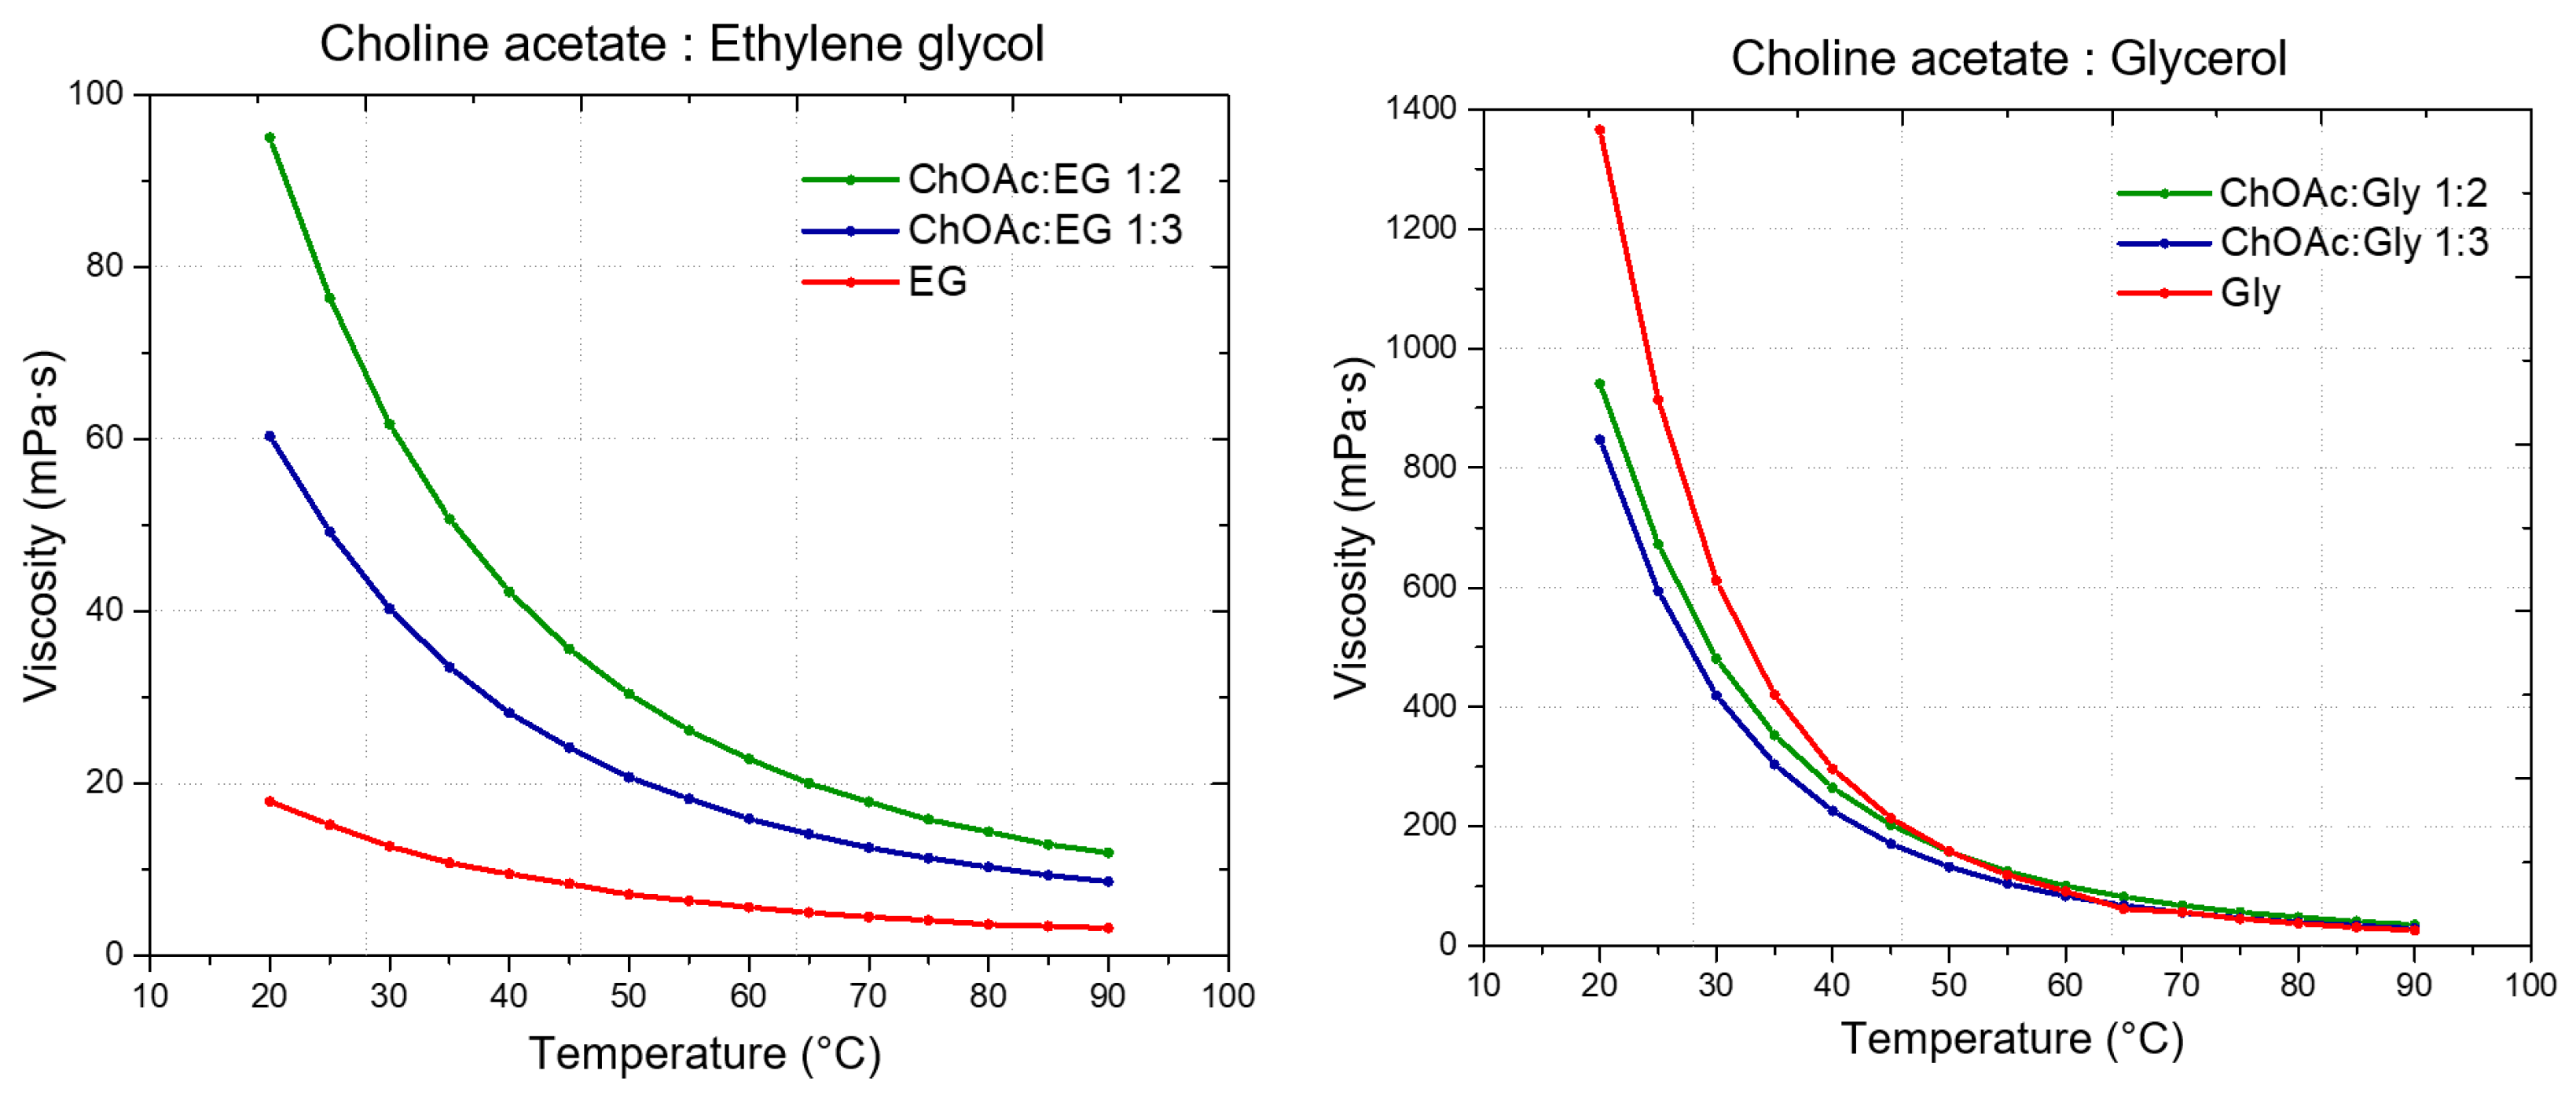
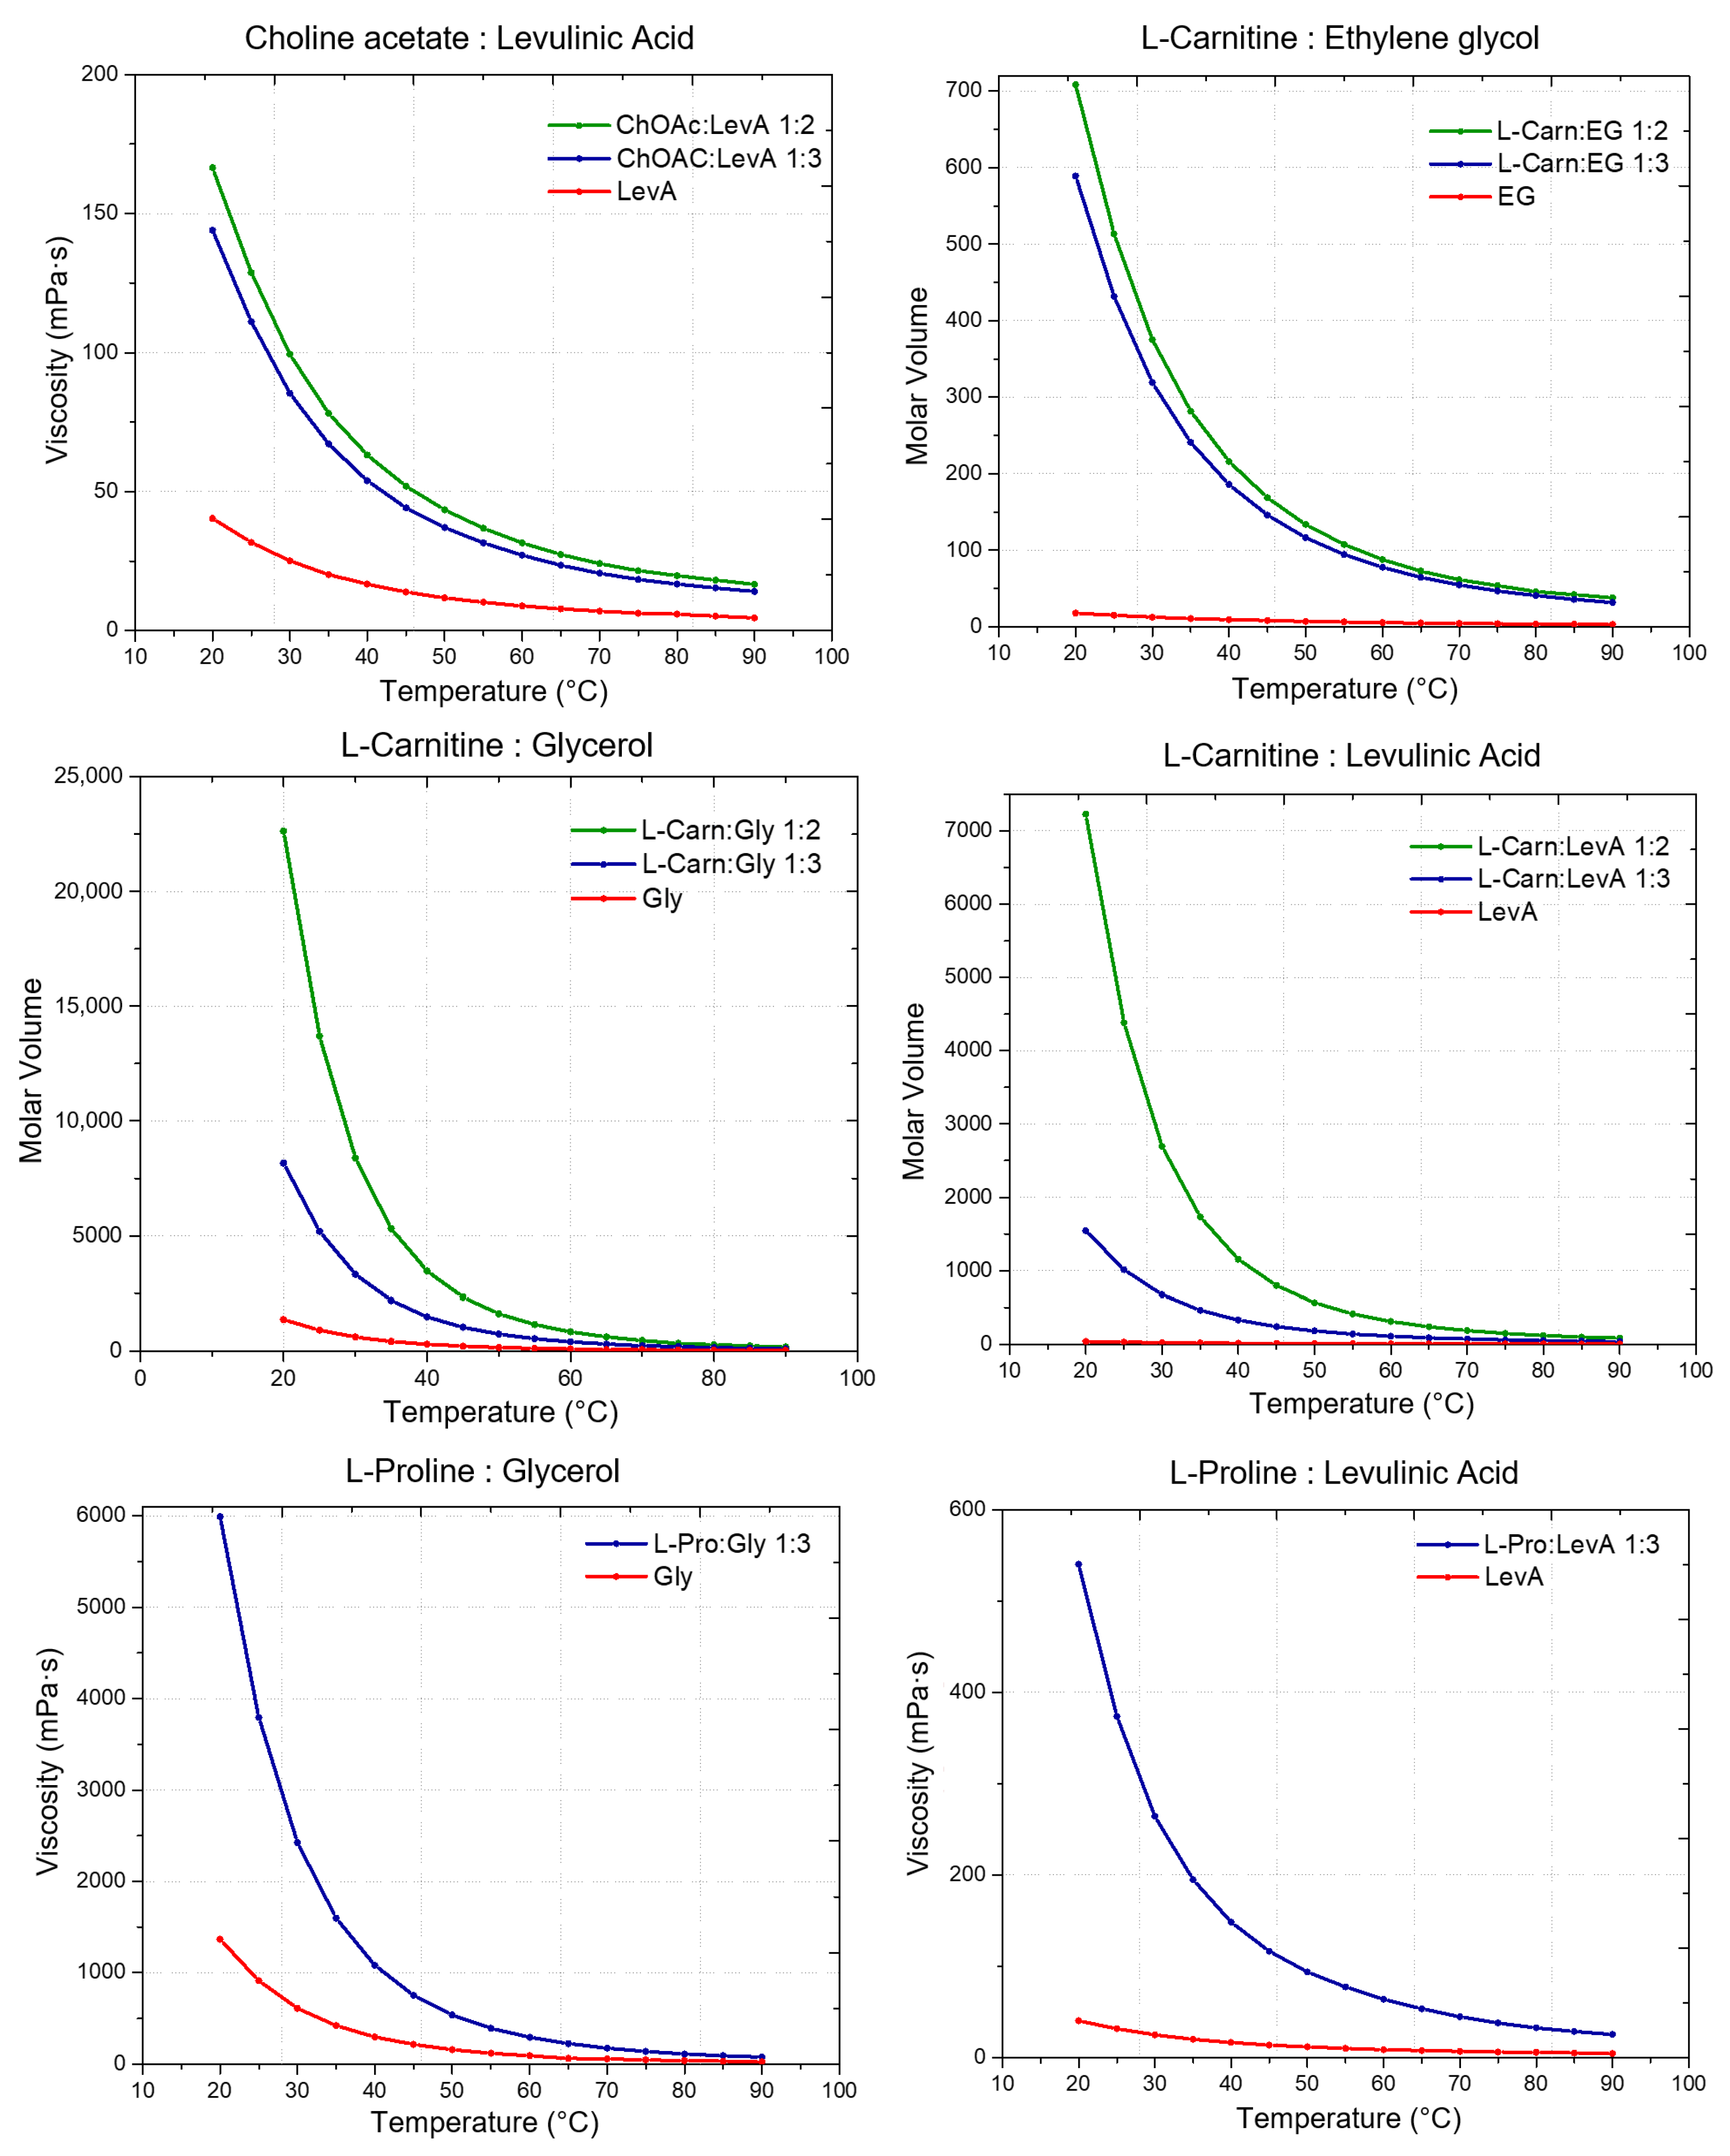
−1, where all samples exhibited Newtonian behavior. The temperature was increased in 5 °C incremental steps up to 90 °C, with data recorded at each step. The obtained values are illustrated in
Figure 4 and reported in
Tables S7–S9 (Supporting Information). Additionally, the viscosity of neat HBDs was measured and compared to that of the respective DESs.
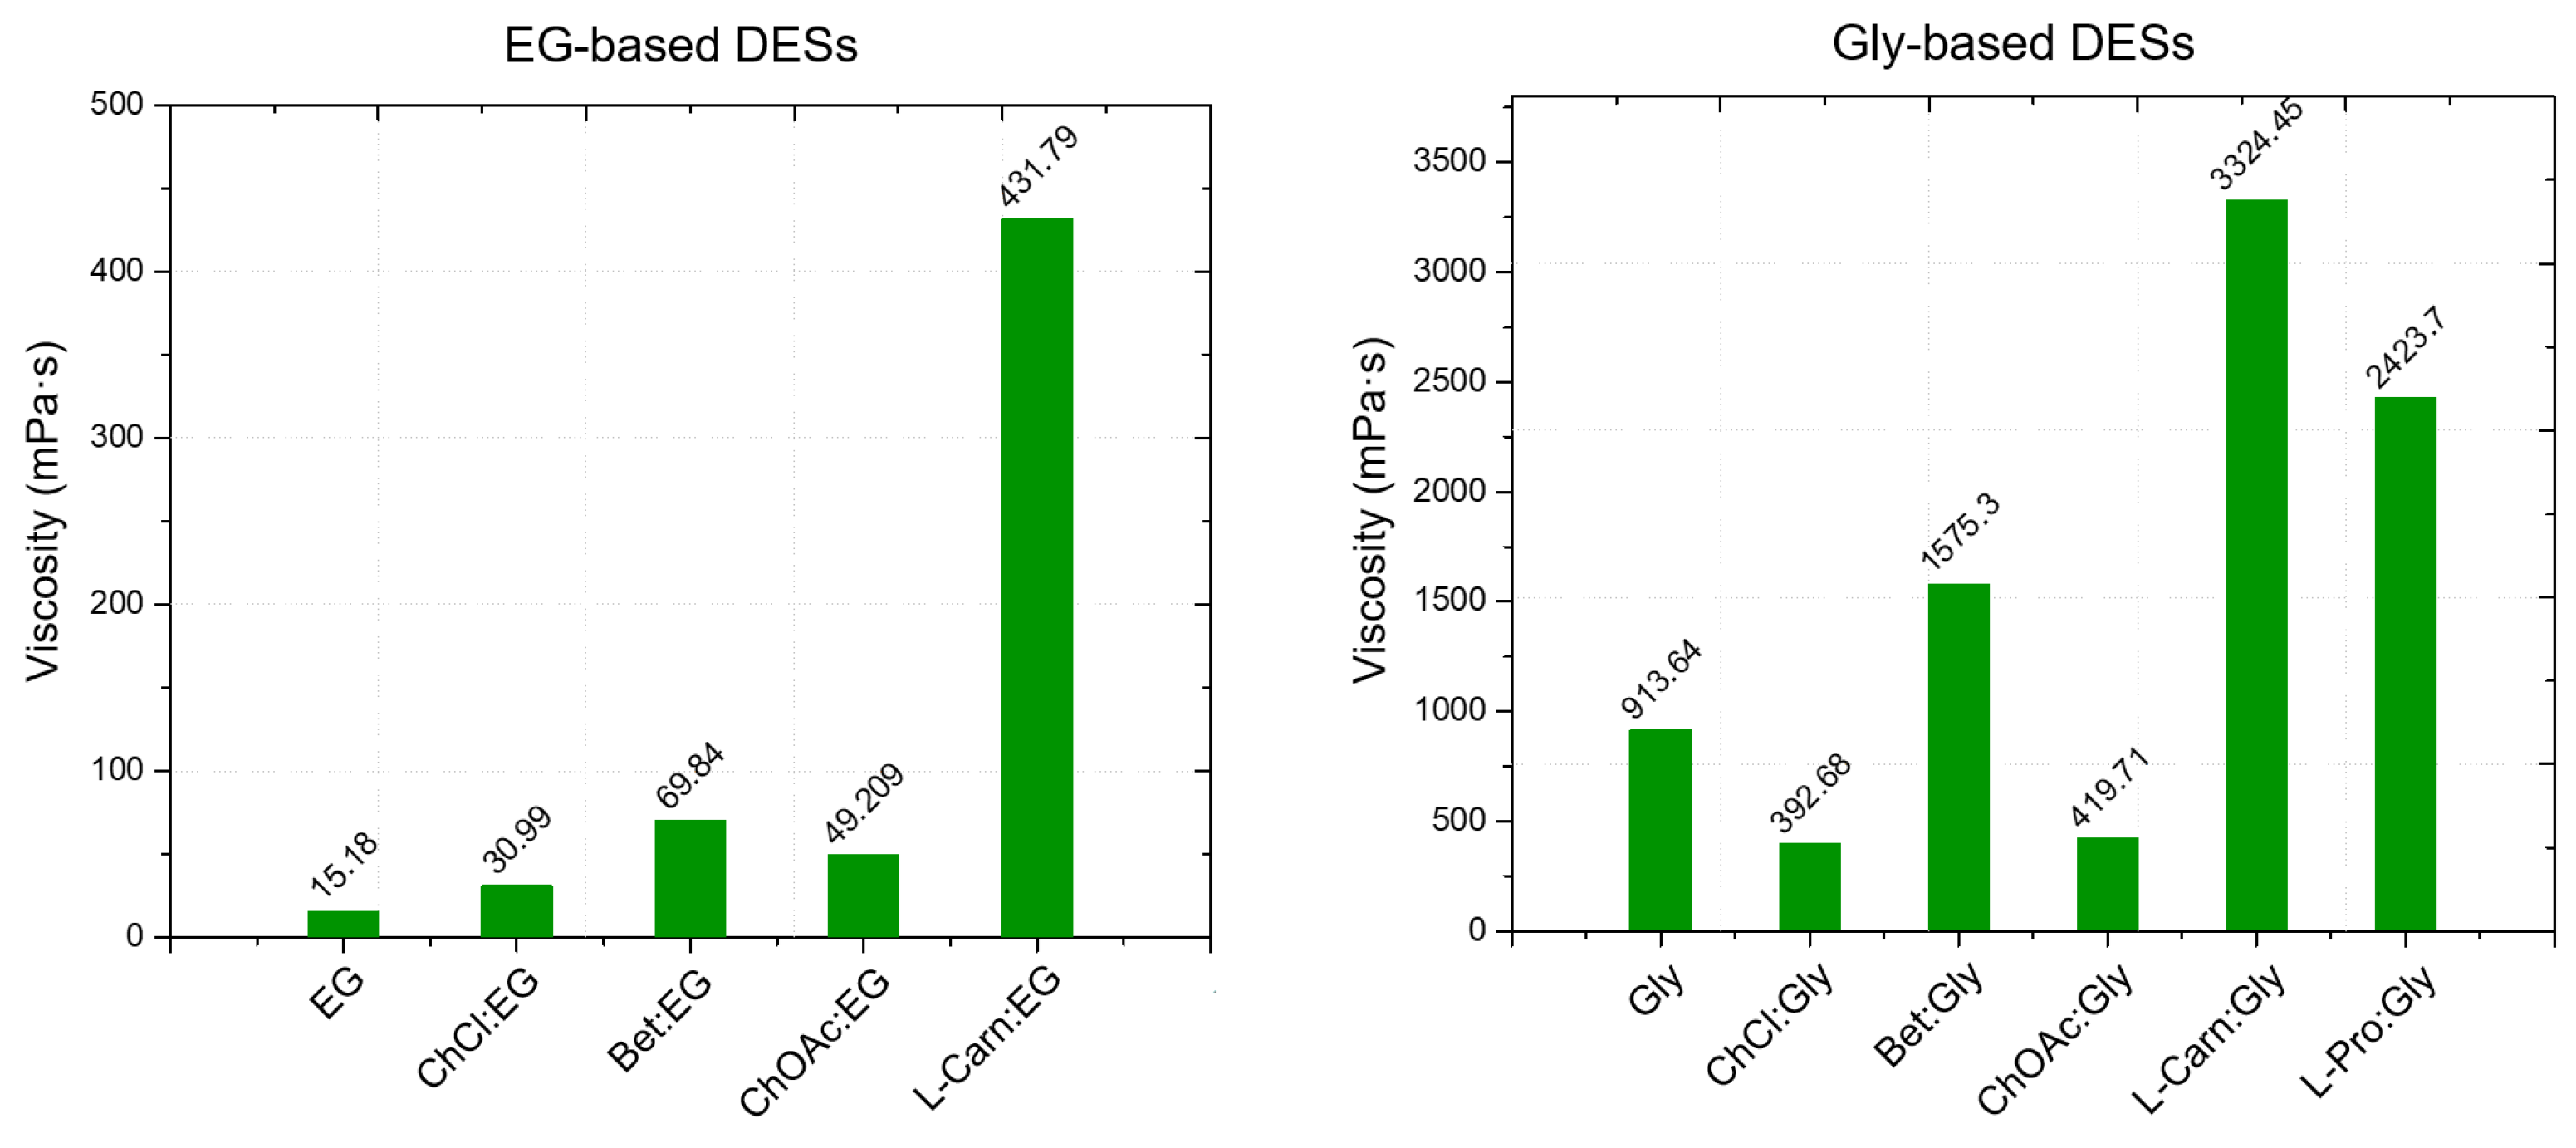
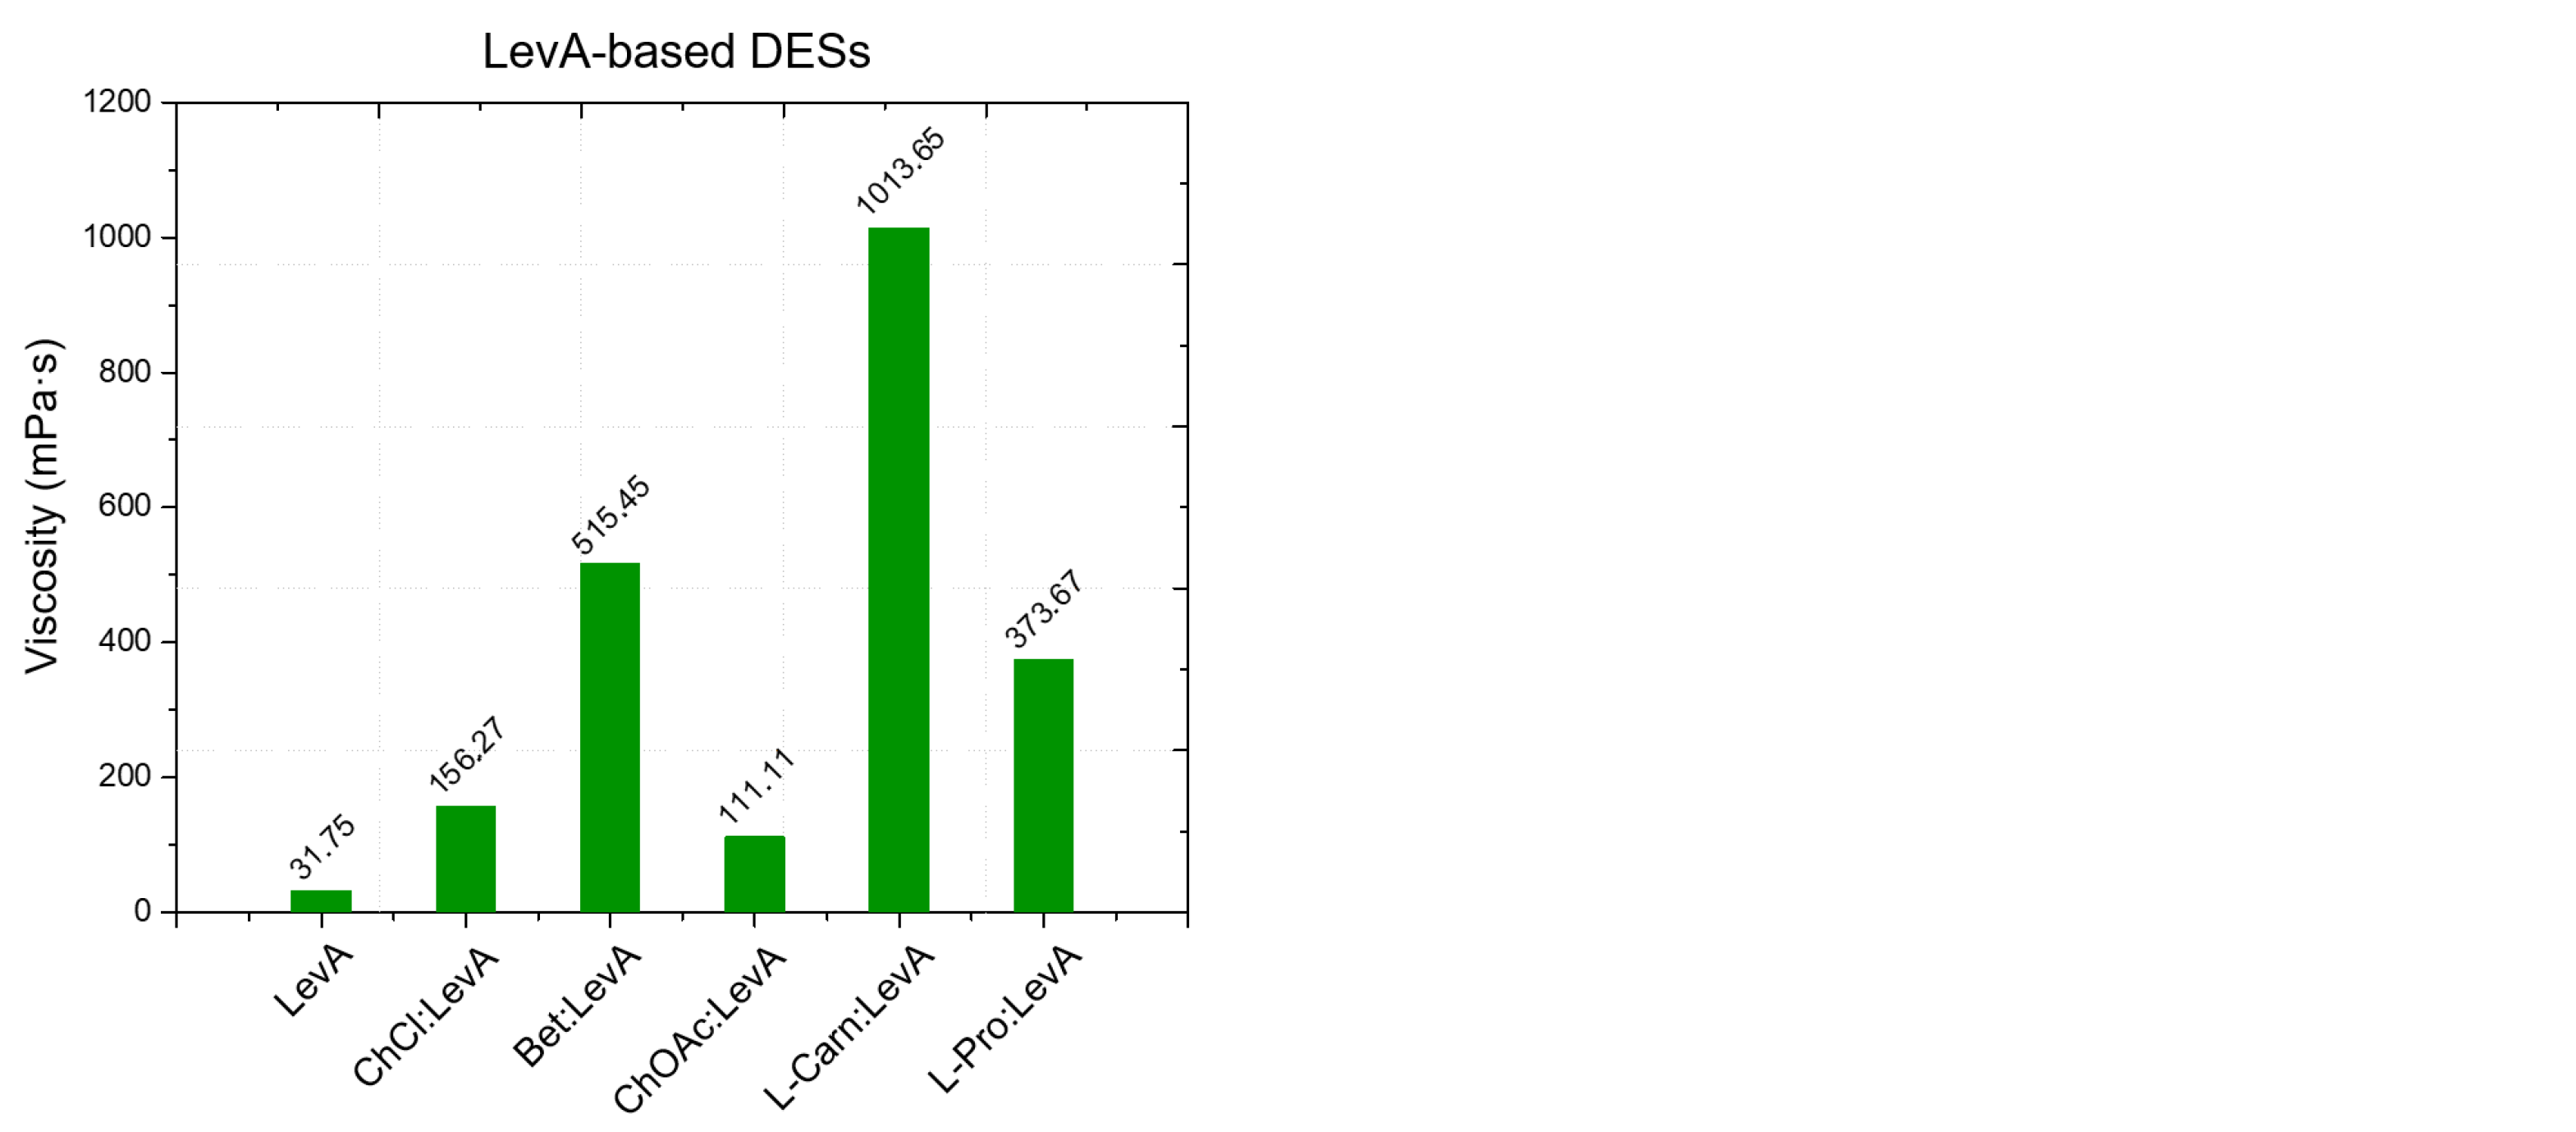
From the viscosity data obtained as a function of temperature, a strong dependence of the DES viscosity both from the HBA and the HBD, as well as from the molar ratio between the DES components is evident. Regarding the role of the HBD, within DESs with the same HBA, the viscosity was found to increase following the order EG < LevA < Gly, which is also the same order observed above about the relationship between HBD and density. Similarly to what observed for the density (where many DESs were found to display a lower value than pure glycerol) also during the viscosity study glycerol was the only tested HBD to not display a lower one compared to all the considered DESs, with ChOAc-based systems showing a lower viscosity. This behavior was reported in the literature also for ChCl systems (
Figure 5). The role of the HBA in the definition of viscosity was found to be equally important, and the viscosity of the considered DESs was observed to increase according to the order ChOAc < L-pro < L-carn for each considered HBD. Finally, the effect of the molar ratio clearly emerged as a third fundamental element in the definition of the DES viscosity, with the observed trend being 1:3 < 1:2 for each considered HBA and HBD. The test performed at increasing temperature displayed spectacular drops of the viscosity values for Gly and LevA-based DESs, with the original severe viscosity differences becoming greatly dampened above 70 °C.
The viscosity of ChOAc:Gly 1:3 measured at 50 °C (157.91 mPa·s) was found to be higher than the value reported in the literature (80 mPa·s), which is reached at 65 °C. This discrepancy may be due to differences in the water content or, less likely, in thermostating inaccuracies [
23]. Similarly to what was observed for density, the observed viscosity trends can be ascribed to the specific characteristics of the hydrogen bond acceptor (HBA) and donor (HBD) components of the DESs, particularly their molecular weight and size, which directly influence intermolecular interactions such as hydrogen bonding and van der Waals forces [
12]. These factors significantly impact the overall mobility of the system. Again, the presence of further—OH groups on glycerol and L-carnitine with respect to ethylene glycol and betaine was found to lead to an increase in viscosity. Furthermore, the hole theory also provides a useful framework for the interpretation of these results. Abbott and colleagues applied this model to demonstrate how the presence of voids or “holes” within the liquid phase facilitates the movement of components within the hydrogen-bonded network [
53]. They proposed that viscosity is more strongly influenced by volumetric factors, including steric effects, than by intermolecular interactions alone. According to this theory, the size and distribution of holes are closely linked to the structural characteristics of both HBA and HBD. The hole theory also accounts for the temperature dependence of viscosity. At lower temperatures, the average size of holes is smaller relatively to the molecular dimensions of the DES components, limiting their ability to move freely and thereby increasing viscosity [
12]. In contrast, at elevated temperatures, the holes expand to sizes comparable to the DES components, promoting greater molecular mobility and consequently reducing viscosity [
12].
The non-linear relation between viscosity and temperature is commonly modeled through the Arrhenius equation, which can be expressed in logarithmic form as
where η
∞ represents the viscosity at infinite temperature, E
a is the activation energy for viscosity flow, R is the universal gas constant and T is the temperature in kelvin.
Ea was calculated for each DES from Equation (5) using the fitting parameters, reported in
Table 3, of the slope of the
vs. T
−1 plots (
Figures S16–S30, Supporting Information). The obtained data pointed out an evident correlation between the calculated values of E
a and the measured viscosity values. Less viscous DESs displayed lower
Ea values, with the lowest one for ChOAc:EG, while Gly-containing systems, which displayed higher viscosities compared to the other DESs considered in the study, showed higher E
a values, with the highest one observed for L-carn:Gly. LevA-based DESs, characterized by intermediate viscosities compared to EG and Gly-based systems, exhibited intermediate values of
Ea. Concerning the effect of the type of HBA, similarly to what was observed for the HBD, the same trend reported for viscosity was followed by
Ea. Despite the satisfactory data fitting provided by the Arrhenius model, a subtle yet visible deviation from linearity in the plotted data is still evident, as also confirmed by the R
2 of the fittings, which calls for the use of a more optimized model.
The viscosity data were subsequently fitted using the Vogel–Fulcher–Tammann (VFT) model, which represents an alternative widely used approach to model the viscosity as a function of temperature
where
η∞ is again the viscosity at infinite temperature, the parameter B substitutes the term
Ea/
R and the parameter
T0, which actually is the novel contribution of the VFT model compared to the Arrhenius one, virtually represents a temperature threshold below which any particle movement in the fluid is blocked, leading to infinite viscosity. The obtained fitting parameters are summarized in
Table 4. By comparing the VFT fitting plots (
Figures S16–S30, Supporting Information) and the related R
2 values (for all DESs R
2 > 0.999) with the corresponding Arrhenius model fittings, it clearly emerges that the VFT model provides a better description of the viscosity data.
2.4. Thermal Properties
The evaluation of the thermal properties of DESs represents a fundamental step, together with the study of the rheological properties, for the assessment of their applicability as solvents. Despite their importance, to the best of our knowledge, data on thermal stability and DSC behaviour have been reported in the literature only for the DESs ChAcO:Gly 1:2, ChAcO:Gly 1:3 and ChAcO:EG 1:2 [
18,
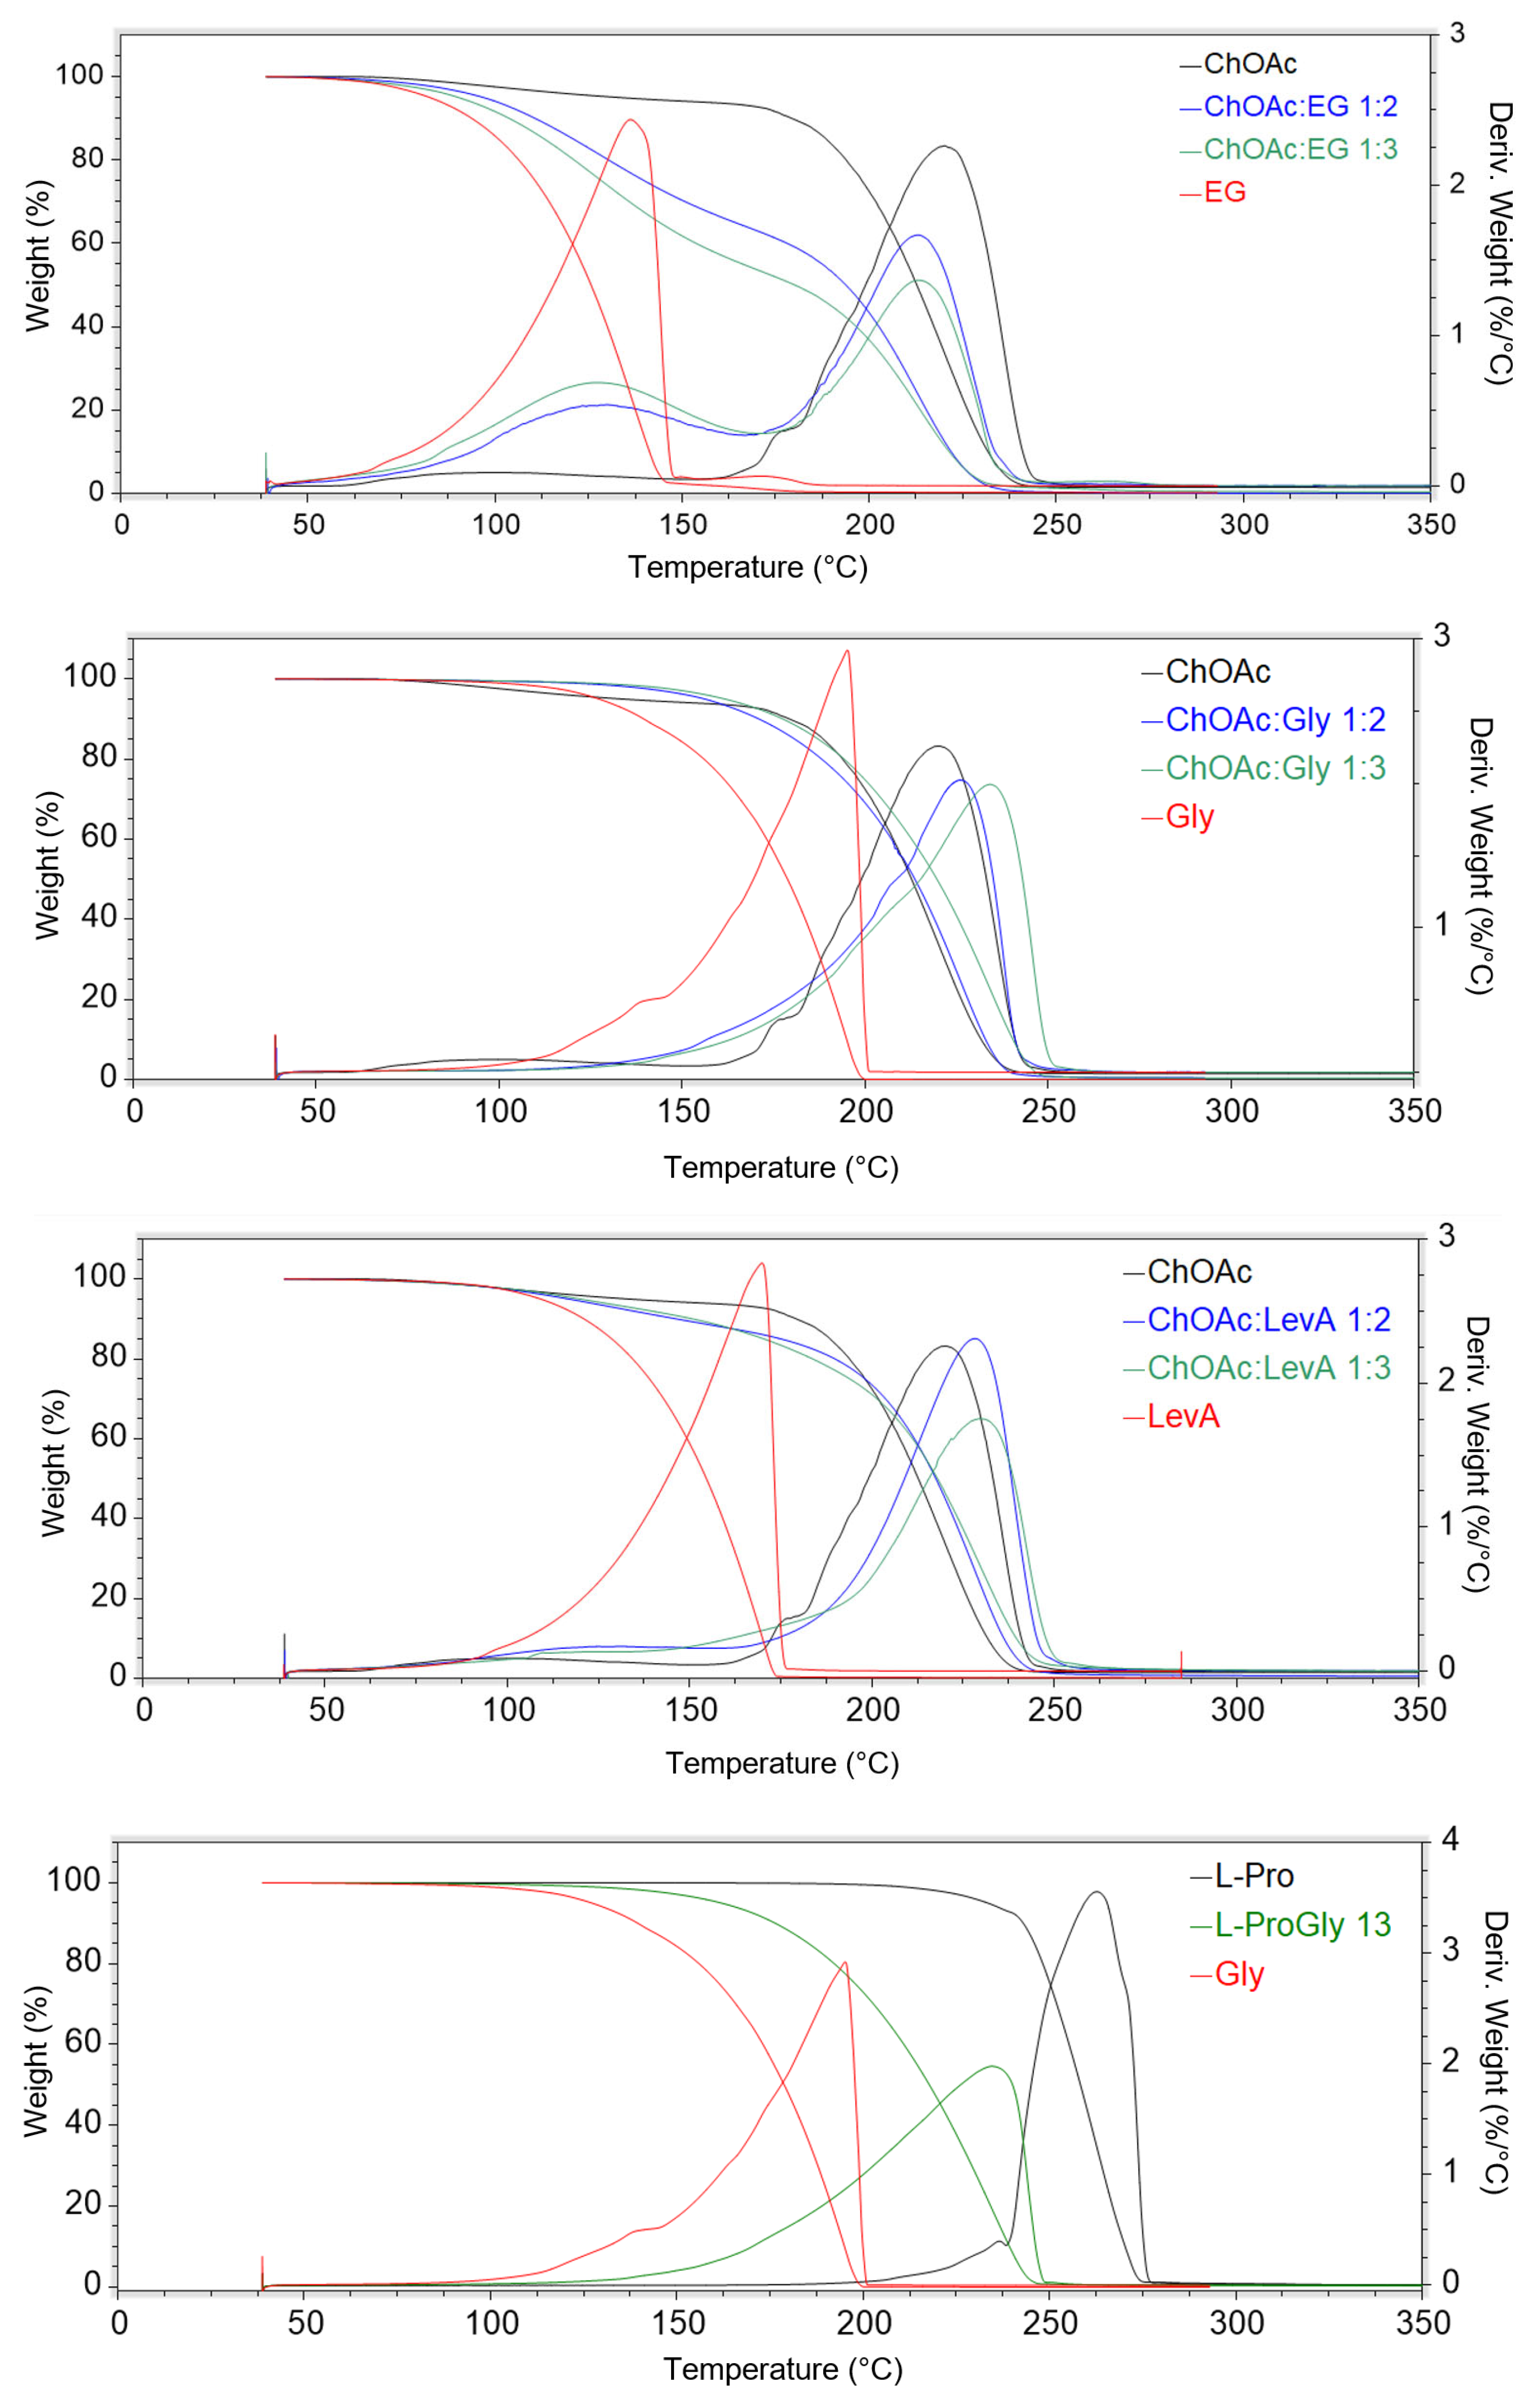
23]. The thermal stability of the considered DESs has been studied through thermal gravimetric analysis, performing a drying preliminary phase at 60 °C for 30 min, in order remove the water possibly absorbed from air during the sample preparation operations. The obtained thermograms are reported in
Figure 6, and the results are summarized in
Table 5 (the single thermograms are reported in
Supporting Information, Figures S31–S45).
The obtained data indicate a preeminent role of the type of HBD on the thermal stability characteristics of the studied DES. This effect is particularly evident on the T
5% value, where the trend EG < LevA < Gly can be observed for each HBA. On the other hand, EG DESs are the only ones that manifest a clear HBD effect on T
onset and T
peak, while Gly and LevA-based DESs sharing the same HBA displayed similar thermal stability. A strong effect of the HBD was observed in L-Pro-based DESs, where the LevA systems displayed thermal degradation parameter values 30–70 °C lower than the corresponding ones measured for the L-Pro:Gly DES. A schematization of the effect of the HBA nature on the thermal stability appears difficult due to the minor temperature variations generally observed for both T
5%, T
onset and T
peak among the studied DESs sharing the same HBA but with different HBD. Furthermore, in many cases, T
5%, T
onset and T
peak are affected in a different way by the change in HBA. L-carn DESs appear to exhibit T
onset and T
peak values about 10–20 °C lower than the corresponding ChOAc systems, but only with Gly and LevA HBDs, while no temperature differences can be observed for EG DESs. Conversely, only for the LevA HBD, L-carn DESs displayed a higher T
5% value (15–35 °C) when compared with the corresponding Gly-based DESs. L-Pro:Gly 1:3 displayed a thermal behavior exceptionally similar to the one observed for ChOAc:Gly 1:3, while the thermal stability of L-Pro:LevA 1:3, as commented above, was found to be peculiarly affected by LevA and cannot therefore be meaningfully compared with the other LevA-based DESs. The role of the HBA:HBD ratio, surprisingly, was found to play only a negligible role. If it is true that the differences in terms of T
onset and T
peak related to the HBA:HBD reported in the literature for similar DESs ratio are also minimal, the differences in terms of thermal degradation profiles observed in this work appears much less evident compared to literature data. The thermograms reported in the literature for ChCl- and Bet-based DESs featuring the same HBDs considered in the present work (EG, Gly and LevA) clearly displays multiple step degradation profiles, to the point that multiple onset and derivative peaks have been reported in the paper. Moreover, in the same study, perceivable differences in the height of each step could be appreciated in relation to the HBA:HBD ratio. Among the DESs investigated in the present work, only EG-based ones still displayed two recognizable degradation steps, even if they tend to appear much less separated (ChOAc DESs) or almost completely merged (L-carn) compared to what was reported in literature for ChCl and Bet. On the other hand, when Gly or LevA are used as HBDs, the degradation profile follows a single-step pathway (also visible in the
dweight(%)/
dT plot), where only a single peak is identifiable. The only exception to this behavior is represented by the DES L-Pro:LevA 1:3, which displayed two peaks in the derivative plot, even if close to each other and partially overlapped. The thermal behavior of ChOAc DESs was found to be particularly interesting, with T
peak values very close to the one of pure ChOAc (when EG was used as HBD) or even higher (when Gly and LevA were adopted). This is quite uncommon behavior since, typically, the T
peak of DES lies in between the T
peaks of the constituting HBA and HBD. The noteworthy temperature difference between the T
peak of the DES and the one of the constituting HBD observed for the Gly and the LevA systems (with the exception L-Pro: LevA 1:3), together with their single-step degradation profile and the lack of significant differences related to the HBA:HBD ratio, suggest the presence of much stronger hydrogen bonds in the DES investigated in this study compared to the more classic ChCl and Bet systems. These interactions were found to not only keep all the HBD molecules equally bound together in the DES system, but also to play a stabilizing influence on ChOAc. Unfortunately, the obtained data are not immediately comparable with the ones provided by Zhao et al. for ChAcO:Gly 1:2, ChAcO:Gly 1:3 and ChAcO:EG 1:2 since different thermal degradation parameters have been considered (T
5%, T
onset, and T
peak in the present work and T
10% by Zhao et al.). Nevertheless, the literature data appear consistent with the ones obtained in this work, confirming the much lower thermal stability observed for ChOAc:EG 1:2, and reporting similar thermal degradation data for the ChAcO:Gly-based DESs [
18,
23].
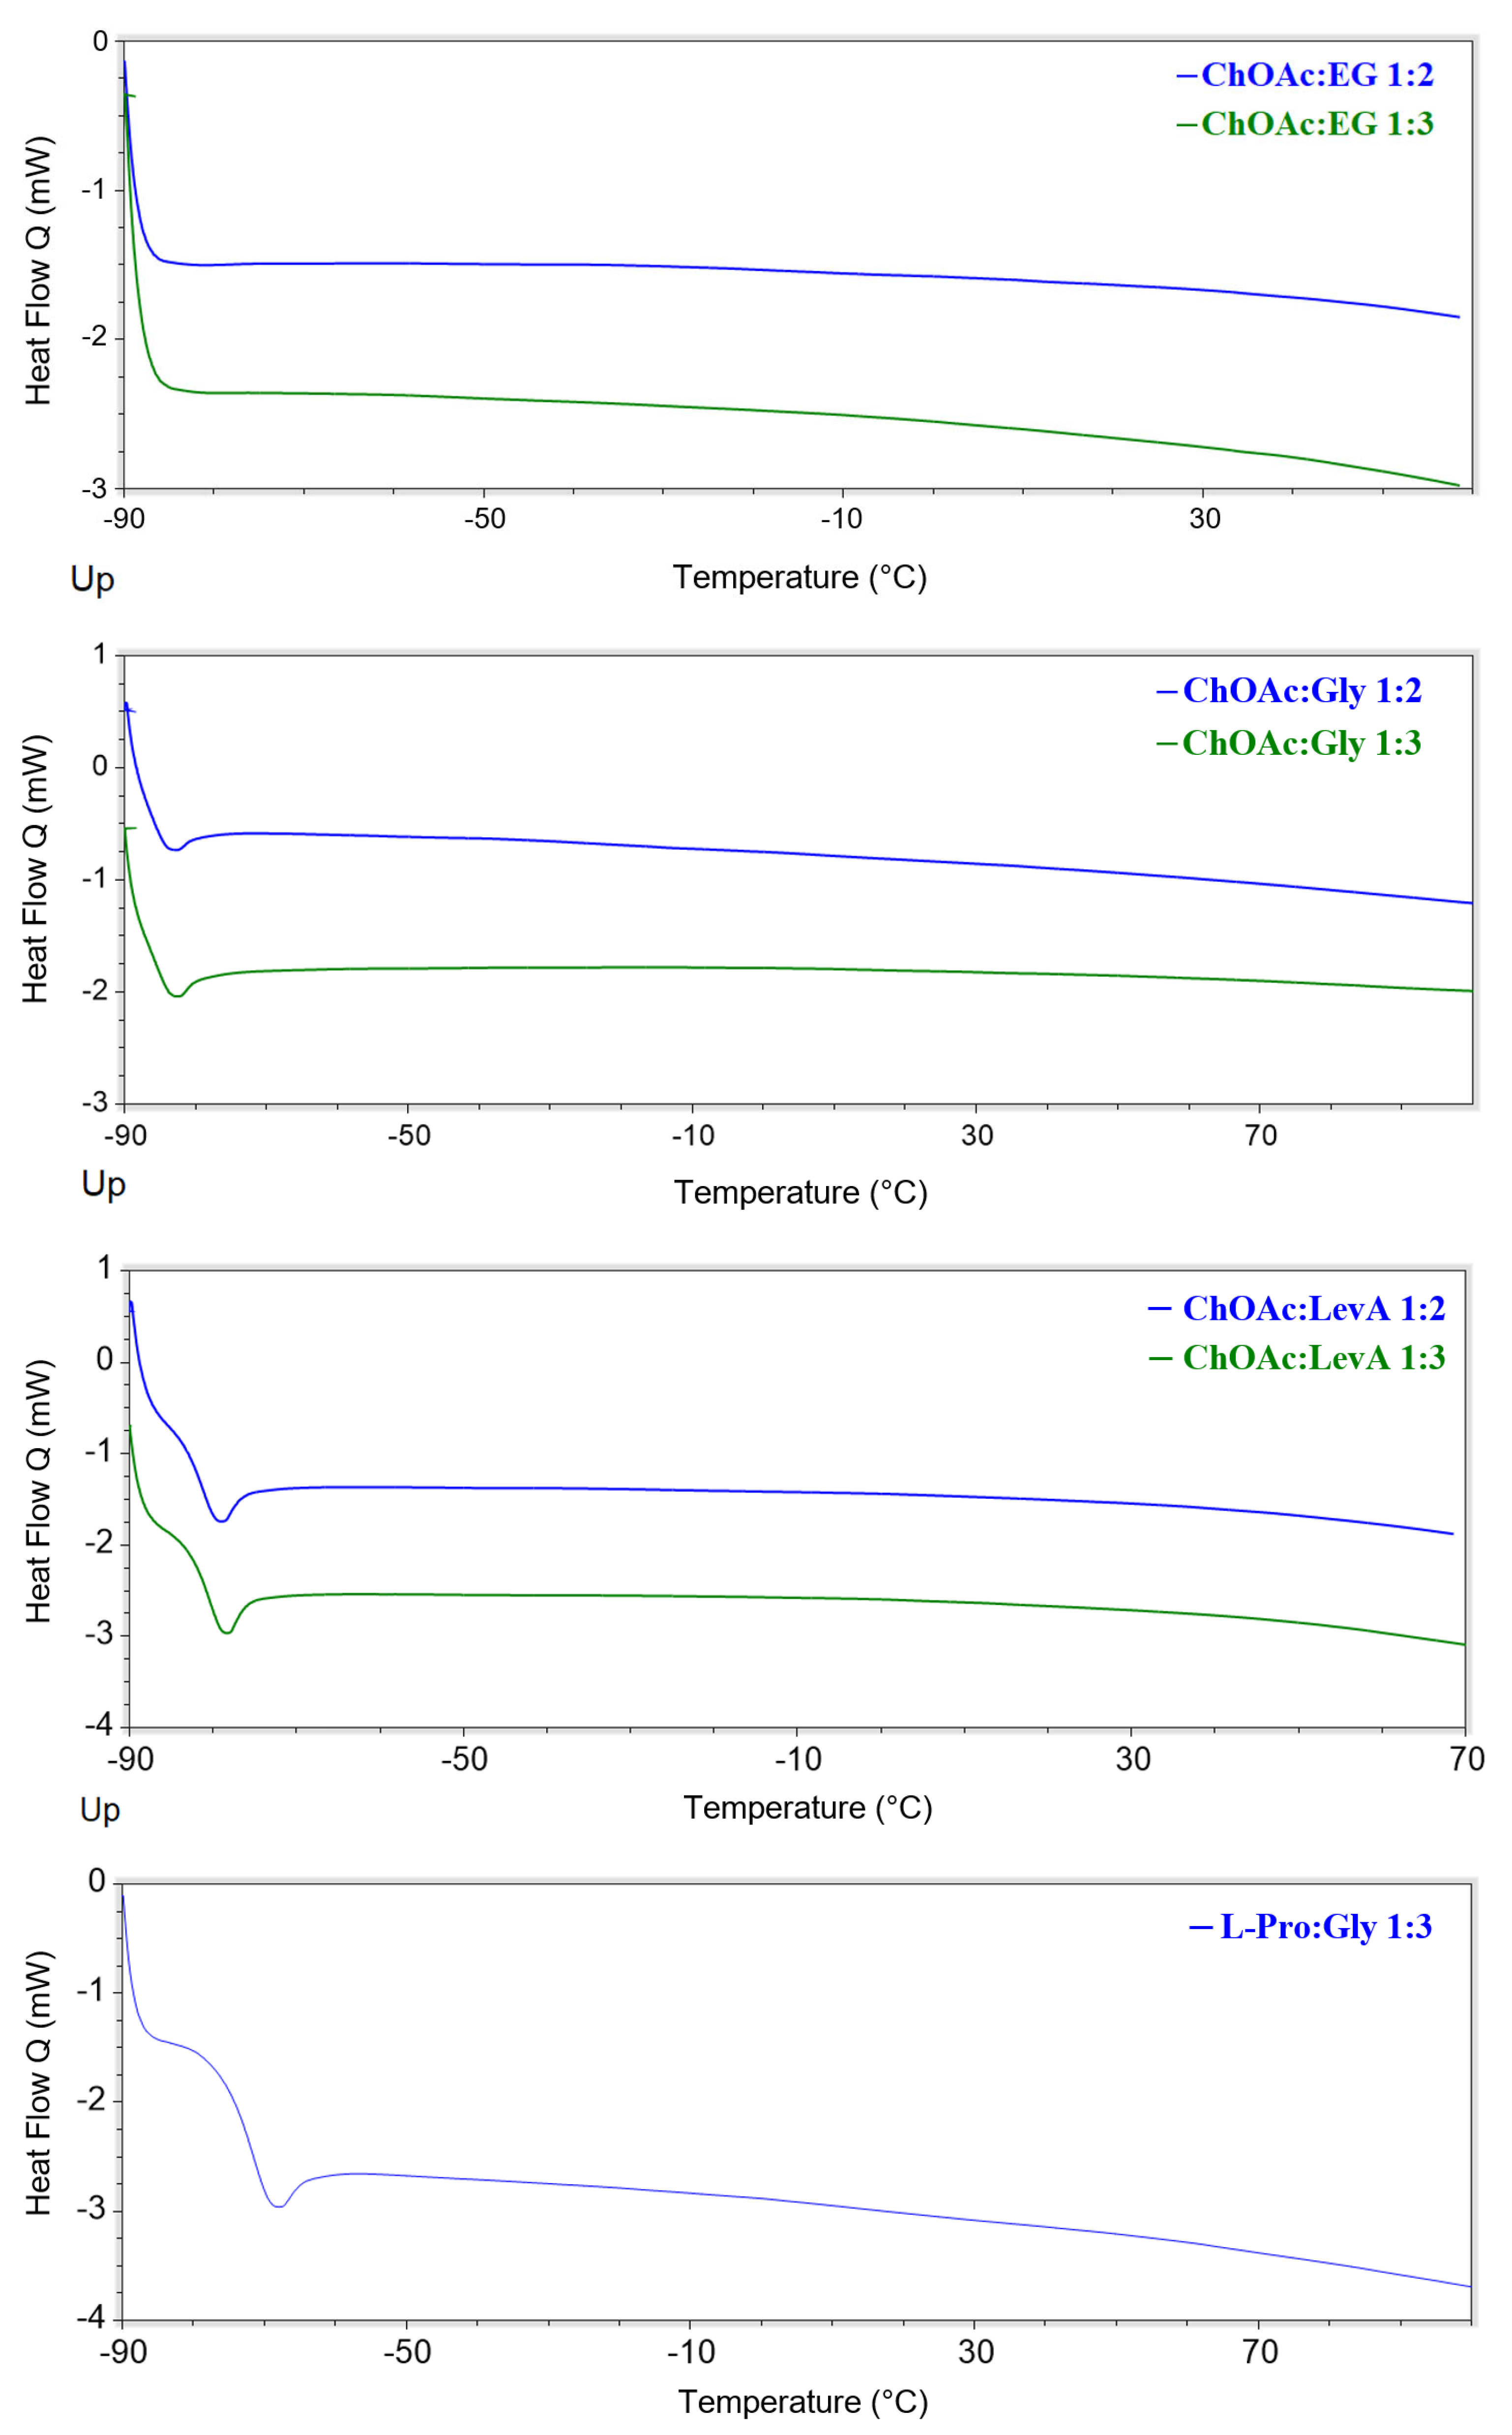
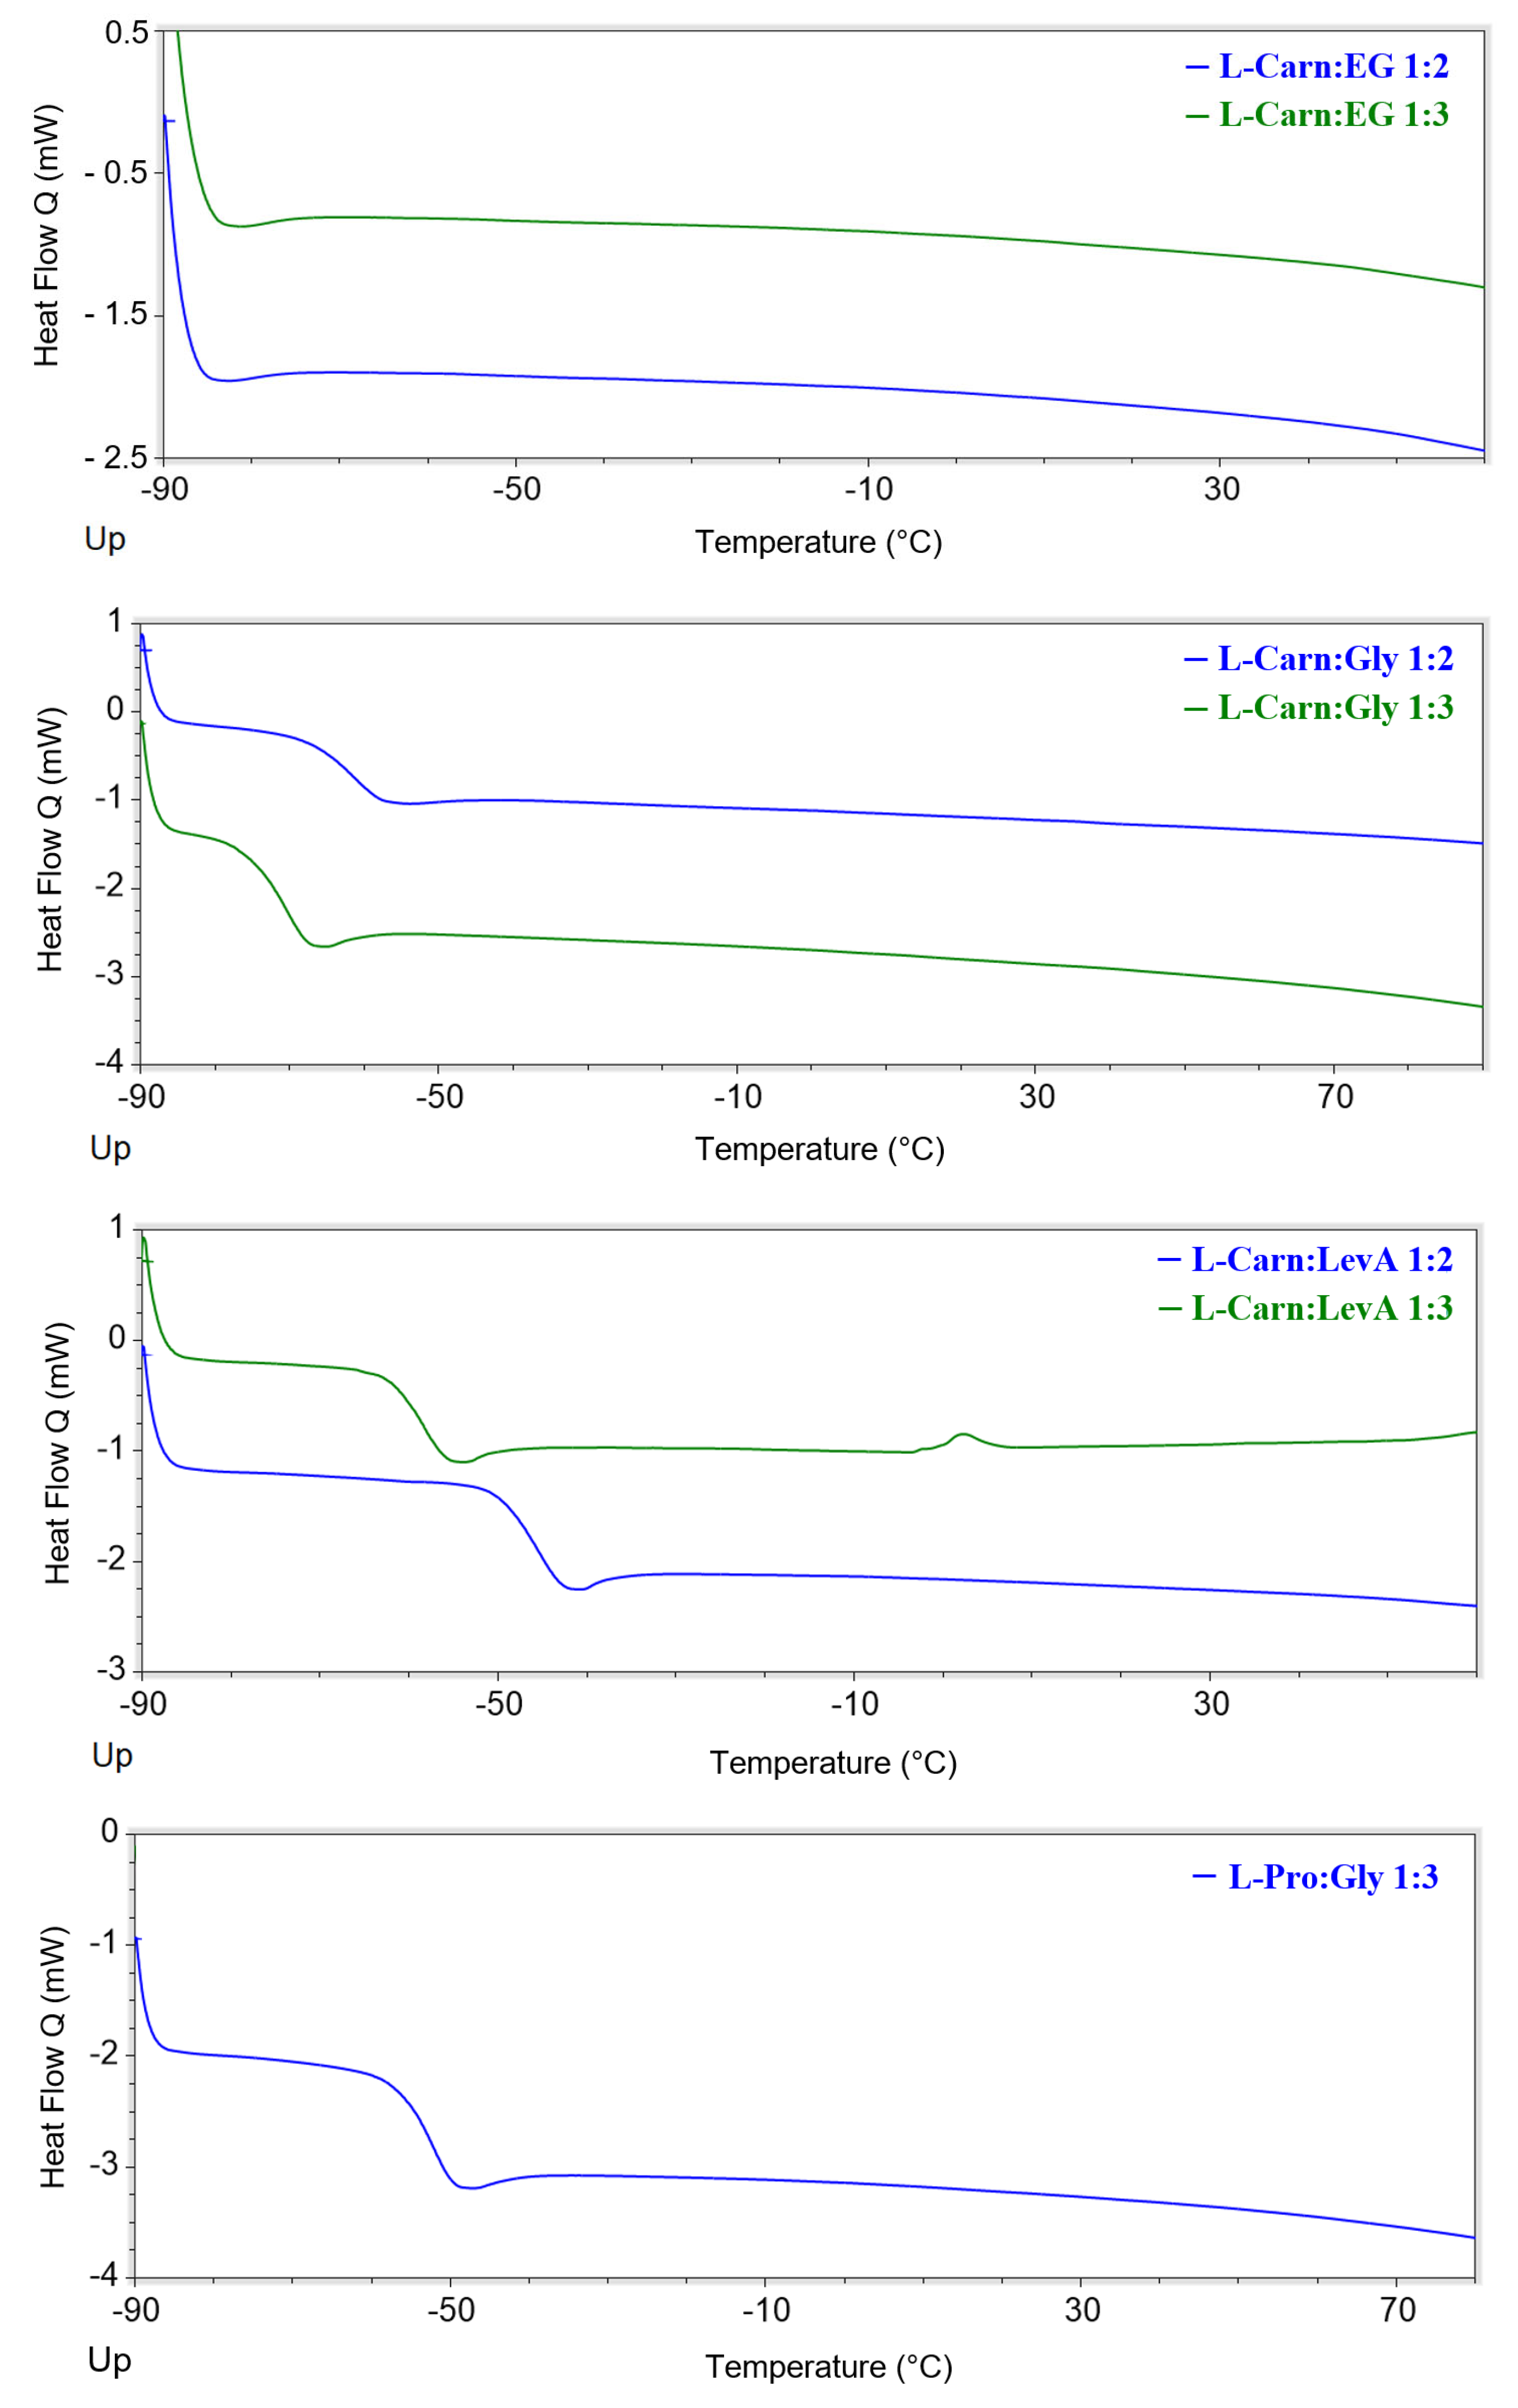
All the investigated DESs displayed glass transitions as the only observable thermal phenomenon in the considered temperature range (
Figure 7 and
Figures S46–S59, Supporting Information). All the observed glass transitions took place at low temperature (in the range −45–−90 °C). The temperatures at which the transitions were detected were found to be related to both the HBA and the HBD, as well as the HBA:HBD ratio. Concerning the role of the HBD, it is immediately noticeable that EG-based DESs are the only ones, irrespectively of the associated HBA, to not display any thermal phenomenon. On the other hand, for each selected HBA, Gly-based DESs displayed lower T
g values. The observed T
g trend can be therefore summarized as EG << Gly < LevA. The effect of the HBA:HBD ratio appears to be depending on the type of HBA. L-Carn DESs manifested a lowering of the observed T
g passing from the 1:2 to the 1:3 system (of about 10 °C), while ChOAc DESs displayed an opposite behavior, even if in this second case the temperature differences were minimal. Finally, the influence of the HBA appears to be the most evident one, with L-carn systems displaying T
g values 10 °C to 35 °C higher than the corresponding ChOAc DESs. L-Pro DESs T
g values sit in between the extremes set by L-carn and ChOAc, but displaying values closer to the ones obtained for the L-carn DESs. Differently from what was reported by Zhao et al., during the current study, for all of the considered DESs, no melting points were detected during the DSC analysis. Conversely, no glass transitions are reported in their paper, due to these phenomena taking place out of their temperature range of investigation [
23].
2.5. Refractive Index
The refractive index is the most fundamental optical constant, as it governs how light propagates through a material and underpins the design and optimization of optical components such as lenses, coatings, and sensors. In physical chemistry, it plays a key role in establishing correlations with properties like density, viscosity and surface tension through empirical or semi-empirical models, and serves as a practical tool for evaluating purity, water content, and overall composition in liquid mixtures. Despite its broad applicability, refractive index data for deep eutectic solvents remain limited [
57]—particularly regarding their wavelength dependence [
40].
In the present work, the refractive index of the DESs under investigation was measured at five different wavelengths: three in the visible spectral range (450 nm, 532 nm, 632.8 nm) and two in the near-infrared (940 nm and 1551 nm). Measurements were collected at each wavelength across four different temperatures ranging from 40 to 100 °C, in increments of 20 °C. The temperature step was not further reduced to prevent prolonged measurement times and to ensure that water absorption did not impact the results. This precaution was taken because the liquid holder cannot be sealed airtight, leaving the pre-dried sample partially exposed to environmental moisture. For the same reason, the measurement temperature was not lowered below 40 °C.
Experimental values of the refractive index (
), tabulated in
Table S10 (Supporting Information), were fitted to a dispersion relation, which captures simultaneously the wavelength (
) and temperature (
) dependence, according to
In the previous relationship, which has been used with other DESs [
40] and ionic liquids [
58] before, the coefficient
signifies an anticipated absorption peak in the ultraviolet range,
quantifies the resonance strength associated with this peak, while the third coefficient,
, assists in adjusting the refractive index values towards longer wavelengths. Note that the temperature dependence is incorporated into the coefficient
, which is given by
Computed values for all four fitting coefficients (
,
,
and
) are shown in
Table 6. The quality of fit is confirmed by R-squared (and adjusted R-squared) values that are greater than 0.9937 for all DESs under investigation. It is also confirmed by the fact that the average absolute residuals (AAD) between measured and predicted index values are in the order of 0.0001 to 0.0005, which is comparable to the accuracy of the refractometer.
Figure 8 shows two families of parametric curves for the DESs with the lowest fit quality—specifically, ChOAc:EG 1:2. The left plot illustrates how the refractive index varies with wavelength across the four measurement temperatures, while the right plot shows how it changes with temperature for the five measurement wavelengths. Similar plots for all DESs studied are provided in
Figure S60 (Supporting Information).
In general, the refractive index decreases with increasing wavelength, a behavior known as normal dispersion. It also decreases with rising temperature, following an almost linear trend, which reflects the strong correlation between refractive index and density. The pronounced nonlinearity in the wavelength dependence indicates that Equation (7) should not be extrapolated beyond the spectral range of the measurements. In contrast, the near-linear temperature dependence suggests that the dispersion model may yield reasonable estimates even beyond the measured temperature range, including at room temperature. As a practical extension, estimated refractive index values at several standard spectroscopic wavelengths and a constant temperature of 25 °C are presented in
Table 7.
Several observations can be made about the ordering of DESs based on their refractive index. First, there is a consistent trend showing that the refractive index increases when the molar ratio shifts from 1:3 to 1:2. Among the 1:3 molar ratio samples, the refractive index always increases in the following order: [ChOAc:EG] < [ChOAc:LevA] < [L-Pro:LevA] < [L-Carn:LevA] < [L-Carn:EG] < [ChOAc:Gly] < [L-Carn:Gly] < [L-Pro:Gly]. For the DESs with a 1:2 molar ratio, at lower temperatures (<80 °C) the order is: [ChOAc:EG] < [ChOAc:LevA] < [L-Carn:EG] < [ChOAc:Gly] < [L-Carn:LevA] < [L-Carn:Gly]. Notably, a reversal in the order of the first two components is observed at elevated temperatures.
From these observations, it can be concluded that across the entire temperature and wavelength range, DESs containing ChOAc as the HBA exhibit lower refractive indices than those with L-Pro or L-Carn, when mixed at the same molar ratio with the same HBD. Likewise, DESs containing Gly as the HBD consistently show higher refractive indices than those with LevA or EG, under identical mixing conditions with the same HBA. To conveniently summarize these trends, we introduce the notation
to represent the refractive index of a DES composed of HBA x and HBD y at a molar ratio i:j. Using this notation, the observed relationships can be expressed as follows:
The ability to tune the refractive index of DESs by selecting appropriate HBA and HBD components, as well as adjusting their mixing ratios, makes them ideal candidates for applications requiring index matching. Such applications are common in fields such as microscopy, opto-fluidics, and tissue clearing, among others [
59]. In this context, it is often more practical to use molar refractivity for design purposes, rather than the refractive index itself. This is because unlike the refractive index, molar refractivity (
Rm), defined below, is an additive material property.
By substituting into Equation (9) the temperature-dependent molar volume
, as discussed in
Section 3.2, along with the dispersion model for the refractive index
, given in Equation (7), one can readily estimate the molar refractivity
as a function of both temperature and wavelength. Representative results from these calculations at two selected wavelengths and
are presented in
Table 8.
As expected, the ordering of the DESs based on their molar refractivity shows clearer and more consistent trends than those observed for the refractive index. Specifically, a systematic investigation reveals that, across all wavelengths and temperatures, molar refractivity increases when the molar ratio of a given HBA:HBD pair changes from 1:2 to 1:3. Additionally, molar refractivity increases in the order [L-Carn:EG] < [ChOAc:EG] < [L-Pro:Gly] < [L-Carn:Gly] < [ChOAc:Gly] < [L-Pro:LevA] < [L-Carn:LevA] < [ChOAc:LevA]. This trend holds for all eight available samples with a 1:3 molar ratio, as well as for the six samples with a 1:2 ratio. Introducing now the self-explanatory notation
, the following consistent relationships can be identified:
Beyond molar refractivity, the dispersion model presented in Equation (7) can be used to calculate several other quantities that are highly relevant to both physical chemistry research and practical photonic applications. For instance, the derivative
, known as the thermo-optic coefficient, measures the refractive index response to temperature changes. Likewise, the derivatives
and
capture first- and second-order chromatic dispersion effects, respectively. For example, the first derivative relates to the group velocity of spectrally broadband light pulses as they propagate through a dispersive medium, while the second derivative regulates the temporal broadening of those pulses. Representative calculations of
,
and
at two selected wavelengths and
are also presented in
Table 8.
