Article

Genetic Diversity Evaluation and Population Structure Analysis of the Genus Paphiopedilum in Guangxi: Promoting the Selection and Breeding of New Species

1
Guangxi Key Laboratory of Plant Functional Substances and Resources Sustainable Utilization, Guangxi Institute of Botany, Guilin 541006, China
2
South China Botanical Garden, Chinese Academy of Sciences, Guangzhou 510650, China
*
Authors to whom correspondence should be addressed.
These authors contributed equally to this work.
Int. J. Mol. Sci. 2025, 26(17), 8543; https://doi.org/10.3390/ijms26178543
Submission received: 31 July 2025 / Revised: 26 August 2025 / Accepted: 29 August 2025 / Published: 2 September 2025
(This article belongs to the Special Issue Advances in Plant Genomics and Genetics: 3rd Edition)

Abstract

The genus Paphiopedilum (Orchidaceae) has high ornamental value due to its long flowering period, brilliant flower color, and peculiar floral morphology. Guangxi is the center of ecological diversity of Paphiopedilum, and therefore it is urgent to conduct rescue studies on the genetic resources and genetic structure of this genus in Guangxi. In this study, the genetic diversity of 39 populations from eight Paphiopedilum species in Guangxi was analyzed using ten selected EST-SSR primer pairs and fluorescent PCR amplification. The results show that genetic diversity varied among species, with large differences in expected heterozygosity (He). The highest genetic diversity was observed in P. barbigerum (I = 0.923; He = 0.480), while P. dianthum (I = 0.179; He = 0.098) showed the lowest diversity. From the genus perspective, molecular variance analysis (AMOVA) revealed that 57% of the genetic variation occurred among populations and 43% within populations, with inter-population variation being the main source of genetic variation. From a species perspective, genetic differentiation varied, with inter-individual differentiation ranging from 79% to 95%. The percentage of molecular variance indicated that genetic variation mainly occurred among individuals, which was the main source of total variation. According to the principle of maximum likelihood, the optimal K value was determined to be 6, and 760 Paphiopedilum samples were divided into six subgroups. The results of this study not only identify priority populations for conservation and establish a germplasm repository to preserve existing resources, but also provide references for research on asexual reproduction, seed propagation, and hybrid breeding of Paphiopedilum, thereby promoting the conservation and sustainable utilization of Paphiopedilum germplasm resources.

1. Introduction

Paphiopedilum Pfitzer belongs to the Orchidaceae family, and its flower stems grow from the leaves, with bright and colorful flowers. There are 18 species in China, mostly distributed in Yunnan, Guizhou, and Guangxi in the southwest, which is the main distribution area of the genus Paphiopedilum. The majority of these species grow in limestone mountainous areas [1,2,3], mostly semi-epiphytic orchids that grow in clusters, while the other species grow on acidic sandy soil rich in organic matter, mostly terrestrial orchids that grow as single plants or scattered in tillering form. Most orchids are distributed in high-altitude areas with thin soil layers. The genus Paphiopedilum Pfitzer, belonging to the family Orchidaceae, produces inflorescences that arise from leaf rosettes and bears flowers with vivid and diverse colors. In China, 18 species have been recorded, mainly distributed in the southwestern provinces of Yunnan, Guizhou, and Guangxi, which constitute the primary distribution region of the genus. This area also includes several Chinese endemic species, such as P. barbigerum [4,5]. However, most of the more evolved Subgen. Paphiopedilum in the Paphiopedilum genus are distributed in this area, indicating that the limestone areas of Yunnan, Guizhou, and Guangxi may be the center of origin and evolution of the Paphiopedilum genus. The subtropical regions of China are the centers of ecological diversity of Paphiopedilum plants [6].
China is located in the northern margin of the species distribution of Paphiopedilum. The special geographical distribution has resulted in the unique resources of Paphiopedilum. Most of the species are geophytic or semiepiphytic. There are nine species, such as P. armeniacum, P. micranthum, P. malipoense, P. concolor, P. bellatulum, P. barbigerum, P. emersonii, P. hirsutissimum, and P. henryanum. Only three species are purely epiphytic, such as P. dianthum, P. parishii, and P. villosum. There are six species of pure geophytic orchids, such as P. appletonianum, P. purpuratum, P. insigne, P. markianum, P. venustum, P. wardii, etc. All of these species belong to the more evolved Paphiopedilum subgenus. The most primitive subgenera Brachypetala are all ground orchids or semiepiphytic orchids [7,8,9]. It can be seen that the original type of Paphiopedilum was Geophytic Orchid, which is adapted to tropical or subtropical environments because of competition pressure, and gave birth to semi-epiphytic species and then to pure epiphytic species.
Paphiopedilum also has high ornamental value because of its long flowering period, gorgeous flower color, and peculiar flower shape, and it is often loved by orchid enthusiasts [10,11]. The indiscriminate collection of Paphiopedilum species from the wild for their exotic ornamental flowers have rendered these plants endangered [12]. In addition, orchids generally grow slowly, have long reproductive cycles, and possess limited self-renewal capacity, making it difficult for populations to recover or expand naturally in the short term [13,14]. All species of the genus are listed in Figure S1 of CITES, indicating the highest level of international protection. According to the List of National Key Protected Plants newly issued by China in 2021, Paphiopedilum with leaves and Paphiopedilum sclerophyllum are classified as national second-grade protected plants, while all other species in the genus are classified as national first-grade protected plants. According to the list of national key protected wild plants issued by Guangxi Forestry Bureau (Guangxi part), there are 12 species of Paphiopedilum in Guangxi, 66.7% of the national species resources—nearly two-thirds. Guangxi is a possible origin and evolution center and ecological diversity center of Paphiopedilum. It is urgent to study the genetic resources and genetic structure of the genus Paphiopedilum in Guangxi, and to analyze the biological diversity resources and species evolution system of the genus Paphiopedilum.
Understanding genetic differentiation is essential for comprehending the intricate patterns of morphological variation both within and between species. Analyzing genetic diversity not only yields insights into the current diversity of species, but also offers valuable information about their evolutionary history and the underlying processes that have shaped this diversity [15]. Additionally, population structure analysis can provide a comprehensive view of genetic diversity levels across an entire species. By comparing rare species to common congeners, which are expected to share similar phylogenetic histories, researchers can gain critical knowledge about the extent and distribution of genetic variation within a specific genus [16,17,18].
Molecular marker technology has made great progress in the past decade. Molecular marker linkage maps of more than a dozen important crops, such as rice (Oryza sativa L.), wheat (Triticum aestivum L.), maize (Zea mays L.) and barley (Hordeum vulgare L.), have been constructed. Molecular marker technology can be used not only to draw the fingerprint of varieties and the gene linkage map of target traits, but also to study the genetic diversity of germplasm resources, and to innovate and identify germplasm resources [19]. At present, SRAP [20], RAPD [21] and ISSR [22] are used to study the genetic diversity of Paphiopedilum in China. Zhu [23] used SRAP molecular markers to analyze the genetic diversity of eight wild Paphiopedilum species in southern Guizhou. Zhu [23] used SRAP molecular markers to analyze the genetic diversity of eight wild Paphiopedilum species in southern Guizhou, and the results showed that the Nei′s genetic diversity index of the eight species was 0.2879, and the Shannon′s diversity index was 0.4241. Qin [24] and Li [25] used ISSR molecular markers to analyze the genetic diversity of eight P. emersonii populations in Guizhou and Guangxi and seven P. micranthum populations in Yunnan, respectively. The mean Shannon index (I) and expected heterozygosity (He) of the P. emersonii populations were 0.4191 and 0.2808, respectively, while for the P. micranthum populations, the mean I and He were 0.1943 and 0.1332, respectively. Xu [26] analyzed 190 samples from six wild P. hirsutissimum populations in Guangxi, Yunnan, and Guizhou using SSR molecular markers, with the six populations showing a Shannon index (I) of 0.8592 and He of 0.4387. These results indicate that genetic diversity varies significantly depending on the type of molecular marker used in Paphiopedilum species. Hence, marker selection in this study must carefully account for cross-species amplification, homologous and null alleles, and marker reproducibility to ensure reliable evaluation of genetic diversity. In comparison, RFLP, RAPD and ISSR technologies have been studied and applied more in major crops and horticultural crops, while AFLP and SSR are less [27]. However, some studies have shown that SSR markers have the highest number of polymorphic bands per primer combination, good repeatability, and have obvious advantages for genome-wide background selection, which is suitable for studying the genetic relationship between different germplasms and pedigree analysis between parents and offspring [28,29]. These qualities make SSRs good tools for investigating the degree and pattern of genetic variability within and between populations [30,31,32].
Therefore, for evaluation of genetic diversity among and within species of Paphiopedilum, we chose simple sequence repeat (SSR) markers, which are very popular markers for genetic analysis in plants, and analyze the evolutionary relationship between populations of various species within the genus Paphiopedilum in Guangxi [33,34]. This study aims to systematically evaluate the genetic diversity and genetic differentiation of different Paphiopedilum species and their populations in Guangxi, and to analyze the evolutionary relationships among these populations. By using simple sequence repeat (SSR) molecular markers, we investigated the levels of genetic diversity of various Paphiopedilum species and populations in Guangxi, clarified the genetic structure of each population, and revealed the extent of intra- and interspecific genetic variation. This study provides important scientific evidence for understanding the genetic diversity, genetic differentiation, and population evolutionary patterns of Paphiopedilum, and offers scientific guidance for the conservation and sustainable utilization of Paphiopedilum resources in Guangxi and the southwestern karst biodiversity center.

2. Results

2.1. Cross-Species Amplification and Microsatellite Polymorphism

As shown in Table 1, 109 alleles (Na) were detected by 10 pairs of primers in 760 samples, with a minimum allele number of 5, a maximum of 17, and an average allele number per locus of 10.9. The number of effective alleles (Ne, indicating that the more homogeneous the distribution of alleles in the population, the closer the number of alleles actually detected) was 4.162. The number of effective alleles varied from 2.144 (DL021) to 9.676 (DL032), with an average of 4.162 per locus. The Shannon Index (I) ranged from 0.942 (DL021) to 2.455 (DL032), with an average of 1.552. Observed heterozygosity (Ho) ranged from 0.127 (DL030) to 0.4 (DL020), with an average value of 0.2543. Expected heterozygosity (He) ranged from 0.534 (DL021) to 0.897 (DL032), with an average of 0.7117. The polymorphic information content (PIC) ranged from 0.474 (DL021) to 0.888 (DL032), with an average of 0.6. The average inbreeding coefficient (F) was 0.083, ranging from −0.07 (DL021) to −0.319 (DL034).

2.2. Genetic Diversity

Genetic diversity parameters of the eight Paphiopedilum species are summarized in Table 2. For P. emersonii (BHDL), the number of alleles (Na) ranged from 1.700 to 2.600, Shannon’s information index (I) ranged from 0.275 to 0.366, observed heterozygosity (Ho) ranged from 0.129 to 0.171, expected heterozygosity (He) ranged from 0.140 to 0.196, and the inbreeding coefficient (F) was around 0 (YZLTX = −0.043), indicating low genetic diversity. P. dianthum (CBDL) showed Na of 1.200–2.600, I of 0.092–0.313, Ho of 0.060–0.083, He of 0.061–0.154, and F ranging from 0.333 to 0.696, also reflecting low genetic diversity. P. hirsutissimum (DYDL) had Na of 2.500–3.300, I of 0.579–0.722, Ho of 0.289–0.402, He of 0.339–0.411, and mean F of 0.032, with some populations showing negative F values (NDXHJC = −0.021, MMZXKR = −0.048), indicating relatively high genetic diversity. P. helenae (HLDL) exhibited Na of 3.100–3.800, I of 0.775–0.961, Ho of 0.409–0.600, He of 0.409–0.537, and mean F of −0.053, suggesting high genetic diversity. P. malipoense (MLPDL) had the lowest genetic diversity, with Na of 1.100–2.600, I of 0.029–0.421, Ho of 0–0.195, He of 0.015–0.216, and F ranging from 0.073 to 1.000. P. concolor (TSDL) showed Na of 1.700–3.900, I of 0.327–0.842, Ho of 0.189–0.252, He of 0.204–0.472, and F of −0.016–0.483, reflecting moderate genetic diversity. P. barbigerum (XYDL) exhibited relatively high genetic diversity with Na of 3.400–4.600, I of 0.796–1.024, Ho of 0.453–0.503, He of 0.421–0.514, and F of −0.089–0.015. P. micranthum (YYDL) showed Na of 1.900–3.700, I of 0.282–0.630, Ho of 0.064–0.308, He of 0.160–0.333, and F of 0.057–0.640, indicating low to moderate genetic diversity among populations. Five populations of P. hirsenae had Na between 3.100 and 3.800, I between 0.775 and 0.963, Ho between 0.409 and 0.600 with a mean value of 0.495, He ranged from 0.409 to 0.537 with a mean value of 0.464, and the highest was in the LZ population with a mean F value of −0.053 and the presence of heterozygosity; indicating a high genetic diversity of P. helenae populations. Five populations of P. malipoense had Na between 1.100 and 2.600, I ranged from 0.029 to 0.423, Ho ranged from 0 to 0.195 with a mean value of 0.080, including 0 for the HJHD population, He ranged from 0.015 to 0.216 with a mean value of 0.113, and F ranged from 0.073 to 1 with a mean value of 0.401; indicating that the genetic diversity of P. malipoense populations was very low. P. concolor’s five populations had Na between 1.700 and 3.900, I between 0.327 and 0.842, Ho between 0.189 and 0.251 with a mean value of 0.228, He between 0.204 and 0.472 with a mean value of 0.311, and F with a mean value of 0.241, where TDXJHC was −0.016 and there was heterozygosity The four populations of P. barbigerum had Na between 3.400 and 3.900, I between 0.796 and 1.024, Ho between 0.453 and 0.503, with a mean of 0.487, He between 0.421 and 0.514, with a mean of 0.480 and F mean −0.001; indicating high genetic diversity in P. barbigerum populations. Six populations of P. micranthum had Na between 1.900 and 3.700, I between 0.282 and 0.603, Ho between 0.171 and 0.308 with a mean of 0.262, He between 0.160 and 0.260, and F ranged from 0.057 to 0.640 with a mean value of 0.179; indicating a moderate level of genetic diversity in P. micranthum populations.

2.3. Genetic Differentiation and Species Relationships

From the genus perspective, the coefficient of differentiation (Fst) varied from 0.410 to 0.732 across loci, with an average of 0601, indicating that 60.1% of genetic variation existed between populations, while about 39.9% of genetic variation existed within natural populations; the gene flow (Nm) between populations was 0.18 (Table 3). Molecular ANOVA (Table 4) is a method to measure and calculate genetic variation between haplotypes (or genotypes) by evolutionary distance. Molecular ANOVA is a method to measure and calculate genetic variation among haplotypes (or genotypes) by evolutionary distance. The analysis of molecular variance (AMOVA) indicated that 57% of the genetic variation existed among populations, and 43% existed among and within individuals, with inter-population variation being the main source of total variation in the genus. When Nm ≤ l, Nm was not sufficient to counteract the decrease in genetic diversity brought about by the effect of genetic drift, and the population genetic differentiation was large.
A comparative analysis of the genetic differentiation (Figure 1) between species from the perspective of species showed that 21% of the genetic variation of P. micranthum existed among populations and 79% among individuals, and intra-group variation was the main source of variation in P. micranthum. According to P. emersonii Percentages of Molecular Variance, 5% of the genetic variation in P. emersonii was found among populations and 95% among individuals, and intra-population variation was the main source of variation. According to P. malipoense Percentages of Molecular Variance, 18% of the genetic variation in P. malipoense was found among populations and 88% among individuals, and intra-group variation was the main source of variation. According to P. barbigerum Percentages of Molecular Variance, 8% of the genetic variation in P. barbigerum was found among populations and 92% among individuals, and intra-group variation was the main source of variation. According to P. dianthum Percentages of Molecular Variance, 5% of the genetic variation in P. dianthum was found among populations and 95% among individuals, and intra-group variation was the main source of variation. According to P. hirsutissimum Percentages of Molecular Variance, 6% of the genetic variation of P. hirsutissimum was found among populations and 94% of the genetic variation was found among individuals, and intra-group variation was the main source of variation. According to P. helenae Percentages of Molecular Variance, 7% of the genetic variation of P. barbigerum was found among populations and 93% among individuals, and intra-group variation was the main source of variation. According to P. concolor Percentages of Molecular Variance, 21% of the genetic variation in P. concolor was found among populations and 79% among individuals, and intra-population variation was the main source of variation.

2.4. Genetic Structure and Cluster Analysis

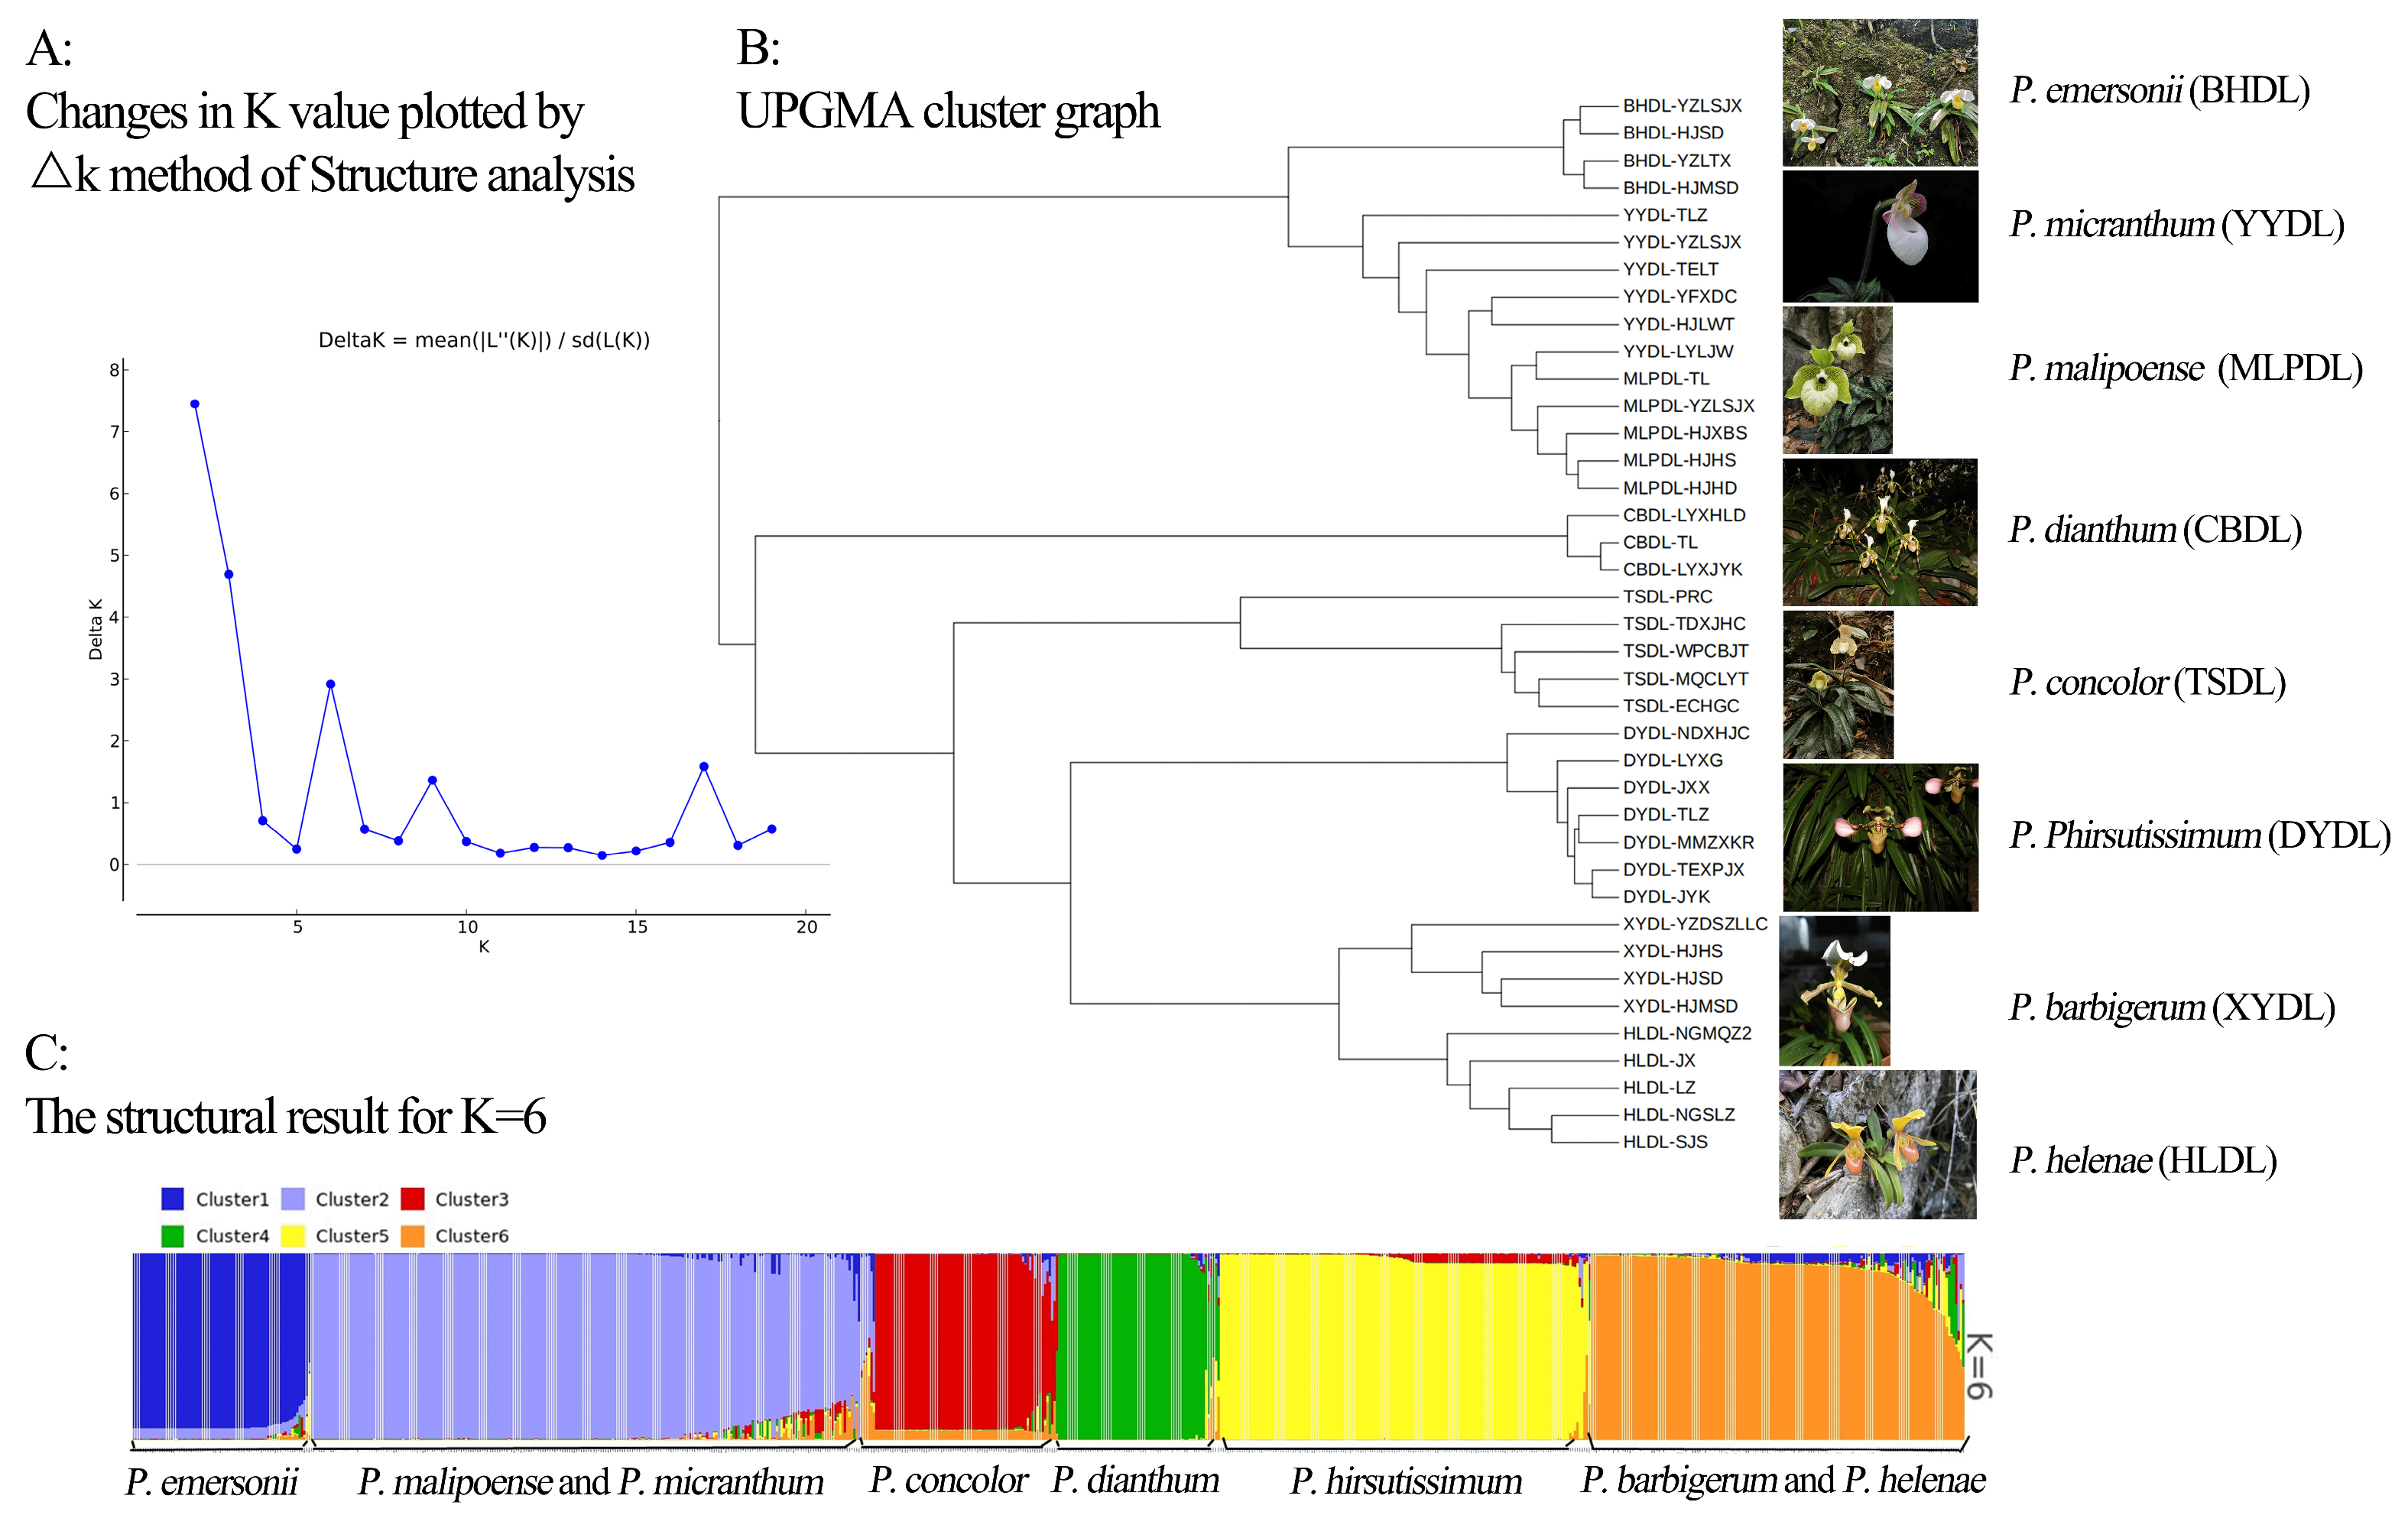
The population structure of 760 Paphiopedilum samples was evaluated using 10 molecular markers. Based on the principle of maximum likelihood value, the best K value was judged to be equal to 6, and the 760 Paphiopedilum samples could be divided into six subpopulations. The first group (dark blue) is the P. emersonii population; the second group (light blue) is the P. malipoense and P. micranthum populations, and the third group (red) is the P. concoloer group. The fourth cluster (green) is the P. dianthum cluster, the fifth cluster (yellow) is the P. hirsutissimum cluster, and the sixth cluster (orange) is the P. burbigerum and P. helenae populations. The results are consistent with the UPMGA clustering map based on genetic distance, shown in Figure 2 and Figure 3.

2.5. PCoA Analysis

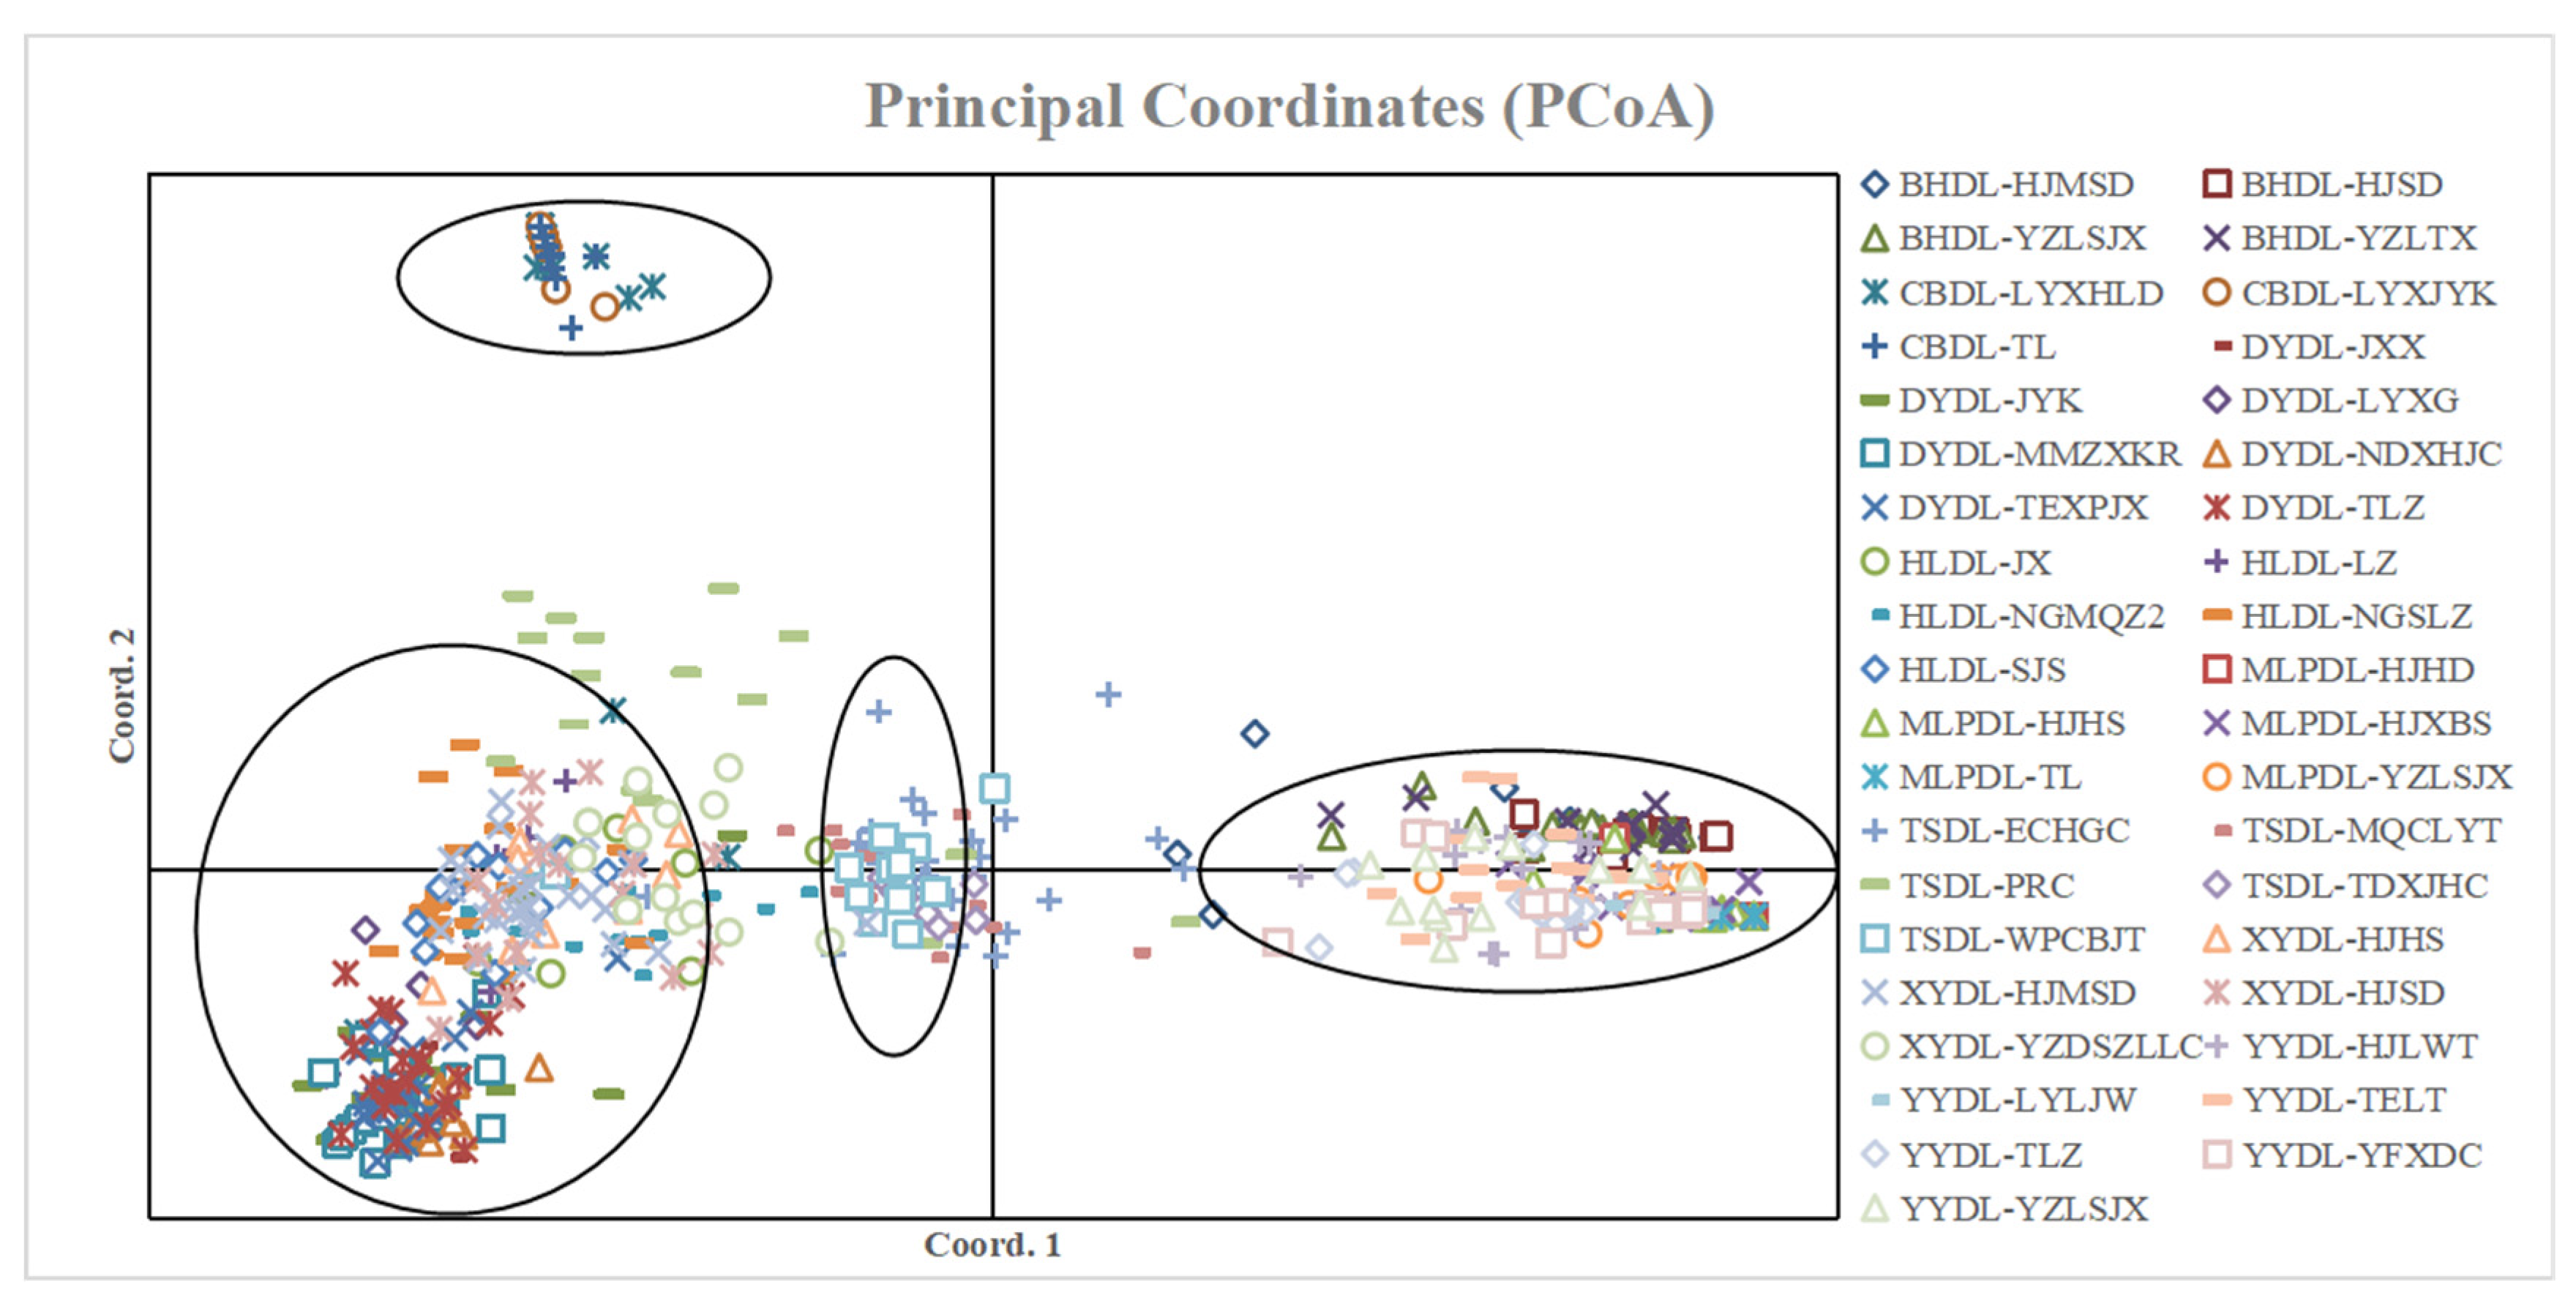
Principal coordinate analysis (PCoA, Figure 4), which presents visual coordinates for studying data similarity or dissimilarity, is a non-constrained method for dimensionality reduction analysis of data and can also be used to study the similarity or dissimilarity of sample population composition. Three populations of P. dianthum were clustered together. The 5 populations of P. concoloer were more concentrated; the populations of P. micranthum, P. malipoense, and P. emersonii overlapped into one area; the P. burbigerum, P. helenae, and P. hirsutissimum clustered.

2.6. Genetic Distance and Geographic Distances Analysis

The results of Mantel correlation analysis of geographic and genetic distances of various populations of eight species of genus Paphiopedilum are shown in Figure 5. Among the eight species of genus Paphiopedilum, only the Mantel correlation coefficient of geographic and genetic distances of P. malipoense was p ≤ 0.05, which was significantly correlated; there was no significant correlation between the genetic differentiation and geographic distribution patterns and distances of the remaining seven species of genus Paphiopedilum.

3. Discussion

Genetic diversity is a prerequisite for the survival and development of species, and its genetic level is the result of long-term evolution of the species, which can be inherited to the offspring of the population through genes, while some variations caused by developmental or environmental plasticity are not heritable [35,36]. Generally speaking, the higher the level of genetic diversity of a species, the more adaptive it is in the face of environmental changes. From an evolutionary perspective, individual organisms have limited lifespans and their contribution to evolution is realized primarily through participation in populations or population systems. Interactions among individuals within populations and gene flow between populations are key to evolutionary processes, whereas isolated individuals have limited evolutionary impact and often face lower survival probability. Therefore, genetic diversity should include both the degree of genetic variation and the distribution pattern of genetic variation (i.e., genetic structure). The distribution of genetic structure in nature is not random, but is mainly reflected by the variation in distribution form and time within and among species populations. Therefore, finding the ecological causes and genetic mechanisms that influence and constrain the genetic structure of a species can help improve the evolutionary potential of the species and its ability to resist adverse environmental conditions. The level of genetic diversity and the genetic structure maintained by an endangered species is the result of long-term evolutionary adaptation and response to the environment, and will also influence the future survival and development direction of the species [37,38,39].
Microsatellites (SSRs) are simple sequence repeats widely distributed in eukaryotic genomes. Their high polymorphism and codominant inheritance make them powerful molecular markers for studying plant genetic diversity and population structure [40,41]. In this study, we systematically assessed the genetic diversity of 760 Paphiopedilum samples from Guangxi by preliminarily screening and optimizing 10 pairs of SSR primers, combined with fluorescently labeled PCR amplification. For each primer, multiple replicate experiments were conducted to ensure amplification stability and data reliability, and the resulting alleles were analyzed using standardized statistical methods. The results revealed clear differences in genetic diversity among species within the genus. Both expected heterozygosity (He) and Shannon′s information index (I) indicated that P. barbigerum (I = 0.923; He = 0.480) had the highest level of genetic diversity, followed by P. helenae (I: 0.837; He: 0.464) and P. hirsutissimum (I = 0.637; He = 0.411). P. concolor (I = 0.519; He = 0.311) and P. micranthum (I = 0.502; He = 0.262) showed moderate levels, P. emersonii (I = 0.310; He = 0.172) displayed moderately low diversity, while P. malipoense (I = 0.204; He = 0.113) and P. dianthum (I = 0.179; He = 0.098) had the lowest levels. According to Nybom’s research [42], the mean values of I for perennial plants, widespread species, and outcrossing populations are 0.25, 0.22, and 0.27, respectively; meanwhile, the mean He values at the population level are 0.191 for dicotyledons, 0.20 for perennial short-lived plants, 0.28 for localized species, and 0.27 for outcrossing plants. Among them, the He and I values of P. emersonii, P. micranthum, and P. hirsutissimum are all lower than the results reported by Qin [23], Li [24], and Xu [24], indicating that the genetic diversity of these species in natural populations in Guangxi is limited. This may be related to local population decline, habitat fragmentation, and high levels of inbreeding. At the same time, it also reflects the significant influence of geographic distribution and environmental pressures on genetic diversity. Similarly, Cui et al. [43] analyzed the genetic diversity of 22 Dendrobium species using ISSR markers, reporting average He and I values of 0.133 and 0.247. For the endangered Cypripedium tibeticum, population He and I values were 0.3186 and 0.4843, respectively [44]. These comparisons suggest that the relatively high genetic diversity observed in species such as P. barbigerum, P. helenae, and P. hirsutissimum is considerably higher than that of many other endangered orchids, whereas species with low diversity such as P. malipoense and P. dianthum may face greater genetic risks due to small population sizes, habitat degradation, and self-fertilization. Nevertheless, several limitations of this study should be noted. Although the SSR primers used were effective across multiple species, they may not fully capture genome-wide diversity. Furthermore, sampling was geographically restricted, and the sample sizes for some rare species were relatively small, which could affect accuracy. In addition, the study did not explicitly examine the potential influence of environmental or ecological factors on genetic structure. Future research should incorporate higher-throughput molecular markers such as SNPs, alongside multi-regional and multi-year sampling, to provide a more comprehensive and accurate assessment of genetic diversity. Moreover, systematic comparisons with other endangered orchid species will help establish conservation priorities and guide targeted strategies for germplasm preservation.
From the genus perspective, the analysis of molecular variance showed that 57% of genetic variation existed among populations and 43% among individuals, and the variation among populations was the main source of total variation in the genus Paphiopedilum. A comparative analysis of genetic differentiation among species from the perspective of species showed that genetic variation existed mainly among individuals according to the percentages of Molecular Variance, where genetic variation was mainly among individuals according to P. micranthum, P. emersonii, P. malipoense, P. barbigerum and P. malipoense. P. dianthum, P. hirsutissimum, P. helenae, and P. concolor were 79%, 95%, 82%, 92%, 95%, 94%, 93%, and 79%, respectively, and interindividual variation was the main source of their variation. P. micranthum and P. concolor have more inter-population communication, which may be related to the wide distribution of these two species. P. malipoense has more distribution areas and relatively more inter-population communication, but its genetic diversity is low, and the wild resources of P. malipoense are drastically reduced at present, which may be related to environmental damage and factors affecting P. malipoense populations. The genetic diversity of P. dianthum is extremely low, but its populations mostly communicate among individuals, and in the original living environment, it mostly lives in symbiosis and clusters with other species. It indicated that P. dianthum may have outcrossing barriers in breeding and pollination, and high self-fertilization caused a sharp decrease in its own genetic diversity genes. The population variation of P. emersonii, P. hirsutissimum, and P. helenae is highly concentrated at the individual level, but its genetic diversity index remains relatively high, which may be related to their large population size, among which the Guangxi Yachang Orchid Plant Reserve protects the world′s largest wild population of P. hirsutissimum in the world.
As one of the most popular orchids in the world and also belongs to an endangered plant group, exploring the affinities between plants of the genus Paphiopedilum and revealing the evolutionary relationships of individual species within the genus will help the taxonomic identification of wild populations and the conservation of germplasm resources of Paphiopedilum. This study conducted a population structure analysis of Paphiopedilum in Guangxi based on microsatellite molecular markers. The results showed that the optimal K value was 6, with the samples divided into six subgroups, which were highly consistent with the phylogenetic relationships inferred from DNA barcoding. Specifically, P. emersonii, P. micranthum, and P. malipoense clustered together, supporting their inclusion in the subgenus Brachypetalum. In contrast, P. hirsutissimum, P. barbigerum, P. concolor, and P. helenae formed another cluster, all belonging to the subgenus Paphiopedilum, with P. concolor and P. helenae consistently grouped in both MP and Bayesian trees. P. dianthum, as a relatively primitive lineage within the subgenus Paphiopedilum, appeared as an independent branch. This concordance suggests that population structure analysis based on microsatellite markers not only reveals subgroup divisions but also reflects, to some extent, the genetic basis of phylogenetic relationships, thereby providing mutually corroborative evidence for species identification, germplasm conservation, and evolutionary studies of Paphiopedilum.
Genetic diversity is one of the core elements in conservation biology. Studies on the genetic diversity of Paphiopedilum aim to reveal the evolutionary history of the genus as well as the processes or causes underlying species endangerment. Our results indicate that populations of Paphiopedilum generally exhibit low genetic diversity, with some populations showing pronounced genetic differentiation and small-population characteristics, suggesting a limited capacity for natural recovery. Accordingly, conservation strategies should be tailored to specific genetic patterns: populations with relatively high genetic diversity should be prioritized as germplasm resources for establishing germplasm banks, whereas populations with low diversity and marked differentiation require artificial supplementation of propagules or ex situ conservation to mitigate the risk of inbreeding depression. When implementing population translocations or reintroductions, potential translocation risks and the risk of genetic swamping should also be carefully considered, as estimates of gene flow are model-dependent and inherently uncertain. Moreover, in population reintroduction practices, it is essential to incorporate different genetic lineages during propagation and reintroduction to enhance the genetic diversity of restored populations. Future research should include long-term genetic monitoring of key wild populations to dynamically assess the effectiveness of conservation measures, thereby ensuring the long-term preservation and sustainable utilization of Paphiopedilum germplasm resources. Hardy–Weinberg equilibrium (HWE) tests were conducted for each SSR locus to assess whether allele frequencies conformed to the assumptions of random mating.

4. Materials and Methods

4.1. Plant Material and Sampling Strategy

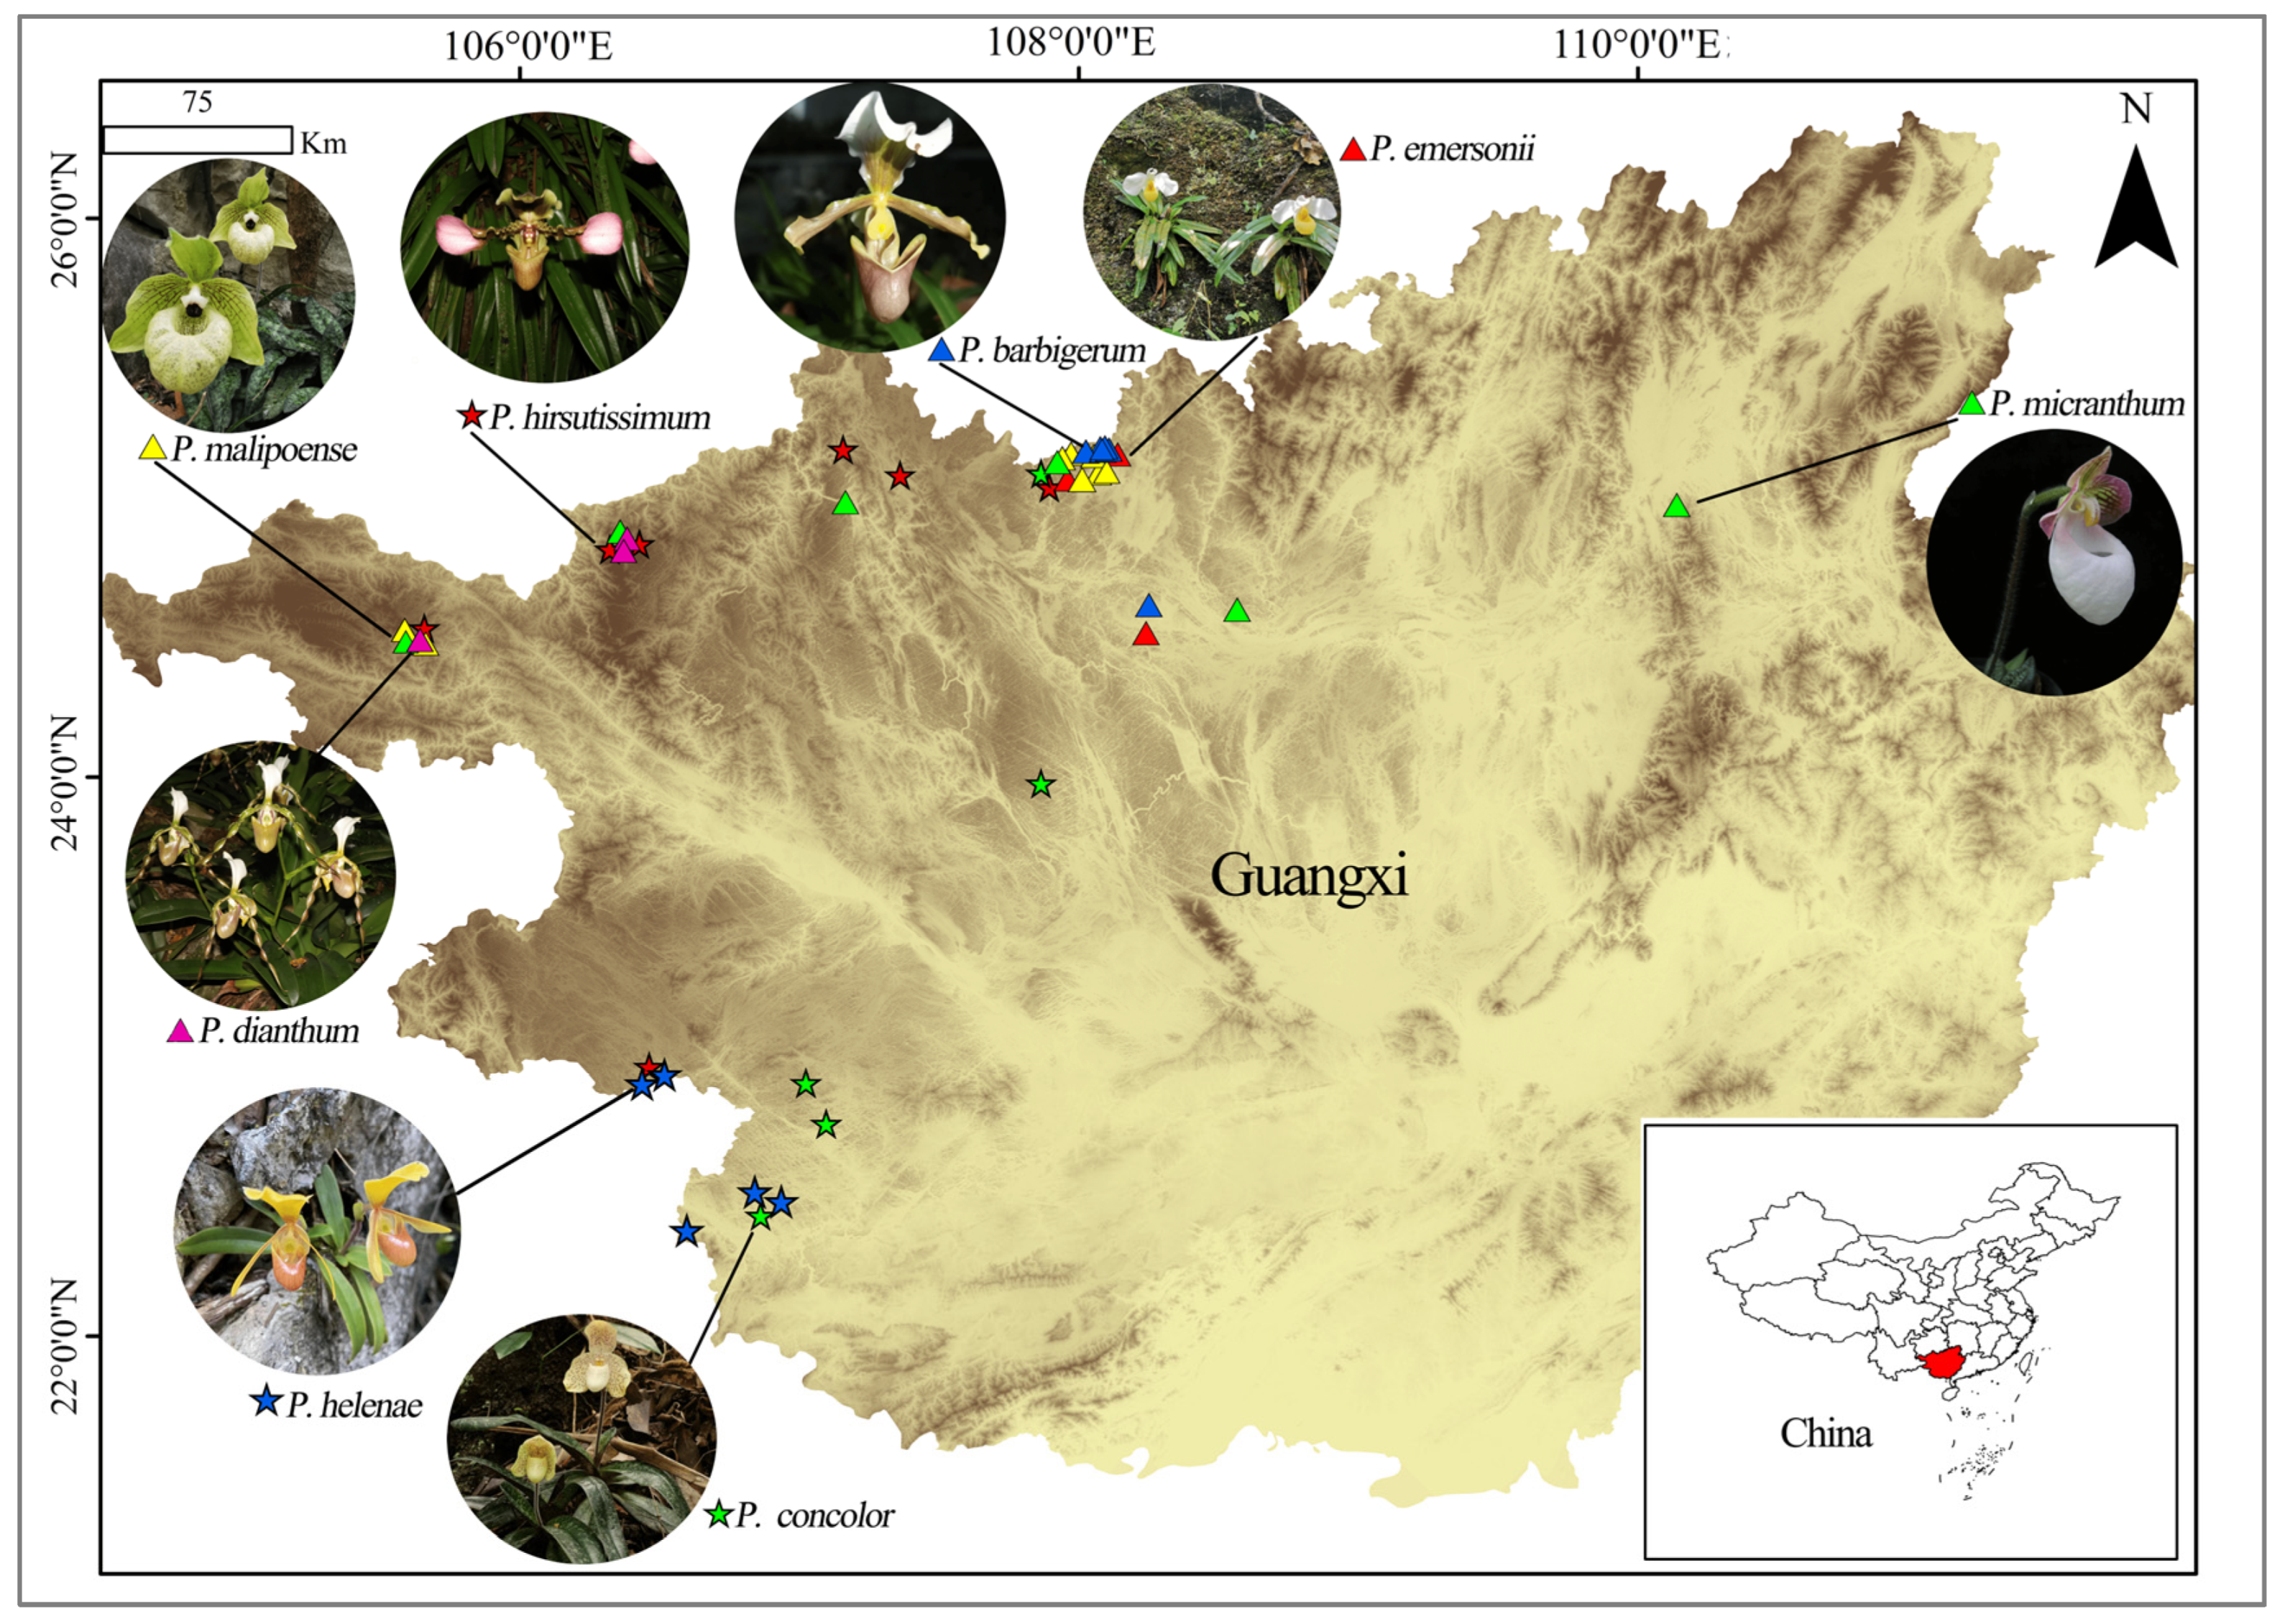
In the field, species were primarily identified based on reproductive morphological characteristics, such as petal shape, labellum structure, stigma features, and peduncle length, to minimize misidentification. In addition, the collected specimens underwent rigorous taxonomic verification, including consultation of authoritative literature, reference to Flora of China and relevant monographs, and comparison with standard specimens preserved in botanical gardens or herbaria. We collected 760 samples from 39 populations of 8 species in Guangxi (there are 12 species in Guangxi, but we only collected 8 species, because the population of the remaining 4 species was small or could not be found during the collection process, so genetic testing was not conducted this time); The sample collection location, latitude and longitude, elevation and population collection number were recorded (Figure 6 and Table 5). The collected samples were packed into molecular bags and placed in sealed silica gel bags for drying and preservation. The leaf material was lyophilized and stored at −20 °C prior to DNA isolation.

4.2. Primer Development

Nucleic acid was extracted from the samples by using the automated workstation supported by the magnetic bead method plant genome extraction kit, and the DNA quality was detected by gel electrophoresis: concentration ≥30 ng/μL. Refer to the literature [45] for EST-SSR primer information, count the size of primer amplification fragments, group the primers reasonably, use different fluorescence to label the 5′ end of the forward primer for the same group of detected SSR sites, and synthesize the conventional primer with the reverse primer; In the marker screening and development experiment, the adapter sequence was added to the 5′ end of the forward primer, the conventional primer was synthesized by the reverse primer, and the adapter primers labeled with different fluorescent groups at the 5′ end were synthesized to improve the detection efficiency and ensure the accuracy of the results. According to the conserved sequence of microsatellite, specific primers were designed and fluorescent groups were added to carry out fluorescent PCR amplification, and the amplification products with fluorescent signals were detected by 3730 capillary fluorescent electrophoresis. Fragments with different numbers of repeat units have peak patterns with different positions. Different alleles are judged according to the reading of the peak map.

4.3. Microsatellite Analyses

DNA was extracted using the Plant DNA Extraction Kit based on the Merck magnetic bead method (Merck/Sigma-Aldrich, Darmstadt Germany). DNA quality was assessed by 1% agarose gel electrophoresis, and DNA concentration and purity were measured using a Nanodrop 2000 spectrophotometer (Thermo Fisher Scientific, Waltham, MA, USA). DNA samples that passed quality control were stored at −20 °C for subsequent experiments. The PCR amplification system consisted of 2×Taq PCR Master Mix 5.0 μL, DNA 1.0 μL, SSR primer 1.0 μL, and ddH2O 3.0 μL, with a total volume of 10 μL. DNA amplification was performed on a Veriti 384 PCR system (Thermo Fisher Scientific, USA) using the following program: initial denaturation at 95 °C for 5 min; annealing for 30 s; extension at 72 °C for 30 s; 25 cycles of denaturation at 95 °C for 30 s, annealing at 52 °C for 30 s, and extension at 72 °C for 30 s. Add fluorescent PCR products diluted to a uniform concentration to the upper plate, run the denaturation program (95 °C, 3 min), and cool immediately after denaturation is completed; Run the SSR sample analysis detection program on ABI 3730xl (Thermo Fisher Scientific, Waltham, MA, USA). We prioritized primers that produced clear and distinguishable allele peaks and well-resolved electrophoretic patterns in the samples, ensuring that the amplification products were reproducible and reliable, while exhibiting high polymorphism for subsequent population genetic analyses. Among the 48 primers screened from the literature, 10 primers with clear and suitable amplification patterns were ultimately selected after validation. Through primer synthesis and screening, 48 pairs of primers were obtained from SSR literature related to Paphiopedilum, and 16 samples were screened for primer validation. A total of 10 pairs of amplified primers with good peak patterns were selected (Table 6).

4.4. Data Analysis

The Genetic diversity indices of EST-SSR loci and population were calculated by GenAlEx version 6.501 software. Included observed allele (Na), effective allele (Ne), Shannon index (I), polymorphic information index (PIC), observed heterozygosity (Ho), expected heterozygosity (He) and inbreeding coefficient (Fis). The genetic distance of each population was calculated by PowerMarker 3.51 software. The UPGMA method was used for cluster analysis, and the circular cluster diagram was drawn. STRUCTURE 2.3.4 was used to analyze the population structure of 760 Paphiopedilum resources, setting K = 1~20, Burn-in cycle as 10,000, MCMC (MarkovChain Monte Carlo) as 100,000, each K value was run 20 times. The online tool STRUCTURE HARVESTER was used to calculate the best ΔK value (that is, the best population stratification). Plots are made based on the best K results. The results of structural analysis were plotted with CLUMMP1.1.2 and DISTRUCT 1.1 software. Based on the population genetic structure results, variation within and among populations was calculated and tested using GenAlEx 6.501, with statistical significance assessed via permutation tests (999 random permutations). Genetic differentiation coefficient (Fst) and gene flow (Nm) were calculated. Gene flow (Nm) was calculated according to the formula of Wright (1931) [46]: Nm = 0.25 (1 − Fst)/Fst.

5. Conclusions

The genetic diversity of the genus Paphiopedilum is relatively variable among the species, and genetic diversity varies considerably among the different species. The rankings according to the size of genetic diversity are as follows: P. barbigerum > P. helenae > P. hirsutissimum > P. concolor > P. micranthum > P. emersonii > P. malipoense > P. dianthum. Among them, the species with the highest genetic diversity were P. barbigerum (He = 0.480), followed by P. helenae (He = 0.464) and P. hirsutissimum (He = 0.411), and lastly, in order, P. concolor (He = 0.311), P. micranthum (He = 0.262), P. emersonii (He = 0.172), P. malipoense (He = 0.113), and P. dianthum (He = 0.098) were the least genetically diverse species. Genetic variation was mainly found among individuals in the order P. emersonii (95%) = P. dianthum (95%), P. hirsutissimum (94%), P. helena (93%), P. barbigerum (92%), P. malipoense (82%), and P. micranthum (79%) = P. concolor (79%). The detection of genetic diversity not only identifies conservation priority populations and establishes a germplasm bank to conserve existing resources, but also contributes to the conservation and sustainable utilization of the germplasm resources of Paphiopedilum. Based on the results of the microsatellite (SSR) analysis, population structure assessment, and phylogenetic relationships in this study, the following conclusions can be drawn: First, although some species, such as P. barbigerum, P. helenae, and P. hirsutissimum, exhibit relatively high genetic diversity, the overall genetic diversity of wild Paphiopedilum populations in Guangxi is limited. Some rare species, such as P. malipoense and P. dianthum, show notably low genetic diversity and a strong tendency toward self-fertilization. Second, population structure analysis indicates that genetic variation within each species is primarily concentrated among individuals, while a certain degree of differentiation exists between populations, which is associated with the species′ geographic distribution, habitat fragmentation, and population size.

Supplementary Materials

The following supporting information can be downloaded at: https://www.mdpi.com/article/10.3390/ijms26178543/s1.

Author Contributions

Conceived and designed the experiments: J.T., R.Z. and X.W. the sampling support and assistance in the field: L.L., X.Z., T.D. and B.P.; Performed the experiments: K.X., J.S., X.C. and Y.Y. Analyzed the data: J.T. and S.C. Contributed reagents/materials/analysis tools: X.W. Wrote the article: J.T. All authors have read and agreed to the published version of the manuscript.

Funding

This research was funded by the National Natural Science Foundation of China (32160096 and 32560330), Guangxi Natural Science Foundation (Nos. GuikeAB24010014, 2024GXNSFAA010452 and 2023GXNSFAA026253), the Basic Operating Expenses Fund of the Guangxi Institute of Botany (Project No. Gui Zhi Ye 2500-2/8/9), the National Key Research and Development Program (No. 2022YFF1300703), Chinese Academy of Sciences ‘Light of West China’ Program (2022), Guangxi Forestry Science and Technology Promotion Demonstration Project (2024GLKX10, 2023LYKJ03 and 2022GT23), Guangxi Key Laboratory of Plant Functional Phytochemicals Research and Sustainable Utilization (No. ZRJJ2024-3/4/11), Hechi Science and Technology Foundation and Talent Project (Heke AC231113).

Institutional Review Board Statement

Not applicable.

Informed Consent Statement

Not applicable.

Data Availability Statement

Data will be made available on request.

Acknowledgments

We are extremely grateful to Bo Pan, Tao Ding, Shengyuan Liu, Yajin Luo, Zhenhai Deng and Weining Tan for the sampling support and assistance in the field. We also thank Shengfeng Chai for assistance in the laboratory and Xiao Wei for helpful discussions and suggestions during data analyses.

Conflicts of Interest

The authors declare no conflicts of interest.

References

  1. Yang, Y.J.; Huang, J.L.; Hu, H.; Zhang, S.B. Progress in the conservation and utilization of germplasm resources of Chinese tulips. West. For. Sci. 2021, 50, 108–112+119. [Google Scholar] [CrossRef]
  2. Chen, Q.W.; Guo, Y.Q. Paphiopedilum plants in China: Scopes and review. Guangxi Agric. Sci. 2010, 41, 818–821. [Google Scholar]
  3. Cribb, P.J. The Genus Paphiopedilum, 2nd ed.; Borneo Natural History Publications: Kota Kinabalu, Malaysia, 1998. [Google Scholar]
  4. Yuan, H.; Gu, W.B.; Liu, L.A.; Sun, G.F. Research on the resources and domestication of the genus Tulipa in China. In Proceedings of the Sixteenth Symposium of the Botanical Garden Branch of the Botanical Society of China, Shenzhen, China, 6–7 December 2023; pp. 157–164. [Google Scholar]
  5. Lu, S.C. The Phalaenopsis orchids of China. J. Bot. 1988, 6, 16–18. [Google Scholar]
  6. Long, B.; Long, C.L. Amazing Paphiopedilum and Its Research Status. Nat. J. 2006, 6, 341–344. [Google Scholar]
  7. Wang, Z.; Cong, L.; Liu, Y. A Review of Paphiopedilum Research. For. Sci. 2006, 42, 113–119. [Google Scholar]
  8. Wang, D.G.; Deng, K.Y.; Wei, C.J. Current status and outlook of the genus Dulcis in Guizhou. Anhui Agric. Sci. 2009, 37, 2469–2470. [Google Scholar] [CrossRef]
  9. Yang, Z.J.; Zhu, G.F.; Lu, F.B.; Zhang, X.; Wang, B.Q. Studies on the Karyotypes of Eight Species of Paphiopedilum subgenes brachypetalum. J. Hortic. 2006, 33, 1015–1020. [Google Scholar] [CrossRef]
  10. Zeng, S.J.; Chen, Z.L.; Li, L.N.; Wu, K.L.; Duan, J. Enchanting Chinese Paphiopedilum Plants. Guangdong Gard. 2010, 32, 71–76. [Google Scholar]
  11. Zeng, S.J.; Tian, R.S.; Chen, Z.L.; Wu, K.L.; Duan, J. Research Progress on Cross Breeding of Paphiopedilum. J. Trop. Subtrop. Bot. 2010, 18, 459–468. [Google Scholar]
  12. Parveen, I.; Singh, H.K.; Raghuvanshi, S.; Pradhan, U.C.; Babbar, S.B. DNA barcoding of endangered Indian Paphiopedilum species. Mol. Ecol. Resour. 2012, 12, 82–90. [Google Scholar] [CrossRef] [PubMed]
  13. Li, Z.Y.; Wu, Y.L.; Peng, K. Micro-morphological Characters of Leaf Epidermis of Ten Species in Genus Paphiopedilum. Plant Res. 2014, 34, 723–729. [Google Scholar]
  14. Wu, R.H.; Zhang, X. Research Advance on Reproductive Biology of Paphiopedilum. Henan Agric. Sci. 2013, 42, 6–10. [Google Scholar] [CrossRef]
  15. Charlesworth, D.; Wright, S.I. Breeding systems and genome evolution. Curr. Opin. Genet. Dev. 2001, 11, 685–690. [Google Scholar] [CrossRef] [PubMed]
  16. Cole, C. Genetic variation in rare and common plants. Annu. Rev. Ecol. Syst. 2003, 34, 213–237. [Google Scholar] [CrossRef]
  17. Gitzendanner, M.A.; Soltis, P.S. Patterns of genetic variation in rare and widespread plant congeners. Am. J. Bot. 2000, 87, 783–792. [Google Scholar] [CrossRef]
  18. Luo, L.L.; Wang, Q.; Li, X.L.; Xu, D.L.; Hu, H. Population Genetic Diversity and Species Distribution Evaluation of Bletilla striata (Orchidaceae) in Southwest China Using SSR Markers. Ecol. Evol. 2025, 15, e72043. [Google Scholar] [CrossRef]
  19. Zhu, G.F.; Guo, E. Progress in molecular biology of important ornamental orchids. Bot. Bull. 2004, 21, 471–477. [Google Scholar]
  20. Gao, L.X.; Qin, G.L.; Yi, G.P. SRAP analysis of genetic diversity in leaf-bearing tulips. South. J. Agric. 2014, 45, 1734–1738. [Google Scholar]
  21. Obara-Okeyo, P.; Kako, S. Genetic diversity and identification of Cymbidium cultivars as measured by amplified polymorphic DNA (RAPD) markers. Euphytica 1998, 99, 95–101. [Google Scholar] [CrossRef]
  22. Gao, L.X. Screening of ISSR primers and optimization of reaction system in Paphiopedilum malipoense. Anhui Agric. Sci. 2014, 42, 6553–6555. [Google Scholar] [CrossRef]
  23. Zhu, Y.Y.; Wang, G.; Hou, N.; Wang, L.H. SRAP genetic diversity analysis of wild tulips in southern Guizhou. J. Southwest For. Univ. 2017, 37, 10–14. [Google Scholar]
  24. Qin, H.Z.; Pan, B.; Zhao, J.; Zou, R.; Wei, X.; Tang, F.L. ISSR genetic diversity analysis of very small populations of the wild plant Dulcis alba. Guangxi Sci. 2022, 29, 1134–1140. [Google Scholar] [CrossRef]
  25. Li, Z.Y.; Guan, M.Y.; Li, J.; Li, M.Y. Genetic Diversity of Paphiopedilum micranthum Detected by ISSR Data. Northwest J. Bot. 2016, 36, 1351–1356. [Google Scholar]
  26. Xu, Y.; Chen, Z.G.; Xu, Y.F.; Ge, H.; Yang, S.H.; Zhao, X.; Kou, Y.P.; Yu, X.N.; Jia, R.D. Genetic Diversity of Wild Paphiopedilum hirsutissimum Populations in Southwest China with SSR Markers J. Trop. Crops 2023, 44, 2208–2218. [Google Scholar]
  27. Xu, Z.Y.; Chang, R.Z. Comparison of the information content of different molecular marker techniques. Plant Genet. Resour. Sci. 2000, 1, 41–46. [Google Scholar]
  28. Ping, J.; Feng, P.; Li, J.; Zhang, R.; Su, Y.; Wang, T. Molecular evolution and SSRs analysis based on the chloroplast genome of Callitropsis funebris. Ecol. Evol. 2021, 11, 4786–4802. [Google Scholar] [CrossRef] [PubMed]
  29. Tambarussi, E.; de Souza, A.P. Population genetic structure, introgression, and hybridization in the genus Rhizophora along the Brazilian coast. Ecol. Evol. 2018, 8, 3491–3504. [Google Scholar] [CrossRef]
  30. Ellis, J.R.; Pashley, C.H.; Burke, J.M.; McCauley, D.E. High genetic diversity in a rare and endangered sunflower as compared to a common congener. Mol. Ecol. 2006, 15, 2345–2355. [Google Scholar] [CrossRef]
  31. Furches, M.S.; Wallace, L.E.; Helenurm, K. High genetic divergence characterizes populations of the endemic plant Lithophragma maximum (Saxifragaceae) on San Clemente Island. Conserv. Genet. 2009, 10, 115–126. [Google Scholar] [CrossRef]
  32. Riley, L.; McGlaughlin, M.E.; Helenurm, K. Genetic diversity following demographic recovery in the insular endemic plant Galium catalinense subspecies acrispum. Conserv. Genet. 2010, 11, 2015–2025. [Google Scholar] [CrossRef]
  33. Dunbar-Co, S.; Wieczorek, A.M. Genetic structure among populations in the endemic Hawaiian Plantago lineage: Insights from microsatellite variation. Plant Species Biol. 2011, 26, 134–144. [Google Scholar] [CrossRef]
  34. Kim, C.; Jung, J.; Choi, H.-K. Molecular identification of Schoenoplectiella species (Cyperaceae) by use of microsatellite markers. Plant Syst. Evol. 2012, 298, 811–817. [Google Scholar] [CrossRef]
  35. Ou, T.Y.; Wu, Z.N.; Tian, C.Y.; Yang, Y.; Gong, W.; Niu, J.; Li, Z. Development of Genome-Wide SSR Markers in Leymus chinensis with Genetic Diversity Analysis and DNA Fingerprints. Int. J. Mol. Sci. 2025, 26, 918. [Google Scholar] [CrossRef]
  36. Yan, J.Y.; Zheng, B.; Wang, S.B.; Xu, W.; Qian, M.; Ma, X.; Wu, H. Genetic Diversity and Fingerprinting of 231 Mango Germplasm Using Genome SSR Markers. Int. J. Mol. Sci. 2024, 25, 13625. [Google Scholar] [CrossRef]
  37. Fan, J.Z.; Li, X.L.; He, J.Z.; Zeng, Y.H.; Wang, F.S.; Bu, C.Y. Studies on the Phenotypic Diversity and the Genetic Relationships of 29 Species of Paphiopedilum. J. Plant Genet. Resour. 2023, 24, 680–691. [Google Scholar] [CrossRef]
  38. Gu, R.; Xu, R.; Wei, S.; Ingvarsson, P.K.; Fan, S.; Liu, G. Reduced representation sequencing reveals genetic diversity and adaptive genetic divergence in Calamus rhabdocladus. Sci. Rep. 2025, 15, 21848. [Google Scholar] [CrossRef] [PubMed]
  39. Fu, Y.Y.; Li, S.Y.; Ma, B.Y.; Liu, C.L.; Qi, Y.K.; Pang, C.H. Genetic Diversity Analysis Core Collection Construction of Ancient Sophora japonica L. Using SSR Markers. Int. J. Mol. Sci. 2024, 25, 12776. [Google Scholar] [CrossRef] [PubMed]
  40. Gao, C.C.; Chen, C.; Liu, N.; Liu, F.F.; Su, X.H.; Liu, C.G.; Huang, Q.J. Genetic Diversity and Association Analysis of Traits Related to Water-Use Efficiency and Nitrogen-Use Efficiency of Populus deltoides Based on SSR Markers. Int. J. Mol. Sci. 2024, 25, 11515. [Google Scholar] [CrossRef] [PubMed]
  41. Kulkarni, K.P.; Appiah, R.K.; Cicalese, J.J.; Vorsa, N.; Reddy, U.K.; Elavarthi, S.; Melmaiee, K. Generation and characterization of novel transcriptome-derived SSR markers for genetic applications in blueberry. Sci. Rep. 2025, 15, 25050. [Google Scholar] [CrossRef]
  42. Li, J.; Zhang, X.F.; Chen, J.Y.; Wu, L.Q.; Xu, L.L. Genetic Diversity of Cypripedium tibeticum Populations Revealed by ISSR Analysis. Acta Bot. Boreali-Occident. Sin. 2020, 40, 0669–0977. [Google Scholar]
  43. Nybom, H. Comparison of Different Nuclear DNA Markers for Estimating Genetic Diversity in Plants. Mol. Ecol. 2004, 13, 1143–1155. [Google Scholar] [CrossRef] [PubMed]
  44. Cui, X.Q.; Tang, X.; Huang, C.Y.; Deng, J.L.; Li, X.; Lu, J.S.; Li, X.M.; Zhang, Z.B. Genetic diversity analysis and DNA fingerprint construction for 22 Dendrobium species. Mol. Plant Breed. 2021, 19, 3005–3014. [Google Scholar]
  45. Xu, Y.; Jia, R.; Zhou, Y.; Cheng, H.; Zhao, X.; Ge, H. Development and characterization of polymorphic EST-SSR markers for Paphiopedilum henryanum (Orchidaceae). Appl. Plant Sci. 2018, 6, e01152. [Google Scholar] [CrossRef] [PubMed]
  46. Wright, S. Evolution in Mendelian populations. Genetics 1931, 16, 97–159. [Google Scholar] [CrossRef] [PubMed]
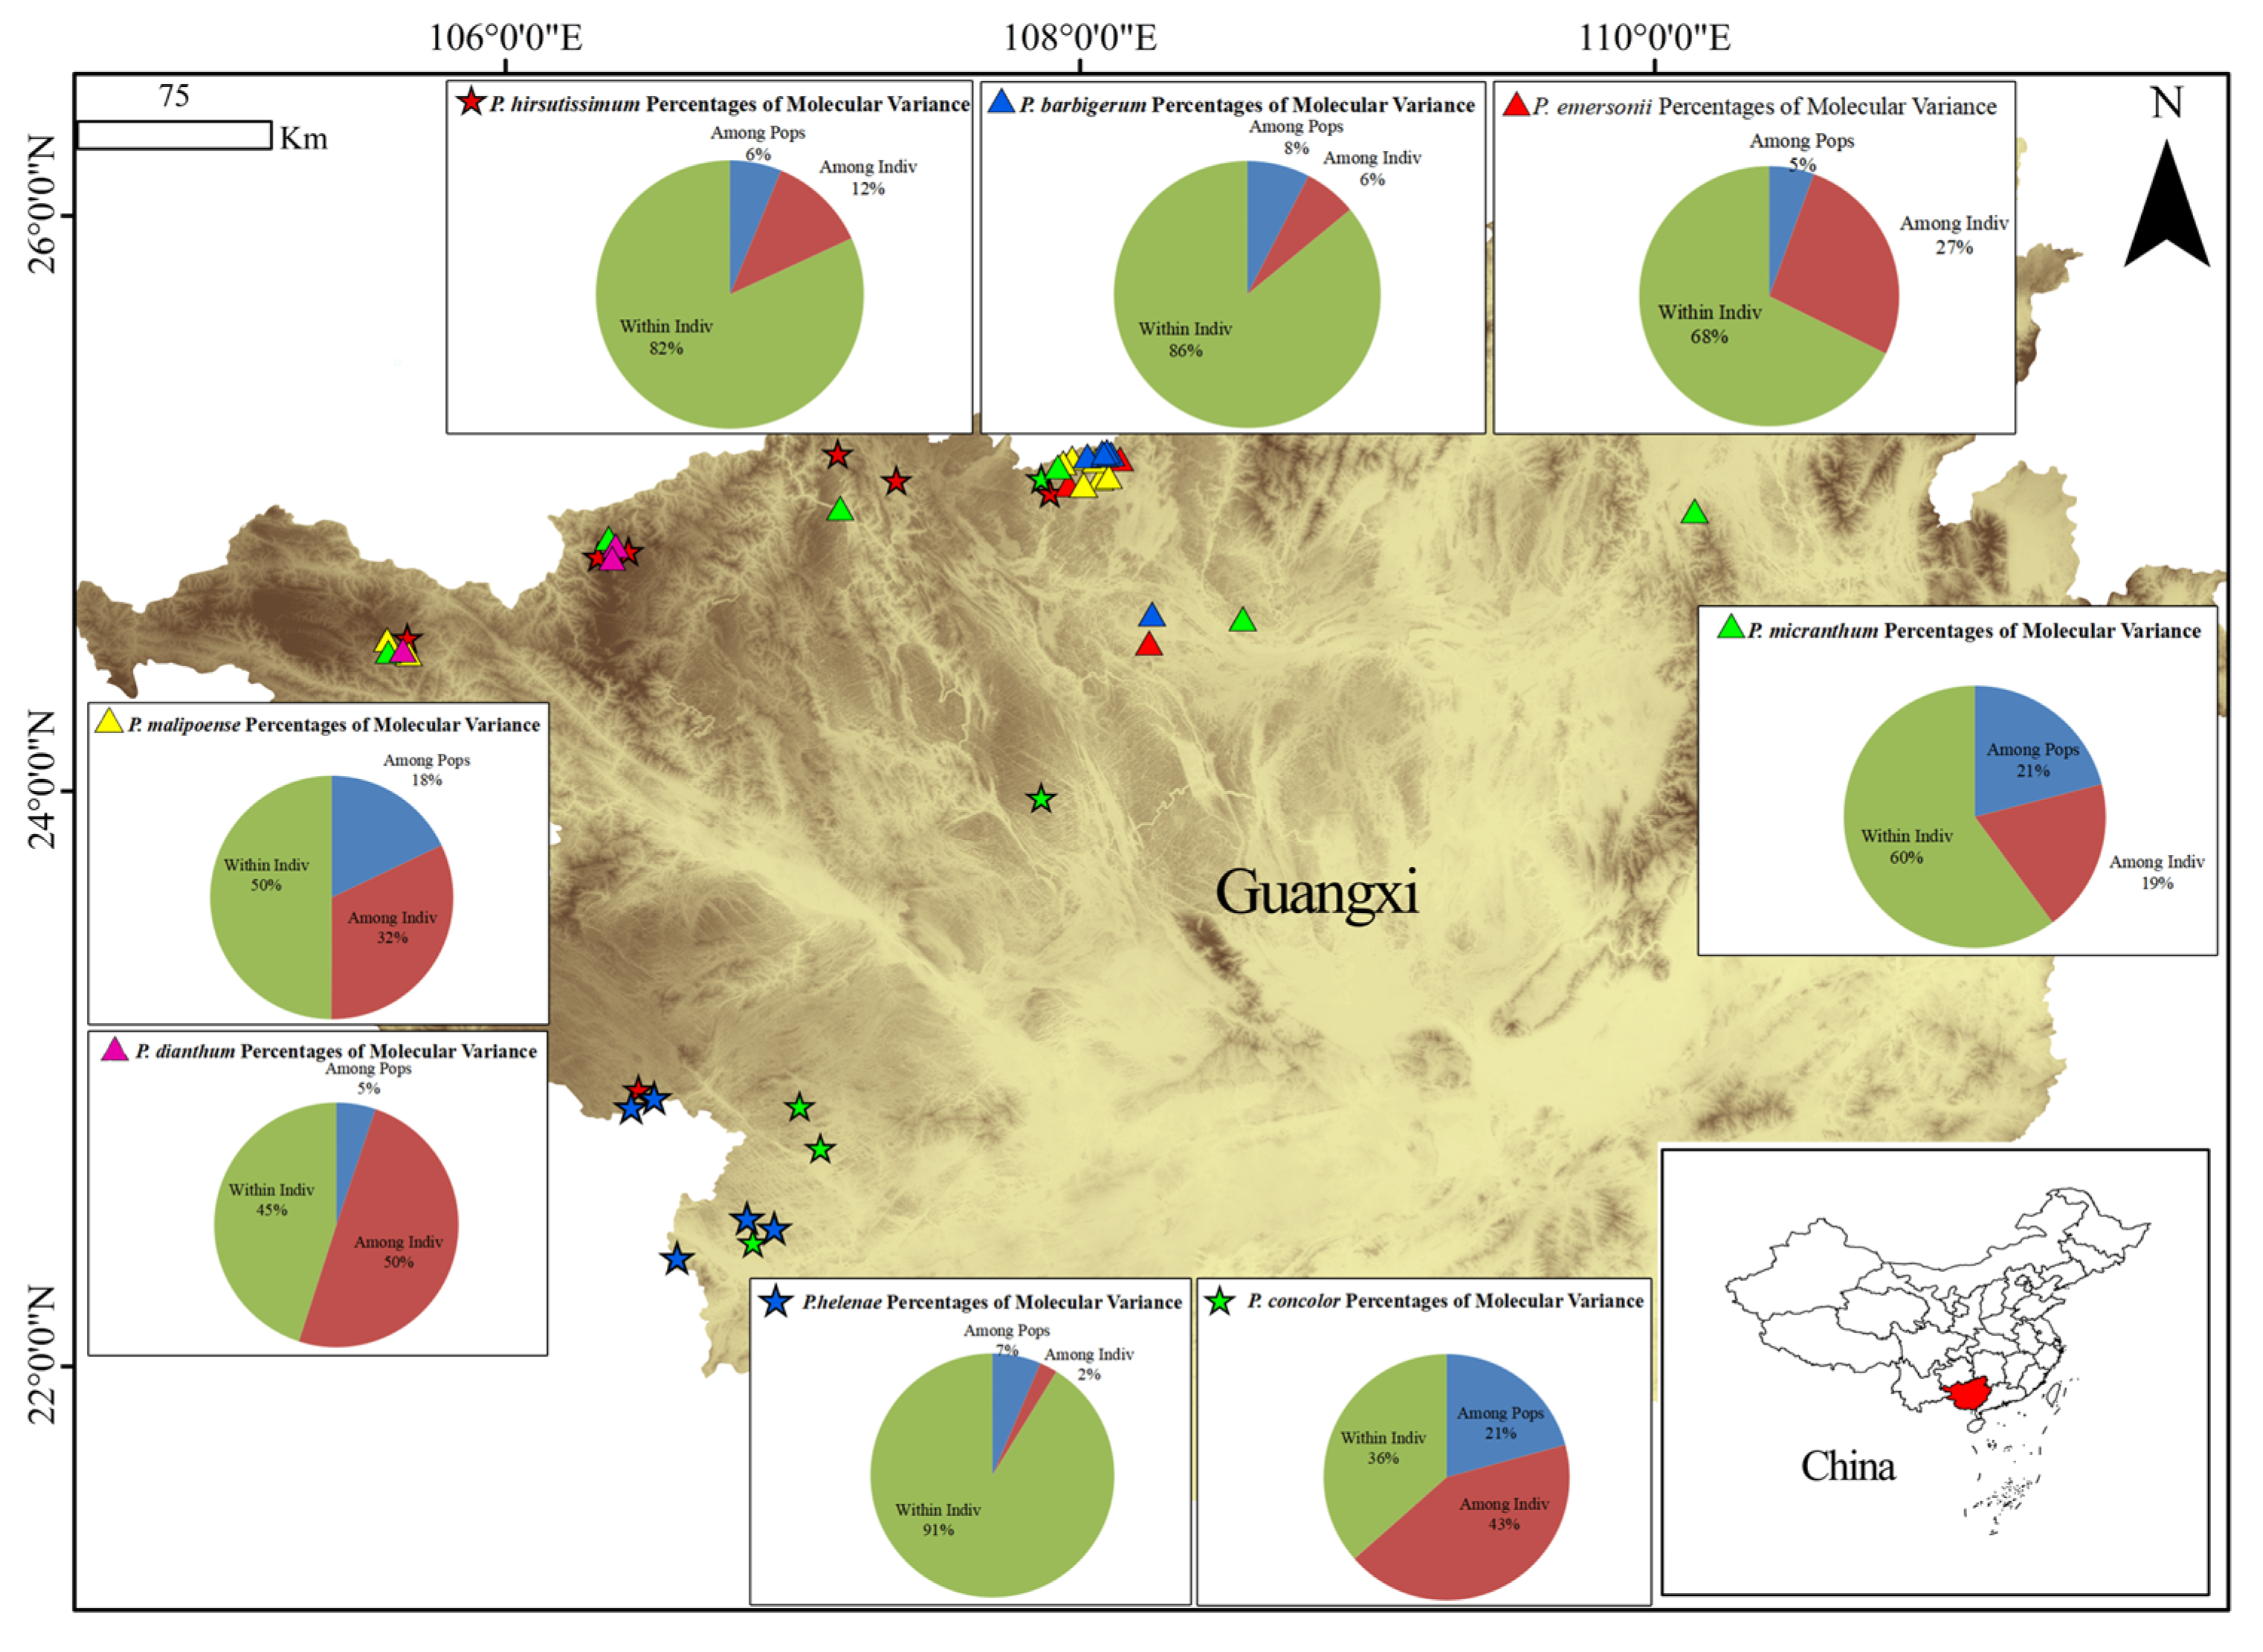
Figure 1. Results of hierarchical AMOVA testing from the populations.
Ijms 26 08543 g001
Figure 2. (A) Changes in K value plotted by AK method of Structure analysis. (B) UPMGA cluster graph. (C) The structural result for K = 6.
Ijms 26 08543 g002
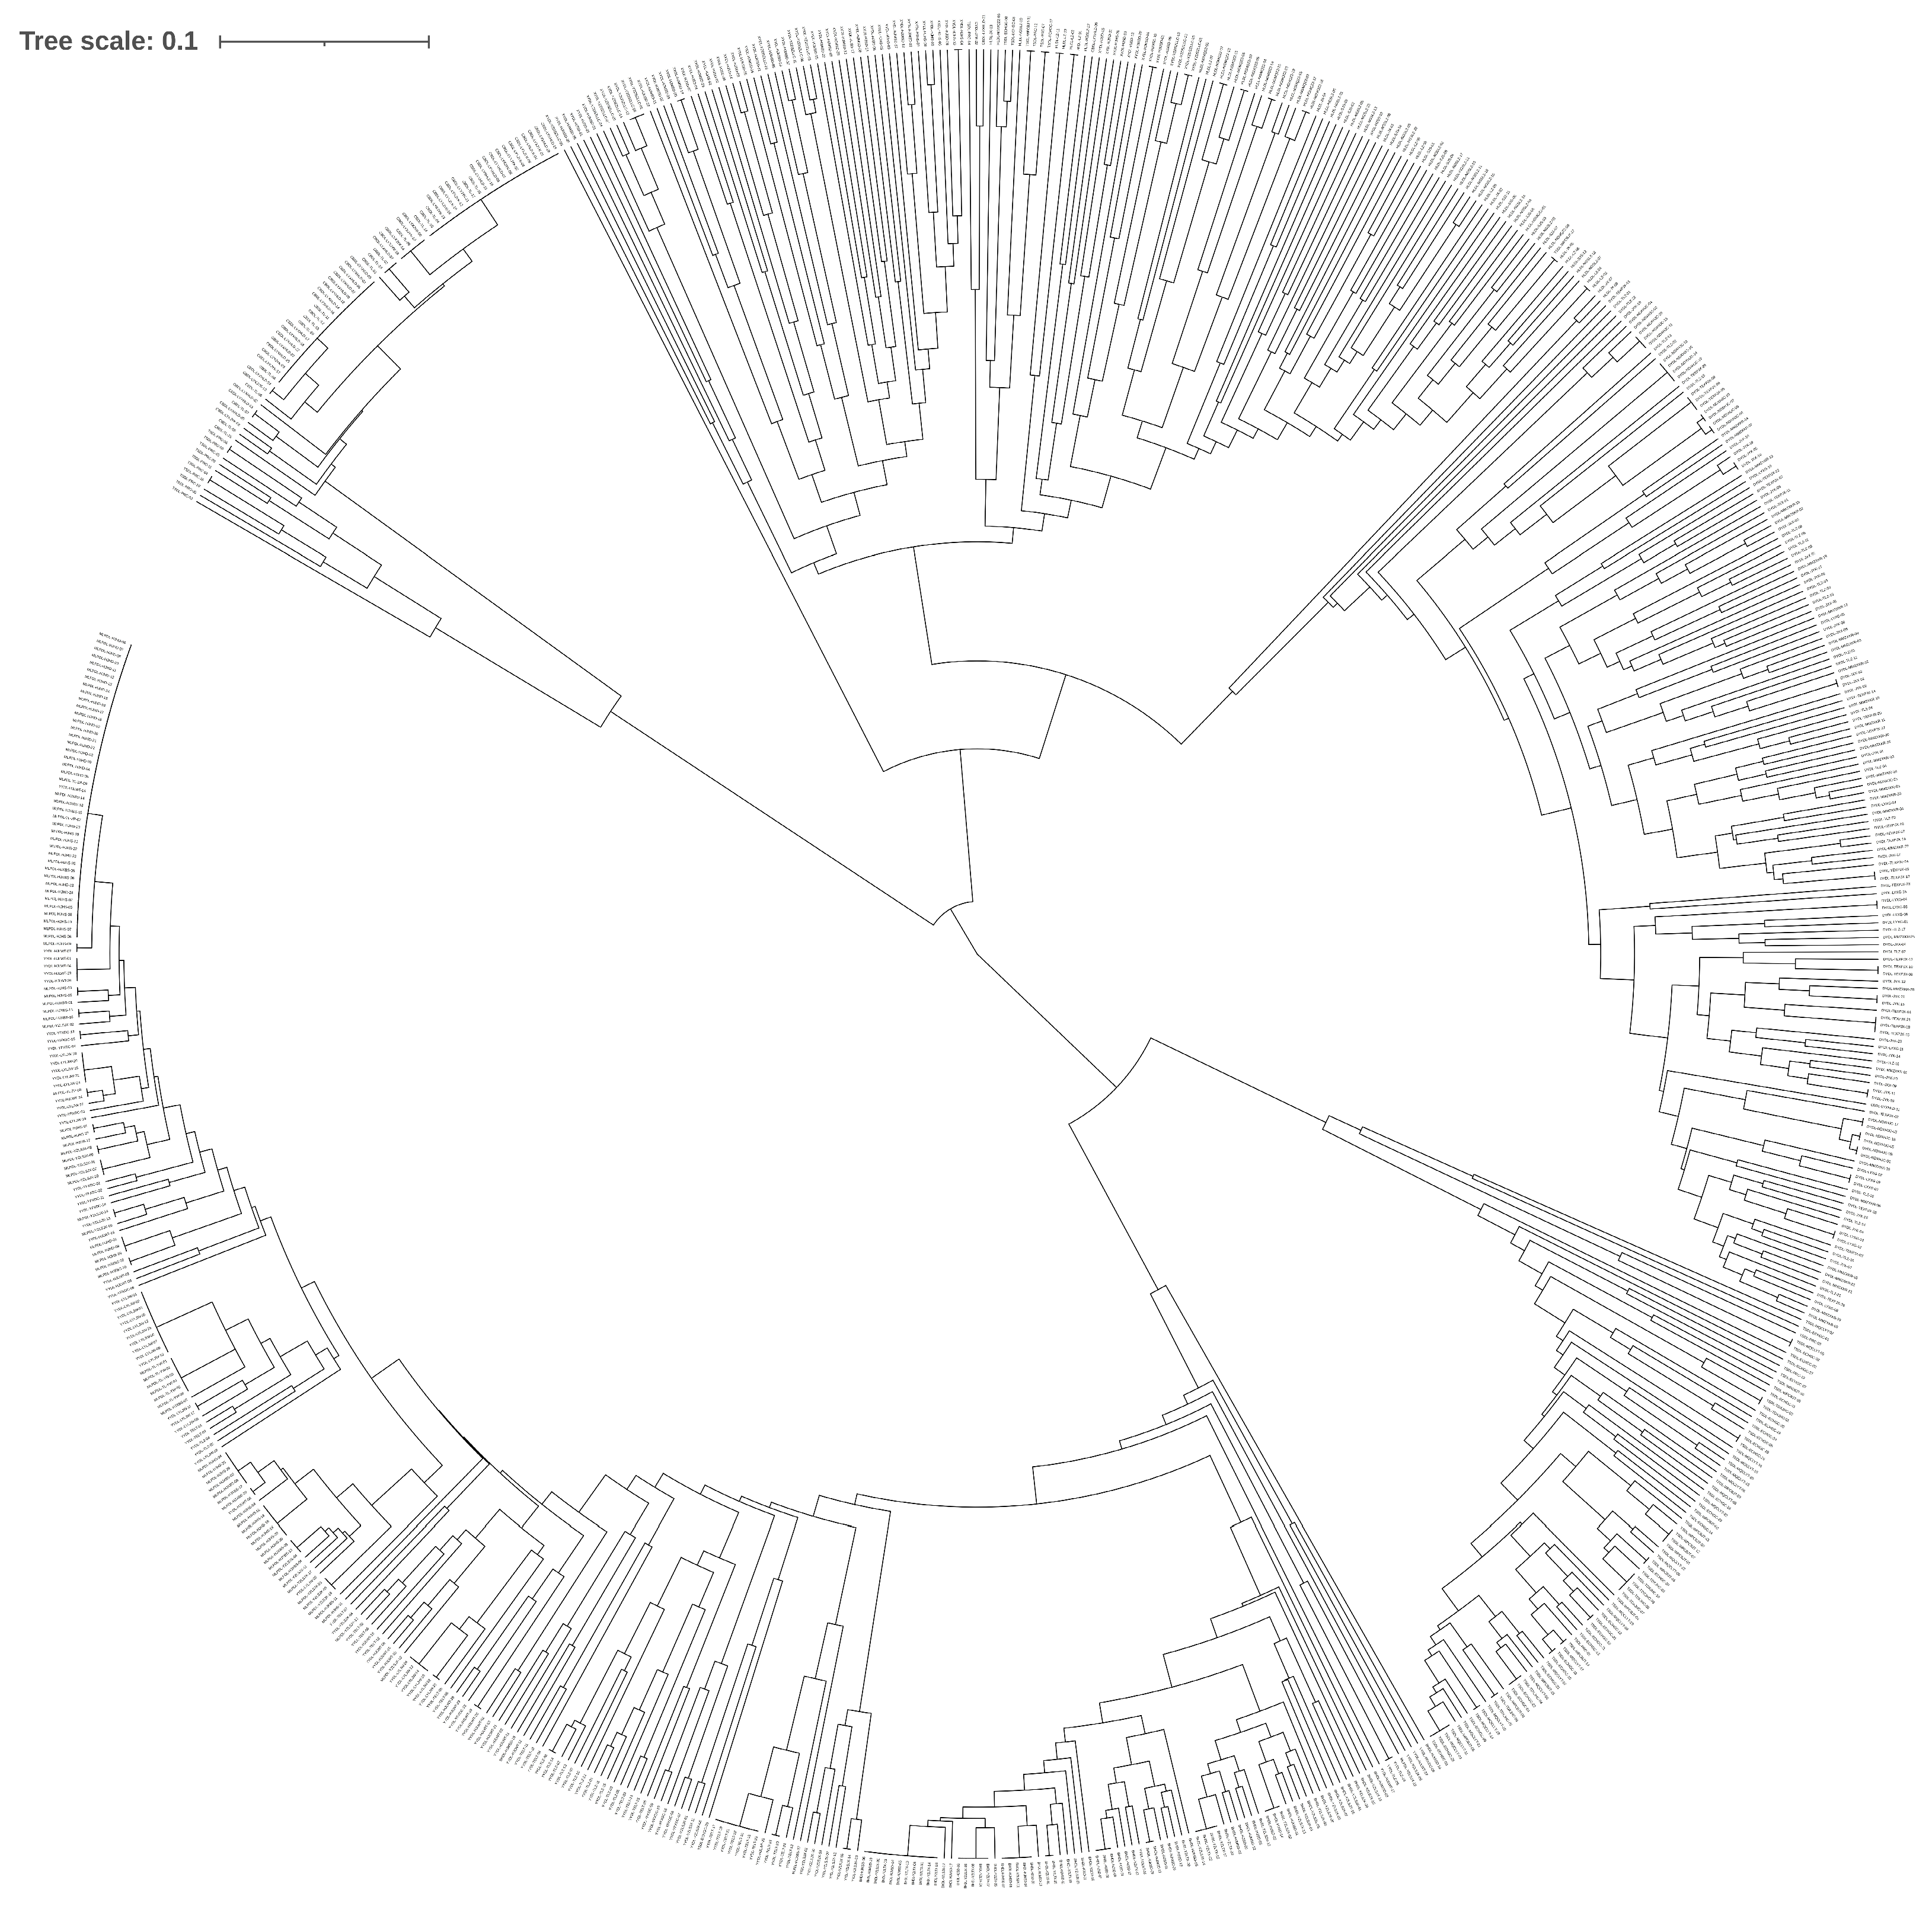
Figure 3. Circular cluster diagram (see Figure S1 for a clear picture).
Ijms 26 08543 g003
Figure 4. Results of principal components analysis.
Ijms 26 08543 g004
Figure 5. Genetic distance and geographic distances analysis.
Ijms 26 08543 g005
Figure 6. Biological characteristics, populations, and geographic locations of eight Paphiopedilum species in Guangxi.
Ijms 26 08543 g006
Table 1. Polymorphism of ten pairs of EST-SSR primers.
LocusNaNeIHoHeFPICSignif
DL01452.681.1330.1720.6270.7260.555***
DL020175.5452.0490.4690.820.4280.802***
DL02162.1440.9420.230.5340.5680.474***
DL023174.0111.7280.1820.7510.7570.72***
DL03062.5361.0740.1270.6060.790.531***
DL032179.6762.4550.420.8970.5320.888***
DL034143.2421.4620.1660.6920.760.644***
DL03663.3851.3410.1530.7050.7830.656***
DL039154.5631.960.3570.7810.5430.763***
DL04063.381.3720.2670.7040.620.657***
Mean10.94.1161.5520.2540.7120.6510.669
St Dev5.4662.1970.4850.1210.1070.129
Note: Na: alleles observed; Ne: effective allele; I: Shannon index; Ho: observed heterozygosity; He: expected heterozygosity; F: Fixed index, an index to evaluate the degree of deviation between actual observed values and theoretical values, PIC: polymorphic information index; Signif: significant (ns means not significant, i.e., the population conforms to HWE; *** indicates significant difference, p < 0.001).
Table 2. Genetic diversity values and inbreeding coefficient F at the population level in 39 populations of 8 species.
SpeciesPopNaNeIHoHeF
P. emersoniiBHDL-HJMSD2.6001.2810.3600.1480.1860.202
BHDL-HJSD1.7001.2420.2400.1290.1400.023
BHDL-YZLSJX2.5001.4410.3660.1810.1960.054
BHDL-YZLTX1.9001.2700.2750.1710.166−0.043
Mean2.1751.3080.3100.1570.1720.059
P. dianthumCBDL-LYXHLD2.6001.1970.3130.0600.1540.696
CBDL-LYXJYK1.2001.1120.0920.0630.0610.367
CBDL-TL1.4001.1240.1320.0830.079−0.064
Mean1.7331.1440.1790.0690.0980.333
P. hirsutissimumDYDL-JXX2.5001.7300.6000.3300.3490.087
DYDL-JYK3.1001.6650.6400.2890.3490.134
DYDL-LYXG2.9001.7360.6340.3530.3590.029
DYDL-MMZXKR2.7001.7450.5970.3510.348−0.048
DYDL-NDXHJC2.6001.8950.6040.3310.339−0.021
DYDL-TEXPJX3.3001.7930.6610.3260.3620.030
DYDL-TLZ2.8001.9810.7220.4020.4110.017
Mean2.8431.7920.6370.3400.3600.032
P. helenaeHLDL-JX3.4002.5130.9610.5500.537−0.044
HLDL-LZ3.1002.2670.8760.6000.507−0.143
HLDL-NGMQZ23.3002.2100.7890.4900.442−0.114
HLDL-NGSLZ3.8002.0570.7850.4090.4250.007
HLDL-SJS3.5002.2740.7750.4250.4090.030
Mean3.4202.2640.8370.4950.464−0.053
P. malipoenseMLPDL-HJHD1.1001.0180.0290.0000.0151.000
MLPDL-HJHS1.7001.1580.1740.0430.0990.504
MLPDL-HJXBS2.1001.2410.2740.0860.1520.318
MLPDL-TL1.2001.1470.1230.0780.0850.112
MLPDL-YZLSJX2.6001.5150.4210.1950.2160.073
Mean1.7401.2160.2040.0800.1130.401
P. concolorTSDL-ECHGC3.9001.7830.6710.2200.3400.402
TSDL-MQCLYT3.1001.7270.5130.1890.2520.291
TSDL-PRC3.4002.1320.8420.2520.4720.483
TSDL-TDXJHC1.7001.4530.3270.2300.204−0.016
TSDL-WPCBJT2.5001.6240.5190.2510.2870.241
Mean2.9201.7440.5740.2280.3110.280
P. barbigerumXYDL-HJHS3.4002.2150.7960.5030.421−0.089
XYDL-HJMSD4.6002.7991.0240.4930.5140.015
XYDL-HJSD3.6002.5680.9130.4530.4840.058
XYDL-YZDSZLLC3.9002.5830.9600.4980.5010.011
Mean3.8752.5410.9230.4870.480−0.001
P. micranthumYYDL-HJLWT3.7001.7730.5860.2520.2810.115
YYDL-LYLJW1.9001.3620.2820.1710.1600.057
YYDL-TELT3.1001.8880.6300.3080.3330.063
YYDL-TLZ2.6001.5060.4040.0640.2040.640
YYDL-YFXDC2.7001.7900.5410.2620.2850.124
YYDL-YZLSJX2.6001.8380.5700.2860.3110.074
Mean2.7671.6930.5020.2240.2620.179
Na: observed alleles; Ne: effective allele; I: Shannon Information Index; Ho: observed heterozygosity; He: expected heterozygosity; F: Fixed index.
Table 3. Inbreeding coefficients and gene flow of 10 primer pairs.
LocusFisFitFstNm
DL014−0.0040.7110.7120.101
DL020−0.0240.3950.4090.361
DL021−0.0700.5300.5600.196
DL0230.0280.7290.7210.097
DL0300.1880.7820.7320.091
DL0320.1960.5260.4100.359
DL0340.3190.7660.6570.130
DL0360.1690.7590.7100.102
DL0390.0510.5250.5000.250
DL040−0.0280.5880.5990.167
Mean0.0830.6310.6010.186
SE0.0400.0430.0400.033
Note: Fis: inbreeding coefficient within a population, Fit: overall inbreeding coefficient, Fst: genetic differentiation coefficient, Nm: gene flow (Nm = 0.25 (1 − Fst)/Fst).
Table 4. Molecular Analysis of Variance (AMOVA).
SourcedfSSMSEst. Var.%
Among Pops383169.94583.4202.09757%
Among Indiv7211394.6001.9340.35410%
Within Indiv760932.5001.2271.22733%
Total15195497.0445497.0453.678100%
Source: source of variation; df: Freedom of freedom; SS: total variance; MS: mean square error; Est. Var.: estimated variance; %: variation percentage; Among Pops: Gene flow between populations; Among Indiv: Gene flow among individuals of a species; Within Indiv: within a group of individuals.
Table 5. Populations and geographic locations of eight Paphiopedilum species.
SpeciesP. CodeLocationNo.ENH
P. emersoniiBHDL-YZLSJXYizhou District, Hechi City, Guangxi20108°34′24°36′437
BHDL-HJMSDHuanjiang County, Hechi City, Guangxi20108°03′25°09′577
BHDL-YZLTXYizhou District, Hechi City, Guangxi20108°14′24°30′218
BHDL-HJSDHuanjiang County, Hechi City, Guangxi14108°02′25°09′592
P. micranthumYYDL-LYLJWLeye County, Baise City, Guangxi28106°22′24°50′640
YYDL-YZLSJXYizhou District, Hechi City, Guangxi14108°34′24°36′285
YYDL-TELTTian′e County, Hechi City, Guangxi26107°09′24°59′870
YYDL-HJMLTHuanjiang County, Hechi City, Guangxi29108°02′25°08′977
YYDL-YFXDXYongfu County, Guilin City, Guangxi 16110°08′24°58′363
YYDL-TLZTianlin County, Baise City, Guangxi15105°38′24°30′1122
P. barbigerumXYDL-YZDSZLLCYizhou District, Hechi City, Guangxi16108°15′24°37′268
XYDL-HJHSHuanjiang County, Hechi City, Guangxi30108°03′25°09′533
XYDL-HJSDHuanjiang County, Hechi City, Guangxi17108°02′25°09′541
XYDL-HJMSDHuanjiang County, Hechi City, Guangxi10108°03′25°09′537
P. malipoenseMLPDL-YZLSJXYizhou District, Hechi City, Guangxi15108°34′24°36′285
MLPDL-HJHSHuanjiang County, Hechi City, Guangxi30108°03′25°09′398
MLPDL-HJHDHuanjiang County, Hechi City, Guangxi24108°03′25°08′377
MLPDL-HJXBSHuanjiang County, Hechi City, Guangxi20107°56′25°08′709
MLPDL-TLTianlin County, Baise City, Guangxi9105°38′24°30′1122
P. concolorTSDL-PRCZuozhou District, Chongzuo City, Guangxi25107°57′25°06′732
TSDL-WPCBJTDahua County, Hechi City, Guangxi20107°51′23°58′567
TSDL-TDXJHCTiandeng County, Chongzuo City, Guangxi9107°01′22°54′384
TSDL-ECHGCDaxin County, Chongzuo City, Guangxi33107°05′22°45′356
TSDL-MQCLYTLongzhou County, Chongzuo City, Guangxi22106°53′22°26′404
P. dianthumCBDL-LYXJYKLeye County, Baise City, Guangxi19106°24′24°50′400
CBDL-LYXHJDLeye County, Baise City, Guangxi27106°22′24°48′700
CBDL-TLTianlin County, Baise City, Guangxi20105°38′24°30′1110
P. hirsutissimumDYDL-PEXPJXTian′e County, Hechi City, Guangxi29107°08′25°11′375
DYDL-JYKLeye County, Baise City, Guangxi23106°24′24°50′400
DYDL-LYXGLeye County, Baise City, Guangxi15106°19′24°48′820
DYDL-NDXHJCNandan County, Hechi City, Guangxi20107°21′25°05′386
DYDL-MMZXKRHuanjiang County, Hechi City, Guangxi30107°57′25°06′732
DYDL-JXXJinxi City, Guangxi10106°29′22°55′750
DYDL-TLZTianlin County, Baise City, Guangxi24105°38′24°30′1122
P. helenaeHLDL-NGSLZLongzhou County, Chongzuo City, Guangxi22106°50′22°31′547
HLDL-LZLongzhou County, Chongzuo City, Guangxi11106°35′22°22′429
HLDL-NGMQZ2Longzhou County, Chongzuo City, Guangxi19106°54′22°27′430
HLDL-JXJinxi City, Guangxi7106°29′22°55′790
HLDL-SJSJinxi City, Guangxi12106°28′22°54′700
No. = sample size; P. Code = Population code; E = East longitude; N = North latitude; H = altitude.
Table 6. Information on EST-SSR primers.
LocusRepeat MotifPrimer Sequence (F)Primer Sequence (R)Ta (°C)GenBank No.
DL014(CTC)6TTCCTTCCCTACCCTTTCCACAGCGGTGTCGTTGATGTT60MG333725
DL020(GCC)6GGCCAAGTACATGCACCCATTTCCCACCTCGGTTATGCAC60MG333700
DL021(CAG)6GCAAATCCATTCAGCCCTGCCGACATGGTCTGAGAGGAGC60MG333701
DL023(AGA)6CTTGGGACTCTTTCCTCGGCCAGCACCTCTTCGCGTAAGA60MG333703
DL030(CCG)6CAGGTTGACAGCAATGTCGCGCCGCAGCTTTTCGGATAAG60MG333710
DL032(AAAC)5AGCGTGTTTGGACTAGAGCATCGGGGATGCACATGGAAAA60MG333712
DL034(CGG)6GGGTGGGGAGAGTAGGAGTTGCCACAACTTGTTTTCCCGG60MG333714
DL036(CGT)6CCACGTGTGACAGAATCCCAGGCTCCCGACGAGGAATTAC60MG333716
DL039(ATC)6CCACCAGCTTTCATATCCTCCAGCCCATGCTGTGCAAAAAGA60MG333719
DL040(TCT)6AAGAAGTGGCTTCCATGGCAGCAAAACCAAGGTGTCGTCC60MG333720
Disclaimer/Publisher’s Note: The statements, opinions and data contained in all publications are solely those of the individual author(s) and contributor(s) and not of MDPI and/or the editor(s). MDPI and/or the editor(s) disclaim responsibility for any injury to people or property resulting from any ideas, methods, instructions or products referred to in the content.