3. Discussion
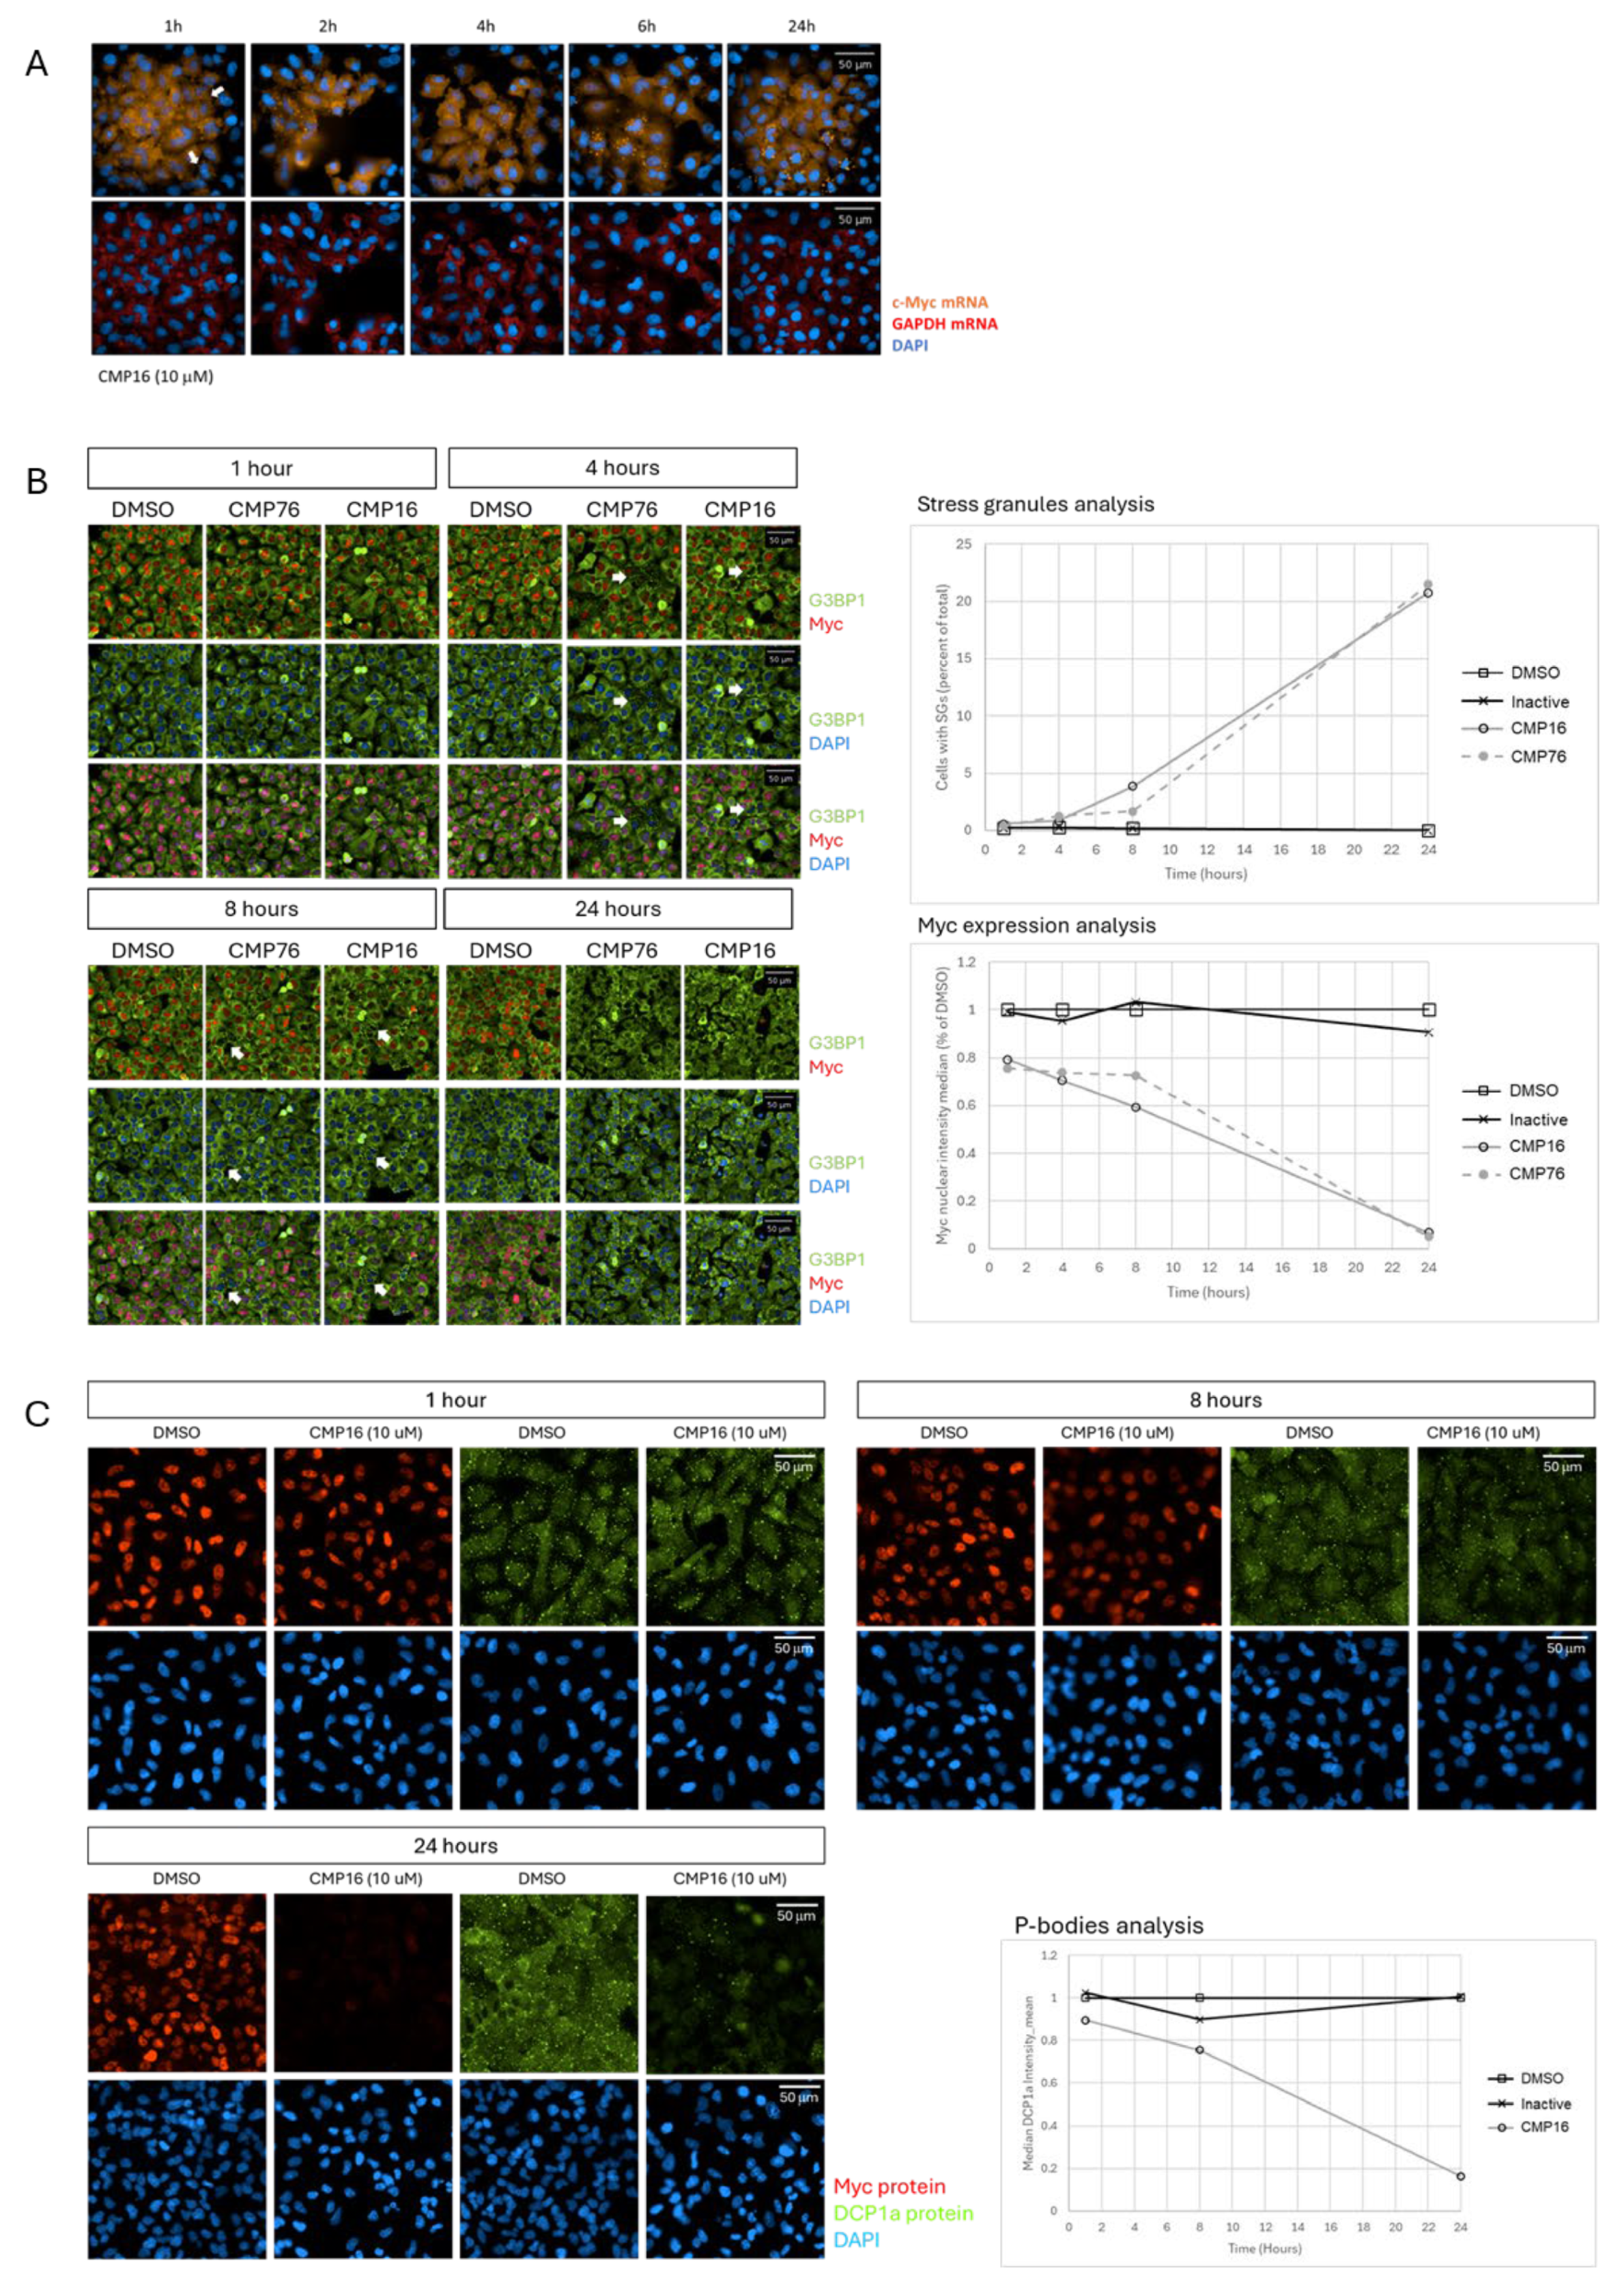
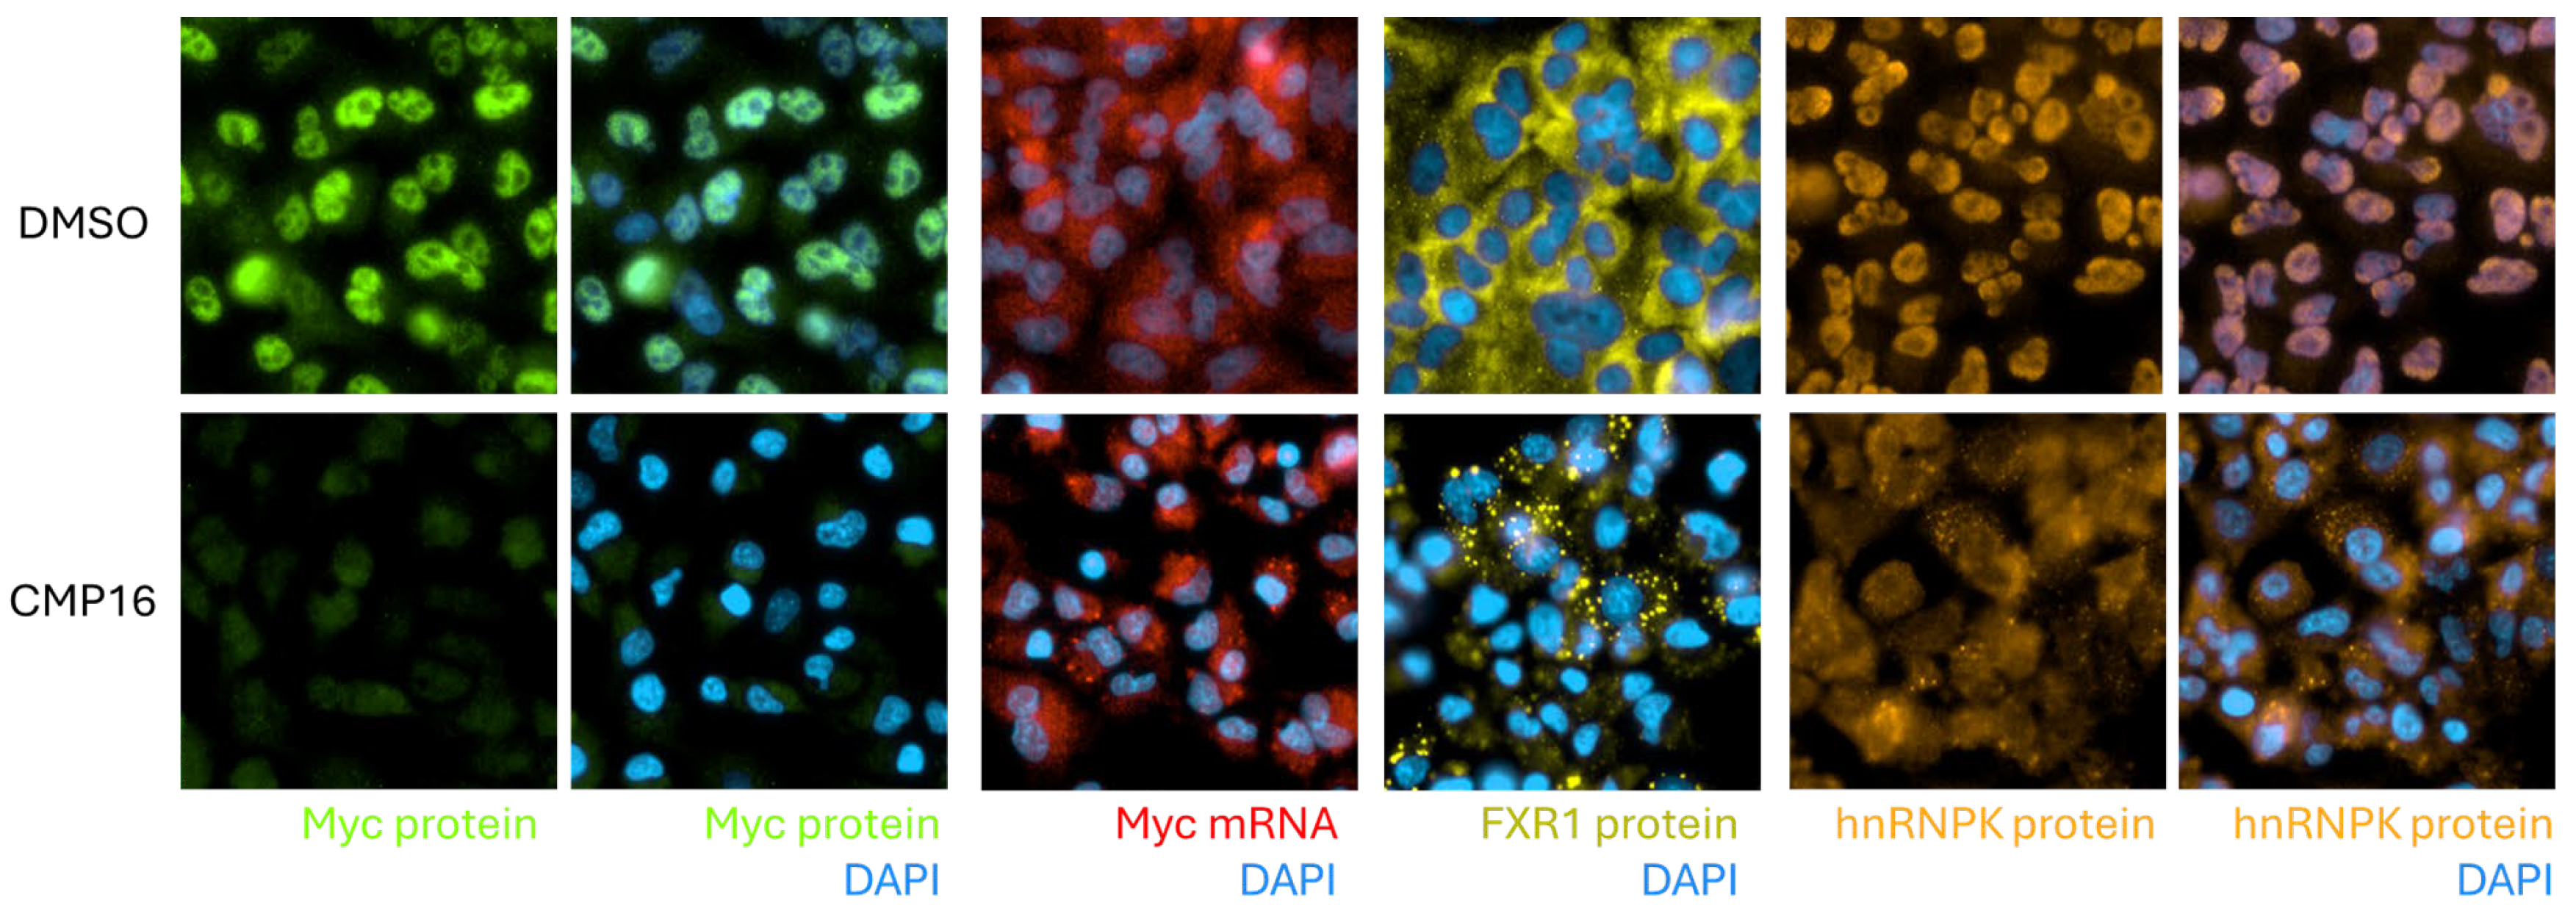
This study uncovers a previously unrecognized mechanism for MYC regulation through small molecule–induced relocalization of MYC mRNA to stress granules. In contrast to conventional approaches that target MYC transcription or protein stability, the compounds identified in this work act at the post-transcriptional level, altering the subcellular localization of MYC mRNA and effectively sequestering it within translationally repressive compartments. This relocalization leads to rapid depletion of Myc protein, detectable as early as two hours post-treatment—a timeframe consistent with the protein’s short half-life (~1 h in A549 cells). These kinetics suggest that translational inhibition, rather than transcriptional suppression, is the principal driver of protein depletion, offering a potentially advantageous therapeutic profile through swift modulation of oncogene expression.
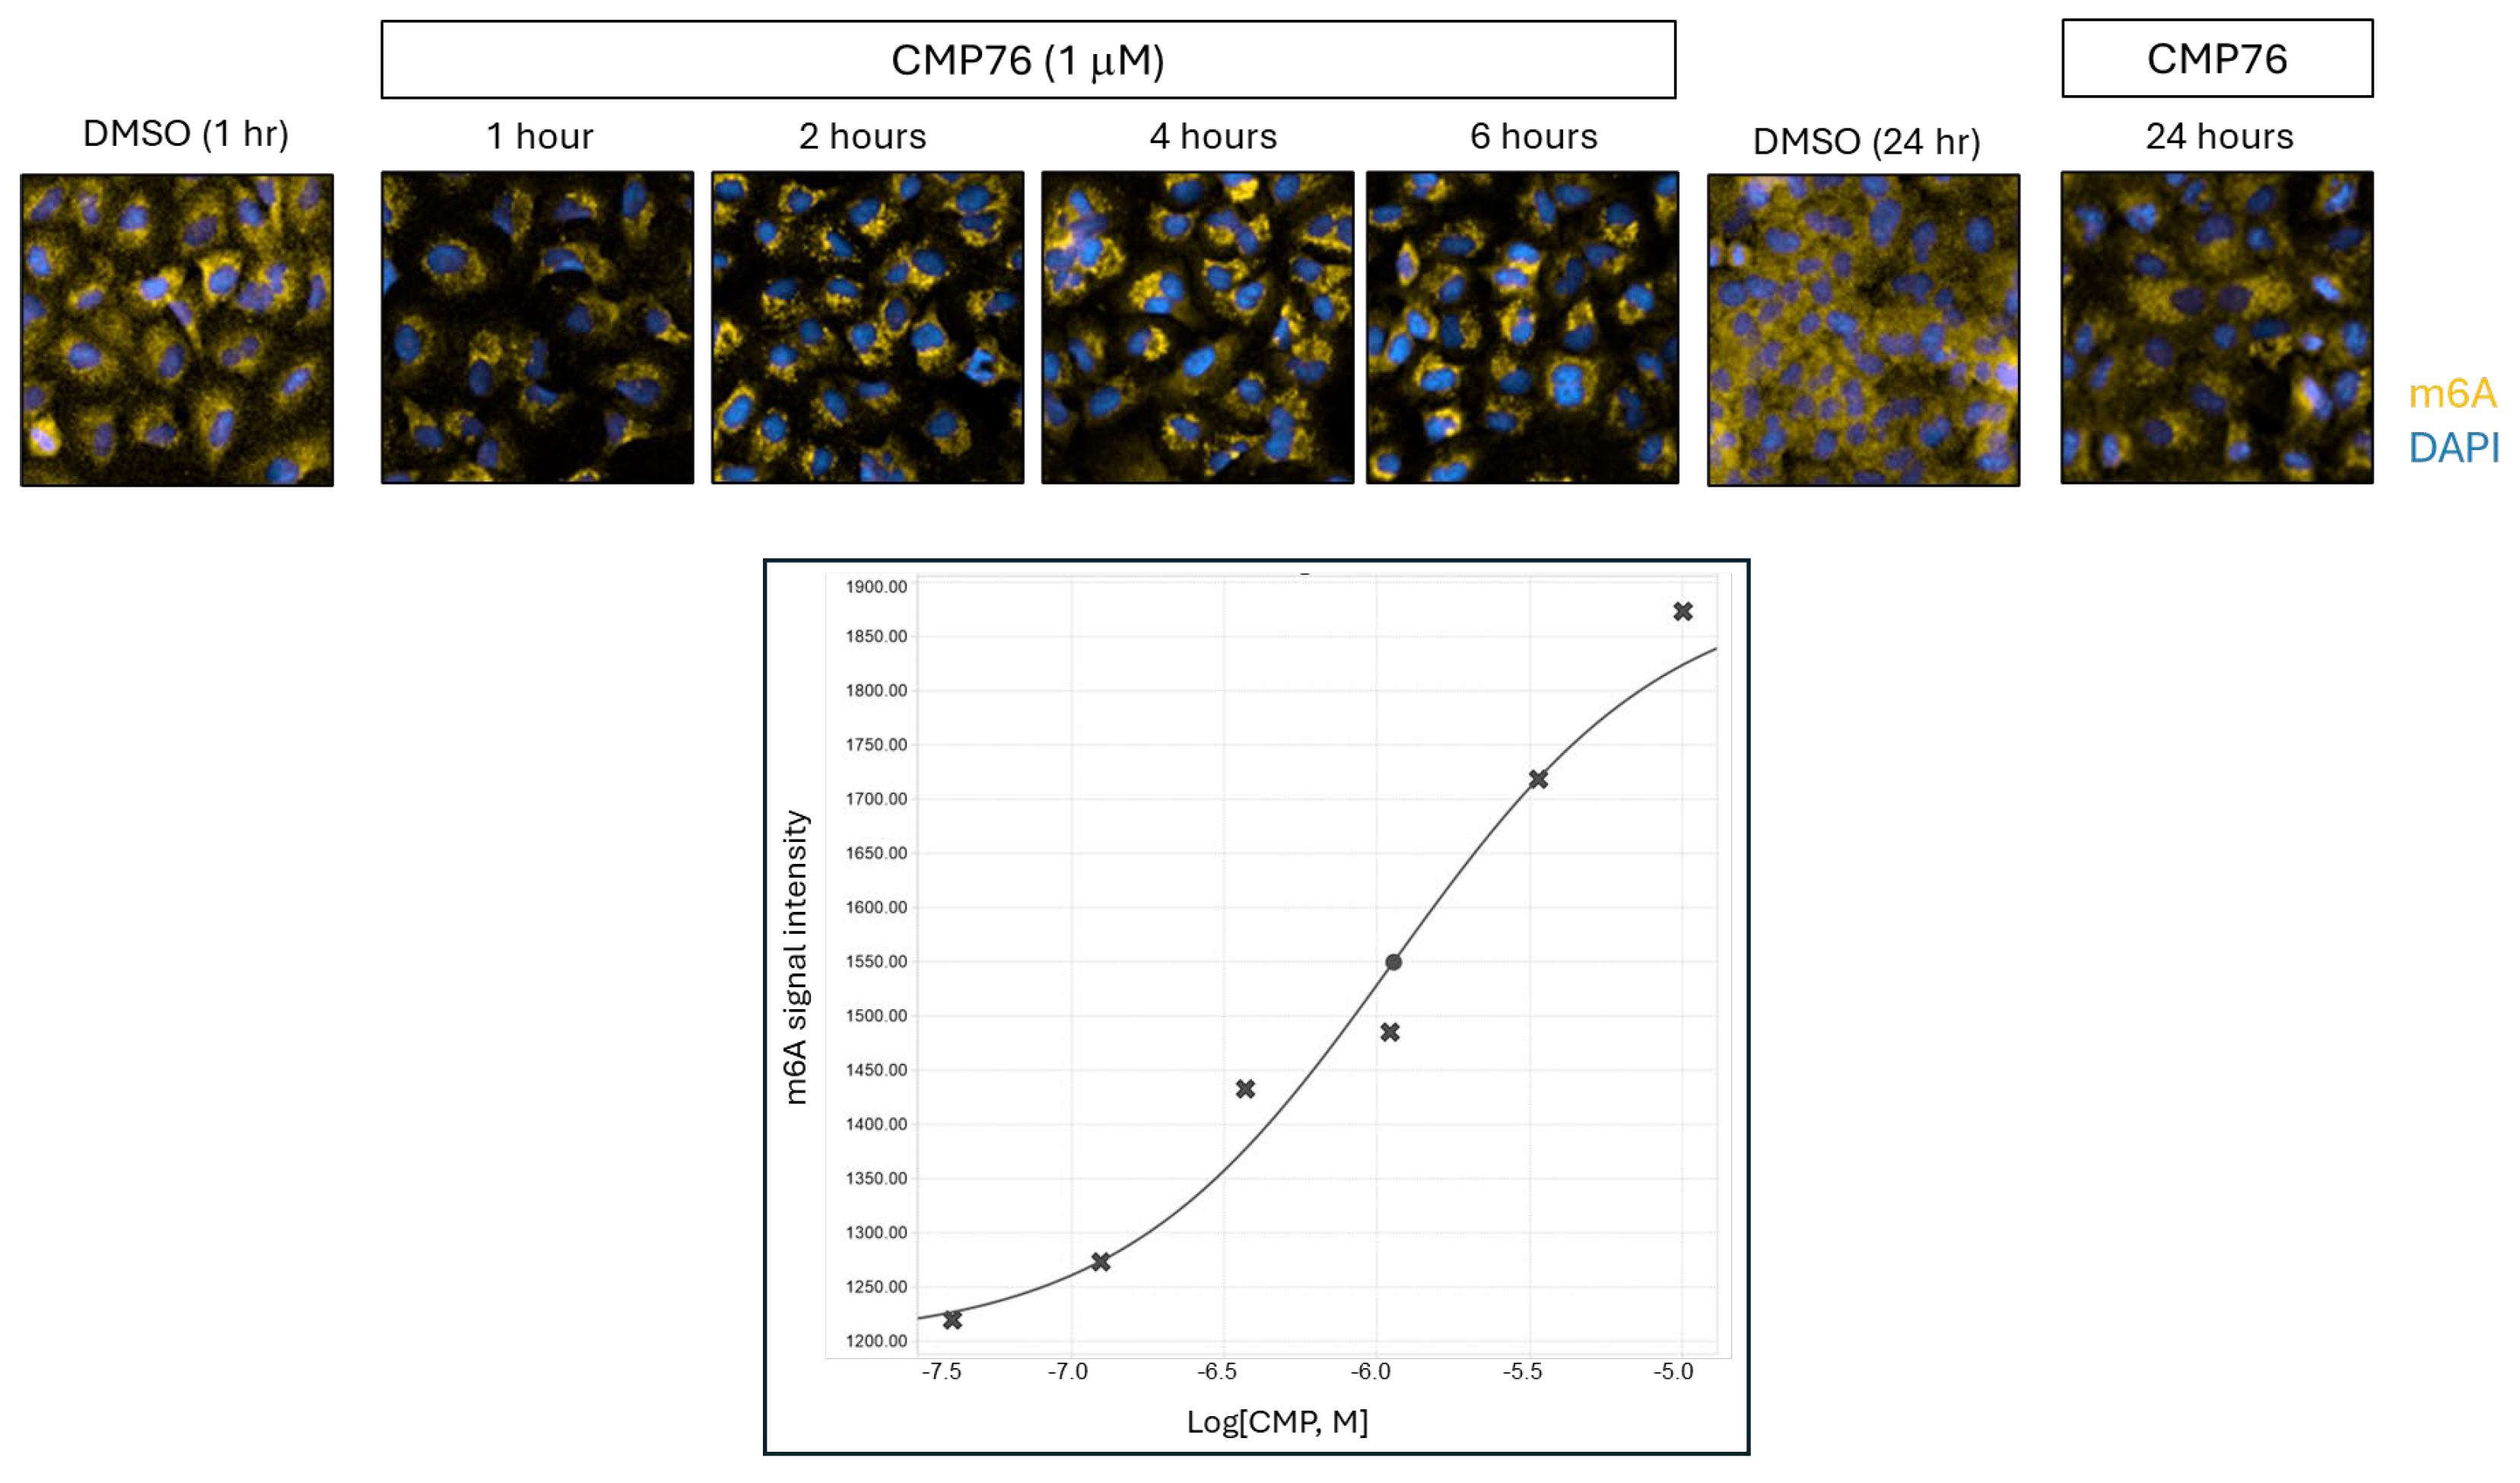
Temporal dissection of the compound’s activity indicates that the earliest detectable cellular phenotype is a redistribution of m6A-modified mRNAs, occurring within one hour of treatment and preceding overt stress granule formation. This observation implicates perturbation of m6A-RNA regulatory networks as an initiating event, with stress granule assembly emerging as a downstream consequence. The selective recruitment of m6A-tagged transcripts into stress granules is consistent with published data showing that m6A modified mRNAs promote granule formation via interactions with reader proteins [
19]. Moreover, several RBPs identified as binding to compound-responsive mRNAs—such as IGF2BP1, IGF2BP2, and RBM15—are themselves m6A-binding proteins, further supporting this mechanism [
20,
21]. These RBPs have been shown to play pro-proliferative roles in lung adenocarcinomas and NSCLC and are upregulated in those contexts [
20], highlighting the clinical relevance of this regulatory axis.
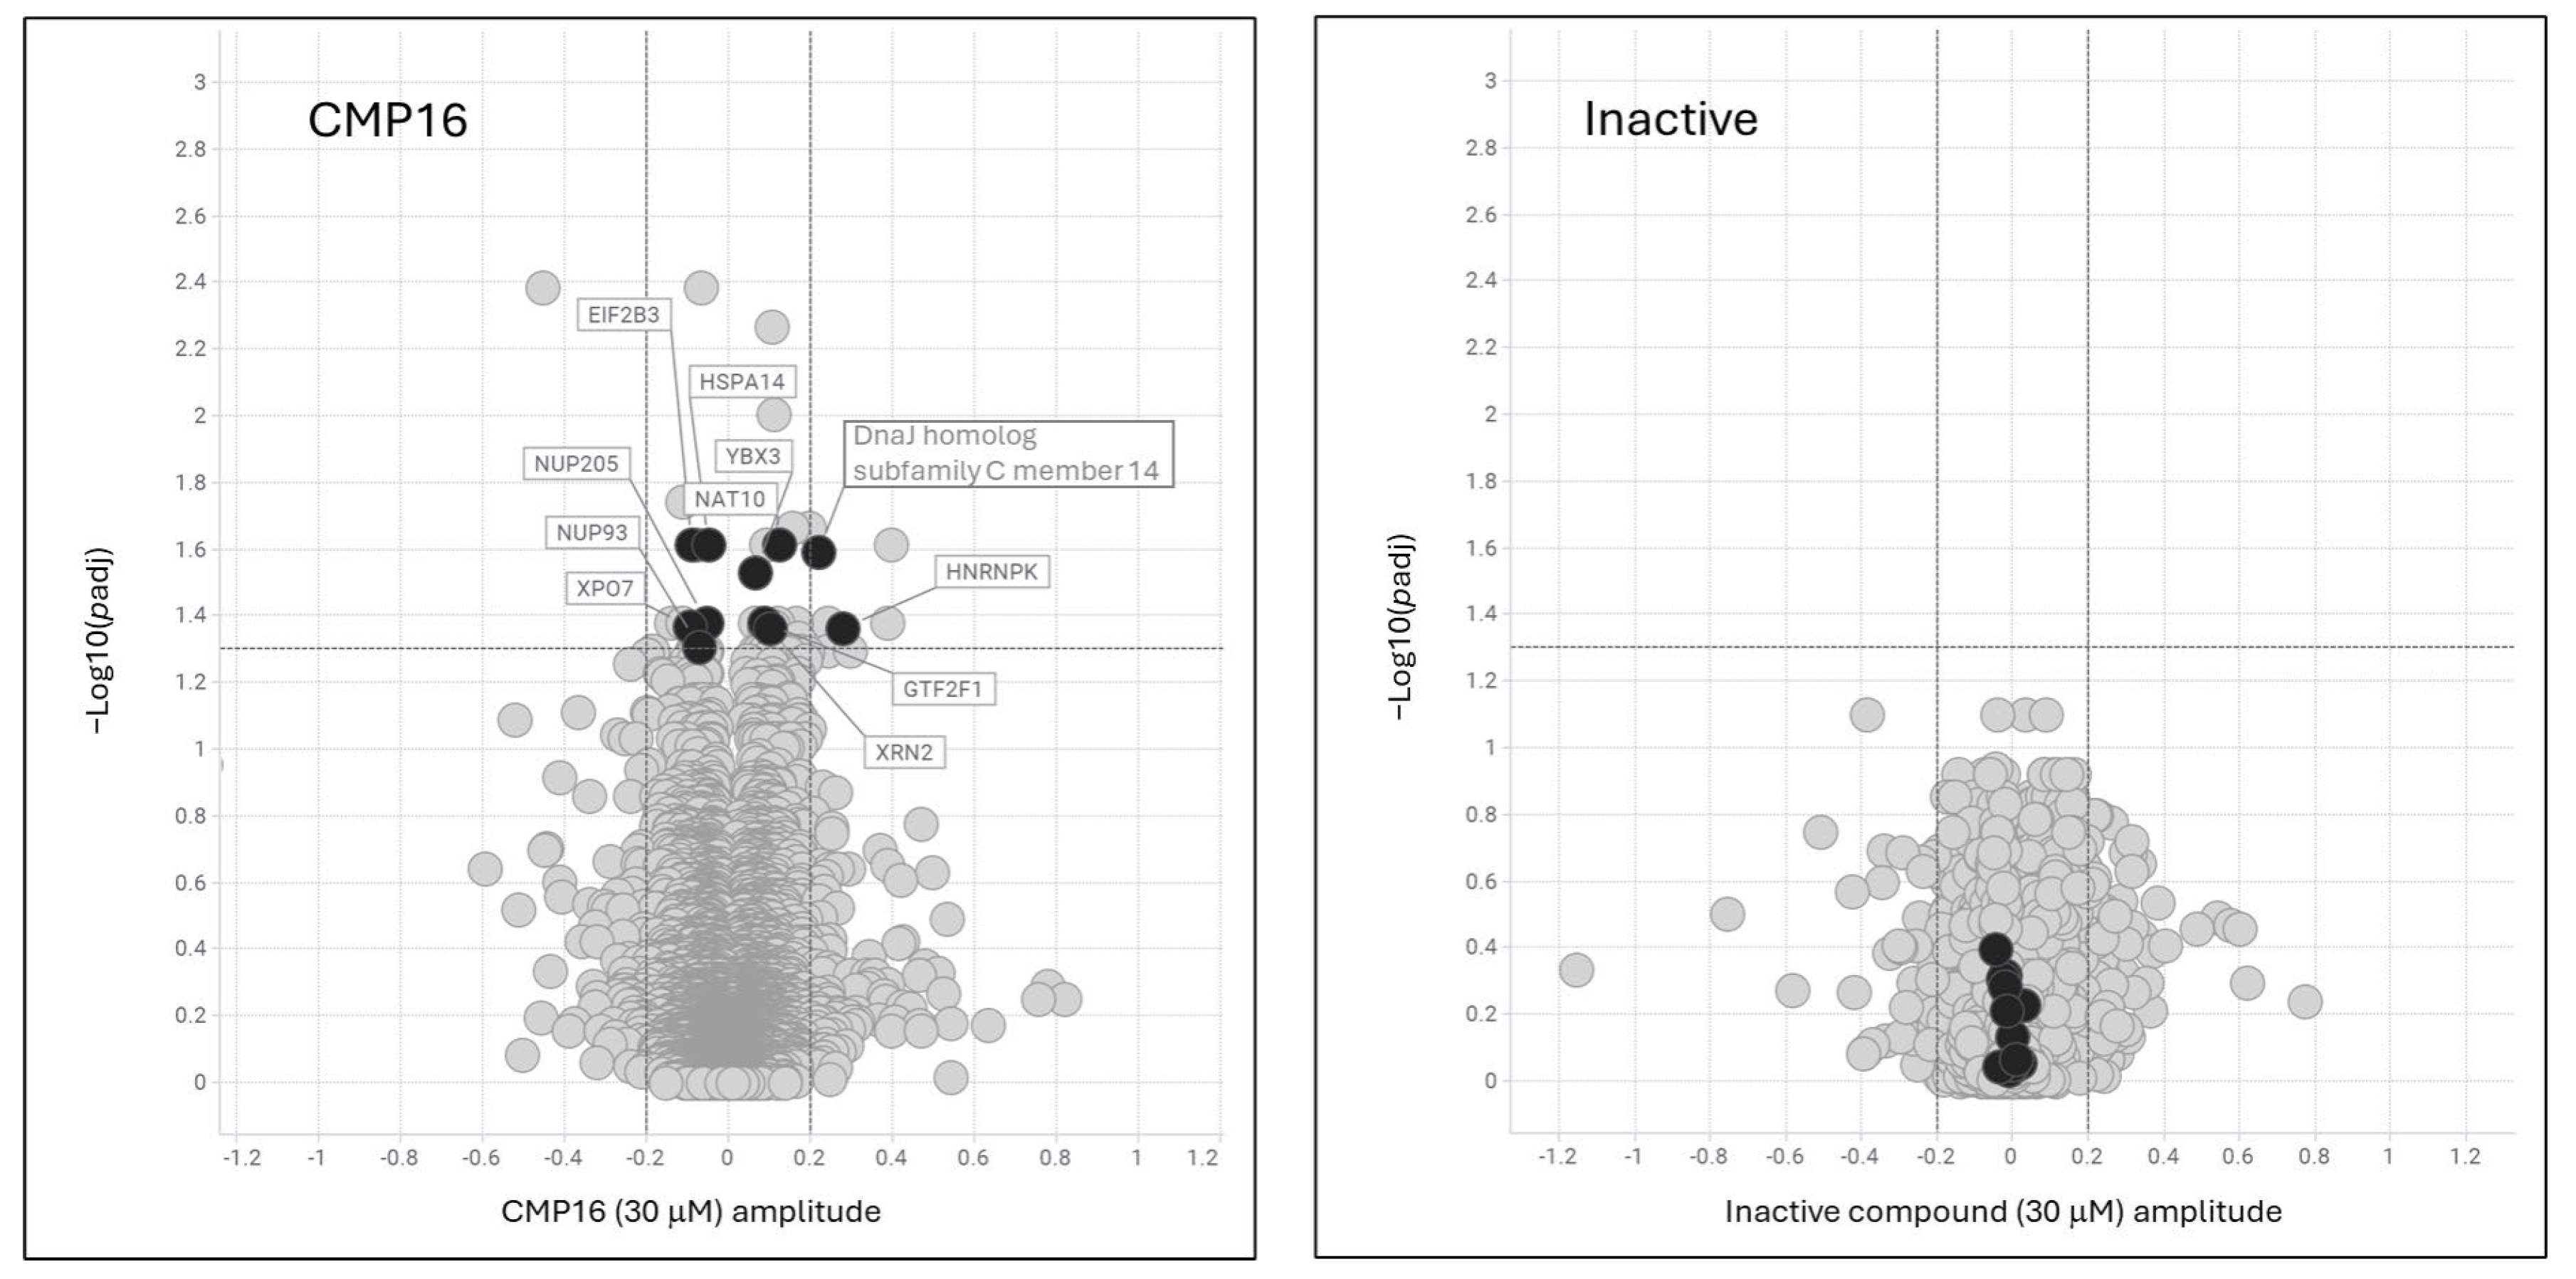
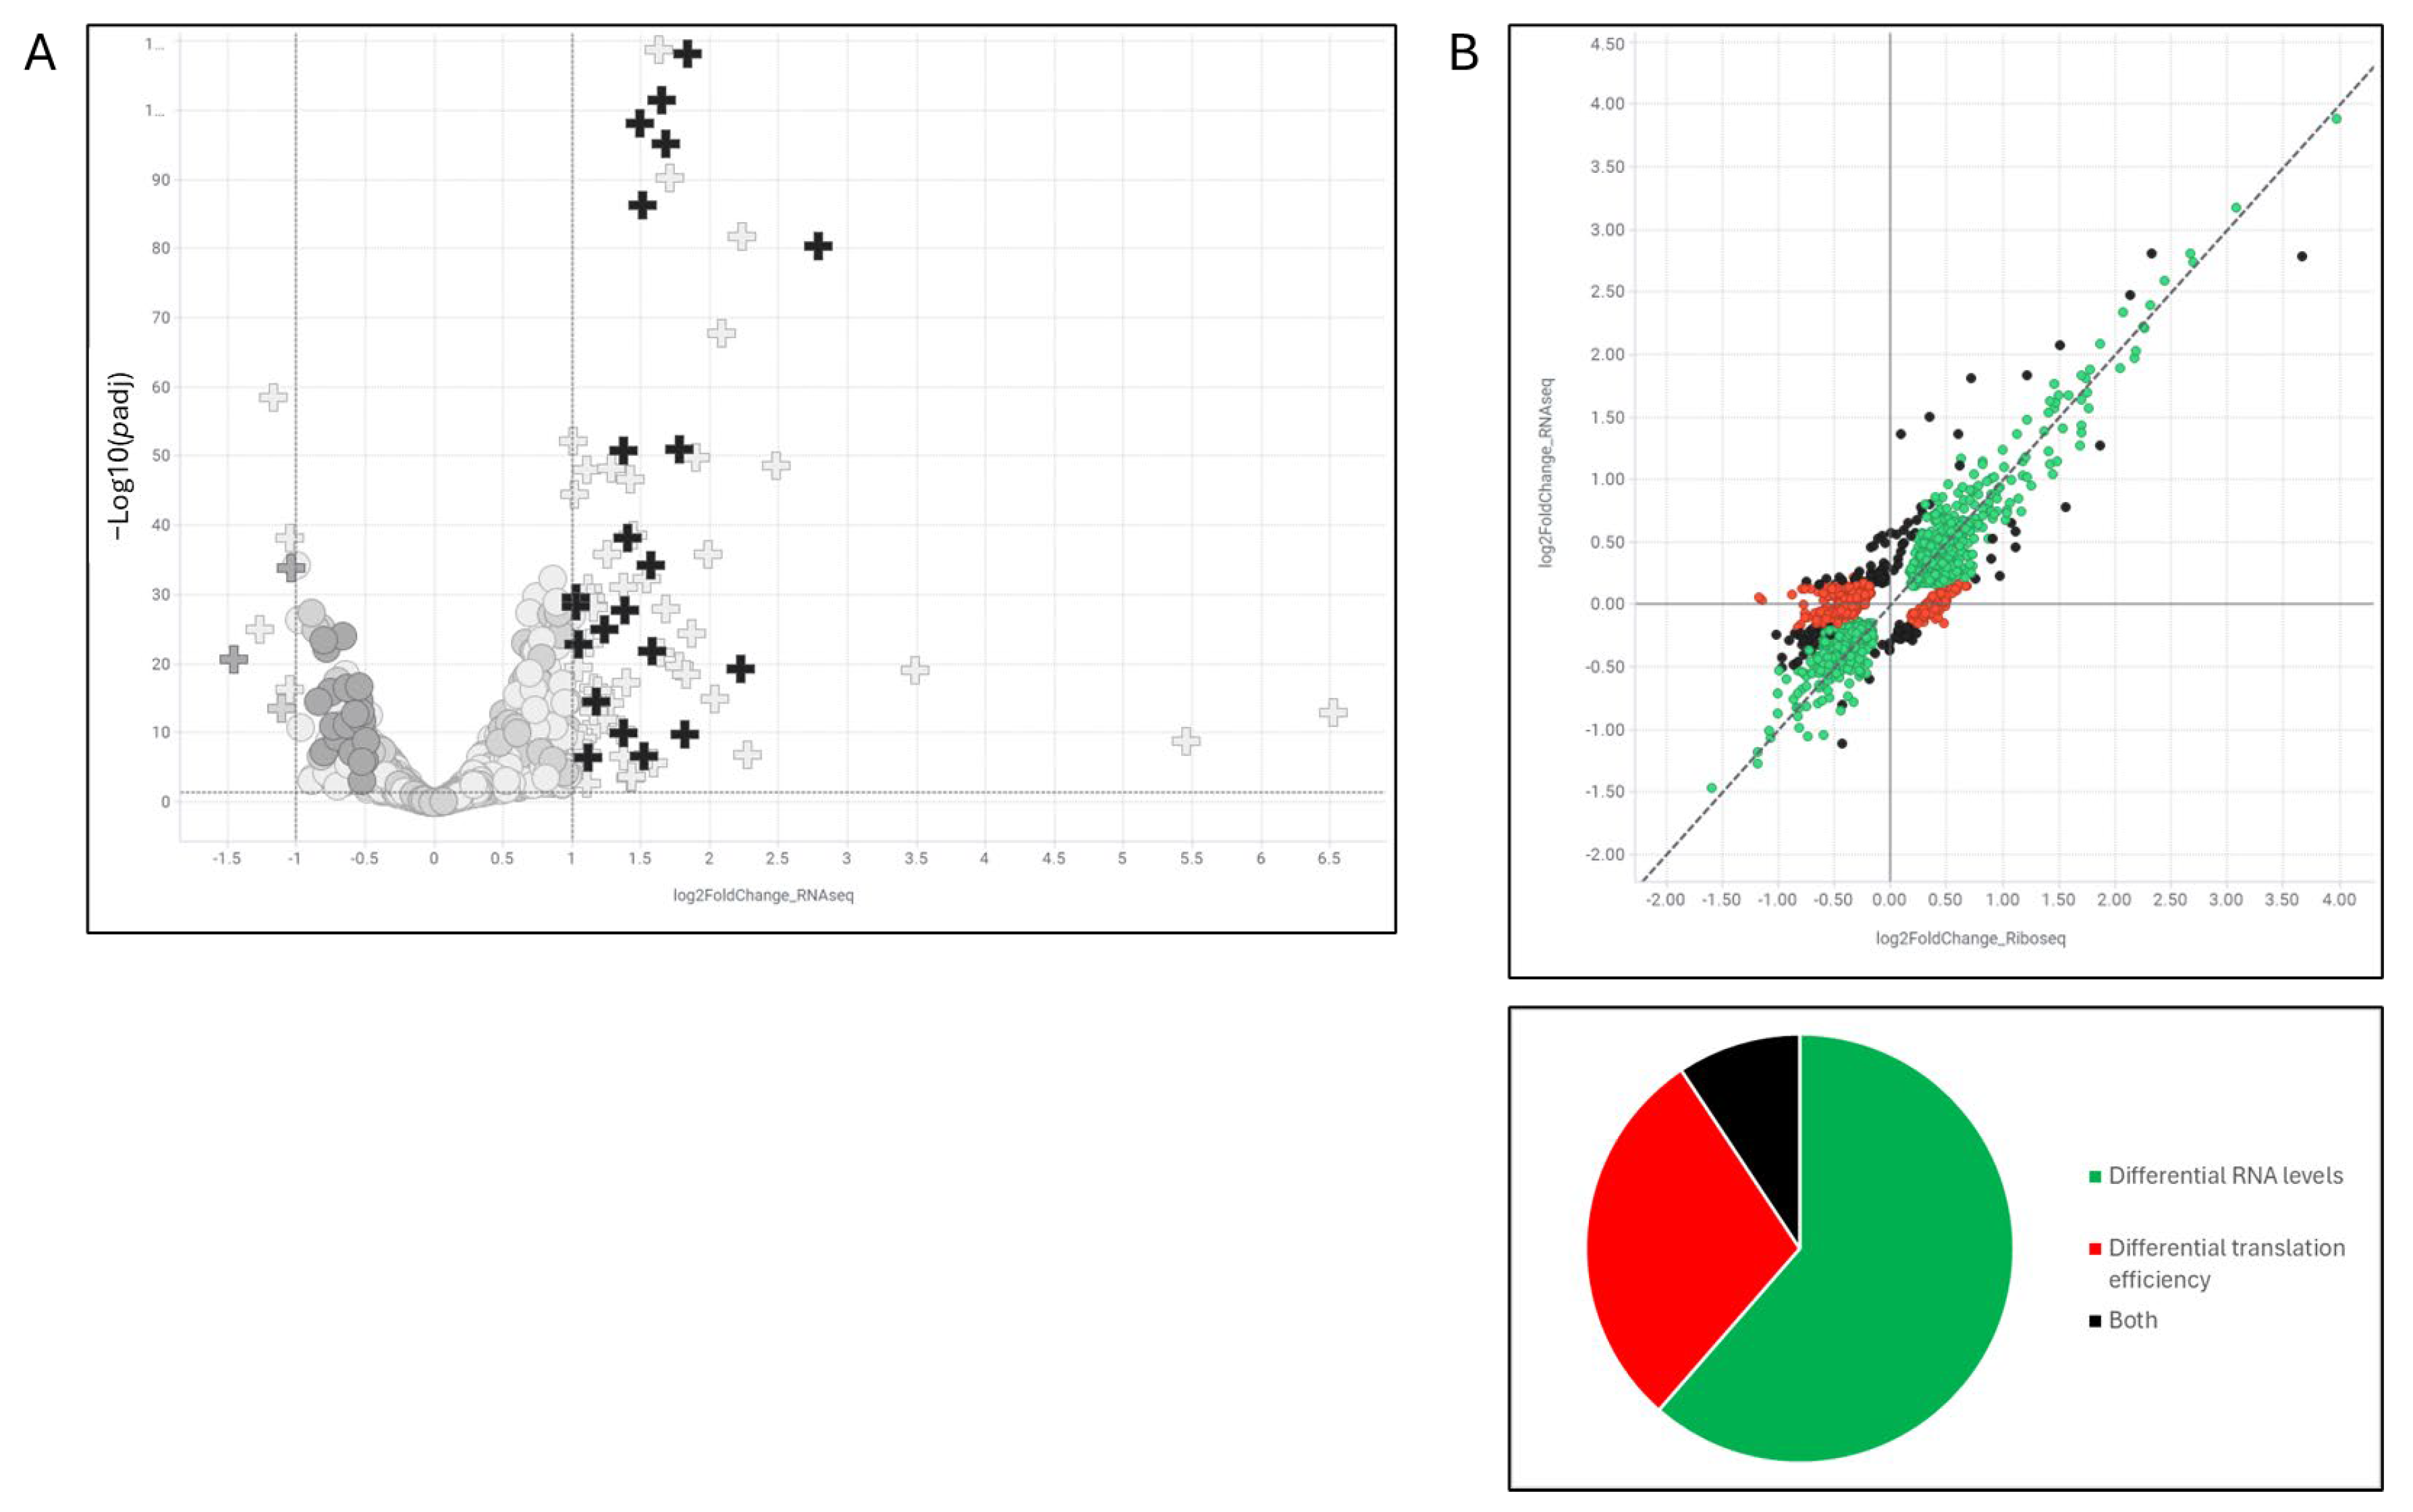
Mechanistically, the identification of hnRNPK as a principal compound target provides critical insight into the observed phenotypes. hnRNPK is a multifunctional RNA-binding protein that contributes to diverse aspects of RNA metabolism, including transcription, alternative splicing, mRNA export, and translation [
14,
22]. Upon compound treatment, hnRNPK translocates from the nucleus to the cytoplasm, a change that may be driven by altered post-translational modifications or disruption of RNA-binding protein complexes. Given that hnRNPK participates in large ribonucleoprotein complexes, it is likely that the compound disrupts these assemblies, selectively affecting the translation of specific mRNAs [
14,
23]. Interestingly, only a subset of hnRNPK-associated transcripts were stabilized by the compound, suggesting selective modulation of hnRNPK complexes based on RNA motif preferences or context-dependent complex composition. This selectivity may be shaped by specific post-translational modifications; for example, K63-linked ubiquitination of hnRNPK restricts
MYC translation, and loss of the E3 ligase Fbxo4 enhances
MYC expression by allowing unregulated hnRNPK activity [
15].
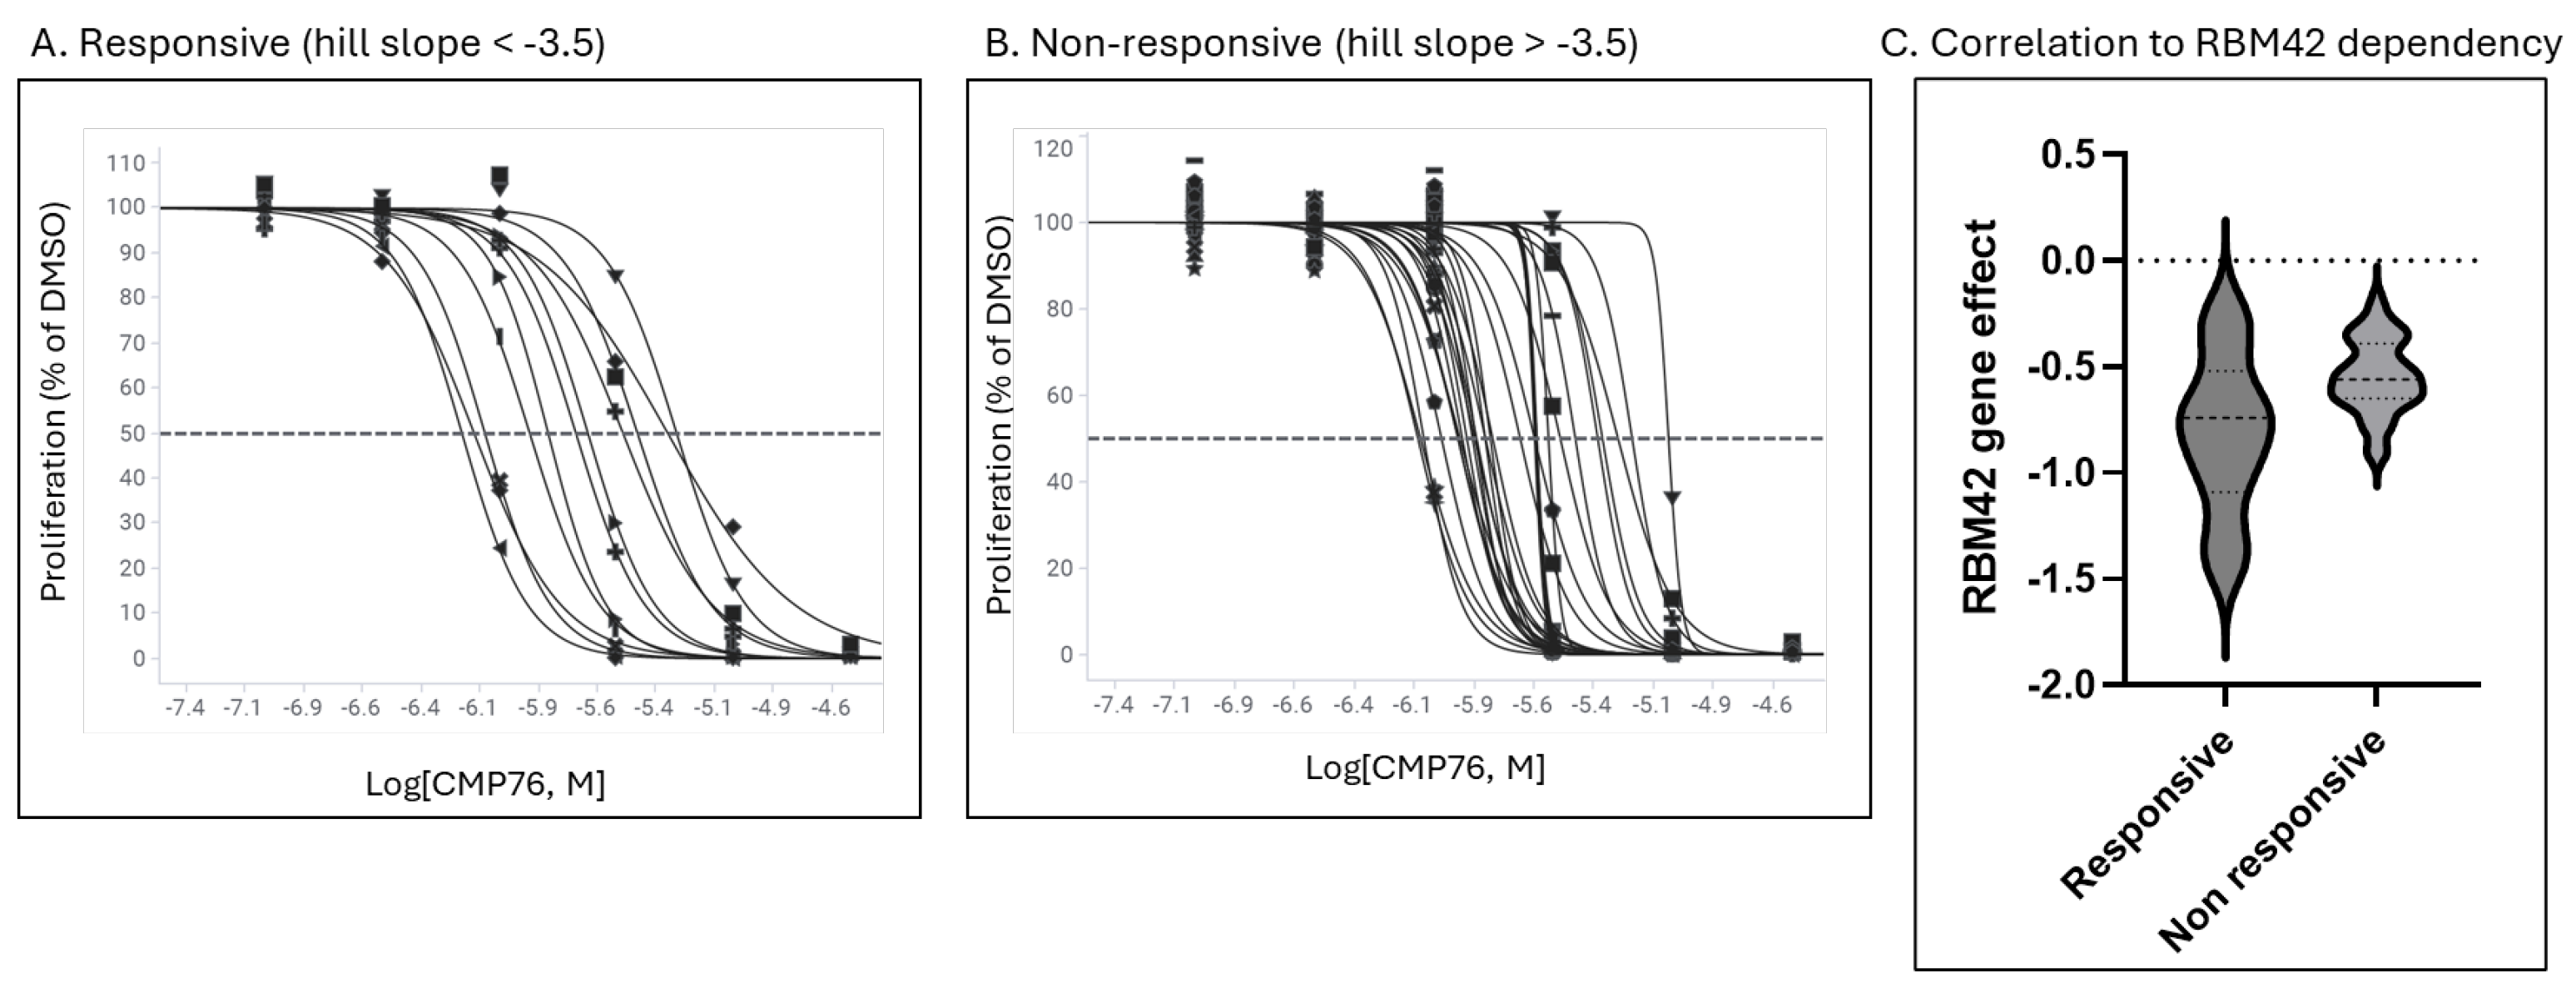
Compound sensitivity across cancer cell lines correlates with dependency on the RBP
RBM42, which has been shown to bind to the
MYC 5′ UTR and enhance its translation. The compound may interfere with this interaction, promoting
MYC mRNA sequestration into stress granules. Notably, hnRNPK is known to bind to RBM42 and modulate cellular metabolism [
16], further suggesting that disruption of hnRNPK–RBM42 interactions could underpin compound activity. Future work focused on dissecting the specific modifications or protein–protein interactions required to elicit this effect may yield biomarkers of compound responsiveness and support the development of more potent analogs.
Stress granules (SGs) are membraneless organelles that orchestrate RNA localization and translational control [
24]. Once
MYC mRNA is sequestered into SGs, translation is inhibited primarily through spatial exclusion of the mRNA from active translating ribosomes. Stress granules are enriched in stalled translation initiation complexes, RNA-binding proteins, and translational repressors, but lack the complete ribosomal machinery required for elongation [
24]. Within these condensates, mRNAs are physically separated from ribosomes and translation initiation factors, preventing ribosome loading and elongation. Although there is in depth understanding of the mechanism of SGs formation, the protein and mRNAs that constitute it, the exact functional role is unclear [
25]. hnRNPK relocalization to the cytoplasm may reinforce
MYC mRNA translation repression by stabilizing it in a translationally silent state—either through its interaction with
MYC 5′-UTR thereby competing with translation initiation factors or by modulating associated RBPs, such as RBM42. This compartmentalization effectively shifts
MYC transcripts from the actively translating pool into storage-prone state, silencing protein synthesis until granule disassembly.
Beyond MYC, these findings establish proof-of-concept for a broader therapeutic paradigm: targeting mRNA localization and translation via small molecules. The TranslationLight platform enables systematic identification of compounds that influence codon-specific translation, revealing mRNA-specific vulnerabilities that are not apparent through conventional transcriptomic or proteomic screening. This approach could be readily extended to other oncogenes with similarly complex post-transcriptional regulations.
To translate these findings toward clinical application, future work should evaluate compound activity in in vivo models and characterize potential toxicities. Combination strategies with existing therapies could enhance efficacy or expand indications, particularly in malignancies with known MYC dependencies. The high sensitivity observed in lymphoma cell lines suggests a potential early path for development in hematologic cancers, where post-transcriptional regulation of Myc is often critical for pathogenesis.
In conclusion, we have discovered and characterized a new class of small molecules that suppress Myc protein expression through the relocalization of its mRNA to stress granules. This work introduces RNA subcellular localization as a therapeutically tractable axis of gene regulation, with potential applications beyond MYC. The identification of hnRNPK as a primary target and the link between compound sensitivity and RBM42 dependency highlight opportunities for biomarker-driven patient selection.
4. Materials and Methods
Rabbit anti-Myc antibody (Abcam Limited, Cambridge, UK, ab32072); Rabbit anti-GAPDH antibody (Abcam Limited, Cambridge, UK, ab37168); Mouse anti-G3BP1 (Abcam Limited, Cambridge, UK, ab56574); Rabbit anti-DCP1A (Abcam Limited, Cambridge, UK, ab47811); Rabbit anti-FXR1 antibody (Abcam Limited, Cambridge, UK, ab129089); Mouse anti- N6-methyladenosine (m6A) antibody (Abcam Limited, Cambridge, UK, ab208577); Mouse anti-HNRNPK antibody (Abcam Limited, Cambridge, UK, ab70492); Mouse anti-puromycin antibody (Merck KGaA, Darmstadt, Germany, MABE343); Mouse anti-Tubulin beta1 antibody (Abcam Limited, Cambridge, UK, ab204947); Donkey Anti-Rabbit IgG H&L (Alexa Fluor® 647) (Abcam Limited, Cambridge, UK, ab150075); Donkey Anti-Mouse IgG H&L (Alexa Fluor® 488) (Abcam Limited, Cambridge, UK, ab150105).
A549 cells (ATCC®, Manassas, VA, USA, CCL-185™) were maintained in DMEM low glucose medium (IMBH, Beit Haemek, Israel, Cat. 01-050-1A), containing 10% fetal bovine serum, 1% L-glutamine, and 1% penicillin-streptomycin solution.
Cy3 and Cy5 Labeled tRNA [
26] were transfected with 0.4 µL HiPerFect (Qiagen, Hilden, Germany) per 384 well. First, HiPerFect was mixed with DMEM and incubated for 5 min; next, 6 nanograms Cy3- labeled tRNAgln and 6 ng Cy5-labled tRNAser were diluted in 1xPBS and then added to the HiPerFect:DMEM cocktail and incubated at room temperature for 10 min. The transfection mixture was dispersed automatically into 384-well black plates. Cells were then seeded at 3500 cells per well in complete culture medium and incubated at 37 °C, 5% CO2. Forty-eight hours after transfection compounds (100K ChemDiv diversity set, G-INCPM, Weizmann Institute, Rehovot, Israel) were added at a final concentration of 30 µM. Four hours post-treatment, cells were fixed with 4% paraformaldehyde and images were captured with Operetta microscope (Revvity, Waltham, MA, USA) using ×20 high NA objective lens. Quantitative Fluorescent Energy Transfer between two fluorophores, Cy3 and Cy5 in this article, requires correction (cFRET) due to bleedthrough between fluorescence channels [
27]. We have added the cFRET calculation during image upload process to the cloud, generating a fifth channel that is used for TL assessment algorithms.
The TranslationLight analysis platform extracts both direct and derived imaging features (10 features) that capture translation dynamics at the cellular level. One such feature, the Normalized cFRET, serves as a proxy for FRET efficiency, quantifying the proportion of energy transferred from donor to acceptor fluorophores. This efficiency measure is based on established FRET theory [
28] and provides a robust, normalized readout of translation activity. Integrating diverse readouts into a single hit score is nontrivial, as inter-feature dependencies can introduce bias. To address this, we employ a multi-dimensional statistical framework that assigns a
p-value to each compound based on its deviation from a reference cell population (H
0). This
p-value-based approach enables aggregation of multiple features into a single, unified significance score (namely aggregated
p-value) while appropriately accounting for inter-feature correlations [
10].
In parallel, we also calculate a Screen score, which quantifies the deviation of a compound’s feature profile from the reference population (H0) in units of standard deviations. This normalized score reflects the magnitude of perturbation, with larger absolute values indicating stronger divergence from the null distribution. While the aggregated p-value emphasizes statistical significance, the Screen score provides an interpretable effect size for compound activity across the multi-parametric readouts.
For visualization of Myc protein synthesis, cells were subjected to a puromycylation assay (SUnSET) adapted for immunofluorescence. Briefly, cells were seeded on in 384-well plates and treated with compounds or DMSO for 1 h, followed by addition of puromycin (final concentration 10 µg/mL) directly to the culture medium for 10 min at 37 °C to label nascent polypeptides. In negative control wells, puromycin was not added. After labeling, cells were rapidly rinsed with warm PBS, fixed with 4% paraformaldehyde in PBS for 10 min at room temperature, and permeabilized with 0.1% Triton X-100 in PBS for 10 min. Following blocking in Duolink® Blocking Solution for 60 min, cells were incubated with mouse anti-puromycin antibody (e.g., clone 12D10, 1:1000 in blocking buffer) and rabbit anti-Myc antibody (1:1000) for 1.5 h at room temperature, then washed three times in PBS. Proximity ligation was performed with anti-rabbit and anti-mouse Duolink® antibodies, according to the manufacturer protocol (Merck KGaA, Darmstadt, Germany). Nuclei were counterstained with DAPI, and cytoplasm with a mouse anti-tubulin beta 1 antibody which was visualized with a secondary Goat-anti-mouse Alexa Fluor 647. Images were acquired using identical exposure settings across conditions.
A549 cells were grown in 384-well plates (Cat. 6057300, Revvity, Waltham, MA, USA) for 48 h, treated with compounds for the indicated time and then fixed for 20 min in 4% paraformaldehyde. Permeabilization was performed using 0.1% Triton X-100 in 4%FBS and PBS for 5 min. Primary antibody staining was performed for 90 min at room temperature or overnight. Cells were then washed twice with PBS and incubated with a secondary antibody for 90 min at room temperature. Nuclei were stained with DAPI for 10 min and washed twice with PBS. Cell images were taken with Operetta (Revvity, Waltham, MA, USA), a wide-field fluorescence microscope at 20x magnification. After acquisition, the images were transferred to AWS cloud and Columbus software (Revitty, Waltham, MA, USA) for image analysis. In Columbus, cells were identified by their nucleus, using the “Find Nuceli” module and cytoplasm was detected using the digital phase channel. Subsequently, the fluorescent signal was enumerated in the identified cytoplasmic, granules, or nuclei region. Then, data were exported to a data analysis and visualization software (Tibco Spotfire® Analyst, v.12.0.3, USA).
A549 cells were grown in 384-well plates (Cat. 6057300, Revvity, Waltham, MA, USA) for 48 h, treated with compounds for 4 h and then fixed for 20 min in 4% paraformaldehyde. Next day, permeabilization was performed for 90 min at 4 °C, using 70% ethanol. Then, the cells were incubated for 10 min with 10% formamide in 10% saline–sodium citrate. Fluorescently labeled custom DNA probes that target MYC (Cy3, BioSearch Technologies, Petaluma, CA, USA, Cat. SMF-1063-5) and GAPDH (Cy5, BioSearch Technologies, Petaluma, CA, USA, Cat. SMF-2019-1) mRNAs were hybridized overnight at 37 °C in a dark chamber in 10% formamide. The next day, cells were washed twice with 10% formamide for 30 min. Next, nuclei were counterstained with DAPI (Merck KGaA, Darmstadt, Germany, Cat. 5MG-D9542) and then cells were washed twice with PBS. FISH experiments were performed according to the probes manufacturer’s protocol for adherent cells. Following RNA FISH experiments, images of cells were taken with Operetta (Revvity, Waltham, MA, USA), a wide-field fluorescence microscope at x63 magnification. After acquisition, the images were transferred to AWS cloud and Columbus software for image analysis. In Columbus, cells were identified by their nucleus, using the “Find Nuceli” module, cytoplasm was detected based on the FISH channel or digital phase, and single mRNAs in the cytoplasm and transcription sites in the nucleus were detected using “Find Spots” module. Subsequently, fluorescent signals were collected for each channel in the identified regions: nucleus, cytoplasm, and spots. Data were exported to a data analysis and visualization software (Tibco Spotfire® Analyst, v.12.0.3, USA).
High-throughput image acquisition was conducted using the Operetta® CLS™ microplate imaging system (Revvity, Waltham, MA, USA). Image analysis was carried out with the Columbus™ Image Data Storage and Analysis platform (Revvity, Waltham, MA, USA), which facilitates cell segmentation and the extraction of cytological features—such as nuclear and cytoplasmic morphology—as well as quantification of intensity across defined regions of interest (e.g., whole cell, cytoplasm, perinuclear region, spots, nucleus). The resulting single-cell data were further processed through our proprietary analytical pipelines, which include machine learning and artificial intelligence (AI) approaches—some of which operate directly on the raw image data without reliance on Columbus preprocessing—as well as TranslationLight-specific statistical frameworks. The analysis pipeline is designed for large-scale parallelization in a cloud environment, enabling the execution of hundreds of instances simultaneously and supporting rapid turnaround for entire screening campaigns. The data are extracted and exported into a visualization software, Spotfire (Tibco Spotfire® Analyst, v.12.0.3, USA).
Comparison circles were used to visualize statistical differences between group means in data derived from cell-level data in imaging experiments. Each circle is centered on the group mean, with a radius determined by the Tukey–Kramer method to reflect standard error and multiple comparison adjustments. Non-overlapping circles indicate statistically significant differences between means, while overlapping circles suggest non-significant differences [
29].
A549 human lung carcinoma cells were seeded in 6 cm tissue culture dishes (400 × 103 cells per dish) in growth medium consisting of low glucose DMEM supplemented with 10% fetal bovine serum (FBS). After 48 h of incubation (approximately 70% confluence), cells were treated with compound (10 µM) or DMSO (0.1%, vehicle control) for 1 h in triplicates.
Following treatment, cells were washed twice using 1× PBS (AM9625, Thermo Fisher Scientific, Waltham, MA, USA), at room temperature. The PBS was aspirated thoroughly, and cells were scraped in 350 μL RLT buffer (79216 Qiagen), supplemented with 1% β-Mercaptoethanol (M3148 Merck KGaA, Darmstadt, Germany). The resulting cell pellet was collected into 1.5 mL tube, flash frozen with liquid nitrogen, stored at −80 °C, and shipped on dry ice. Libraries for MACEseq were prepared by GenexPro using the MACE Kit (GenXPro GmbH, Frankfurt, Germany). Briefly, the library preparation starts with extraction of total RNA, followed by polyadenylated mRNA enrichment using the Dynabeads mRNA Purification Kit (Life Technologies, Waltham, MA, USA). cDNA is prepared via reverse transcription with biotinylated oligo (dT) primers and then fragmented to an average size of 250 bp by sonication with a Bioruptor (Diagenode, Seraing, Belgium). Streptavidin beads were used to capture the biotinylated cDNA 3′ ends, which were subsequently tagged with TrueQuant DNA adapters (Waltham, MA, USA). The libraries are then PCR amplified, purified using SPRI beads (Agencourt AMPure XP; Beckman Coulter, Brea, CA, USA), and sequenced on a NextSeq 500 (Illumina Inc., San Diego, CA, USA). Bioinformatic analysis was performed by using GenXPro’s proprietary differential expression and alternative polyadenylation (APA) analysis pipeline.
To identify the RBPs which bind differentially upregulated mRNAs (DE), we downloaded eCLIP binding data, 5 January 2025 [
12]; this dataset includes binding sites for 168 RBPs in two cell lines (accession numbers and files listed in
Supplementary Table S1). For each DE gene, we found the RBPs bound to it (based on GENCODE annotation v.44) [
30], and classified each binding site as 5′UTR, CDS, 3′UTR, or intron; 115 RBPs overall were identified this way. We then classified each of the 115 RBPs, using GO:BP (gene ontology: biological process) terms [
31,
32], into one or more of the following categories: involved in splicing; involved in P-bodies assembly; and involved in assembly or disassembly of stress granules. The GO terms used for this categorization appear in
Supplementary Table S2. Categorization of RBPs belonging to stress granules or P-bodies was performed using ChatGPT v.4.0 [
33] and verified by us for the RBPs identified herein.
A549 human lung carcinoma cells were cultured in T-175 tissue culture flasks under standard conditions (37 °C, 5% CO
2) until reaching approximately 80–90% confluency, yielding a total of 8 × 10
7 cells. Cells were detached using 0.25% Trypsin-EDTA (Thermo Fisher Scientific, Waltham, MA, USA, Cat. No. 25200-072) and collected by centrifugation at 500×
g for 5 min at room temperature. The cell pellet was washed once with Hanks′ Balanced Salt Solution (HBSS) (Merck KGaA, Darmstadt, Germany, Cat. No. 55037C), followed by a second centrifugation at 500×
g for 5 min. The final cell pellets were immediately shipped on dry ice to Pelago Bioscience AB (Solna, Sweden) for CETSA
® analysis under standardized assay conditions. CETSA analysis was performed according to the general CETSA
® protocol [
34] with detection by the liquid chromatography–mass spectrometry (LC-MS) method and with implementation of a seven concentration CETSA
® MS profiling strategy in the compressed format. The study included protein stability assessment in cells treated for 15 min at 25 °C with the compounds at seven different concentrations (0.1 µM, 0.3 µM, 1 µM, 3 µM, 10 µM, 30 µM, and 100 µM) relative to non-treated control (0.1% DMSO). Treated cells were aliquoted and subjected to a heat challenge at 12 different temperatures (44–66 °C), after which individual samples from all temperature points were pooled for each test condition. Aggregated proteins were removed using centrifugation and soluble protein amounts were measured using LC-MS. The individual protein concentration response curves were analyzed and molecular targets were identified when response to the compound was observed. Further, unheated samples treated with compounds at highest concentration (100 μM) as well as vehicle control (DMSO) were analyzed to further differentiate compound-induced protein thermal stability and protein abundance alterations. The experiment was performed for each compound in two replicates.
A549 human lung carcinoma cells were seeded in 15 cm tissue culture dishes (3 × 10⁶ cells per 15 cm dish) in growth medium consisting of low glucose DMEM supplemented with 10% fetal bovine serum (FBS). For each experimental condition, three plates were pooled to constitute a single biological replicate, with experiments performed in triplicate. After 48 h of incubation (approximately 70% confluence), cells were treated with compound (10 µM) or DMSO (0.1%, vehicle control) for 6 h.
Following treatment, cells were rapidly washed and scraped on ice using 1× PBS (AM9625, Thermo Fisher Scientific, Waltham, MA, USA) supplemented with cycloheximide (100 µg/mL, C4859 Sigma-Aldrich) and collected into 15 mL conical tubes. Ten percent of each pooled lysate was transferred to a separate microcentrifuge tube for subsequent RNA-seq analysis. The remaining lysate was centrifuged at 200× g for 5 min at 4 °C. Supernatants were carefully removed, and cell pellets were flash-frozen in liquid nitrogen, stored at −80 °C, and shipped on dry ice to EIRNA BIO (Cork, Ireland).
EIRNA BIO performed quality control, total RNA extraction, ribosome-protected fragment isolation, and library preparation using proprietary protocols. Libraries that passed internal quality control, including evaluation of triplet periodicity, were sequenced on the Illumina Hi Seq X platform. Downstream bioinformatic analysis included raw read processing, transcriptome alignment, and differential assessment of translational efficiency between experimental conditions. For data normalization, read counts were normalized to account for differences in sequencing depth across samples, using the DESeq2 package. The reads were mapped to the human transcriptome (Gencode version 35). Differential gene expression analysis was performed using deltaTE [
35], which analyzes differential changes in mRNA counts, ribosome-protected fragments (RPFs), and translational efficiency (TE)—the ratio of RPFs to mRNA counts—for each gene, also employing the DESeq2 package, v.1.34.
Cancer cell line panel proliferation assay was conducted by Eurofins Discovery (OncoPanel™ Cell-Based Profiling) (St. Charles, MO, USA). Cells were seeded into 384-well plates at their respective, established cell density in standardized media. At the same time, a time zero non-treated plate is generated. Twenty-four (24) hours later, compound was added, and the time zero plate was developed, for doubling calculations, by cell lysis with cell viability detection reagent (Promega CellTiter-Glo®, Promega Corporation, Madison, WI, USA). Test agent plates are incubated continuously for 3 days. Cells were then lysed with cell viability detection reagent (Promega CellTiter-Glo®, Promega Corporation, Madison, WI, USA).
Compounds were diluted in DMSO at starting at 30 μM and then serially diluted in DMSO by 3.16-fold to complete the 10-point concentration curves. Compounds were added directly from these dilutions to cell plates using Echo 555 acoustic energy-based transfer.
CMP76 responsive and non-responsive cells were grouped based on their potency and hill slope (responsive, EC50 < 6 μM and hill slope between −1 and −3.5). Statistical analysis was conducted using Welch’s T-test (Graphpad, v. 10 Software).

