
Real-Time PCR-Based Detection of Hepatitis E Virus in Groundwater: Primer Performance and Method Validation


Abstract
1. Introduction
2. Results
3. Discussion
4. Materials and Methods
5. Conclusions
Supplementary Materials
Author Contributions
Funding
Institutional Review Board Statement
Informed Consent Statement
Data Availability Statement
Conflicts of Interest
References
- Wang, B.; Meng, X.J. Structural and molecular biology of hepatitis E virus. Comput. Struct. Biotechnol. J. 2021, 19, 1907–1916. [Google Scholar] [CrossRef]
- Aggarwal, R.; Goel, A. Hepatitis E: Current Status in India. Clin. Liver Dis. 2021, 18, 168–172. [Google Scholar] [CrossRef] [PubMed]
- Khuroo, M.S.; Khuroo, M.S.; Khuroo, N.S. Transmission of Hepatitis E Virus in Developing Countries. Viruses 2016, 8, 253. [Google Scholar] [CrossRef] [PubMed]
- Takuissu, G.R.; Kenmoe, S.; Ndip, L.; Ebogo-Belobo, J.T.; Kengne-Nde, C.; Mbaga, D.S.; Bowo-Ngandji, A.; Oyono, M.G.; Kenfack-Momo, R.; Tchatchouang, S.; et al. Hepatitis E Virus in Water Environments: A Systematic Review and Meta-analysis. Food Environ. Virol. 2022, 14, 223–235. [Google Scholar] [CrossRef] [PubMed]
- Van der Poel, W.H. Food and environmental routes of Hepatitis E virus transmission. Curr. Opin. Virol. 2014, 4, 91–96. [Google Scholar] [CrossRef]
- Barnaud, E.; Rogee, S.; Garry, P.; Rose, N.; Pavio, N. Thermal inactivation of infectious hepatitis E virus in experimentally contaminated food. Appl. Environ. Microbiol. 2012, 78, 5153–5159. [Google Scholar] [CrossRef]
- Denner, J. Hepatitis E virus (HEV)-The Future. Viruses 2019, 11, 251. [Google Scholar] [CrossRef]
- Itarte, M.; Fores, E.; Martinez-Puchol, S.; Scheiber, L.; Vazquez-Sune, E.; Bofill-Mas, S.; Rusinol, M. Exploring viral contamination in urban groundwater and runoff. Sci. Total Environ. 2024, 946, 174238. [Google Scholar] [CrossRef]
- Wu, X.; Chen, P.; Lin, H.; Hao, X.; Liang, Z. Hepatitis E virus: Current epidemiology and vaccine. Hum. Vaccines Immunother. 2016, 12, 2603–2610. [Google Scholar] [CrossRef]
- Peron, J.M.; Larrue, H.; Izopet, J.; Buti, M. The pressing need for a global HEV vaccine. J. Hepatol. 2023, 79, 876–880. [Google Scholar] [CrossRef]
- Baez, P.A.; Lopez, M.C.; Duque-Jaramillo, A.; Pelaez, D.; Molina, F.; Navas, M.C. First evidence of the Hepatitis E virus in environmental waters in Colombia. PLoS ONE 2017, 12, e0177525. [Google Scholar] [CrossRef]
- Abbaszadegan, M.; Stewart, P.; LeChevallier, M. A strategy for detection of viruses in groundwater by PCR. Appl. Environ. Microbiol. 1999, 65, 444–449. [Google Scholar] [CrossRef]
- La Rosa, G.; Fratini, M.; Muscillo, M.; Iaconelli, M.; Taffon, S.; Equestre, M.; Chionne, P.; Madonna, E.; Pisani, G.; Bruni, R.; et al. Molecular characterisation of human hepatitis E virus from Italy: Comparative analysis of five reverse transcription-PCR assays. Virol. J. 2014, 11, 72. [Google Scholar] [CrossRef]
- Martinez Wassaf, M.G.; Pisano, M.B.; Barril, P.A.; Elbarcha, O.C.; Pinto, M.A.; Mendes de Oliveira, J.; DiGiusto, P.; Nates, S.V.; Re, V.E. First detection of hepatitis E virus in Central Argentina: Environmental and serological survey. J. Clin. Virol. 2014, 61, 334–339. [Google Scholar] [CrossRef] [PubMed]
- Gao, S.; Li, D.; Liu, Y.; Zha, E.; Wang, S.; Li, Y.; Zhou, T.; Yue, X. Development and evaluation of a RT-LAMP assay for rapid detection of hepatitis E virus from shellfish. Int. J. Food Microbiol. 2016, 220, 1–5. [Google Scholar] [CrossRef]
- Nemes, K.; Persson, S.; Simonsson, M. Hepatitis A Virus and Hepatitis E Virus as Food- and Waterborne Pathogens-Transmission Routes and Methods for Detection in Food. Viruses 2023, 15, 1725. [Google Scholar] [CrossRef] [PubMed]
- Bahrulolum, H.; Tarrahimofrad, H.; Rouzbahani, F.N.; Nooraei, S.; Sameh, M.M.; Hajizade, A.; Ahmadian, G. Potential of CRISPR/Cas system as emerging tools in the detection of viral hepatitis infection. Virol. J. 2023, 20, 91. [Google Scholar] [CrossRef] [PubMed]
- Peters, J.M.; Silvis, M.R.; Zhao, D.; Hawkins, J.S.; Gross, C.A.; Qi, L.S. Bacterial CRISPR: Accomplishments and prospects. Curr. Opin. Microbiol. 2015, 27, 121–126. [Google Scholar] [CrossRef]
- Schuler, F.; Trotter, M.; Geltman, M.; Schwemmer, F.; Wadle, S.; Dominguez-Garrido, E.; Lopez, M.; Cervera-Acedo, C.; Santibanez, P.; von Stetten, F.; et al. Digital droplet PCR on disk. Lab. Chip 2016, 16, 208–216. [Google Scholar] [CrossRef]
- Gao, X.; Sun, B.; Guan, Y. Pullulan reduces the non-specific amplification of loop-mediated isothermal amplification (LAMP). Anal. Bioanal. Chem. 2019, 411, 1211–1218. [Google Scholar] [CrossRef]
- Al-Sadeq, D.W.; Majdalawieh, A.F.; Mesleh, A.G.; Abdalla, O.M.; Nasrallah, G.K. Laboratory challenges in the diagnosis of hepatitis E virus. J. Med. Microbiol. 2018, 67, 466–480. [Google Scholar] [CrossRef]
- Shain, E.B.; Clemens, J.M. A new method for robust quantitative and qualitative analysis of real-time PCR. Nucleic Acids Res. 2008, 36, e91. [Google Scholar] [CrossRef]
- Atoui, A.; Cordevant, C.; Chesnot, T.; Gassilloud, B. SARS-CoV-2 in the environment: Contamination routes, detection methods, persistence and removal in wastewater treatment plants. Sci. Total Environ. 2023, 881, 163453. [Google Scholar] [CrossRef]
- Takeuchi, K.; Yanagisawa, H.; Kurosawa, Y.; Iida, Y.; Kawai, K.; Fujimaki, S. Degradation of SARS-CoV-2 specific ribonucleic acid in samples for nucleic acid amplification detection. PLoS One 2022, 17, e0264541. [Google Scholar] [CrossRef]
- Petterson, S.; Grondahl-Rosado, R.; Nilsen, V.; Myrmel, M.; Robertson, L.J. Variability in the recovery of a virus concentration procedure in water: Implications for QMRA. Water Res. 2015, 87, 79–86. [Google Scholar] [CrossRef]
- Rodriguez-Lazaro, D.; Cook, N.; Ruggeri, F.M.; Sellwood, J.; Nasser, A.; Nascimento, M.S.; D’Agostino, M.; Santos, R.; Saiz, J.C.; Rzezutka, A.; et al. Virus hazards from food, water and other contaminated environments. FEMS Microbiol. Rev. 2012, 36, 786–814. [Google Scholar] [CrossRef]
- Yoon, Y.; Jeong, H.S.; Yun, H.; Lee, H.; Hwang, Y.S.; Park, B.; Lee, C.J.; Lee, S.; Hyeon, J.Y. Hepatitis E Virus (HEV) seroprevalence in the general population of the Republic of Korea in 2007-2009: A nationwide cross-sectional study. BMC Infect. Dis. 2014, 14, 517. [Google Scholar] [CrossRef] [PubMed]
- Choi, I.S.; Kwon, H.J.; Shin, N.R.; Yoo, H.S. Identification of swine hepatitis E virus (HEV) and prevalence of anti-HEV antibodies in swine and human populations in Korea. J. Clin. Microbiol. 2003, 41, 3602–3608. [Google Scholar] [CrossRef] [PubMed]
- Kim, S.E.; Kim, M.Y.; Kim, D.G.; Song, Y.J.; Jeong, H.J.; Lee, S.W.; Lee, J.B.; Park, S.Y.; Song, C.S.; Oh, S.J.; et al. Determination of fecal shedding rates and genotypes of swine hepatitis E virus (HEV) in Korea. J. Vet. Med. Sci. 2008, 70, 1367–1371. [Google Scholar] [CrossRef] [PubMed]
- Soroka, M.; Wasowicz, B.; Rymaszewska, A. Loop-Mediated Isothermal Amplification (LAMP): The Better Sibling of PCR? Cells 2021, 10, 1931. [Google Scholar] [CrossRef]
- Walker, F.M.; Hsieh, K. Advances in Directly Amplifying Nucleic Acids from Complex Samples. Biosensors 2019, 9, 117. [Google Scholar] [CrossRef]
- Mansuy, J.M.; Peron, J.M.; Abravanel, F.; Poirson, H.; Dubois, M.; Miedouge, M.; Vischi, F.; Alric, L.; Vinel, J.P.; Izopet, J. Hepatitis E in the south west of France in individuals who have never visited an endemic area. J. Med. Virol. 2004, 74, 419–424. [Google Scholar] [CrossRef]
- Adlhoch, C.; Wolf, A.; Meisel, H.; Kaiser, M.; Ellerbrok, H.; Pauli, G. High HEV presence in four different wild boar populations in East and West Germany. Vet. Microbiol. 2009, 139, 270–278. [Google Scholar] [CrossRef]
- Jothikumar, N.; Cromeans, T.L.; Robertson, B.H.; Meng, X.J.; Hill, V.R. A broadly reactive one-step real-time RT-PCR assay for rapid and sensitive detection of hepatitis E virus. J. Virol. Methods 2006, 131, 65–71. [Google Scholar] [CrossRef] [PubMed]
- Colson, P.; Coze, C.; Gallian, P.; Henry, M.; De Micco, P.; Tamalet, C. Transfusion-associated hepatitis E, France. Emerg. Infect. Dis. 2007, 13, 648–649. [Google Scholar] [CrossRef] [PubMed]
- Zhao, C.; Li, Z.; Yan, B.; Harrison, T.J.; Guo, X.; Zhang, F.; Yin, J.; Yan, Y.; Wang, Y. Comparison of real-time fluorescent RT-PCR and conventional RT-PCR for the detection of hepatitis E virus genotypes prevalent in China. J. Med. Virol. 2007, 79, 1966–1973. [Google Scholar] [CrossRef] [PubMed]
- Matsubayashi, K.; Kang, J.H.; Sakata, H.; Takahashi, K.; Shindo, M.; Kato, M.; Sato, S.; Kato, T.; Nishimori, H.; Tsuji, K.; et al. A case of transfusion-transmitted hepatitis E caused by blood from a donor infected with hepatitis E virus via zoonotic food-borne route. Transfusion 2008, 48, 1368–1375. [Google Scholar] [CrossRef]
- Rolfe, K.J.; Curran, M.D.; Mangrolia, N.; Gelson, W.; Alexander, G.J.; L’Estrange, M.; Vivek, R.; Tedder, R.; Ijaz, S. First case of genotype 4 human hepatitis E virus infection acquired in India. J. Clin. Virol. 2010, 48, 58–61. [Google Scholar] [CrossRef]
- KMFDS. Manual for Testing Methods of Hepatitisvirus E in Meat and Food-Grade Water; Ministry of Food and Drug Safety: Cheongju-si, Republic of Korea, 2012.
- Pas, S.D.; de Man, R.A.; Mulders, C.; Balk, A.H.; van Hal, P.T.; Weimar, W.; Koopmans, M.P.; Osterhaus, A.D.; van der Eijk, A.A. Hepatitis E virus infection among solid organ transplant recipients, the Netherlands. Emerg. Infect. Dis. 2012, 18, 869–872. [Google Scholar] [CrossRef]
- Martin-Latil, S.; Hennechart-Collette, C.; Guillier, L.; Perelle, S. Duplex RT-qPCR for the detection of hepatitis E virus in water, using a process control. Int. J. Food Microbiol. 2012, 157, 167–173. [Google Scholar] [CrossRef]
- Martin-Latil, S.; Hennechart-Collette, C.; Delannoy, S.; Guillier, L.; Fach, P.; Perelle, S. Quantification of Hepatitis E Virus in Naturally-Contaminated Pig Liver Products. Front. Microbiol. 2016, 7, 1183. [Google Scholar] [CrossRef] [PubMed]
- Aslan, A.T.; Balaban, H.Y. Hepatitis E virus: Epidemiology, diagnosis, clinical manifestations, and treatment. World J. Gastroenterol. 2020, 26, 5543–5560. [Google Scholar] [CrossRef]
- Orru, G.; Masia, G.; Orru, G.; Romano, L.; Piras, V.; Coppola, R.C. Detection and quantitation of hepatitis E virus in human faeces by real-time quantitative PCR. J. Virol. Methods 2004, 118, 77–82. [Google Scholar] [CrossRef]
- Inoue, J.; Takahashi, M.; Yazaki, Y.; Tsuda, F.; Okamoto, H. Development and validation of an improved RT-PCR assay with nested universal primers for detection of hepatitis E virus strains with significant sequence divergence. J. Virol. Methods 2006, 137, 325–333. [Google Scholar] [CrossRef]
- Garson, J.A.; Ferns, R.B.; Grant, P.R.; Ijaz, S.; Nastouli, E.; Szypulska, R.; Tedder, R.S. Minor groove binder modification of widely used TaqMan probe for hepatitis E virus reduces risk of false negative real-time PCR results. J. Virol. Methods 2012, 186, 157–160. [Google Scholar] [CrossRef]
- Bae, K.S.; Lee, S.; Lee, J.Y.; Kim, J.H.; Joo, Y.L.; Lee, S.H.; Chung, H.M.; You, K.A. Development of diagnostic systems for wide range and highly sensitive detection of two waterborne hepatitis viruses from groundwater using the conventional reverse transcription nested PCR assay. J. Virol. Methods 2022, 299, 114344. [Google Scholar] [CrossRef]
- NIER. Study on the Provided a Analytical System for the Monitoring of Pathogenic Microorganism from Drinking Water; National Institute of Environmental Research: Incheon, Republic of Korea, 2020.
- Frias, M.; Lopez-Lopez, P.; Zafra, I.; Caballero-Gomez, J.; Machuca, I.; Camacho, A.; Risalde, M.A.; Rivero-Juarez, A.; Rivero, A. Development and Clinical Validation of a Pangenotypic PCR-Based Assay for the Detection and Quantification of Hepatitis E Virus (Orthohepevirus A Genus). J. Clin. Microbiol. 2021, 59, e02075-20. [Google Scholar] [CrossRef] [PubMed]
- NIER. Development and Verification of Genetically Diagnostic Method for the Detection of Non-Regulated Viruses From Water Environment (I); National Institute of Environmental Research: Incheon, Republic of Korea, 2017.
- Lee, S.; Bae, K.S.; Lee, J.Y.; Joo, Y.L.; Kim, J.H.; You, K.A. Development of Molecular Diagnostic System with High Sensitivity for the Detection of Human Sapovirus from Water Environments. Biomed. Sci. Letters 2021, 27, 35–43. [Google Scholar] [CrossRef]

| Number of HEV-TP | Specificity | Plasmid-Based Sensitivity (2500 RFU) b | Artificial Spiking-Based Sensitivity (2500 RFU) c | Running Time (min) d | |||||||||||||||
|---|---|---|---|---|---|---|---|---|---|---|---|---|---|---|---|---|---|---|---|
| Target | 22 Refs. a | 100 pg | 10 pg | 1 pg | 100 fg | 10 fg | 1 fg | 100 ag | 10 ag | 100 pg | 10 pg | 1 pg | 100 fg | 10 fg | 1 fg | 100 ag | 10 ag | ||
| 1 | 35.0 < | N/A | 37.10 | 39.37 | N/A | N/A | N/A | N/A | N/A | N/A | 34.94 | 37.31 | N/A | N/A | N/A | N/A | N/A | N/A | 110.0 |
| 2 | O | 33.84 | 30.73 | 36.56 | 40.14 | 41.12 | 43.89 | N/A | N/A | 29.20 | 30.91 | 32.36 | 34.84 | 35.61 | 38.54 | 43.34 | 42.93 | 85.0 | |
| 3 | O | 26.93 | 29.86 | 30.75 | 40.31 | N/A | N/A | N/A | N/A | N/A | 28.76 | 29.78 | 31.44 | 34.59 | 38.38 | 44.13 | N/A | 100.0 | |
| 4 e | O | 23.45 | 23.94 | 28.15 | 32.82 | 35.18 | 38.58 | N/A | N/A | 23.69 | 25.34 | 24.73 | 28.64 | 30.26 | 33.61 | 36.61 | 38.03 | 78.0 | |
| 5 | O | 16.32 | 28.22 | 32.76 | 36.45 | 38.97 | 43.36 | N/A | N/A | 23.66 | 20.15 | 25.70 | 31.10 | 33.96 | 36.67 | 40.00 | 43.57 | 114.0 | |
| 6 | O | 26.61 | 26.75 | 31.68 | 38.26 | 38.64 | 42.43 | 42.06 | N/A | 30.42 | 27.11 | 32.35 | 33.87 | 33.38 | 36.68 | 40.47 | N/A | 86.0 | |
| 7 | O | 25.48 | 28.26 | 33.53 | 39.42 | N/A | N/A | N/A | N/A | 24.27 | 26.83 | 28.36 | 30.96 | 33.94 | 37.99 | 40.91 | N/A | 95.0 | |
| 8 | N/A | N/A | N/A | N/A | N/A | N/A | N/A | N/A | N/A | N/A | N/A | N/A | N/A | N/A | N/A | N/A | N/A | 100.0 | |
| 9 | O | 26.48 | 30.64 | 35.47 | 41.14 | 42.48 | N/A | N/A | N/A | 29.47 | 27.81 | 29.19 | 32.78 | 35.18 | 38.83 | 43.16 | N/A | 100.0 | |
| 10 | 35.0< | 36.71 | N/A | N/A | N/A | N/A | N/A | N/A | N/A | N/A | N/A | N/A | N/A | N/A | N/A | N/A | N/A | 140.0 | |
| 11 | N/A | N/A | N/A | N/A | N/A | N/A | N/A | N/A | N/A | N/A | N/A | N/A | N/A | N/A | N/A | N/A | N/A | 76.0 | |
| 12 | O | 32.15 | 34.42 | N/A | N/A | N/A | N/A | N/A | N/A | 30.00 | 35.69 | 37.18 | 37.17 | N/A | N/A | N/A | N/A | 76.0 | |
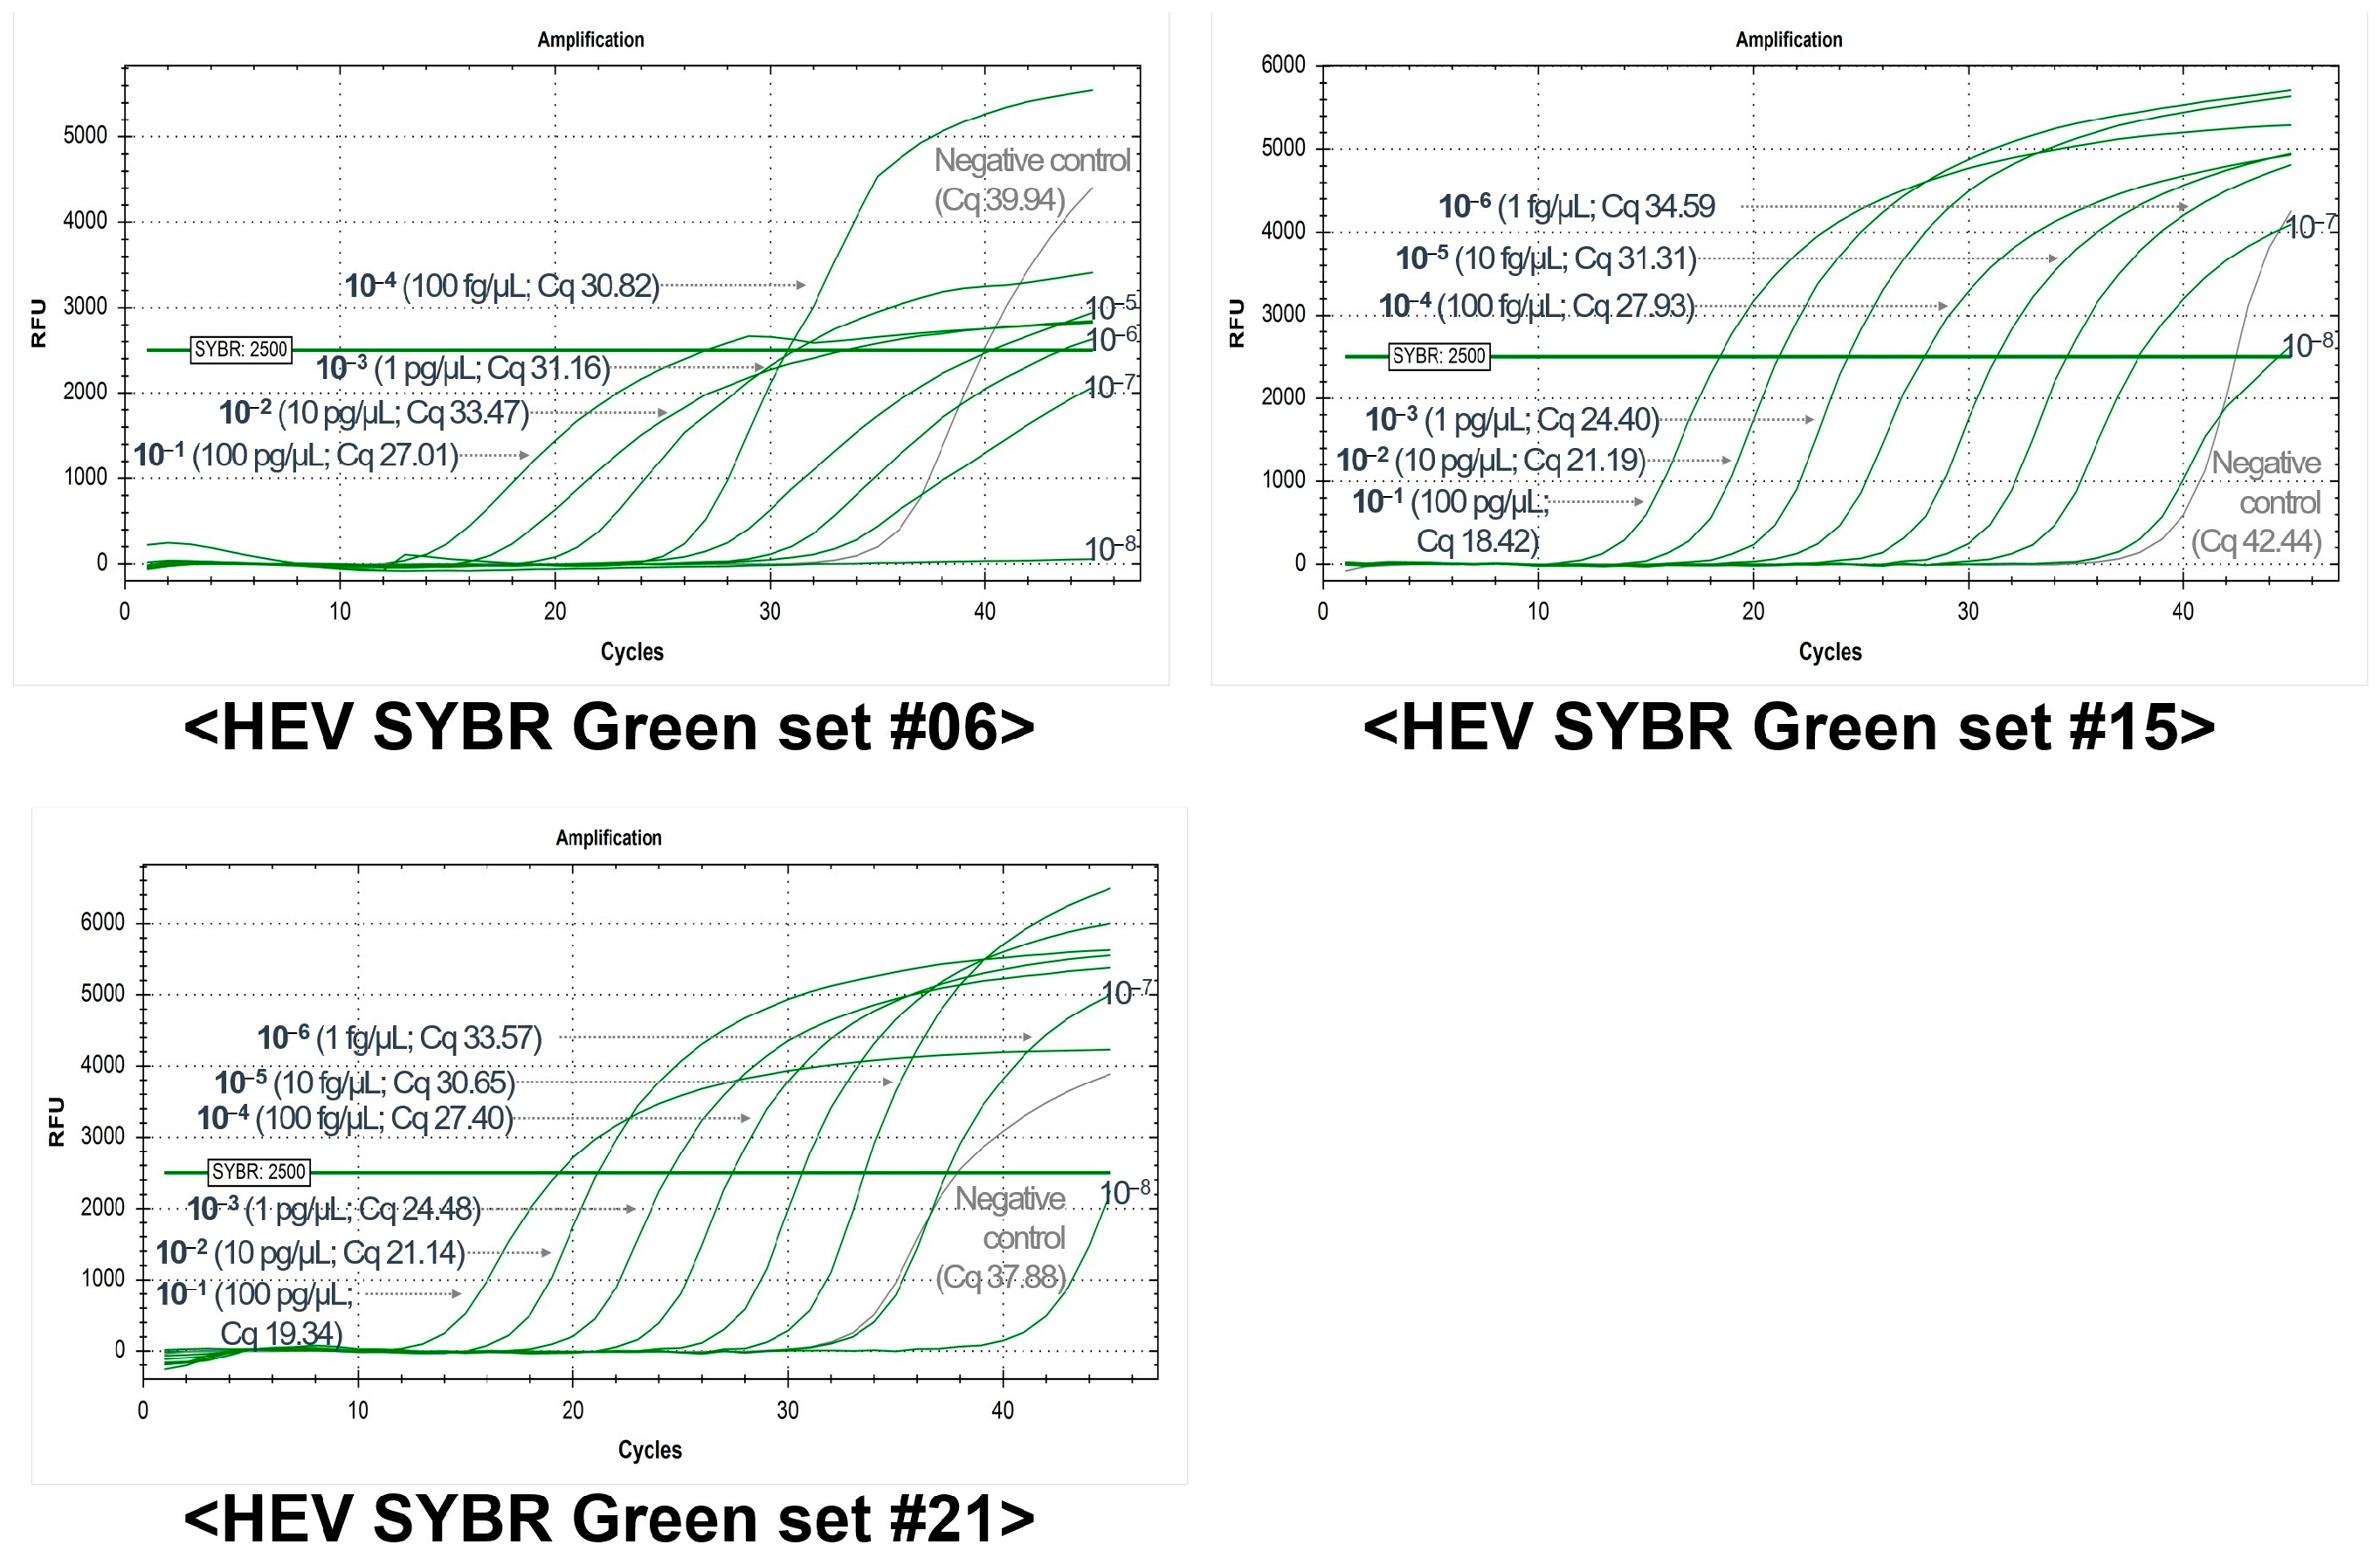
| HEV-SYBR Set # | Plasmid-Based Sensitivity (2500 RFU, Cq Value) | Running Time with Melting Curve Analysis (min) | |||||||
|---|---|---|---|---|---|---|---|---|---|
| 100 pg | 10 pg | 1 pg | 100 fg | 10 fg | 1 fg | 100 ag | 10 ag | ||
| 4 | 26.51 | 25.33 | 31.54 | 36.09 | 37.30 | N/A | N/A | N/A | Less than 110 |
| 5 | 26.37 | 28.49 | 34.85 | 38.16 | 40.33 | 42.17 | 40.58 | 41.54 | |
| 6 * | 21.61 | 24.20 | 29.50 | 33.81 | 36.04 | 39.58 | N/A | N/A | |
| 7 | 24.61 | 24.23 | 30.82 | 36.15 | 36.40 | 39.44 | 43.06 | N/A | |
| 13 | 24.60 | 24.13 | 30.26 | 35.18 | 36.25 | N/A | N/A | 38.69 | |
| 15 * | 25.53 | 24.56 | 30.53 | 35.00 | 39.59 | 44.15 | N/A | N/A | |
| 20 | 27.05 | 25.78 | 31.79 | 36.28 | 38.75 | 40.90 | N/A | N/A | |
| 21 * | 25.00 | 24.77 | 30.50 | 34.87 | 35.77 | 41.77 | 37.53 | 36.95 | |
| 22 | N/A | N/A | N/A | N/A | N/A | N/A | N/A | N/A | |
| 23 | 27.34 | 25.56 | 31.02 | 36.92 | 36.06 | 38.54 | 41.60 | N/A | |
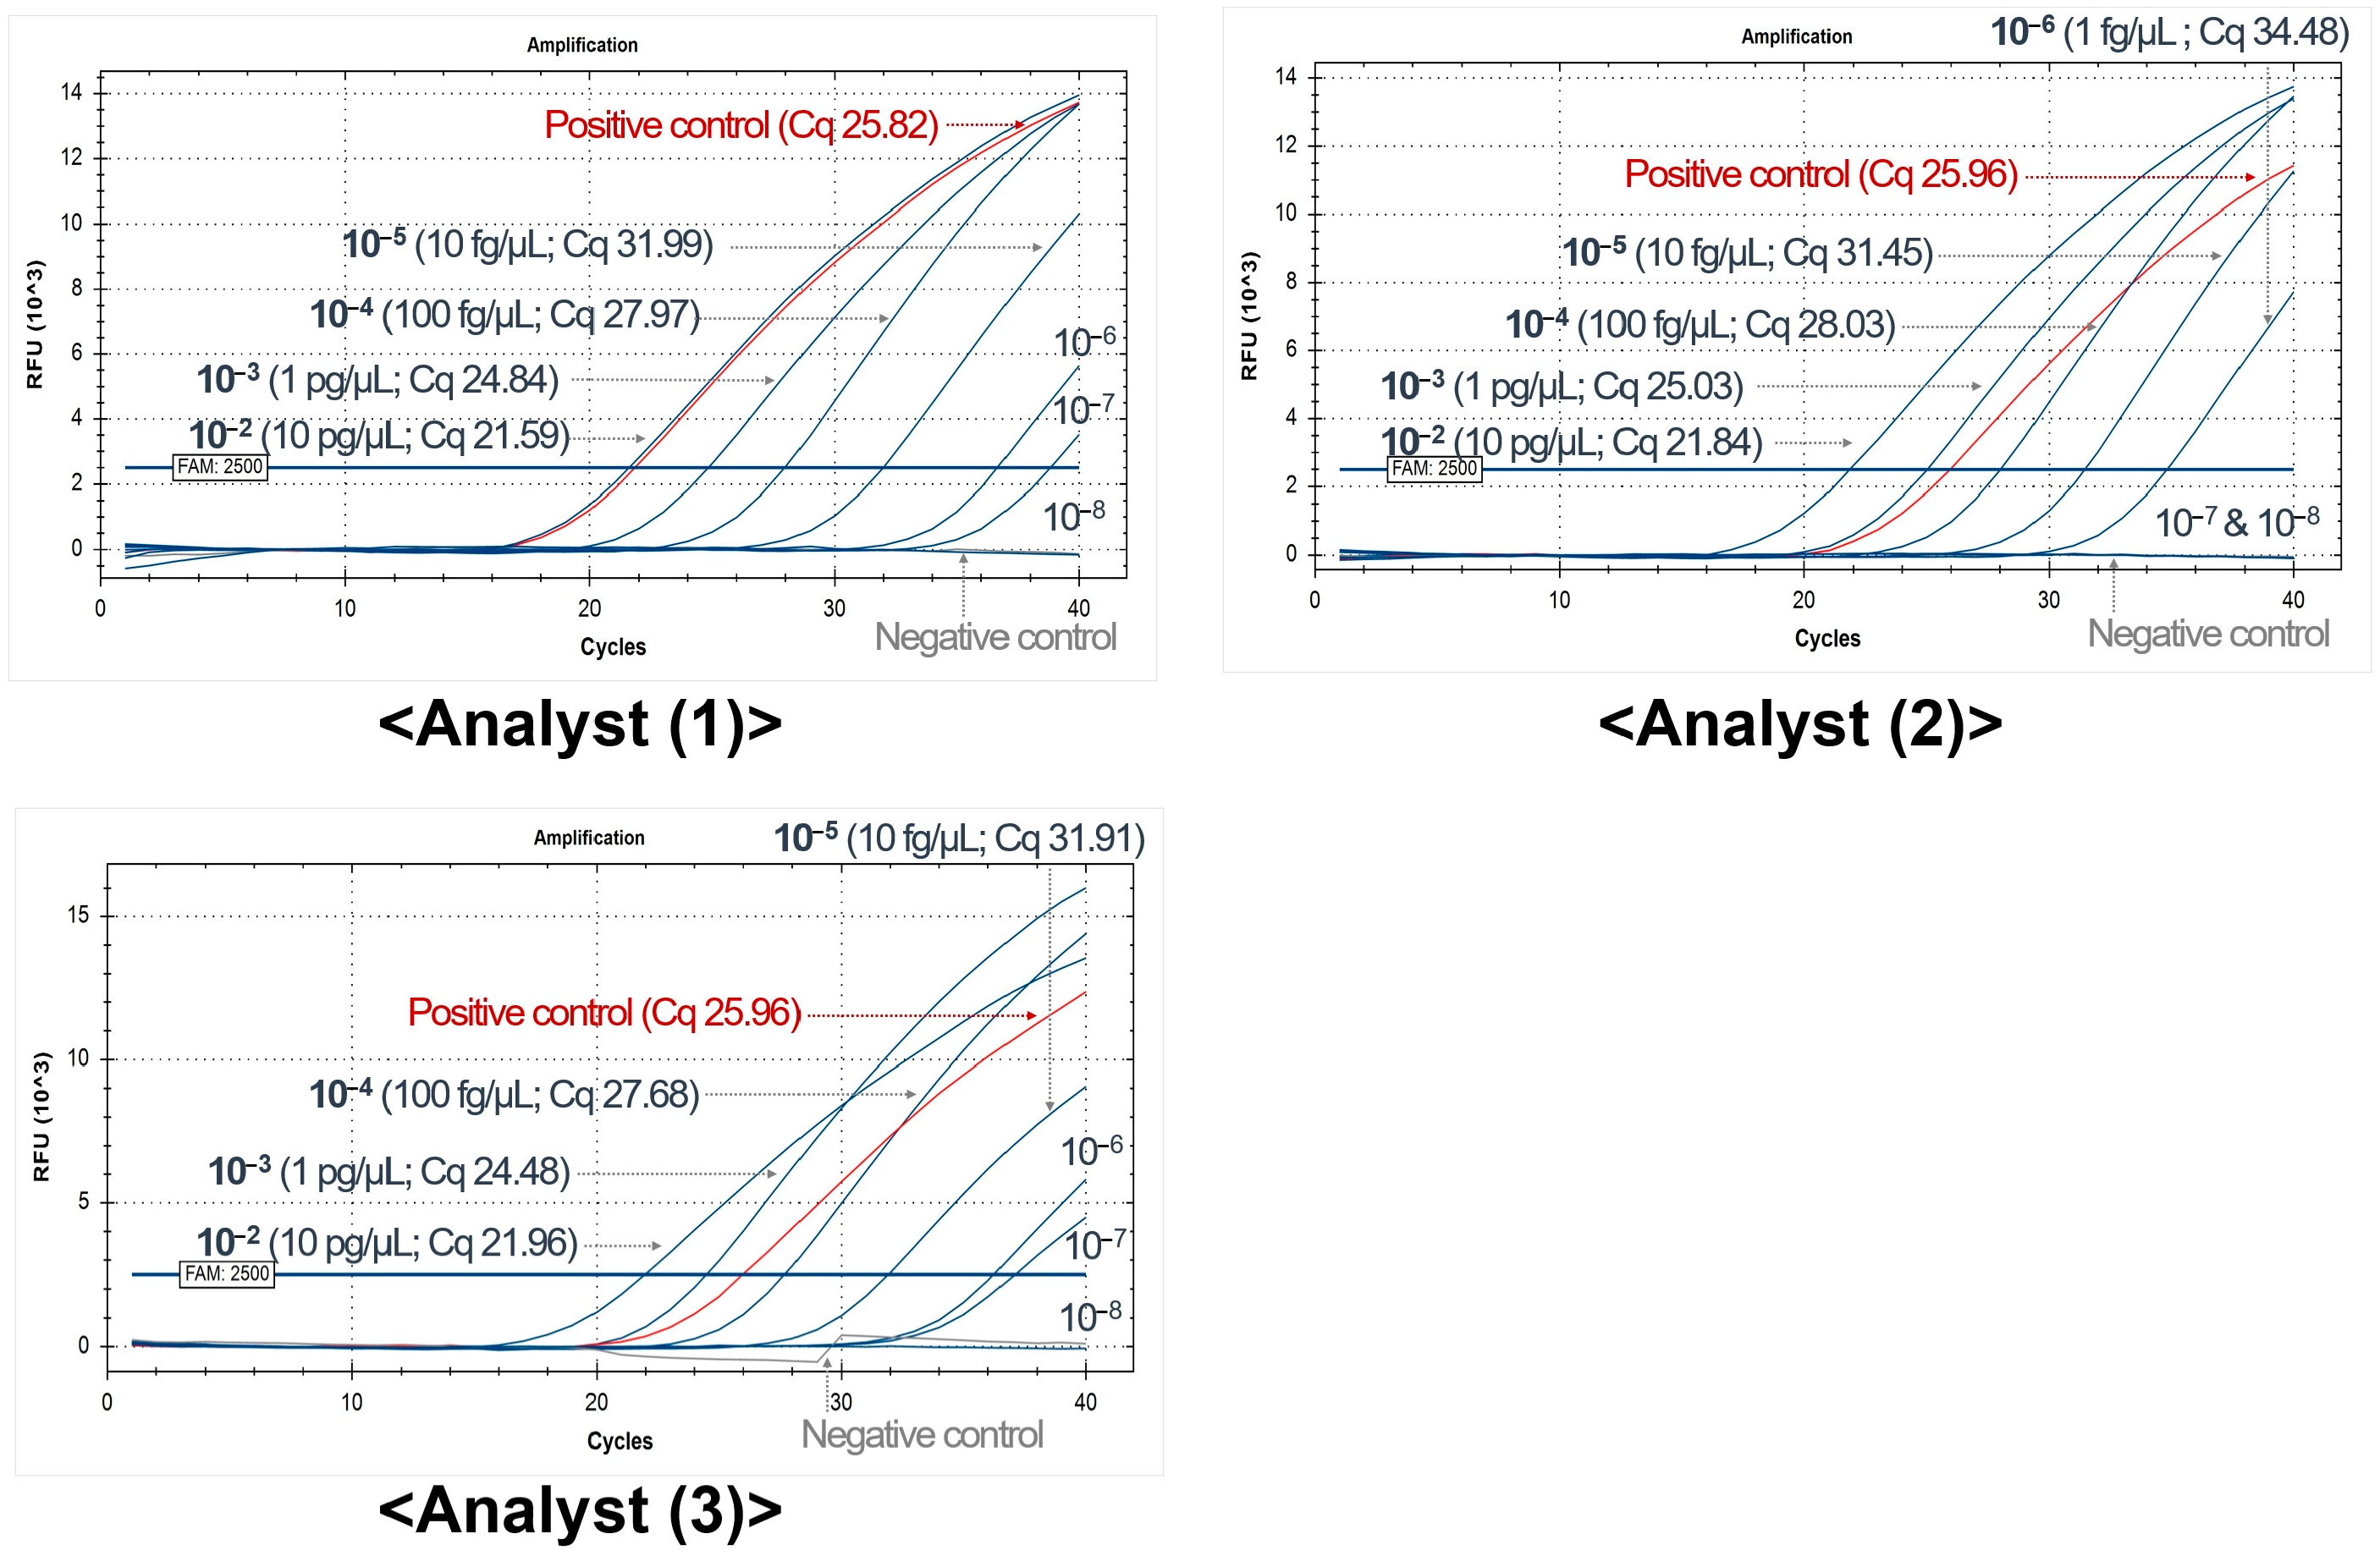
| HEV-SYBR_Set # | Division | Artificial Spiking-Based Sensitivity (2500 RFU, Cq Value) | |||||||||
|---|---|---|---|---|---|---|---|---|---|---|---|
| 100 pg | 10 pg | 1 pg | 100 fg | 10 fg | 1 fg | 100 ag | 10 ag | Neg | |||
| #15 | Developer | 18.42 | 21.19 | 24.40 | 27.93 | 31.31 | 34.59 | 37.92 | 44.43 | 42.44 | |
| Repeat (1) | Analyst 1 | 21.00 | 21.55 | 24.66 | 28.04 | 30.70 | 34.65 | 38.04 | 40.43 | 42.72 | |
| Analyst 2 | 25.55 | 24.87 | 26.37 | 28.97 | 31.36 | 34.63 | 38.93 | 39.87 | N/A | ||
| Analyst 3 | 22.42 | 25.19 | 28.23 | 29.79 | 31.88 | 34.89 | 39.53 | 41.83 | N/A | ||
| Repeat (2) | Analyst 1 | 21.76 | 22.35 | 25.42 | 28.85 | 32.68 | 35.78 | 40.60 | 43.76 | N/A | |
| Analyst 2 | 22.87 | 22.69 | 25.59 | 29.00 | 32.15 | 36.12 | 40.39 | 44.16 | N/A | ||
| Analyst 3 | 22.46 | 22.08 | 25.46 | 28.54 | 32.32 | 36.29 | 39.90 | 38.91 | 38.87 | ||
| Minimum | 18.42 | 21.19 | 24.40 | 27.93 | 30.70 | 34.59 | 37.92 | 38.91 | 38.87 | ||
| Maximum | 25.55 | 25.19 | 28.23 | 29.79 | 32.68 | 36.29 | 40.60 | 44.43 | 44.47 | ||
| Average (7 Cq values) | 22.07 | 22.85 | 25.73 | 28.73 | 31.77 | 35.28 | 39.33 | 41.91 | (N/A) | ||
| Average (5 Cq values) * | 21.37 | 22.38 | 25.23 | 28.52 | 31.59 | 35.08 | 39.08 | 41.41 | (N/A) | ||
| #21 | Developer | 19.34 | 21.14 | 24.48 | 27.40 | 30.65 | 33.57 | 37.39 | N/A | 37.88 | |
| Repeat (1) | Analyst 1 | 20.94 | 21.15 | 24.75 | 27.81 | 30.50 | 34.24 | 37.55 | 38.09 | N/A | |
| Analyst 2 | 22.46 | 22.48 | 25.38 | 28.11 | 30.81 | 35.03 | 37.53 | 40.21 | N/A | ||
| Analyst 3 | 23.03 | 25.22 | 27.19 | 29.16 | 31.52 | 34.37 | 37.31 | 38.71 | 44.47 | ||
| Repeat (2) | Analyst 1 | 22.06 | 23.48 | 26.66 | 28.99 | 32.59 | 35.66 | 38.49 | 37.04 | N/A | |
| Analyst 2 | 25.07 | 23.54 | 26.04 | 28.57 | 32.45 | 36.99 | N/A | 39.53 | N/A | ||
| Analyst 3 | 35.69 | 25.76 | 26.96 | 28.97 | 32.37 | 35.91 | 39.98 | 40.42 | 41.96 | ||
| Minimum | 19.34 | 21.14 | 24.48 | 27.40 | 30.50 | 33.57 | 37.31 | 37.04 | 37.88 | ||
| Maximum | 35.69 | 25.76 | 27.19 | 29.16 | 32.59 | 36.99 | 39.98 | 40.42 | 44.47 | ||
| Average (7 Cq values) | 24.08 | 23.25 | 25.92 | 28.43 | 31.56 | 35.11 | 38.04 | 39.00 | N/A | ||
| Average (5 Cq values) * | 21.76 | 22.75 | 25.67 | 28.28 | 31.35 | 34.73 | 37.56 | 38.65 | N/A | ||
| # | Primer (TaqMan Probe) | Location | Product Size (nt) | PCR Conditions b | Reference c | ||||||||
|---|---|---|---|---|---|---|---|---|---|---|---|---|---|
| Type | Name | Sequence (5′→3′) | Length (bp) | Start a | End a | 1st DN | DN | AN | EX | Cycle | |||
| 1 | F | Sense primer | GACAGAATTRATTTCGTCGGCTGG | 24 | 6336 | 6359 | 73 | 95 °C, 10 min | 95 °C, 15 s | 60 °C, 60 s | 50 | [32,33] | |
| R | HEV_R | CCYTTRTCYTGCTGNGCRTTCTC | 23 | 6386 | 6408 | ||||||||
| Probe | Probe | FAM-GTYGTCTCRGCCAATGGCGAGC-BHQ1 | 22 | 6385 | 6406 | ||||||||
| 2 | F | JVHEV-F | GGTGGTTTCTGGGGTGAC | 18 | 5299 | 5316 | 70 | 95 °C, 15 min | 95 °C, 10 s | 55 °C, 20 s | 72 °C, 15 s | 45 | [34] |
| R | JVHEV-R | AGGGGTTGGTTGGATGAA | 18 | 5351 | 5368 | ||||||||
| Probe | JVHEV-P | FAM-TGATTCTCAGCCCTTCGC-BHQ1 | 18 | 5322 | 5339 | ||||||||
| 3 | F | HevMrsFwd | AATTRATTTCGTCGGCYGG | 19 | 6341 | 6359 | 73 | 95 °C, 10 min | 95 °C, 15 s | 60 °C, 60 s | 45 | [35] | |
| R | HevMrsRev | ACWGTCGGCTCGCCATTG | 18 | 6396 | 6413 | ||||||||
| Probe | HevMrsFam | FAM-ACTCYCGCCCSGTYGTCTCA-BHQ1 | 20 | 6374 | 6393 | ||||||||
| 4 | F | Forward | CGGTGGTTTCTGGGGTGA | 18 | 5298 | 5315 | 75 | 95 °C, 3 min d | 95 °C, 10 s | 55 °C, 40 s | 40 | [36] | |
| R | Reverse | GCGAAGGGGTTGGTTGGA | 18 | 5355 | 5372 | ||||||||
| Probe | Probe | FAM-TGATTCTCAGCCCTTCGC-BHQ1 | 18 | 5322 | 5339 | ||||||||
| 5 | F | forward primer | CGGCGGTGGTTTCTGG | 16 | 5295 | 5310 | 75 | 95 °C, 15 min | 94 °C, 15 s | 60 °C, 60 s | 50 | [37] | |
| R | reverse primer | AAGGGGTTGGTTGGATGAATA | 21 | 5349 | 5369 | ||||||||
| Probe | probe | FAM-TGACAGGGTTGATTCTCAGCCCTTCG-BHQ1 | 26 | 5313 | 5338 | ||||||||
| 6 | F | HEV_F | CGACAGAATTGATTTCGTCGGC | 22 | 6335 | 6356 | 121 | 95 °C, 15 min | 95 °C, 15 s | 60 °C, 35 s | 45 | [33] | |
| R | HEV_R | CCYTTRTCYTGCTGNGCRTTCTC | 23 | 6433 | 6455 | ||||||||
| Probe | HEV_TM | FAM-TYGGCTCGCCATTGGCYGAGAC-BHQ1 | 22 | 6386 | 6407 | ||||||||
| 7 | F | HEV-F | CCGACAGAATTRATTTCGTCGGC | 23 | 6344 | 6366 | 115 | 95 °C, 2 min | 95 °C, 15 s | 60 °C, 60 s | 45 | [38] | |
| R | HEV-R | ATACCCTTRTCYTGCTGIGCRTTCTC | 26 | 6433 | 6458 | ||||||||
| Probe | HEV-P | FAM-GTCTCAGCCAATGGCGAG-BHQ1 | 18 | 6388 | 6405 | ||||||||
| 8 | F | Forward | GGTGGTTTCTGGGGTGAC | 18 | 5299 | 5316 | 73 | 95 °C, 10 min | 95 °C, 15 s | 60 °C, 60 s | 45 | [39] | |
| R | Reverse | CGAAGGGGTTGGTTGGATG | 19 | 5353 | 5371 | ||||||||
| Probe | Probe | FAM-ATTCTCAGCCCTTCGCAATCCCCT-BHQ1 | 24 | 5324 | 5347 | ||||||||
| 9 | F | HEV25 | CGGTGGTTTCTGGGGTGA | 18 | 5298 | 5315 | 75 | 95 °C, 10 min | 95 °C, 15 s | 60 °C, 60 s | 45 | [40] | |
| R | HEV26 | GCRAAGGGRTTGGTTGG | 17 | 5356 | 5372 | ||||||||
| Probe | HEV-MGB | FAM-ATTCTCAGCCCTTCGC-BHQ1 | 16 | 5324 | 5339 | ||||||||
| 10 | F | HEV-5260-F | CGGTGGTTTCTGGGGTGAC | 19 | 5298 | 5316 | 71 | 95 °C, 5 min | 95 °C, 15 s | 60 °C, 60 s | 65 °C, 60 s | 45 | [41] |
| R | HEV-5330-R | AGGGGTTGGTTGGATGAATATAG | 23 | 5346 | 5368 | ||||||||
| Probe | HEV-5280-T | FAM-GGGTTGATTCTCAGCCCTTCGC-BHQ1 | 22 | 5318 | 5339 | ||||||||
| 11 | F | HEV-5260-F | CGGTGGTTTCTGGGGTGAC | 19 | 5298 | 5316 | 71 | 95 °C, 5 min | 95 °C, 15 s | 60 °C, 35 s | 45 | [42,43] | |
| R | HEV-5330-R | AGGGGTTGGTTGGATGAATATAG | 23 | 5346 | 5368 | ||||||||
| Probe | E-Probe(M) | FAM-GGTTGATTCTCAGCCCTTCGC-BHQ1 | 21 | 5319 | 5339 | ||||||||
| 12 | F | HEV-5260-F | GGTGGTTTCTGGGGTGAC | 18 | 5299 | 5315 | 70 | 95 °C, 5 min | 95 °C, 15 s | 55 °C, 35 s | 45 | [42,43] | |
| R | JVHEV-R(M) | AAGGGGTTGGTTGGATGAATA | 21 | 5349 | 5368 | ||||||||
| Probe | JVHEV-P(M) | FAM-TTGATTCTCAGCCCTTCGC-BHQ1 | 19 | 5321 | 5348 | ||||||||
| # | Type | Name | Sequence (5′→3′) | Length (nt) | Location * | # | |
|---|---|---|---|---|---|---|---|
| Start | End | ||||||
| 1 | Forward | HEV-05_08Matsubayashi_F | CGGCGGTGGTTTCTGG | 16 | 5295 | 1 | [37] |
| 2 | Forward | HEV-13_04Orrù_F | GCGGTGGTTTCTGGGG | 16 | 5297 | 2 | [44] |
| 3 | Forward | HE361 | GCRGTGGTTTCTGGGGTGAC | 20 | 5297 | 3 | [45] |
| 4 | Forward | HEV-5260-F | CGGTGGTTTCTGGGGTGAC | 19 | 5298 | 4 | [45] |
| 5 | Forward | HEV-02_06Jothikumar_F | GGTGGTTTCTGGGGTGAC | 18 | 5299 | 5 | [34] |
| 6 | Forward | JVHEV-F(M) | GGTGGTTTCTGGGGTGA | 17 | 5299 | 6 | [46] |
| 7 | Forward | HE366 | GYTGATTCTCAGCCCTTCGC | 20 | 5320 | 7 | [46] |
| 8 | Forward | HEV_SLNL-F | TCCCCYATATTCATCCAACCAA | 22 | 5342 | 8 | [47] |
| 9 | Forward | HEV-F1 | TCCCCTATATTCATCCAACCAA | 22 | 5342 | 9 | [48] |
| 10 | Forward | HEV_SLNL-NF | GAYCARKCCCAGCGCCCCG | 19 | 5449 | 10 | [47] |
| 11 | Forward | HEV-F2 | GAYCARKCCCAGCGCCCC | 18 | 5449 | 11 | [48] |
| 12 | Forward | F-3156N | AATTATGCCCAGTACCGGGTTG | 22 | 5725 | 12 | [39] |
| 13 | Forward | HE044 | CAAGGHTGGCGYTCKGTTGAGAC | 23 | 5950 | 13 | [45] |
| 14 | Forward | HE110-2 | GYTCKGTTGAGACCWCBGGBGT | 22 | 5960 | 14 | [49] |
| 15 | Forward | F-3158N | GTTATGCTTTGCATACATGGCT | 22 | 6010 | 15 | [49] |
| 16 | Forward | ORF2 BOVF2 | CYGTYGTSTCRGCCAATGG | 19 | 6321 | 16 | [47] |
| 17 | Forward | ORF2 BOVF1 | GGBCTNCCGACAGAATTRAT | 20 | 6328 | 17 | [47] |
| 18 | Forward | HEV-06_09Adlhoch_F | CGACAGAATTGATTTCGTCGGC | 22 | 6335 | 18 | [33] |
| 19 | Forward | HEV-03_07Colson_F | AATTRATTTCGTCGGCYGG | 19 | 6341 | 19 | [35] |
| 20 | Reverse | HE041 | TTMACWGTCRGCTCGCCATTGGC | 23 | 6394 | 20 | [13] |
| 21 | Reverse | HEV-03_07Colson_R | ACWGTCGGCTCGCCATTG | 18 | 6396 | 21 | [35] |
| 22 | Reverse | HEV-09_12Pas_R | GCRAAGGGRTTGGTTGG | 17 | 6393 | 22 | [40] |
| 23 | Reverse | HEV-R_NL | RGCCGACGAAATYAATTCTGTC | 23 | 6335 | 23 | [47] |
| 24 | Reverse | HEV-R (=R-3159N) | RGCCGACGAAATYAATTCTGTC | 22 | 6336 | 24 | [47] |
| 25 | Reverse | HE364 | CTGGGMYTGGTCDCGCCAAG | 20 | 5441 | 25 | [45] |
| 26 | Reverse | HE363 | GMYTGGTCDCGCCAAGHGGA | 20 | 5437 | 26 | [45] |
| 27 | Reverse | HEV-08_12KMFDS_R | CGAAGGGGTTGGTTGGATG | 19 | 5353 | 27 | [39] |
| 28 | Reverse | HEV-02_06Jothikumar_R | AGGGGTTGGTTGGATGAA | 18 | 5351 | 28 | [34] |
| 29 | Reverse | HEV-5330-R | AGGGGTTGGTTGGATGAATATAG | 23 | 5346 | 29 | [42] |
| 30 | Reverse | JVHEV-R(M) | AGGGGTTGGTTGGATGAATA | 20 | 5349 | 30 | [42] |
| # | Division and # | Virus | Genotype | Acronym | Group * | Gene | NCBI Accession # * | Length (nt) * | Conc. |
|---|---|---|---|---|---|---|---|---|---|
| 1 | Target | Hepatitisvirus | E | HEV | Plasmid | ORF2 | FJ763142.1 | 1168 | 1 ng/μL based dilutes |
| 2 | Refs. #01 | Enteric Adenovirus | 40 | eAdV-40 | DNA | - | - | - | 1 pg/μL |
| 3 | Refs. #02 | Enteric Adenovirus | 41 | eAdV-41 | DNA | - | - | - | 1 pg/μL |
| 4 | Refs. #03 | Aichivirus | A1 | AiV-A1 | Plasmid | VP3-VP1/2AB/3CD | NC_001918.1 | 3953 | 1 pg/μL |
| 5 | Refs. #04 | Astrovirus | - | AstV | Plasmid | ORF1b-2 | JN887820.1 | 2886 | 1 pg/μL |
| 6 | Refs. #05 | Coxsackievirus | A6 | CoxV-A6 | cDNA | - | - | - | 100 copies |
| 7 | Refs. #06 | Coxsackievirus | A24 | CoxV-A24 | cDNA | - | - | - | 1 pg/μL |
| 8 | Refs. #07 | Coxsackievirus | B1 | CoxV-B1 | cDNA | - | - | - | 100 copies |
| 9 | Refs. #08 | Coxsackievirus | B5 | CoxV-B5 | cDNA | - | - | - | 100 copies |
| 10 | Refs. #09 | Echovirus | 5 | EcoV-5 | cDNA | - | - | - | 100 copies |
| 11 | Refs. #10 | Echovirus | 11 | EcoV-11 | cDNA | - | - | - | 1 pg/μL |
| 12 | Refs. #11 | Echovirus | 22 | EcoV-22 | cDNA | - | - | - | 1 pg/μL |
| 13 | Refs. #12 | Enterovirus | 68 | EV-68 | cDNA | - | - | - | 100 copies |
| 14 | Refs. #13 | Enterovirus | 71 | EV-71 | cDNA | - | - | - | 100 copies |
| 15 | Refs. #14 | Hepatitisvirus | A | HAV | cDNA | - | - | - | 1 pg/μL |
| 16 | Refs. #15 | Norovirus | GI | NoV-GI | Plasmid | ORF1/VP1 | JQ388274.1 | 391 | 1 pg/μL |
| 17 | Refs. #16 | Norovirus | GII | NoV-GII | cDNA | - | - | - | 100 copies |
| 18 | Refs. #17 | Orthoreovirus | - | OrV | Plasmid | Segment S | NC_013231.1 | 830 | 1 pg/μL |
| 19 | Refs. #18 | Parechovirus | A | PeV-A | Plasmid | 5′UTR/VP3-VP1-2A | NC_001897.1 | 1237 | 1 pg/μL |
| 20 | Refs. #19 | Poliovirus | Type3 | PV-type3 | Plasmid | 5′UTR/VP2/VP1/3C | AY184221.1 | 983 | 1 pg/μL |
| 21 | Refs. #20 | Reovirus | - | ReV | cDNA | - | - | - | 1 pg/μL |
| 22 | Refs. #21 | Rotavirus | A | RV-A | cDNA | - | - | - | 100 copies |
| 23 | Refs. #22 | Sapovirus | GI.1 | SaV-GI | Plasmid | NS7-VP1 | KP298674.1 | 2000 | 1 pg/μL |
Disclaimer/Publisher’s Note: The statements, opinions and data contained in all publications are solely those of the individual author(s) and contributor(s) and not of MDPI and/or the editor(s). MDPI and/or the editor(s) disclaim responsibility for any injury to people or property resulting from any ideas, methods, instructions or products referred to in the content. |
© 2025 by the authors. Licensee MDPI, Basel, Switzerland. This article is an open access article distributed under the terms and conditions of the Creative Commons Attribution (CC BY) license (https://creativecommons.org/licenses/by/4.0/).
Share and Cite
Kim, J.-H.; Lee, S.; Park, E.-R. Real-Time PCR-Based Detection of Hepatitis E Virus in Groundwater: Primer Performance and Method Validation. Int. J. Mol. Sci. 2025, 26, 7377. https://doi.org/10.3390/ijms26157377
Kim J-H, Lee S, Park E-R. Real-Time PCR-Based Detection of Hepatitis E Virus in Groundwater: Primer Performance and Method Validation. International Journal of Molecular Sciences. 2025; 26(15):7377. https://doi.org/10.3390/ijms26157377
Chicago/Turabian StyleKim, Jin-Ho, Siwon Lee, and Eung-Roh Park. 2025. "Real-Time PCR-Based Detection of Hepatitis E Virus in Groundwater: Primer Performance and Method Validation" International Journal of Molecular Sciences 26, no. 15: 7377. https://doi.org/10.3390/ijms26157377
APA StyleKim, J.-H., Lee, S., & Park, E.-R. (2025). Real-Time PCR-Based Detection of Hepatitis E Virus in Groundwater: Primer Performance and Method Validation. International Journal of Molecular Sciences, 26(15), 7377. https://doi.org/10.3390/ijms26157377