Article

Performance of Plasma Phosphorylated tau-217 in Patients on the Continuum of Alzheimer’s Disease

by
Farida Dakterzada
1,
Ricard López-Ortega
2,
Alba Vilella-Figuerola
1,
Nathalia Montero-Castilla
1,
Iolanda Riba-Llena
1,
Maria Ruiz-Julián
1,
Alfonso Arias
1,
Jordi Sarto
1,
Nuria Tahan
1 and
Gerard Piñol-Ripoll
1,3,*
1
Unitat de Trastorns Cognitius, Cognition and Behaviour Study Group, Hospital Universitari Santa Maria de Lleida, Universitat de Lleida, IRBLleida, 25198 Lleida, Spain
2
Laboratori Clinical ICS, Hospital Universitari Arnau de Vilanova, 25198 Lleida, Spain
3
Unitat d’Alzheimer i Altres Trastorns Cognitius, Hospital Clínic de Barcelona–Fundació de Recerca Clínic Barcelona–Institut d’Investigacions Biomèdiques August Pi i Sunyer (FRCB–IDIBAPS), 08036 Barcelona, Spain
*
Author to whom correspondence should be addressed.
Int. J. Mol. Sci. 2025, 26(14), 6771; https://doi.org/10.3390/ijms26146771
Submission received: 17 June 2025 / Revised: 10 July 2025 / Accepted: 11 July 2025 / Published: 15 July 2025
(This article belongs to the Special Issue Biomarkers in Precision Medicine)

Abstract

Recent studies have demonstrated the high analytical and diagnostic performance of plasma p-tau217 using well-defined cohorts. We aimed to assess the analytical, diagnostic, and prognostic utility of plasma p-tau217 as a routine biomarker in symptomatic patients attending our memory clinic. We also sought to identify optimal cutoff points that align with cerebrospinal fluid (CSF) amyloid beta (Aβ) status. A total of 276 cognitively impaired patients were included, with 81 mild cognitive impairment (MCI) patients followed for a mean of 56 (±15.8) months to evaluate progression to Alzheimer’s disease (AD). CSF and blood biomarkers of AD were quantified using the Lumipulse G platform. Plasma p-tau217 levels showed strong correlations with CSF Aβ42/Aβ40 (r = −0.707), p-tau181/Aβ42 (r = 0.842), and p-tau181 (r = 0.728). Plasma p-tau217 levels were significantly higher in the A + T + group than in A − T +/− (p < 0.001) and outperformed other plasma markers in detecting CSF Aβ pathology (AUC 0.924).Additionally, p-tau217 moderated cognitive changes over time as measured by the Mini-mental state examination (MMSE) (F(2, 70) = 13.995, p < 0.001) and outperformed other plasma biomarkers in predicting progression from MCI to AD (AUC 0.876). Using a dual cutoff strategy, 72% of patients were classified with 94.9% concordance with CSF Aβ status. Plasma p-tau217 shows strong potential as a non-invasive, cost-effective diagnostic and prognostic tool in clinical settings.

1. Introduction

Cerebrospinal fluid (CSF) and imaging biomarkers have long been essential tools for accurately diagnosing Alzheimer’s disease (AD) and linking clinical manifestations to underlying pathology [1,2,3,4]. However, their invasiveness and high cost have limited their widespread use in clinical practice, clinical trials, and research studies. As a result, in recent years, there has been a growing effort to measure AD-specific biomarkers in blood as a less invasive and more cost-effective alternative. In this regard, the development of several highly sensitive platforms has helped overcome one of the most significant challenges—the low concentration of AD biomarkers—enabling more accurate quantification in blood [5,6,7,8,9,10,11,12]. Now, kits for determination of plasma amyloid beta 42 (Aβ42), Aβ40, total tau, hyperphosphorylated tau (p-tau), neurofilament light chain (NfL), and Glial fibrillary acidic protein (GFAP) are available for research purposes. Among these biomarkers, hyperphosphorylated tau species (p-tau181, p-tau231, p-tau217) have demonstrated superior diagnostic accuracy and stronger concordance with cerebral and CSF amyloid pathology [5,13,14,15,16,17,18]. In particular, p-tau217 has garnered special attention due to its superior performance compared to other p-tau species in distinguishing patients at different stages of AD, from preclinical to dementia, and differentiating AD from other neurodegenerative disorders [15,19,20,21]. It has shown the largest fold changes in symptomatic AD and better predictive ability for identifying cognitive decline [18,19,22,23].
Based on recent evidence, the Alzheimer’s Association workgroup has updated the diagnostic criteria for AD. According to these revised guidelines, an abnormal result for a core 1 biomarker—such as elevated plasma p-tau217—is now considered sufficient to establish an AD diagnosis [4]. Furthermore, with the approval of disease-modifying monoclonal antibodies and the growing demand for cost-effective, less invasive diagnostic tools, evaluating the performance of p-tau217 and establishing accurate, region-specific cutoff values based on patient characteristics have become essential for memory clinics. Additionally, further research is warranted to assess the utility of this biomarker in monitoring clinical progression in symptomatic individuals on the continuum of AD. By incorporating longitudinal clinical outcomes, our study aims to provide real-world evidence of the long-term prognostic value of p-tau217 in memory clinic patients, highlighting its potential role in risk stratification and guiding early intervention strategies.
Therefore, we aimed to evaluate the clinical and analytical performance of p-tau217 in routine practice among patients seen at our memory clinic. Our objectives were (a) to assess the correlations between plasma p-tau217 and CSF AD biomarkers (Aβ42, Aβ40, total tau, and p-tau181), (b) to determine whether the presence of comorbidities affects plasma levels of this biomarker, (c) to determine whether p-tau217 levels are significantly different between patients with different AD pathology profile, (d) to assess the association between baseline plasma p-tau217 levels and cognitive decline over time, and to determine the long-term prognostic value of p-tau217 in predicting progression from mild cognitive impairment (MCI) to AD, and finally (e) to determine the two cutoff points for p-tau217 based on abnormal Aβ pathology detected in CSF in order to assess the extent to which this biomarker can reduce the number of lumbar punctures necessary for diagnosis of AD in our memory clinic.

2. Results

2.1. Participants Characteristics

The characteristics of the study population are summarized in Table 1. The average age of the participants was 73 (6.5 SD) years, and females represented 59% of the study population. Significant differences between diagnostic groups were observed for sex (p = 0.006), education (p = 0.047), Mini-mental state examination (MMSE, p < 0.001), and the frequency of the apolipoprotein E ε4 (APOE ε4) allele (p = 0.013). Among CSF AD biomarkers and ratios, only the levels of Aβ40 did not differ significantly between groups. However, for plasma biomarkers, neither Aβ40 nor the Aβ42/40 ratio showed a significant difference between diagnostic groups (Table 1). We also divided the participants based on their CSF Aβ42/40 status. Of a total of 276 participants, 99 were Aβ− and 177 Aβ+. In this case, the groups were significantly different regarding age (p = 0.011), sex (p < 0.001), and the frequency of the APOE ε4 allele (p < 0.001). Among CSF and plasma AD biomarkers and ratios, only the levels of Aβ40 did not differ significantly between groups (Supplementary Table S1).

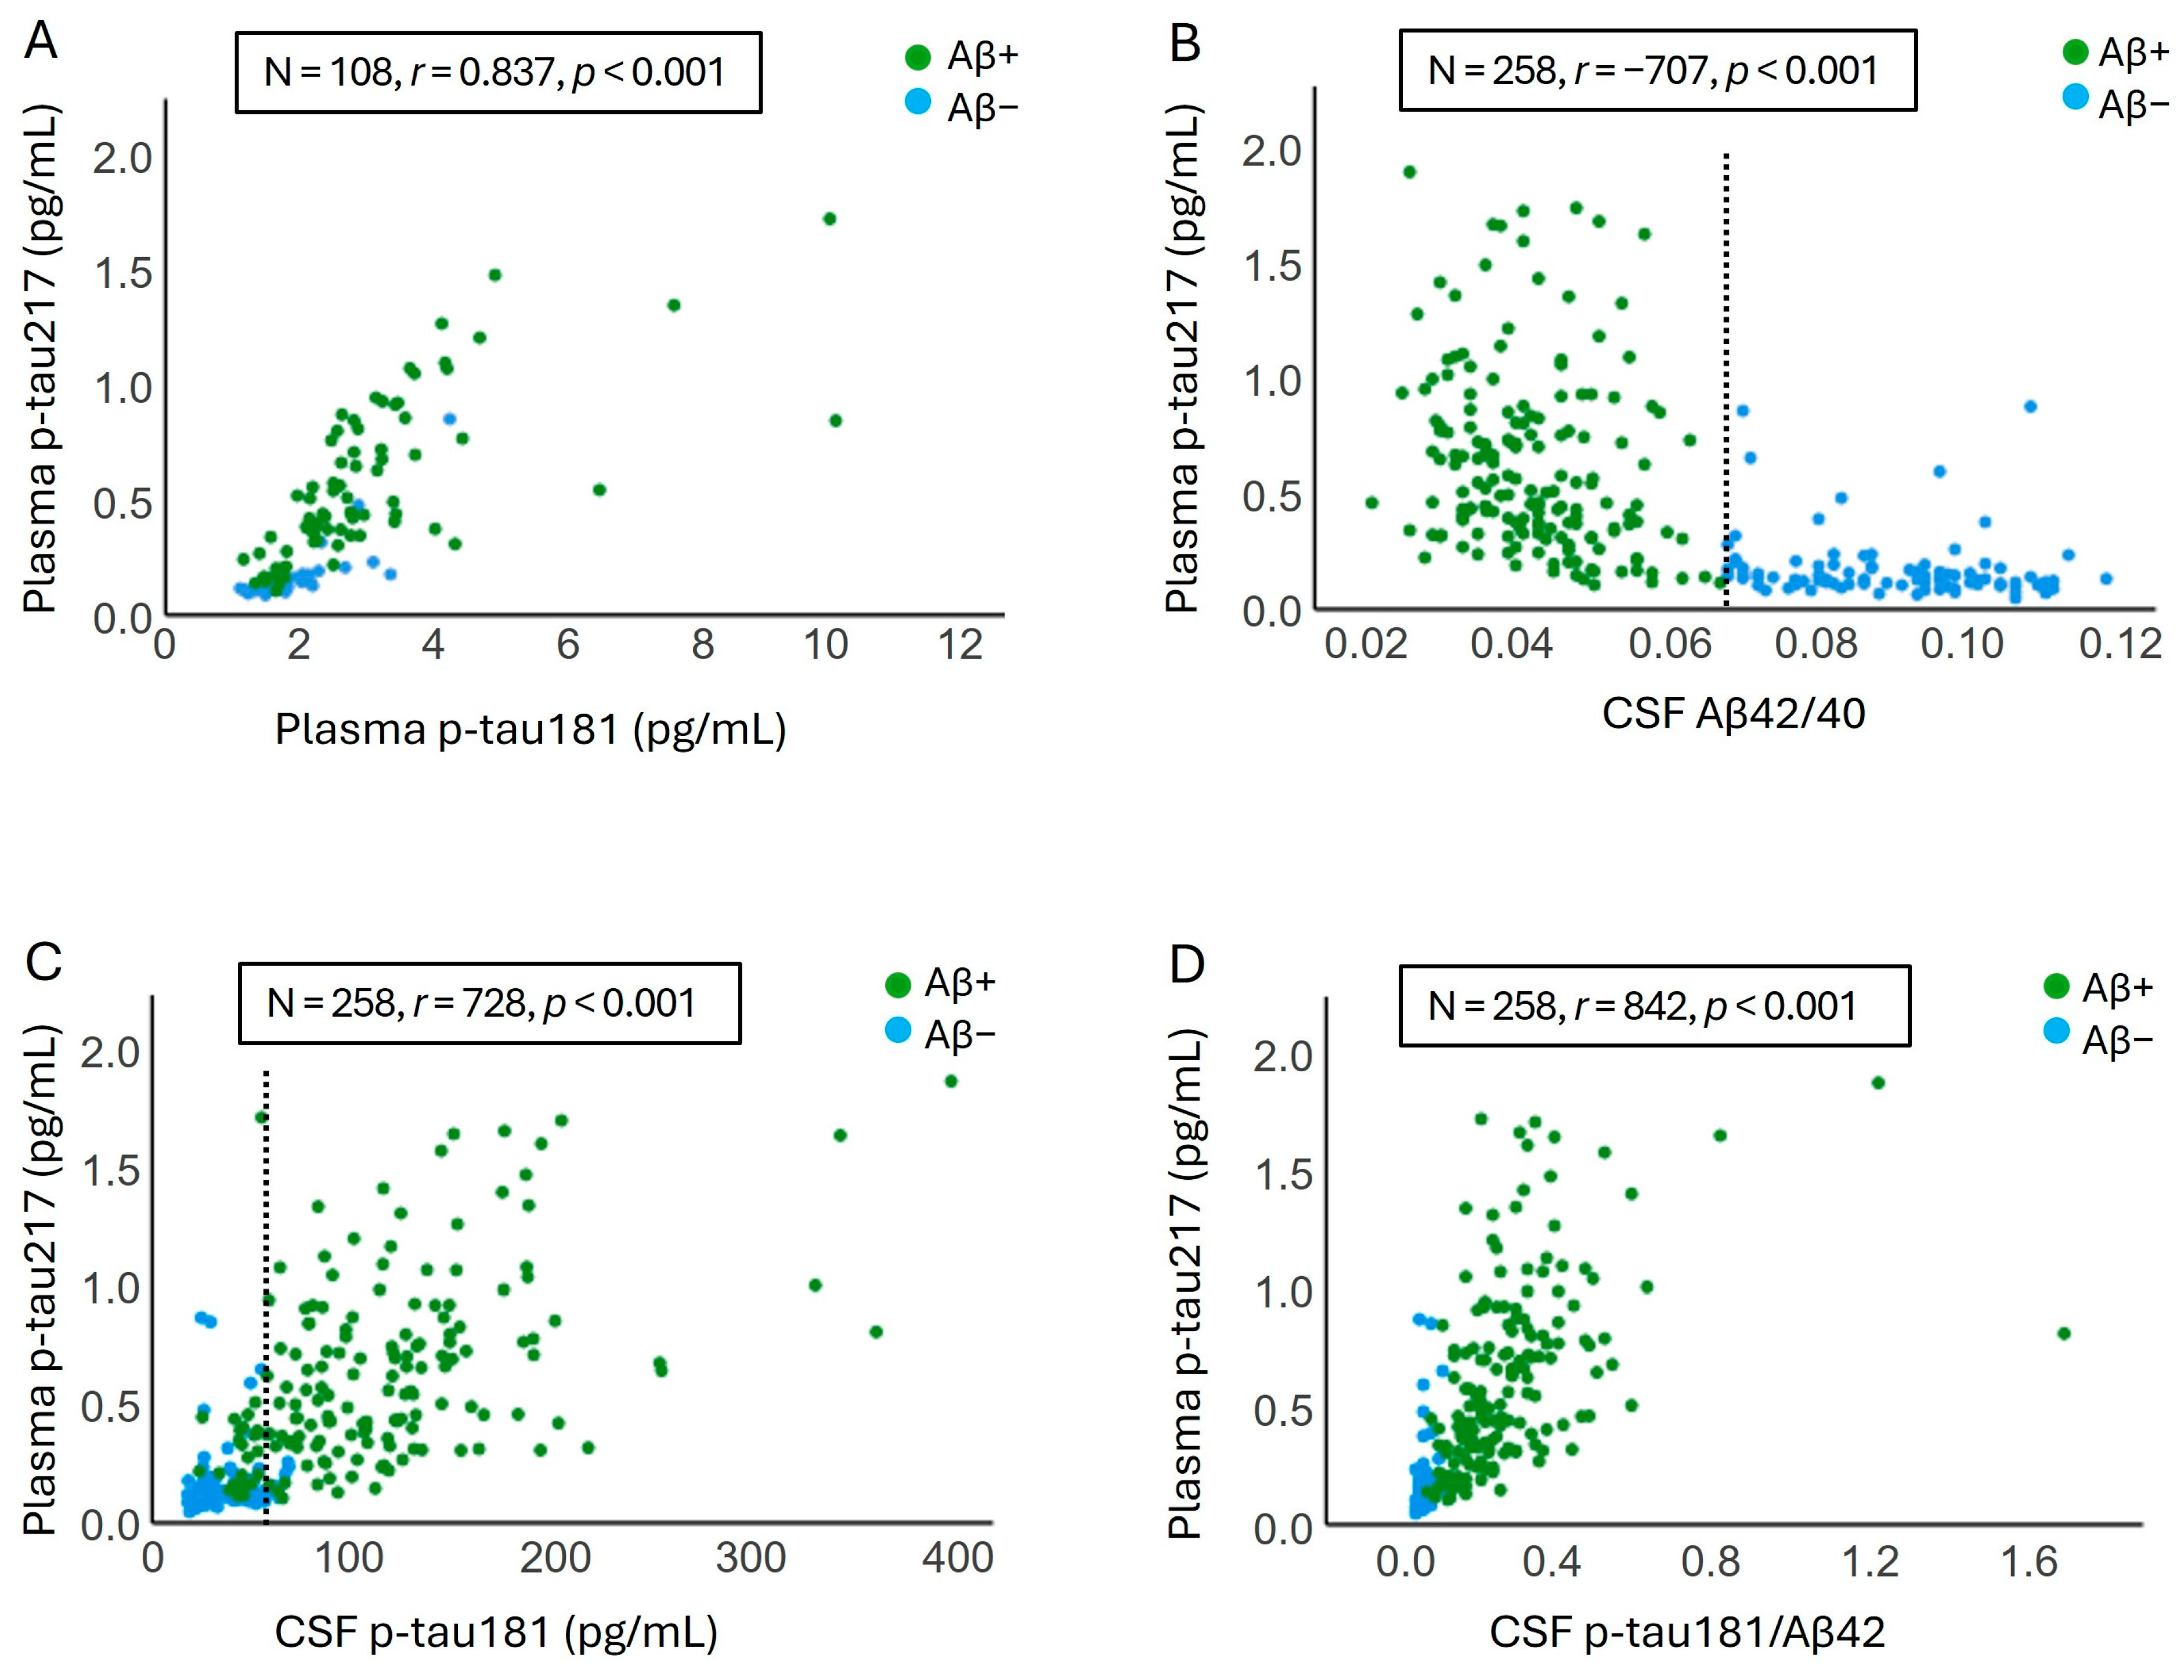
2.2. Correlation Between Plasma Levels of p-tau217 and Other Plasma and CSF AD Biomarkers Levels

To evaluate the correlations between CSF and plasma AD biomarkers, we performed Spearman’s rank correlation analysis. The correlation coefficient (r) between plasma p-tau217 and plasma p-tau181, CSF Aβ42/40, CSF p-tau181, and CSF p-tau181/Aβ42 were 0.837, −0.707, 0.728, and 0.842, respectively (p < 0.001) (Figure 1). The correlations between p-tau217 and all CSF and plasma AD biomarkers are presented in Supplementary Table S2. In addition, we examined whether the strength of the correlation between plasma p-tau217 and CSF AD biomarkers, particularly Aβ42/40, differs between male and female participants and between carriers and non-carriers of APOE ε4 allele. Our analysis, adjusted for age, APOE ε4, and estimated glomerular filtration rate (eGFR), showed that male participants exhibited a slightly stronger correlation between plasma p-tau217 and CSF Aβ42/40 (r = −0.725, p < 0.001, N = 94) compared to female participants (r = −0.620, p < 0.001, N = 140). Conversely, in female participants, the correlation between plasma p-tau217 and CSF p-tau181 (r = 0.718, p < 0.001, N = 140) and t-tau (r = 0.665, p < 0.001, N = 140) were stronger than those observed in males (r = 0.641 for p-tau181 and r = 0.498 for t-tau, p < 0.001, N = 94) (Supplementary Table S3). Furthermore, APOE ε4 non-carriers exhibited a stronger correlation between plasma p-tau217 and all CSF AD biomarkers, particularly the Aβ42/40 ratio (r = −0.731, p < 0.001, N = 142), compared to APOE ε4 carriers (r = −0.466, p < 0.001, N = 92) (Supplementary Table S4).

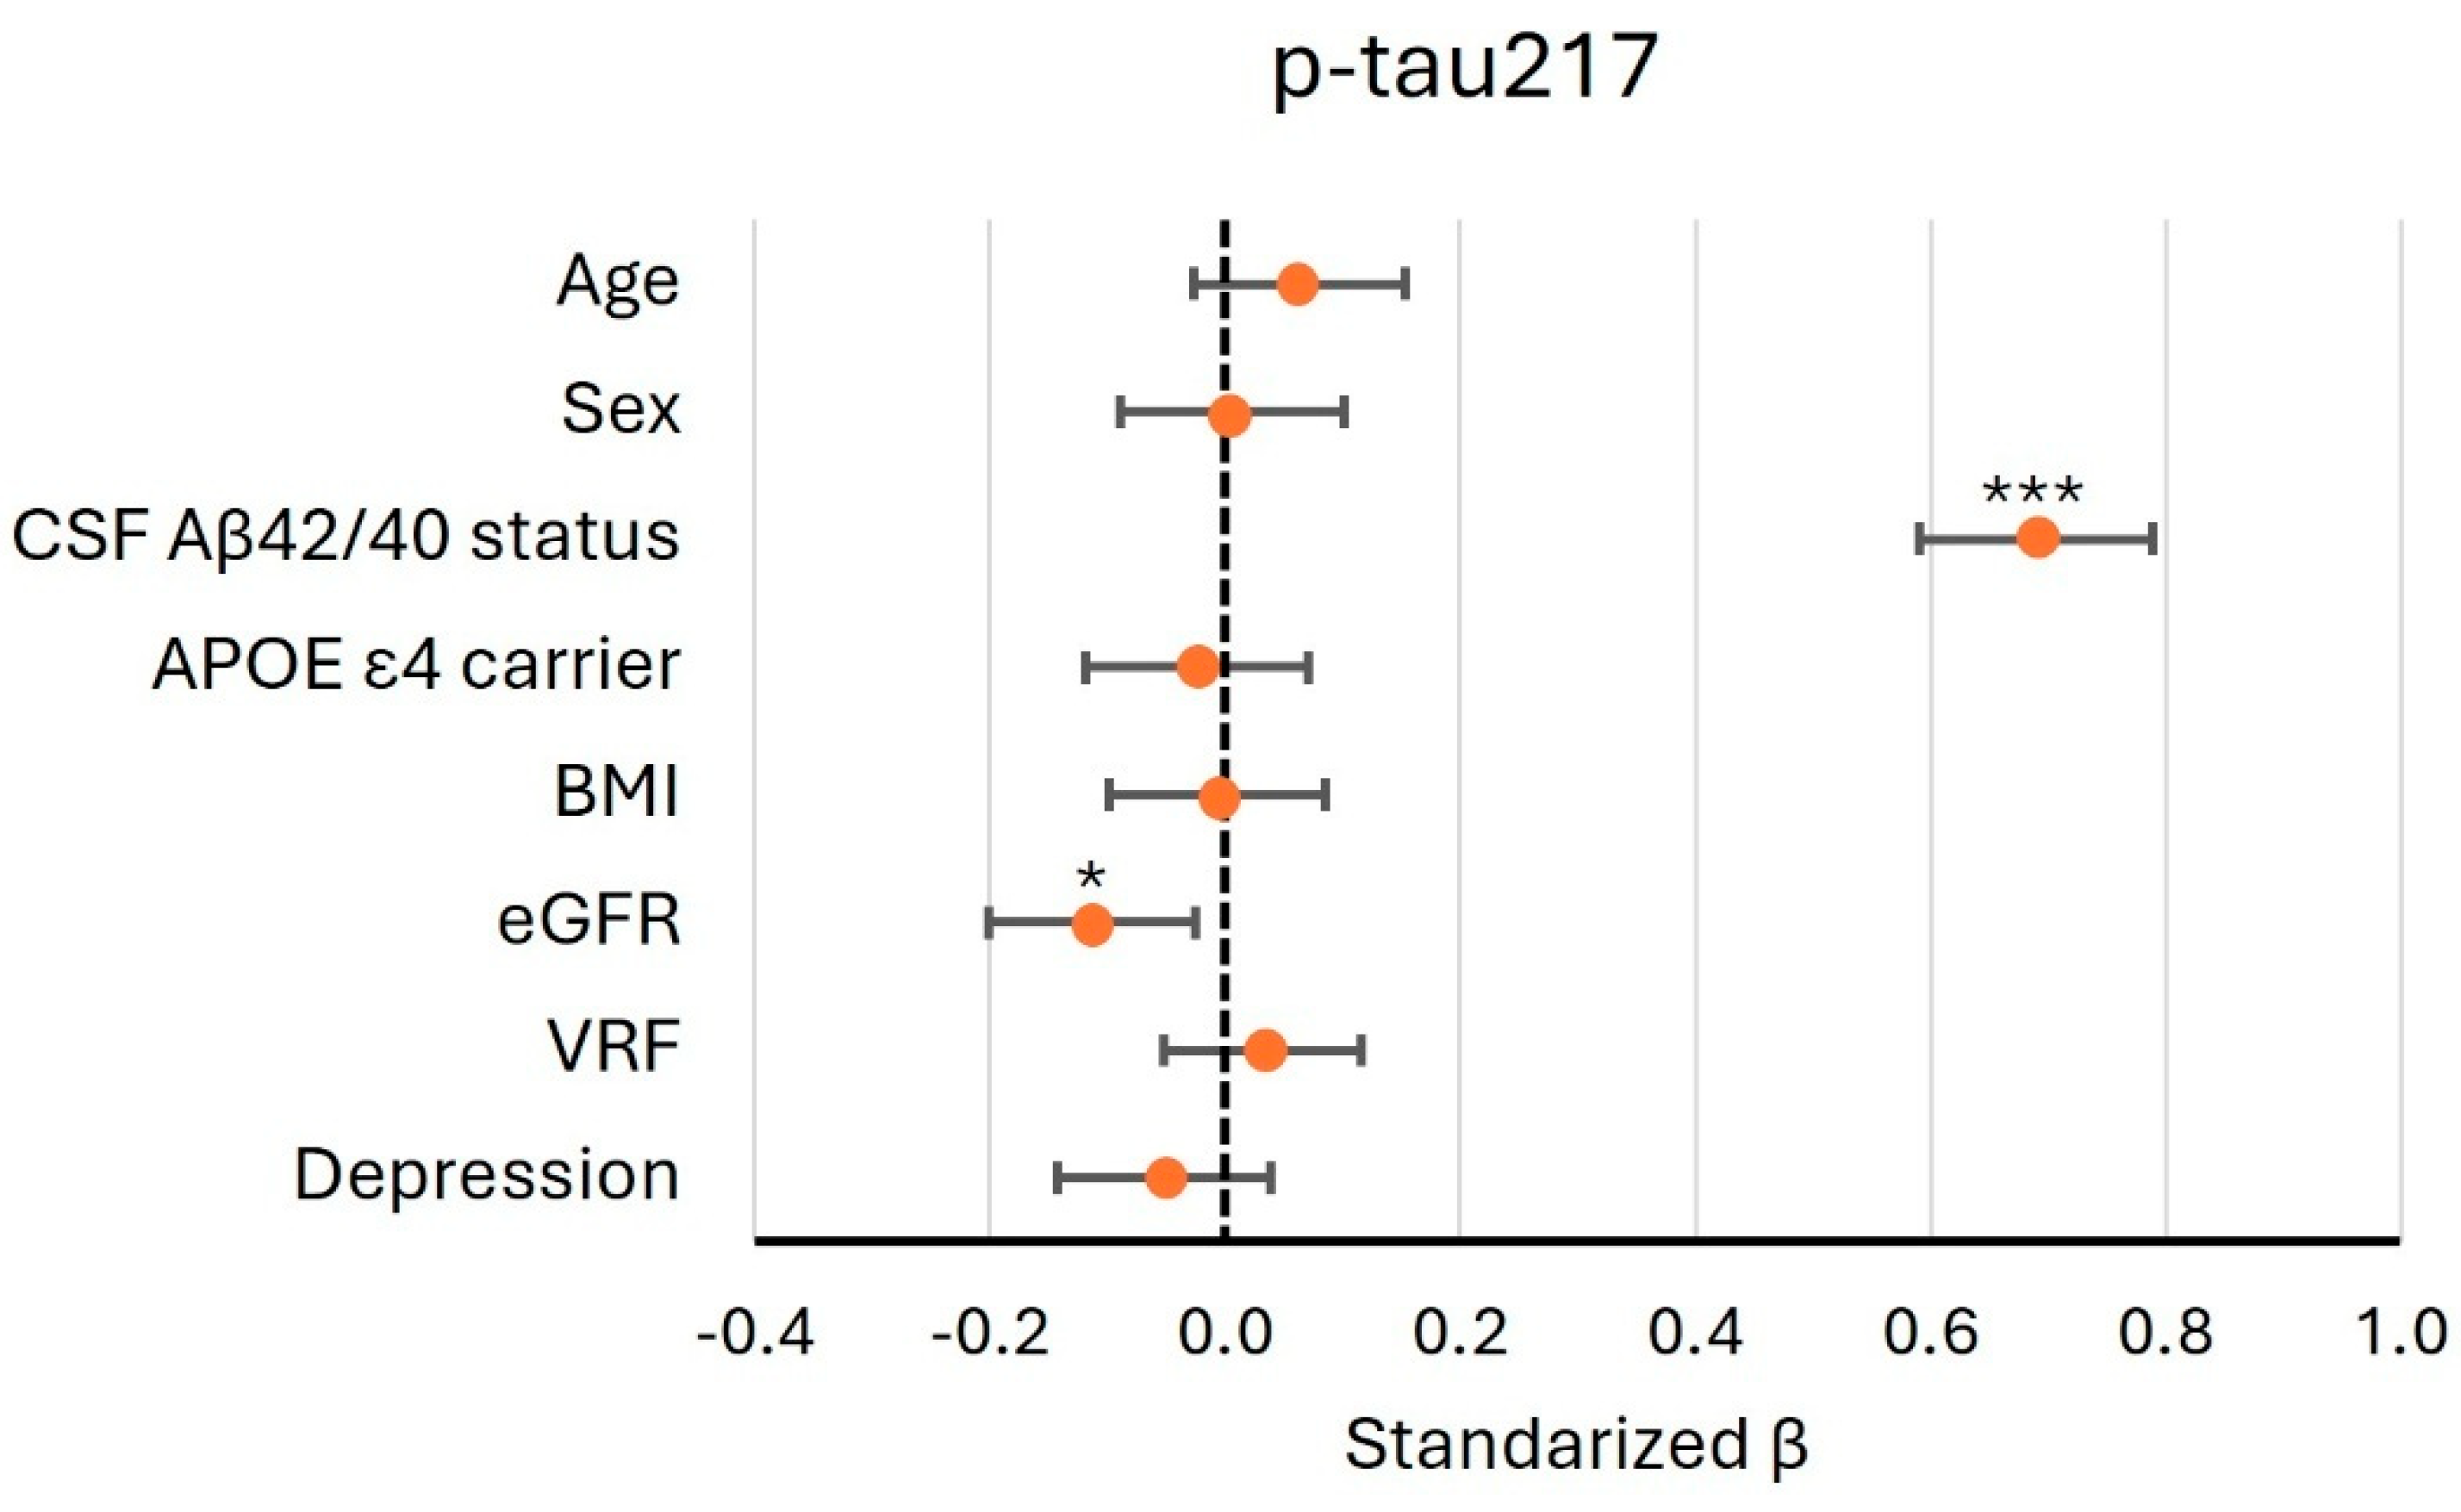
2.3. Identifying the Factors That May Influence Plasma Levels of p-tau217

Using a multivariate model, we assessed whether demographic data, analytical variables, and common AD comorbidities influence log-transformed plasma p-tau217. Vascular risk factor (VRF) was considered positive if the subject had hypertension, diabetes mellitus, and/or dyslipidemia. The renal function was measured using eGFR. All the presented coefficients seen in Figure 2 were obtained from the model, including all the listed variables. As shown, among the variables examined, CSF Aβ42/40 positivity (β = 0.690, 95% CI 0.3591–0.789, p < 0.001) had the largest effect on plasma p-tau217. In addition, reduced renal function was associated with higher levels of p-tau217 (β = −0.113, 95% CI: −0.201 to −0.025, p = 0.012). The model had an adjusted R2 value of 0.503.
We also evaluated the effect of the same variables on plasma levels of p-tau181 (N = 126). In this case, in addition to CSF Aβ42/40 positivity with the largest effect (β = 0.530, 95% CI 0.385–0.674, p < 0.001) and the renal function (β = −0.187, 95% CI: −0.350 to −0.023, p = 0.026), the presence of the APOE ε4 allele was also related to the plasma levels of p-tau181 (β = −0.250, 95% CI: − 0.406 to −0.095, p = 0.002) (Supplementary Figure S1).

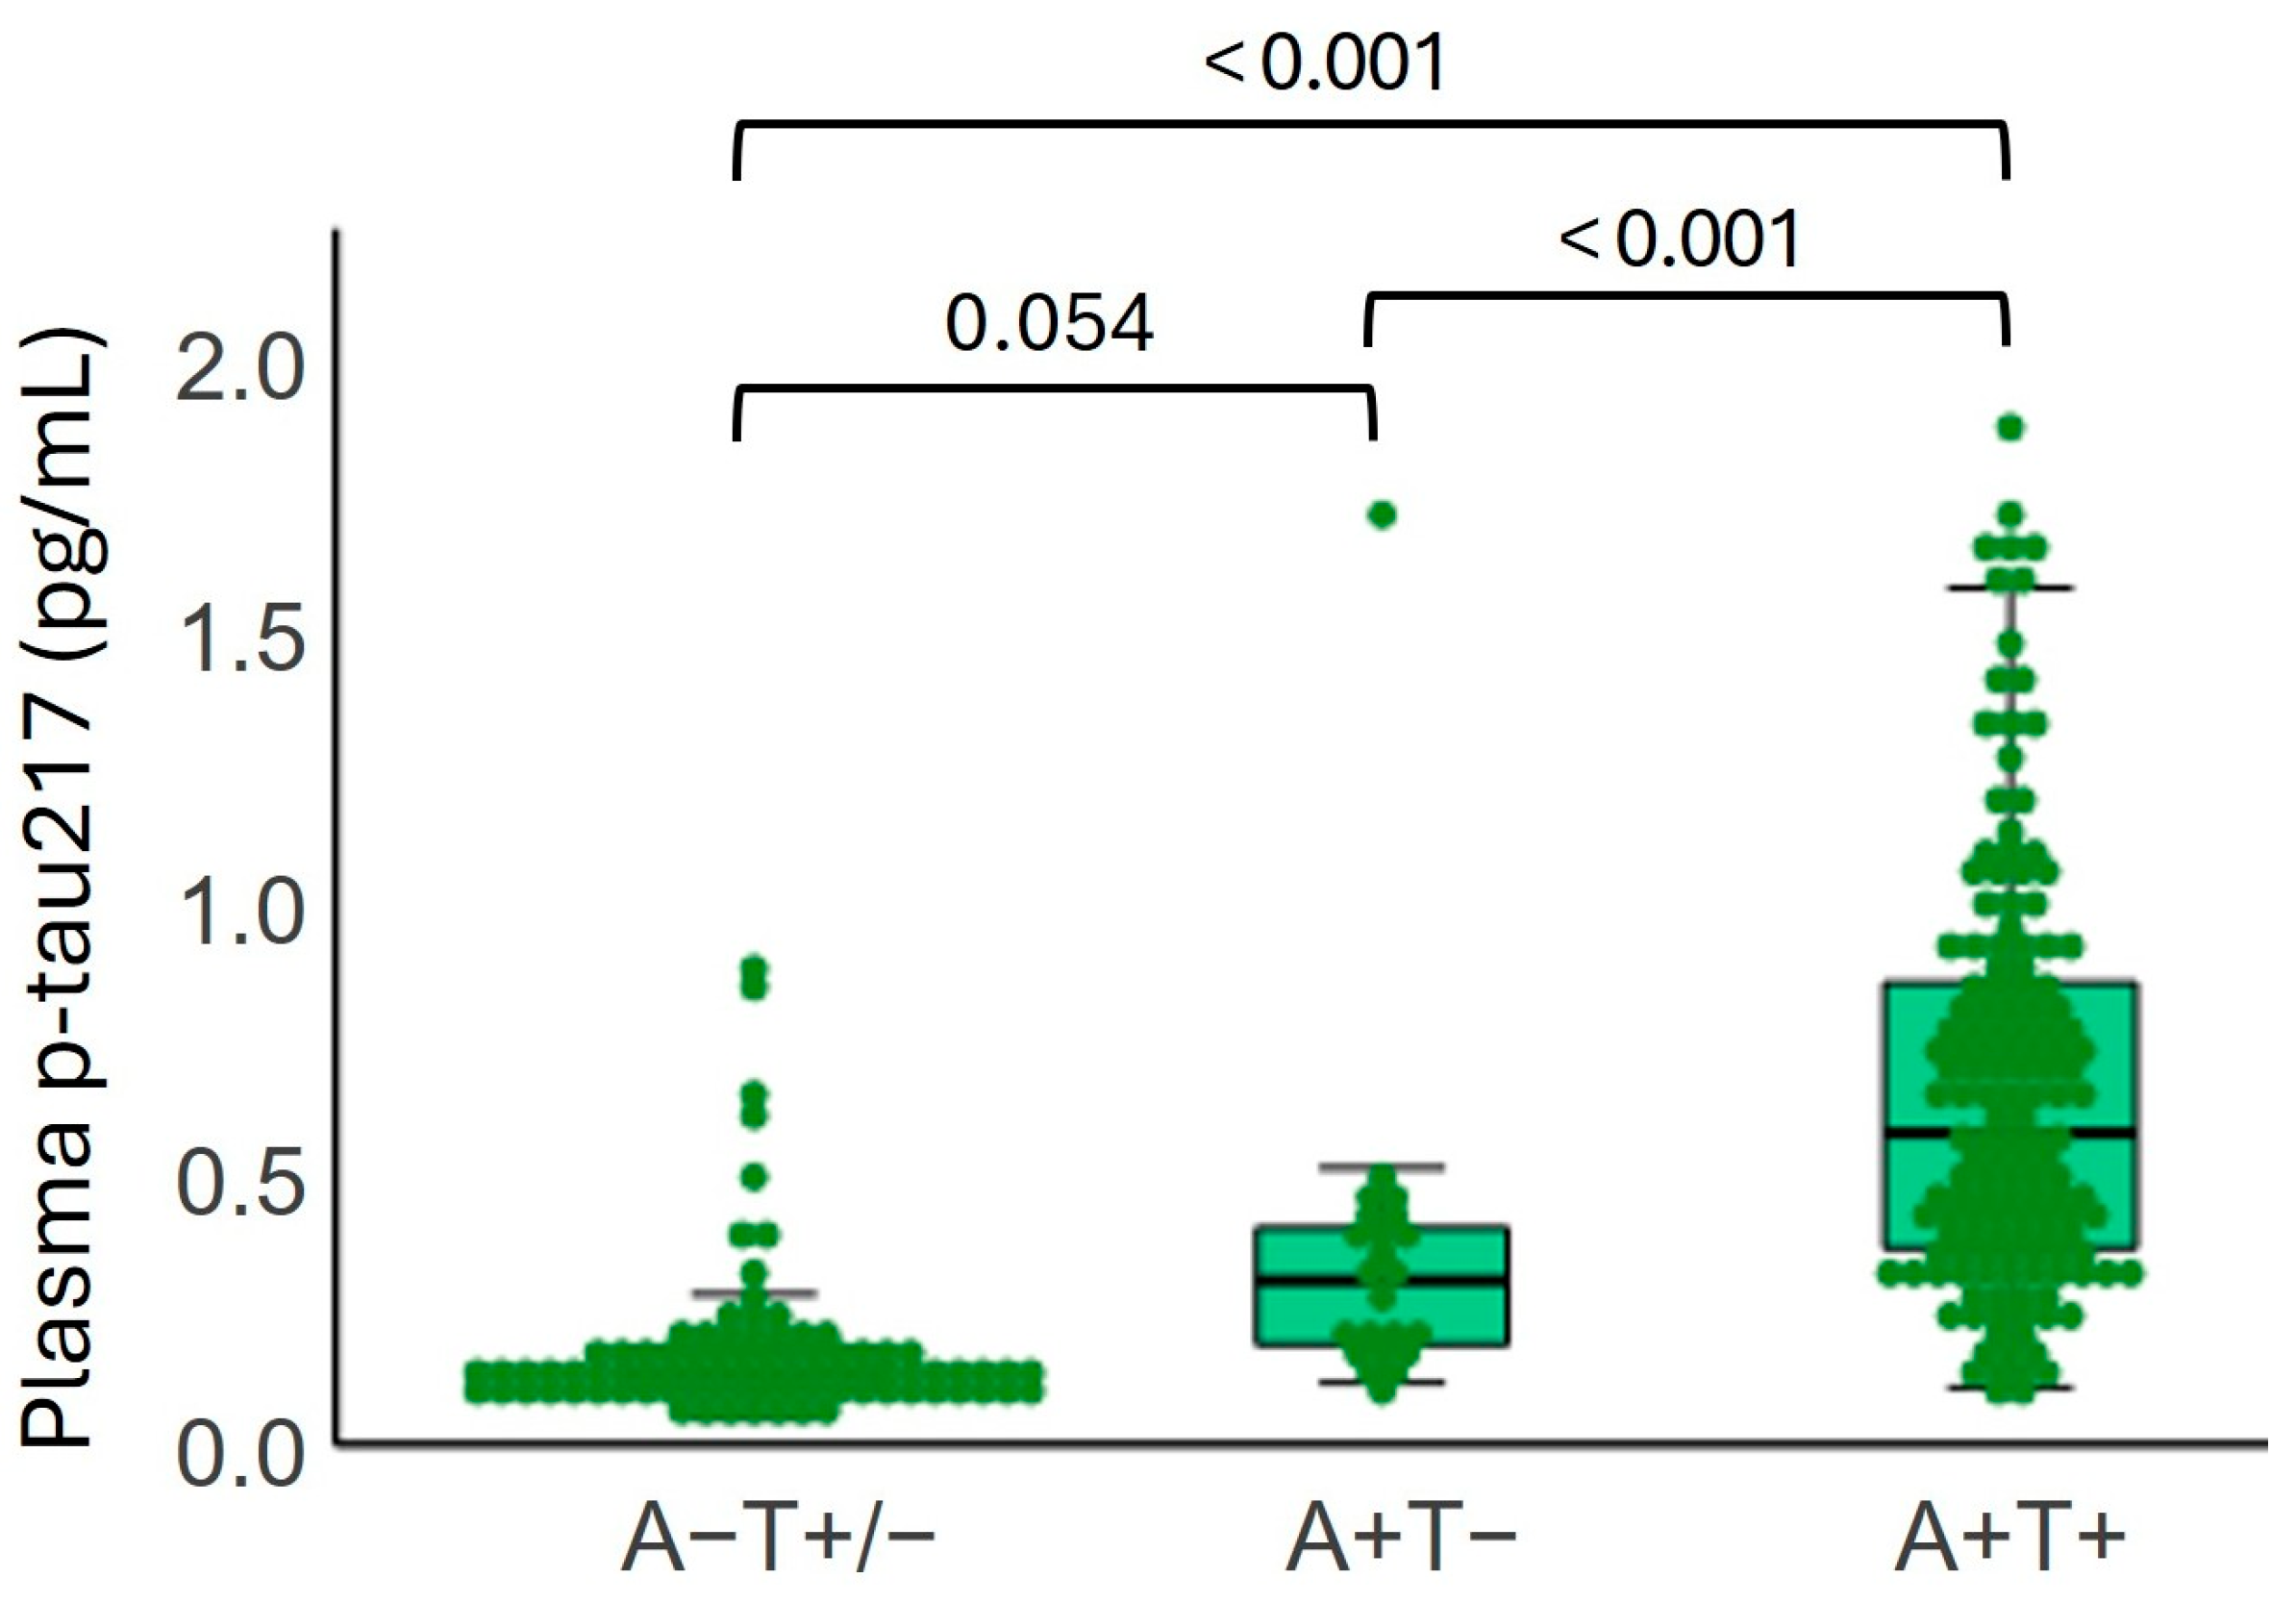
2.4. Plasma p-tau217 Levels by Amyloid and Tau Status in CSF

To assess whether plasma p-tau217 levels are associated with AD-related pathology, participants were stratified based on their CSF Aβ42/40 (A) and p-tau181 (T) status, independent of clinical diagnosis. Plasma p-tau217 concentrations differed significantly among the A − T +/− (N = 88), A + T − (N = 23), and A + T + (N = 147) groups (p < 0.001) (Figure 3), with the highest levels observed in the A + T + and lowest in the A − T +/− group. Mean (SD) plasma p-tau217 levels were 0.143 (0.143) pg/mL in the A − T +/− group, 0.281 (0.312) pg/mL in the A + T −, and 0.55 (0.398) pg/mL in the A + T+ group.

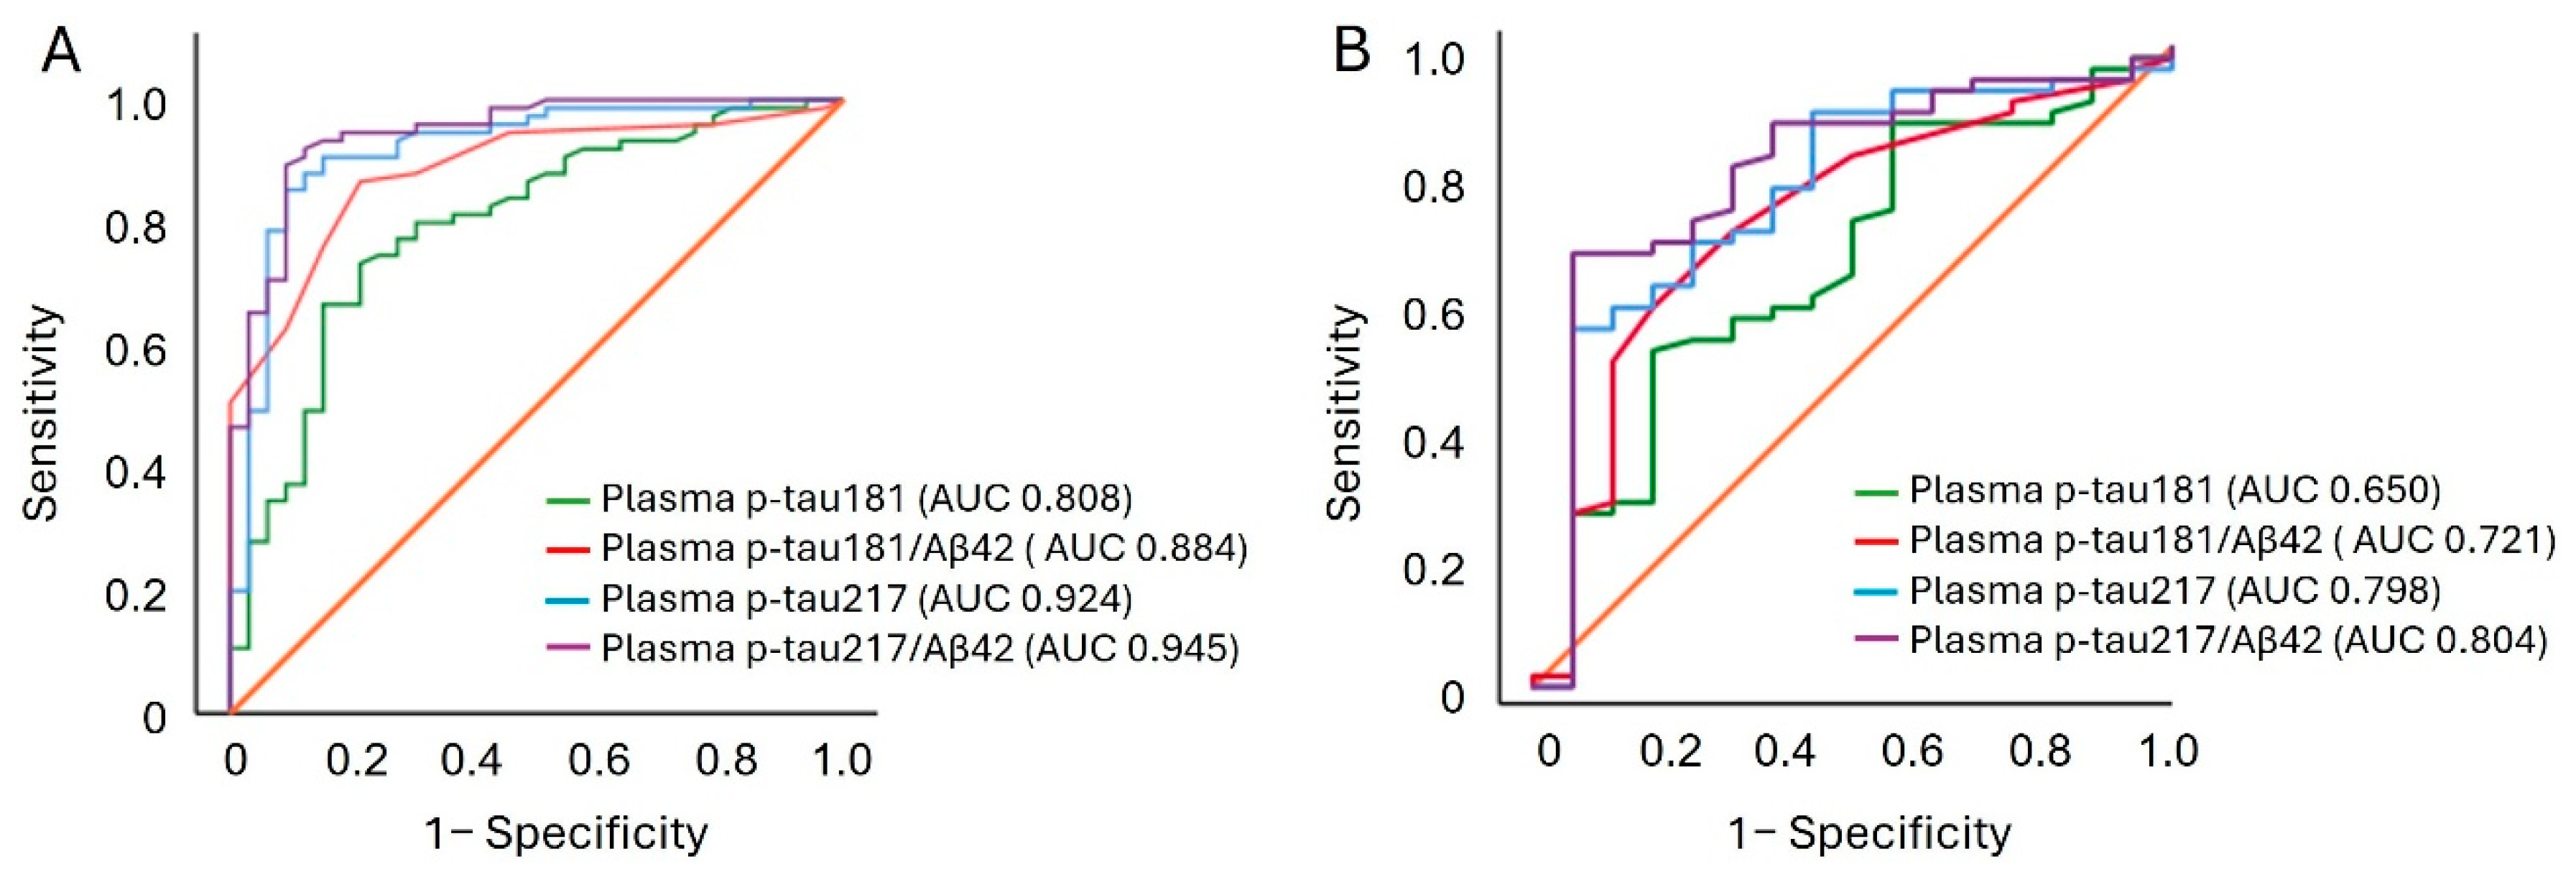
2.5. Accuracy in Discriminating Abnormal Amyloid and Tau Pathologies

To assess the ability of plasma p-tau217 to discriminate CSF Aβ42/40 positive from negative individuals, a binary logistic regression analysis was performed. Our analysis demonstrated that plasma p-tau217 levels have strong discriminative power in distinguishing CSF Aβ42/40 positive from negative individuals (AUC 0.924 95% CI 0.889–0.960), outperforming other plasma biomarkers. p-tau217/Aβ42 ratio yielded a similar classification performance as p-tau217 (Table 2, Figure 4A). In addition, among patients with positive state of CSF Aβ42/40, p-tau217 and p-tau217/Aβ42 showed similar accuracies for abnormal CSF p-tau181 (AUC 0.798, 95% CI 0.701−0.894 and AUC 0.804, 95% CI 0.675−0.933, respectively), which was higher compared with other plasma AD biomarkers (Table 3, Figure 4B).

2.6. Relationship Between Plasma Levels of p-tau217 and Longitudinal Changes in Cognition

To evaluate the relationship between plasma levels of AD biomarkers and the cognitive state of our study population, we conducted two analyses. First, we assessed the linear relationship between plasma levels of biomarkers and the baseline MMSE using Spearman’s rank correlation. Our analyses revealed that among the AD plasma biomarkers, only p-tau217 (r = −0.314, p < 0.001, N = 251) (Figure 5A) and p-tau217/Aβ42 (r = −0.200, p < 0.038, N = 108) were significantly correlated with MMSE. Based on these findings, we further examined the effect of plasma p-tau217 on cognitive changes, specifically the difference in MMSE between the baseline and the final visit. Our results indicated that plasma p-tau217 significantly moderated pre-post changes in MMSE (2, 70) = 13.995, p < 0.001), with higher plasma p-tau217 levels being associated with a more pronounced reduction in MMSE (Figure 5B). Classifying participants into three groups based on plasma p-tau217 level percentiles yielded consistent results. The moderating effect of p-tau217 on changes in the MMSE over time was strongest in participants with high levels of p-tau217 (t (70) = 7.905, p < 0.001), followed by those with intermediate levels (t (70) = 2.694, p = 0.009). This effect was not observed in participants with low levels of p-tau217 (t (70) = 1.061, p = 0.293).

2.7. Determining the Predictive Power of Plasma Biomarkers Regarding MCI to AD Progression

After observing that plasma p-tau217 can significantly moderate longitudinal cognitive changes, we evaluated the predictive performance of this biomarker for identifying individuals at risk of progressing from MCI to AD. Among the MCI subjects, 81 were followed up for a mean duration of 4.7 years (SD = 1.3) to assess their clinical progression to dementia. Of these, 45 (55.6%) progressed to dementia (41 to AD, 2 to bvFTD, and 1 to LBD), while 36 (44.4%) subjects did not progress. Our results showed that p-tau217 outperformed other plasma biomarkers in accurately predicting progression from MCI to AD. Additionally, the p-tau217/Aβ42 ratio did not enhance the predictive power of this biomarker (Table 4).

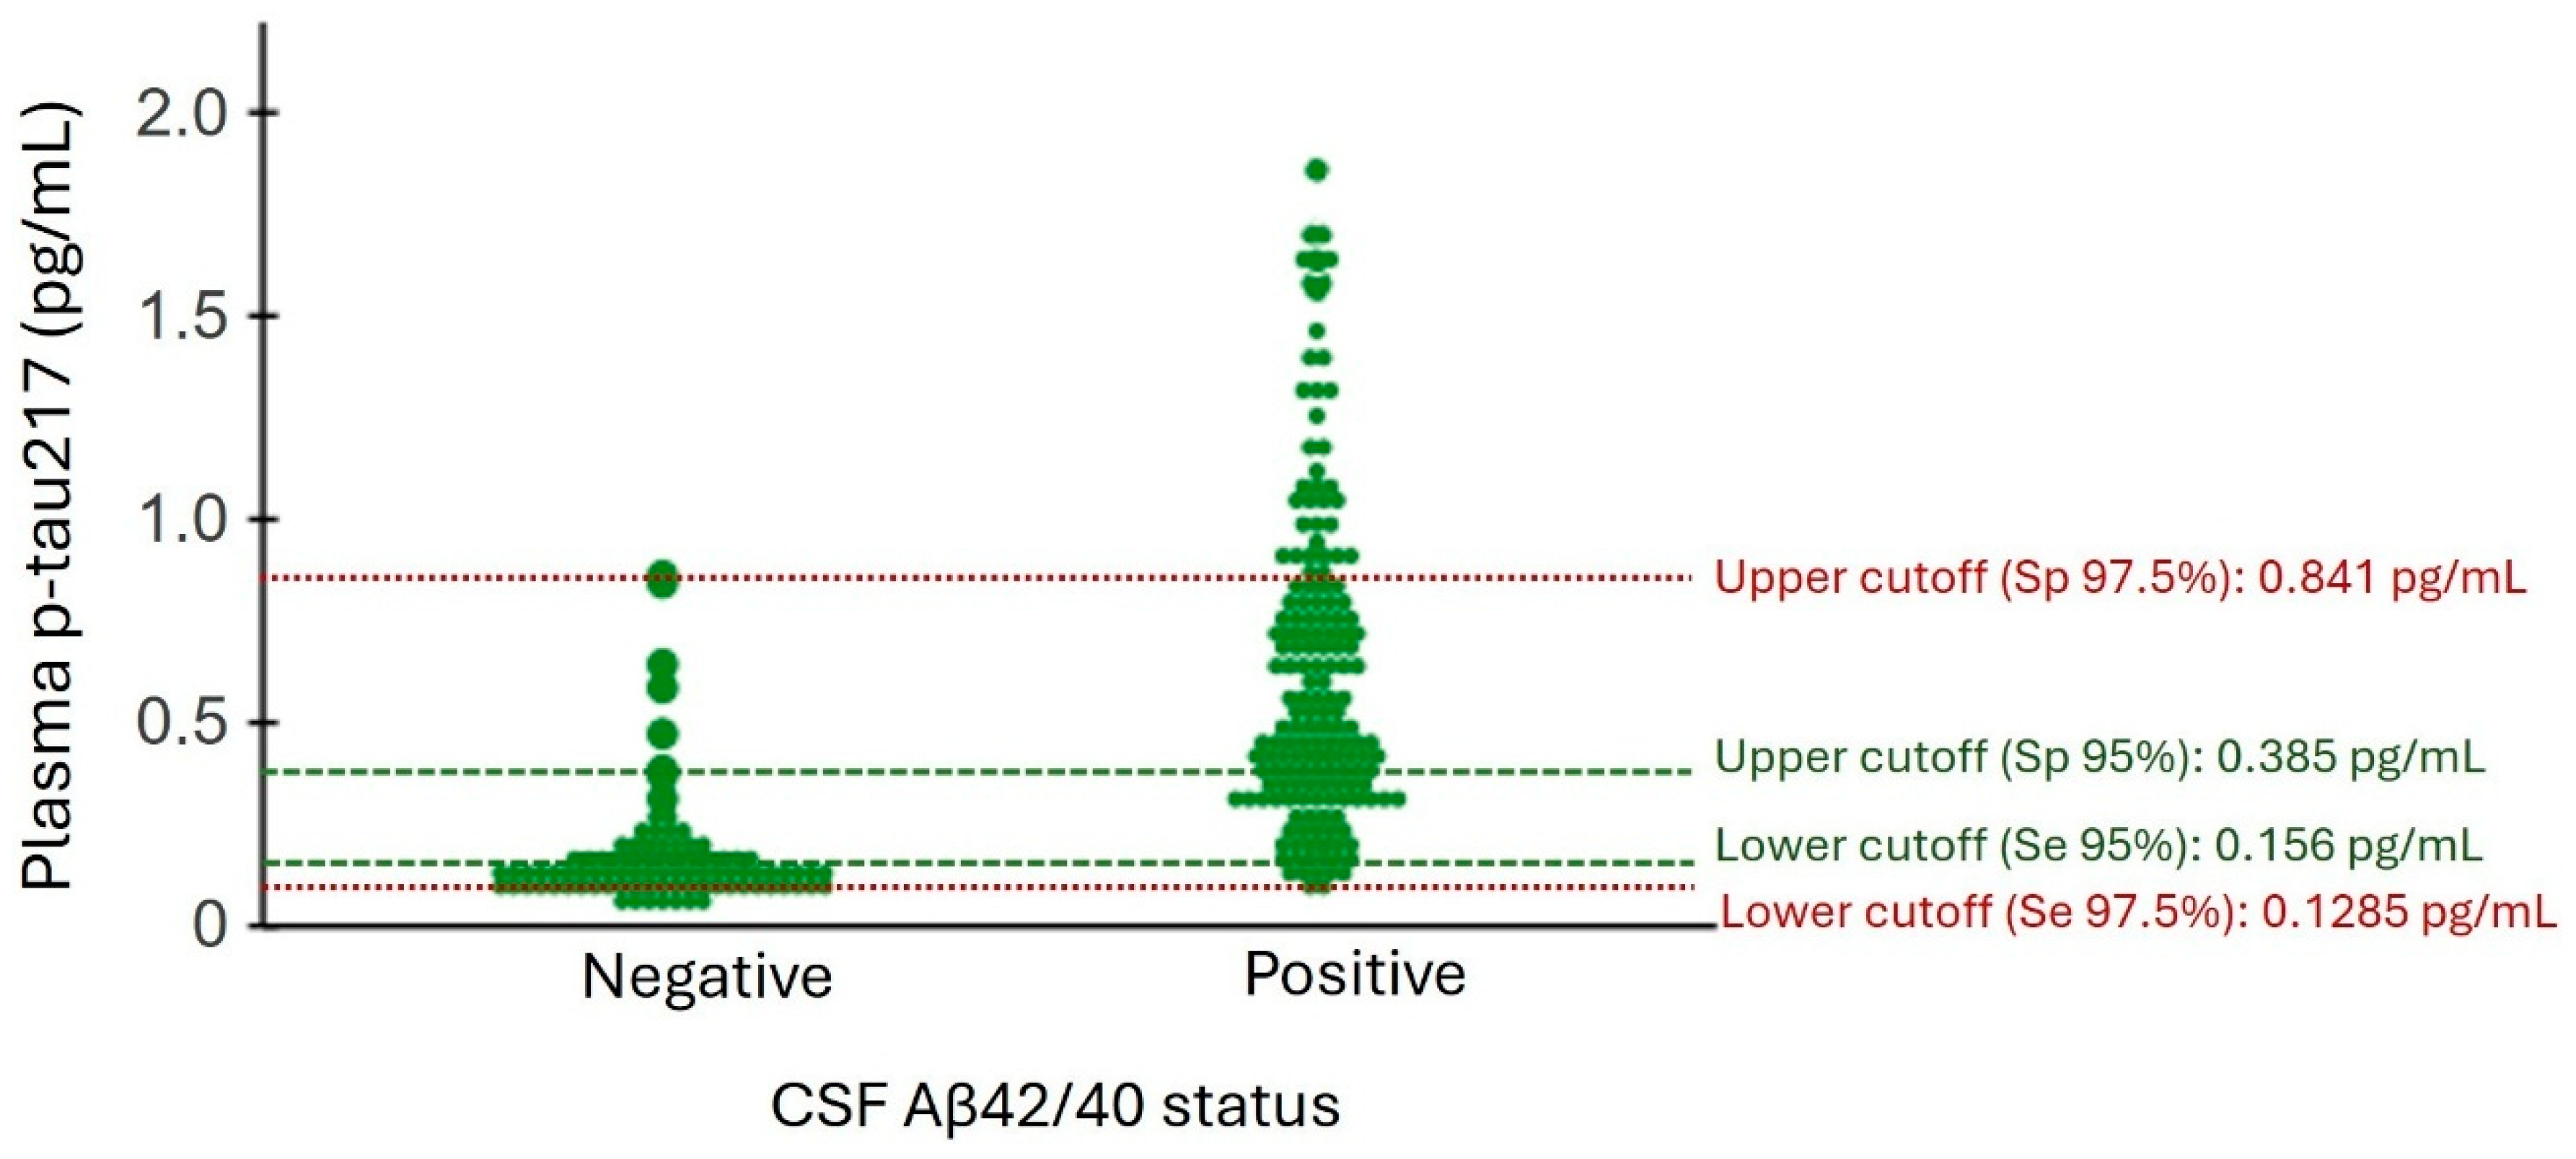
2.8. Reference Ranges for Plasma p-tau217 Based on CSF Aβ42/40 Status

We first determined a binary reference point for p-tau217 based on CSF Aβ42/40 positivity. In this case, the reference point ≥0.237 pg/mL for p-tau217 was the value that yielded the maximum Youden index versus CSF Aβ42/40 status. The overall percent agreement OPA was 87.9% (Table 5). At the next step, we applied a three-range approach to determine the lower (95% or 97.5% sensitivity, p-tau217 < 0.156 pg/mL or <0.1285 pg/mL, respectively) and upper (95% or 97.5% specificity, ≥0.385 pg/mL or ≥0.841 pg/mL, respectively) reference points for p-tau217 (Table 5, Figure 6). This approach improved the OPA for p-tau217 (Table 5).

3. Discussion

In this study, we evaluated the diagnostic and prognostic performance of plasma AD biomarkers in a memory clinic cohort of patients with MCI, AD, and non-AD dementia using commercially available Lumipulse G assays. Our results indicated that plasma p-tau217 has a high correlation with CSF Aβ42/40, p-tau181, p-tau181/Aβ42, and t-tau/Aβ42 and plasma p-tau181. Among plasma biomarkers, p-tau217, p-tau181, and their ratio with Aβ42 demonstrated high accuracy in discriminating patients with abnormal amyloid pathology in CSF. However, p-tau217 outperformed other plasma biomarkers in accurately distinguishing the presence of tau pathology in CSF among Aβ-positive individuals. Additionally, among plasma AD biomarkers, only p-tau217 significantly correlated with the measurement of cognition by MMSE. The higher levels of this biomarker in plasma were associated with a more pronounced reduction in MMSE over time. p-tau217 also had a better performance in predicting MCI to AD progression compared to other plasma biomarkers. In all analyses, the performance of p-tau217/Aβ42 was equivalent, but not superior to p-tau217. A lenient three-range reference points (95% sensitivity and specificity) indicated that the use of plasma p-tau217 as a diagnostic biomarker in our memory clinic can reduce the number of lumbar punctures by nearly 72%, while applying more restrictive cutoffs (97.5% sensitivity and specificity) reduces this number to 40%.
The performance of plasma biomarkers quantified using different analytical platforms to detect AD pathology has been assessed in previous studies [18,24,25,26,27,28]. Nearly all studies consistently report that plasma p-tau217 outperforms other plasma markers in detecting amyloid brain pathology, whether identified via CSF analysis or PET imaging. In line with these previous findings, our analysis also showed that plasma p-tau217 surpassed other plasma biomarkers in detecting amyloid pathology in CSF. Importantly, plasma p-tau217 was not outperformed by p-tau217/Aβ42, further supporting its potential as a reliable single biomarker.
Consistent with previous findings [18,21], we observed that among Aβ-positive individuals, the p-tau217 assay demonstrated greater accuracy in detecting tau pathology compared to other plasma biomarkers. This is especially important because anti-Aβ treatments may have limited efficacy in patients with advanced tau pathology [29]. Therefore, the p-tau217 assay could help identify patients who are more likely to benefit from such treatments.
The extent to which plasma p-tau217 concentrations could be affected by subject health condition, genetic, or demographic data is a critical issue, as it could lead to misdiagnosis. For instance, some previous studies have shown that chronic kidney disease can affect plasma p-tau217 levels and have found negative associations between eGFR and this biomarker [30,31]. For this reason, we evaluated the effect size of Aβ positivity on plasma p-tau217 in the presence of common AD comorbidities (VRF and depression), APOE ε4, body mass index (BMI), and eGFR. Our analysis showed that, when accounting for all these variables, Aβ positivity had the largest effect on plasma p-tau217 (β = 0.690). In addition, eGFR had a significant negative effect on p-tau217 (β = −0.113), although its impact was much smaller than that of Aβ positivity, consistent with findings from previous studies [25,26]. Importantly, prior evidence indicates that chronic kidney disease does not affect the accuracy of plasma p-tau217 in detecting abnormal AD pathology identified in CSF [32]. Nevertheless, this association should be carefully considered, particularly in patients with severe kidney disease.
In contrast, for p-tau181, the variables with significant effect were Aβ positivity, APOE ε4, and eGFR. Specifically, the presence of the APOE ε4 allele was associated with lower plasma p-tau181 levels. While some previous studies in cognitively healthy older adults have reported higher plasma p-tau181 in APOE ε4 carriers compared to non-APOE ε4 carriers [33], no such difference was observed between APOE ε4 carriers and non-carriers among patients on the AD continuum [34,35]. Therefore, these discrepancies in the relationship between APOE ε4 and p-tau181 may be partly attributable to differences in the study populations and the degree of cognitive impairment.
In addition to determining the diagnostic utility, we also assessed the prognostic performance of plasma p-tau217 in predicting MCI to AD progression and the rate of cognitive decline. Plasma p-tau217 outperformed other plasma biomarkers in predicting MCI to AD progression. Among the plasma biomarkers, only p-tau217 and p-tau217/Aβ42 showed a significant correlation with baseline cognitive status as measured by the MMSE, with the correlation being stronger for p-tau217 than for the ratio. Additionally, plasma p-tau217 moderated longitudinal changes in cognition, as the participants with higher p-tau217 levels experienced a faster rate of cognitive decline compared to those with lower levels of this biomarker. Consistent with our observations, some earlier studies have also demonstrated the utility of plasma p-tau217 in predicting cognitive decline [17,19,28] and conversion to AD dementia [36].
The prevalence of Aβ pathology varies according to age, severity of clinical symptoms, race and/or ethnicity, sex, and APOE genotype [37]. Consequently, blood concentrations of p-tau217, as the best blood biomarker of brain Aβ pathology, are likely influenced by these factors. Therefore, it is reasonable for each center to establish its own cutoffs based on the characteristics of its cognitively impaired population.
In this study, we first determined a binary cutoff for p-tau217 to assess its accuracy in detecting CSF Aβ pathology, based on recently published criteria requiring a minimum accuracy of ≥90% [37]. Our analysis showed that a single cutoff for p-tau217 (≥0.2375 pg/mL, accuracy = 87.9%) did not meet this threshold. Given the limited accuracy of a single reference point—largely because 5–20% of individuals present borderline Aβ pathology—it is highly recommended to use two cutoffs to define three categories of results: positive, intermediate, and negative. We tested two three-range strategies: a lenient one with 95% sensitivity and specificity, and a restrictive one with 97.5% sensitivity and specificity. The lenient cutoffs yielded better results, achieving high positive and negative percent agreements (PPA and NPA) of 95.7% and 88.4%, respectively, with only 27% of individuals falling into the intermediate-risk group requiring confirmatory or follow-up testing. In contrast, the restrictive strategy placed about 61% of the study population in the intermediate zone.
Of note, our higher reference point (0.385 pg/mL) closely matched values reported in previous studies conducted in Spain (0.388 pg/mL in [26]; and 0.354 pg/mL in [25]) involving memory clinic cohorts. However, our lower reference point (0.156 pg/mL) differed somewhat from those studies (0.186 pg/mL in [26]); and (0.185 pg/mL in [25]). This discrepancy may stem from differences in the studied cohort characteristics, which, as mentioned earlier, can influence brain Aβ pathology levels and, consequently, plasma concentrations of p-tau217.
Our study has several strengths. First, we detected all CSF and plasma biomarkers using commercially available automated Lumipulse G assays. This platform is already present in many clinical settings, and therefore, our results may facilitate the clinical implementation of this biomarker. Second, the personnel who quantified the biomarkers and analyzed the data were blinded to the clinical information. Third, since the clinical use of blood biomarkers is currently intended for the evaluation of symptomatic individuals rather than cognitively unimpaired ones, we included only individuals with objective memory impairment in our study. Consequently, our study population is representative of those who would require a blood test to evaluate the underlying cause of their cognitive deterioration in a memory clinic. However, our study has some limitations. The sample size was small, and blood biomarkers other than p-tau217 were not quantified for the entire study population. Additionally, the lack of pathophysiological confirmation or Aβ/tau PET imaging in our cohort may have affected our results.
Taken together, our results support the inclusion of plasma p-tau217 in the current diagnostic workup to reduce the need for more costly, invasive, and less accessible confirmatory tests, such as CSF analysis and PET imaging. Additionally, plasma p-tau217 shows promise as a prognostic indicator for future cognitive decline, supporting its role in patient monitoring and management.

4. Material and Methods

4.1. Study Population

A total of 276 patients, including 193 MCI, 56 AD, and 27 non-AD dementia patients, were included in this study. The non-AD dementia group included four vascular dementia, ten frontotemporal dementia, two Lewy body dementia, three mixed dementia, one tauopathy, two pharmacological Parkinsonism, one alcoholic dementia, and four unspecified dementia patients. The study population consisted of patients attending the Cognitive Disorders Unit at the Hospital Universitari Santa Maria (Lleida, Spain). The diagnosis of MCI or AD was performed based on the National Institute on Aging–Alzheimer’s Association (NIA-AA) criteria [38,39]. Each non-AD dementia patient fulfilled the specific diagnostic criteria for the disorder considered (e.g., frontotemporal dementia, Lewy body dementia, etc.) [40,41,42]. The inclusion criterion was the presentation of suspected cognitive dysfunction for which the neurologist at the memory unit requested CSF analysis. Therefore, patients with cognitive impairment caused by psychiatric problems or other conditions, such as stroke, brain tumor, and vitamin deficiency were excluded. Epidemiological data, including age, sex, family history of cognitive impairment, education, and comorbidities such as hypertension, diabetes mellitus, dyslipidemia, and depression, were collected through a structured interview conducted during the initial patient visit. Data on eGFR and BMI were also collected and included in the analysis. The included patients or their legal representatives signed an internal regulatory document stating that residual samples used for diagnostic procedures could be used for research studies without any additional informed consent. The study was conducted in accordance with the Declaration of Helsinki.

4.2. Sample Collection and Storage

CSF and plasma samples were collected between 8 a.m. and 10 a.m. after an overnight fast. CSF was collected in 10 mL polypropylene tubes (Sarstedt, Newton, NC, USA, 62.610.201). The tubes were inverted several times and centrifuged at 2000× g for 10 min at room temperature. The samples were aliquoted into two 2 mL polypropylene tubes (Sarstedt, 72.694.007), with each tube containing 1 mL of CSF. Blood samples were collected in EDTA-containing vacutainer tubes and centrifuged at 2000× g for 10 min at 4 °C to separate plasma and the buffy coat. All samples were aliquoted and immediately stored at −80 °C until use. Samples were obtained with support from IRBLleida Biobank (B.0000682) and Biobank and Biomodels Platform ISCIII PT23/00032.

4.3. Sample Analysis

The Lumipulse G600II automated platform (Fujirebio Europe NV, Gent, Brussels) was used to measure AD biomarkers in CSF and plasma. CSF biomarkers included Aβ42 (#230336), Aβ40 (#231524), p-tau181 (#230350), and total tau (#230312), while plasma biomarkers comprised Aβ42 (#81301), Aβ40 (#81298), p-tau181 (#81288), and p-tau217 (#81472). The following cut-offs for CSF biomarkers were determined by Fujirebio and used for data analysis: Aβ42 < 600 pg/mL, Aβ42/40 < 0.069, p-tau181 > 56.5 pg/mL, and t-tau > 400 pg/mL. The quantification ranges of plasma Aβ40, Aβ42, p-tau181, and p-tau217 were 0.44–5000 pg/mL, 0.43–1000 pg/mL, 0.261–60 pg/mL, and 0.03–10 pg/mL, respectively. The limit of detection (LOD) was 0.44 pg/mL for plasma Aβ40, 0.37 pg/mL for Aβ42, 0.052 pg/mL for plasma p-tau181, and 0.02 pg/mL for plasma p-tau217. The investigators involved in the sample analyses were blinded to the clinical diagnosis.

4.4. Statistical Analysis

Kruskal–Wallis and chi-square tests were used for analysis of quantitative and qualitative variables, respectively. The quantitative variables are presented as medians (25th percentile; 75th percentile), and the qualitative variables are presented as frequencies (percentage). To evaluate the correlation between plasma and CSF biomarkers, we used Spearman’s correlation coefficient (r). Generalized linear mixed model was employed to assess the effect of potential confounding variables on p-tau biomarkers. The diagnostic accuracy of each plasma biomarker for CSF Aβ42/40 positivity was evaluated using binary logistic regression analysis. For each biomarker, we calculated the area under the curve (AUC), sensitivity (percentage of correctly classified positive cases), specificity (percentage of correctly classified negative cases), positive percent agreement (PPA: correctly classified positive cases/[correctly classified positive cases + incorrectly classified negative cases]), negative percent agreement (NPA: correctly classified negative cases/[correctly classified negative cases + incorrectly classified positive cases]), and overall diagnostic accuracy (correctly classified positive and negative cases/total number of cases). The same diagnostic accuracy parameters were also calculated for each plasma biomarker in detecting CSF p-tau181 positivity among Aβ-positive individuals. For evaluating the effect of p-tau217 on cognitive deterioration over time, we applied a general linear mixed model with repeated measures in which the follow-up time was included as a covariate. To determine optimal cutoff values for plasma p-tau217, receiver operating characteristic (ROC) analyses were performed. First, a binary cutoff point for CSF Aβ42/40 positivity was determined using the Youden Index (sensitivity + specificity − 1). Additionally, two three-range reference thresholds were established: a lower cutoff to rule out AD (based on 95% [lenient] and/or 97.5% [restrictive] sensitivity), and an upper cutoff to rule in AD (based on 95% [lenient] and/or 97.5% [restrictive] specificity). All statistical analyses were conducted using SPSS software, version 25 (Armonk, NY, USA).

Supplementary Materials

The following supporting information can be downloaded at: https://www.mdpi.com/article/10.3390/ijms26146771/s1.

Author Contributions

Conceptualization, F.D., J.S. and G.P.-R.; Data curation, F.D., A.V.-F., N.M.-C. and J.S.; Formal analysis, F.D., R.L.-O. and J.S.; Investigation, F.D. and G.P.-R.; Methodology, F.D.; R.L.-O., N.T. and G.P.-R.; Resources, I.R.-L., M.R.-J., A.A., N.T. and G.P.-R.; Writing—original draft, F.D.; Writing—review and editing, F.D., R.L.-O., A.V.-F., N.M.-C., I.R.-L., M.R.-J., A.A., J.S. and G.P.-R. All authors have read and agreed to the published version of the manuscript.

Funding

GPR received funding from Diputació de Lleida (PIRS-2024-07), Instituto de Salud Carlos III and was cofunded by the European Union (ERDF/ESF, “Investing in your future” and “A way to build Europe”) (PI22/01687), and the Agency for the Management of University and Research Grants (2021SGR00761). IRBLleida is a CERCA Program of the Government of Catalonia. FD is an IREP-2023 postdoctoral Fellow.

Institutional Review Board Statement

The included patients or their legal representatives signed an internal regulatory document stating that residual samples used for diagnostic procedures could be used for research studies without any additional informed consent. The study was conducted in accordance with the Declaration of Helsinki.

Informed Consent Statement

Informed consent was obtained from all subjects involved in the study or from their legal representatives.

Data Availability Statement

The data reported in this manuscript are available within the article and/or its Supplementary Data. Additional data will be shared upon request by any qualified investigator.

Acknowledgments

We thank Fujirebio Europe NV for kindly providing some of the necessary reagents to perform the study. Nathalia Montero-Castilla was supported by a Colombian government predoctoral fellowship.

Conflicts of Interest

The authors declare that this research was conducted in the absence of any commercial or financial relationships that could be construed as potential conflicts of interest.

References

  1. Olsson, B.; Lautner, R.; Andreasson, U.; Öhrfelt, A.; Portelius, E.; Bjerke, M.; Hölttä, M.; Rosén, C.; Olsson, C.; Strobel, G.; et al. CSF and blood biomarkers for the diagnosis of Alzheimer’s disease: A systematic review and meta-analysis. Lancet Neurol. 2016, 15, 673–684. [Google Scholar] [CrossRef] [PubMed]
  2. Chiotis, K.; Saint-Aubert, L.; Rodriguez-Vieitez, E.; Leuzy, A.; Almkvist, O.; Savitcheva, I.; Jonasson, M.; Lubberink, M.; Wall, A.; Antoni, G.; et al. Longitudinal changes of tau PET imaging in relation to hypometabolism in prodromal and Alzheimer’s disease dementia. Mol. Psychiatry 2018, 23, 1666–1673. [Google Scholar] [CrossRef] [PubMed]
  3. Jack, C.R.; Bennett, D.A.; Blennow, K.; Carrillo, M.C.; Dunn, B.; Haeberlein, S.B.; Holtzman, D.M.; Jagust, W.; Jessen, F.; Karlawish, J.; et al. NIA-AA Research Framework: Toward a biological definition of Alzheimer’s disease. Alzheimers Dement. 2018, 14, 535–562. [Google Scholar] [CrossRef] [PubMed]
  4. Jack, C.R.; Andrews, J.S.; Beach, T.G.; Buracchio, T.; Dunn, B.; Graf, A.; Hansson, O.; Ho, C.; Jagust, W.; McDade, E.; et al. Revised criteria for diagnosis and staging of Alzheimer’s disease: Alzheimer’s Association Workgroup. Alzheimers Dement. 2024, 20, 5143–5169. [Google Scholar] [CrossRef] [PubMed]
  5. Dakterzada, F.; Cipriani, R.; López-Ortega, R.; Arias, A.; Riba-Llena, I.; Ruiz-Julián, M.; Huerto, R.; Tahan, N.; Matute, C.; Capetillo-Zarate, E.; et al. Assessment of the Correlation and Diagnostic Accuracy between Cerebrospinal Fluid and Plasma Alzheimer’s Disease Biomarkers: A Comparison of the Lumipulse and Simoa Platforms. Int. J. Mol. Sci. 2024, 25, 4594. [Google Scholar] [CrossRef] [PubMed]
  6. Simrén, J.; Leuzy, A.; Karikari, T.K.; Hye, A.; Benedet, A.L.; Lantero-Rodriguez, J.; Mattsson-Carlgren, N.; Schöll, M.; Mecocci, P.; Vellas, B.; et al. The diagnostic and prognostic capabilities of plasma biomarkers in Alzheimer’s disease. Alzheimers Dement. 2021, 17, 1145–1156. [Google Scholar] [CrossRef] [PubMed]
  7. Guo, Y.; Shen, X.N.; Wang, H.F.; Chen, S.D.; Zhang, Y.R.; Chen, S.F.; Cui, M.; Cheng, W.; Dong, Q.; Ma, T.; et al. The dynamics of plasma biomarkers across the Alzheimer’s continuum. Alzheimers Res. Ther. 2023, 15, 31. [Google Scholar] [CrossRef] [PubMed]
  8. De Meyer, S.; Schaeverbeke, J.M.; Verberk, I.M.W.; Gille, B.; De Schaepdryver, M.; Luckett, E.S.; Gabel, S.; Bruffaerts, R.; Mauroo, K.; Thijssen, E.H.; et al. Comparison of ELISA- and SIMOA-based quantification of plasma Aβ ratios for early detection of cerebral amyloidosis. Alzheimers Res. Ther. 2020, 12, 162. [Google Scholar] [CrossRef] [PubMed]
  9. Cullen, N.C.; Leuzy, A.; Janelidze, S.; Palmqvist, S.; Svenningsson, A.L.; Stomrud, E.; Dage, J.L.; Mattsson-Carlgren, N.; Hansson, O. Plasma biomarkers of Alzheimer’s disease improve prediction of cognitive decline in cognitively unimpaired elderly populations. Nat. Commun. 2021, 12, 3555. [Google Scholar] [CrossRef] [PubMed]
  10. Planche, V.; Bouteloup, V.; Pellegrin, I.; Mangin, J.F.; Dubois, B.; Ousset, P.J.; Pasquier, F.; Blanc, F.; Paquet, C.; Hanon, O.; et al. Validity and Performance of Blood Biomarkers for Alzheimer Disease to Predict Dementia Risk in a Large Clinic-Based Cohort. Neurology 2023, 100, E473–E484. [Google Scholar] [CrossRef] [PubMed]
  11. Altomare, D.; Stampacchia, S.; Ribaldi, F.; Tomczyk, S.; Chevalier, C.; Poulain, G.; Asadi, S.; Bancila, B.; Marizzoni, M.; Martins, M.; et al. Plasma biomarkers for Alzheimer’s disease: A field-test in a memory clinic. J. Neurol. Neurosurg. Psychiatry 2023, 94, 420–427. [Google Scholar] [CrossRef] [PubMed]
  12. McGrath, E.R.; Beiser, A.S.; Yang, Q.; Ghosh, S.; DeCarli, C.S.; Himali, J.J.; O’Donnell, A.; Satizabal, C.L.; Johnson, K.A.; Tracy, R.P.; et al. Blood phosphorylated tau 181 predicts early, preclinical brain amyloid deposition. Alzheimers Dement. 2021, 17, e055485. [Google Scholar] [CrossRef]
  13. Mielke, M.M.; Hagen, C.E.; Xu, J.; Chai, X.; Vemuri, P.; Lowe, V.J.; Airey, D.C.; Knopman, D.S.; Roberts, R.O.; Machulda, M.M.; et al. Plasma phospho-tau181 increases with Alzheimer’s disease clinical severity and is associated with tau- and amyloid-positron emission tomography. Alzheimers Dement. 2018, 14, 989–997. [Google Scholar] [CrossRef] [PubMed]
  14. Thijssen, E.H.; La Joie, R.; Wolf, A.; Strom, A.; Wang, P.; Iaccarino, L.; Bourakova, V.; Cobigo, Y.; Heuer, H.; Spina, S.; et al. Diagnostic value of plasma phosphorylated tau181 in Alzheimer’s disease and frontotemporal lobar degeneration. Nat. Med. 2020, 26, 387–397. [Google Scholar] [CrossRef] [PubMed]
  15. Thijssen, E.H.; La Joie, R.; Strom, A.; Fonseca, C.; Iaccarino, L.; Wolf, A.; Spina, S.; Allen, I.E.; Cobigo, Y.; Heuer, H.; et al. Plasma phosphorylated tau 217 and phosphorylated tau 181 as biomarkers in Alzheimer’s disease and frontotemporal lobar degeneration: A retrospective diagnostic performance study. Lancet Neurol. 2021, 20, 739–752. [Google Scholar] [CrossRef] [PubMed]
  16. Janelidze, S.; Mattsson, N.; Palmqvist, S.; Smith, R.; Beach, T.G.; Serrano, G.E.; Chai, X.; Proctor, N.K.; Eichenlaub, U.; Zetterberg, H.; et al. Plasma P-tau181 in Alzheimer’s disease: Relationship to other biomarkers, differential diagnosis, neuropathology and longitudinal progression to Alzheimer’s dementia. Nat. Med. 2020, 26, 379–386. [Google Scholar] [CrossRef] [PubMed]
  17. Ashton, N.J.; Janelidze, S.; Mattsson-Carlgren, N.; Binette, A.P.; Strandberg, O.; Brum, W.S.; Karikari, T.K.; González-Ortiz, F.; Molfetta, G.D.; Meda, F.J.; et al. Differential roles of Aβ42/40, p-tau231 and p-tau217 for Alzheimer’s trial selection and disease monitoring. Nat. Med. 2022, 28, 2555–2562. [Google Scholar] [CrossRef] [PubMed]
  18. Ashton, N.J.; Brum, W.S.; Di Molfetta, G.; Benedet, A.L.; Arslan, B.; Jonaitis, E.; Langhough, R.E.; Cody, K.; Wilson, R.; Carlsson, C.M.; et al. Diagnostic Accuracy of a Plasma Phosphorylated Tau 217 Immunoassay for Alzheimer Disease Pathology. JAMA Neurol. 2024, 81, 255–263. [Google Scholar] [CrossRef] [PubMed]
  19. Milà-Alomà, M.; Ashton, N.J.; Shekari, M.; Salvadó, G.; Ortiz-Romero, P.; Montoliu-Gaya, L.; Benedet, A.L.; Karikari, T.K.; Lantero-Rodriguez, J.; Vanmechelen, E.; et al. Plasma p-tau231 and p-tau217 as state markers of amyloid-β pathology in preclinical Alzheimer’s disease. Nat. Med. 2022, 28, 1797–1801. [Google Scholar] [CrossRef] [PubMed]
  20. Palmqvist, S.; Janelidze, S.; Quiroz, Y.T.; Zetterberg, H.; Lopera, F.; Stomrud, E.; Su, Y.; Chen, Y.; Serrano, G.E.; Leuzy, A.; et al. Discriminative Accuracy of Plasma Phospho-tau217 for Alzheimer Disease vs Other Neurodegenerative Disorders. JAMA 2020, 324, 772–781. [Google Scholar] [CrossRef] [PubMed]
  21. Feizpour, A.; Doecke, J.D.; Doré, V.; Krishnadas, N.; Huang, K.; Bourgeat, P.; Lawsd, S.M.; Fowlera, C.; Robertsona, J.; Mackintosh, L.; et al. Detection and staging of Alzheimer’s disease by plasma pTau217 on a high throughput immunoassay platform. eBioMedicine 2024, 109, 105405. [Google Scholar] [CrossRef] [PubMed]
  22. Jack, C.R.; Wiste, H.J.; Algeciras-Schimnich, A.; Figdore, D.J.; Schwarz, C.G.; Lowe, V.J.; Ramanan, V.K.; Vemuri, P.; Mielke, M.M.; Knopman, D.S.; et al. Predicting amyloid PET and tau PET stages with plasma biomarkers. Brain 2023, 146, 2029–2044. [Google Scholar] [CrossRef] [PubMed]
  23. Mattsson-Carlgren, N.; Salvadó, G.; Ashton, N.J.; Tideman, P.; Stomrud, E.; Zetterberg, H.; Ossenkoppele, R.; Betthauser, T.J.; Cody, K.A.; Jonaitis, E.M.; et al. Prediction of Longitudinal Cognitive Decline in Preclinical Alzheimer Disease Using Plasma Biomarkers. JAMA Neurol. 2023, 80, 360. [Google Scholar] [CrossRef] [PubMed]
  24. Mendes, A.J.; Ribaldi, F.; Lathuiliere, A.; Ashton, N.J.; Janelidze, S.; Zetterberg, H.; Scheffler, M.; Assal, F.; Garibotto, V.; Blennow, K.; et al. Head-to-head study of diagnostic accuracy of plasma and cerebrospinal fluid p-tau217 versus p-tau181 and p-tau231 in a memory clinic cohort. J. Neurol. 2024, 271, 2053–2066. [Google Scholar] [CrossRef] [PubMed]
  25. Sarto, J.; Esteller-Gauxax, D.; Guillén, N.; Falgàs, N.; Borrego-Écija, S.; Massons, M.; Fernández-Villullas, G.; González, Y.; Tort-Merino, A.; Bosch, B.; et al. Accuracy and clinical applicability of plasma tau 181 and 217 for Alzheimer’s disease diagnosis in a memory clinic cohort. J. Neurol. 2025, 272, 160. [Google Scholar] [CrossRef] [PubMed]
  26. Arranz, J.; Zhu, N.; Rubio-Guerra, S.; Rodríguez-Baz, Í.; Ferrer, R.; Carmona-Iragui, M.; Barroeta, I.; Illán-Gala, I.; Santos-Santos, M.; Fortea, J.; et al. Diagnostic performance of plasma pTau217, pTau181, Aβ1-42 and Aβ1-40 in the LUMIPULSE automated platform for the detection of Alzheimer disease. Alzheimers Res. Ther. 2024, 16, 139. [Google Scholar] [CrossRef] [PubMed]
  27. Dyer, A.H.; Dolphin, H.; O’Connor, A.; Morrison, L.; Sedgwick, G.; Young, C.; Killeen, E.; Gallagher, C.; McFeely, A.; Connolly, E.; et al. Performance of plasma p-tau217 for the detection of amyloid-β positivity in a memory clinic cohort using an electrochemiluminescence immunoassay. Alzheimers Res. Ther. 2024, 16, 186. [Google Scholar] [CrossRef] [PubMed]
  28. Chong, J.R.; Hilal, S.; Tan, B.Y.; Venketasubramanian, N.; Schöll, M.; Zetterberg, H.; Blennow, K.; Ashton, N.J.; Chen, C.P.; Lai, M.K.P. Clinical utility of plasma p-tau217 in identifying abnormal brain amyloid burden in an Asian cohort with high prevalence of concomitant cerebrovascular disease. Alzheimers Dement. 2025, 21, e14502. [Google Scholar] [CrossRef] [PubMed]
  29. Mintun, M.A.; Lo, A.C.; Evans, C.D.; Wessels, A.M.; Ardayfio, P.A.; Andersen, S.W.; Ardayfio, P.A.; Andersen, S.W.; Shcherbinin, S.; Sparks, J.; et al. Donanemab in Early Alzheimer’s Disease. N. Engl. J. Med. 2021, 384, 1691–1704. [Google Scholar] [CrossRef] [PubMed]
  30. Algeciras-Schimnich, A. Effect of kidney function on plasma pTau217 concentrations using different pTau217 assays. Alzheimer’s Dement. 2025, 20, e088364. [Google Scholar] [CrossRef]
  31. Janelidze, S.; Barthélemy, N.R.; He, Y.; Bateman, R.J.; Hansson, O. Mitigating the Associations of Kidney Dysfunction With Blood Biomarkers of Alzheimer Disease by Using Phosphorylated Tau to Total Tau Ratios. JAMA Neurol. 2023, 80, 516–522. [Google Scholar] [CrossRef] [PubMed]
  32. Palmqvist, S.; Warmenhoven, N.; Anastasi, F.; Pilotto, A.; Janelidze, S.; Tideman, P.; Stomrud, E.; Mattsson-Carlgren, N.; Smith, R.; Ossenkoppele, R.; et al. Plasma phospho-tau217 for Alzheimer’s disease diagnosis in primary and secondary care using a fully automated platform. Nat. Med. 2025, 31, 2036–2043. [Google Scholar] [CrossRef] [PubMed]
  33. Cooper, J.G.; Ghodsi, M.; Stukas, S.; Leach, S.; Brooks-Wilson, A.; Wellington, C.L. APOE ε4 carrier status modifies plasma p-tau181 concentrations in cognitively healthy super-seniors. Alzheimers Dement. 2024, 20, 4373–4380. [Google Scholar] [CrossRef] [PubMed]
  34. Salami, A.; Adolfsson, R.; Andersson, M.; Blennow, K.; Lundquist, A.; Adolfsson, A.N.; Schöll, M.; Zetterberg, H.; Nyberg, L. Association of APOE ϵ4 and Plasma p-tau181 with Preclinical Alzheimer’s Disease and Longitudinal Change in Hippocampus Function. J. Alzheimers Dis. 2022, 85, 1309–1320. [Google Scholar] [CrossRef] [PubMed]
  35. Hsiung, G.Y.R.; Kumar, P.; Mousavi, A.; Encarnacion, M.; Frykman, H. The effects of ApoE e4 genotype on plasma p-tau181 concentrations on clinically diagnosed Alzheimer’s disease (AD) compared to controls. Alzheimers Dement. 2023, 19, e080482. [Google Scholar] [CrossRef]
  36. Lehmann, S.; Schraen-Maschke, S.; Vidal, J.S.; Delaby, C.; Buee, L.; Blanc, F.; Paquet, C.; Allinquant, B.; Bombois, S.; Gabelle, A.; et al. Clinical value of plasma ALZpath pTau217 immunoassay for assessing mild cognitive impairment. J. Neurol. Neurosurg. Psychiatry 2024, 95, 1046–1053. [Google Scholar] [CrossRef] [PubMed]
  37. Schindler, S.E.; Galasko, D.; Pereira, A.C.; Rabinovici, G.D.; Salloway, S.; Suárez-Calvet, M.; Khachaturian, A.S.; Mielke, M.M.; Udeh-Momoh, C.; Weiss, J.; et al. Acceptable performance of blood biomarker tests of amyloid pathology—recommendations from the Global CEO Initiative on Alzheimer’s Disease. Nat. Rev. Neurol. 2024, 20, 426–439. [Google Scholar] [CrossRef] [PubMed]
  38. McKhann, G.M.; Knopman, D.S.; Chertkow, H.; Hyman, B.T.; Jack, C.R.; Kawas, C.H.; Klunk, W.E.; Koroshetz, W.J.; Manly, J.J.; Mayeux, R.; et al. The diagnosis of dementia due to Alzheimer’s disease: Recommendations from the National Institute on Aging-Alzheimer’s Association workgroups on diagnostic guidelines for Alzheimer’s disease. Alzheimers Dement. 2011, 7, 263–269. [Google Scholar] [CrossRef] [PubMed]
  39. Albert, M.S.; DeKosky, S.T.; Dickson, D.; Dubois, B.; Feldman, H.H.; Fox, N.C.; Gamst, A.; Holtzman, D.M.; Jagust, W.J.; Petersen, R.C.; et al. The diagnosis of mild cognitive impairment due to Alzheimer’s disease: Recommendations from the National Institute on Aging-Alzheimer’s Association workgroups on diagnostic guidelines for Alzheimer’s disease. Alzheimers Dement. 2011, 7, 270–279. [Google Scholar] [CrossRef] [PubMed]
  40. Gorno-Tempini, M.L.; Hillis, A.E.; Weintraub, S.; Kertesz, A.; Mendez, M.; Cappa, S.F.; Ogar, J.M.; Rohrer, J.D.; Black, S.; Boeve, B.F.; et al. Classification of primary progressive aphasia and its variants. Neurology 2011, 76, 1006–1014. [Google Scholar] [CrossRef] [PubMed]
  41. Rascovsky, K.; Hodges, J.R.; Knopman, D.; Mendez, M.F.; Kramer, J.H.; Neuhaus, J.; van Swieten, J.C.; Seelaar, H.; Dopper, E.G.P.; Onyike, C.U.; et al. Sensitivity of revised diagnostic criteria for the behavioural variant of frontotemporal dementia. Brain 2011, 134, 2456. [Google Scholar] [CrossRef] [PubMed]
  42. McKeith, I.G.; Boeve, B.F.; Dickson, D.W.; Halliday, G.; Taylor, J.P.; Weintraub, D.; Aarsland, D.; Galvin, J.; Attems, J.; Ballard, C.G.; et al. Diagnosis and management of dementia with Lewy bodies: Fourth consensus report of the DLB Consortium. Neurology 2017, 89, 88. [Google Scholar] [CrossRef] [PubMed]
Figure 1. Spearman correlation between plasma p-tau217 levels and other AD-related biomarkers. The correlation between plasma p-tau217 and plasma p-tau181 (A), CSF Aβ42/40 (B), CSF p-tau181 (C), and CSF p-tau181/Aβ42 (D) is shown. The dotted line represents the cutoff value for the corresponding CSF biomarker, where available.
Ijms 26 06771 g001
Figure 2. Effect of potential confounding variables on plasma p-tau217. The black vertical dashed line indicates a null effect. Orange dots represent the standardized beta coefficients for each variable, and the horizontal bars indicate the corresponding 95% confidence intervals. BMI: body mass index; eGFR: estimated glomerular filtration rate; VRF: vascular risk factor; *: p < 0.05; ***: p < 0.001.
Ijms 26 06771 g002
Figure 3. Plasma p-tau217 levels according to CSF Aβ42/40 (A) and p-tau181 (T) status.
Ijms 26 06771 g003
Figure 4. Receiver operating characteristic (ROC) curves of plasma p-tau biomarkers and ratios for discriminating amyloid and tau pathologies in CSF. (A) Plasma biomarkers that achieved the highest Youden index for discriminating CSF Aβ42/40 status in the ROC analysis. (B) Plasma biomarkers that achieved the highest Youden index for discriminating CSF p-tau181 status in the ROC analysis.
Ijms 26 06771 g004
Figure 5. Association between plasma p-tau217 levels and cognition, as measured by the MMSE. (A) Spearman correlation between plasma p-tau217 levels and MMSE scores at baseline. (B) Moderating effect of plasma p-tau217 on cognitive changes over time in a subpopulation of MCI patients with available follow-up data (N = 81). “Pre” refers to the MMSE score at the baseline visit, and “Post” refers to the MMSE score at the final visit. High p-tau217 levels were defined as the mean plus one standard deviation (mean + SD), and low p-tau217 levels as the mean minus one standard deviation (mean − SD). MMSE: Mini-mental state examination.
Ijms 26 06771 g005
Figure 6. Three-range restrictive and lenient reference points for CSF Aβ status. The red dashed lines indicate the upper and lower reference points for the restrictive strategy, where the specificity of the upper cutoff and the sensitivity of the lower cutoff are both set at 97.5%. Individuals with values between these two red dashed lines (N = 170 (61.6%)) are considered to have an intermediate risk for CSF Aβ positivity and will require confirmatory testing. The green dashed lines represent the upper and lower reference points for the lenient strategy, where the specificity of the upper cutoff and the sensitivity of the lower cutoff are set at 95%. Individuals falling within this range (N = 72 (27.9%)) are also classified as having intermediate risk and will need confirmatory testing for CSF Aβ positivity. Se: sensitivity; Sp: specificity.
Ijms 26 06771 g006
Table 1. Characteristics of study population by clinical diagnosis.
NAll ParticipantsMCIADNon-AD Dementiap-Value
n (%) 276 (100%)193 (69.9%)56 (20.3%)27 (9.8%)
Demographic data
Age (years)27674 (70, 78)75 (72, 78)74 (70, 77)75 (70, 79)0.242
Sex (female), n(%)276164 (59%)116 (60%)39 (70%)9 (33%)0.006
Education (years)2649 (8, 12)9 (8, 14)10 (8, 12)8 (6, 10)0.047
Family history of cognitive impairment (yes), n (%)274113 (41%)24 (43%)80 (42%)9 (33%)0.674
Comorbidities
Hypertension, n(%)276153 (55%)100 (52%)39 (70%)14 (52%)0.057
Diabetes Mellitus, n(%)27684 (30%)60 (31%)17 (30%)7 (26%)0.861
Dyslipidemia, n(%)276148 (54%)107 (55%)29 (52%)12 (44%)0.536
Depression, n(%)27598 (35%)125 (65%)35 (63%)17 (63%)0.926
CSF AD biomarkers
Aβ42 pg/mL276546 (410, 799)595 (432, 866)424 (346, 537)784 (508, 988)<0.001
Aβ40 pg/mL27610788 (8335, 13467)11121 (8565, 13659)10246 (8162, 12222)9215 (8092, 13469)0.139
Aβ42/402760.051 (0.04, 0.082)0.052 (0.040, 0.085)0.041 (0.035, 0.050)0.082 (0.063, 0.101)<0.001
t-tau pg/mL276455 (268, 747)425 (258, 661)653 (432, 897)265 (170, 487)<0.001
p-tau181 pg/mL27669 (41, 121)65 (41, 118)107 (71, 149)40 (27, 56)<0.001
t-tau/Aβ422760.9 (0.3, 1.57)0.79 (0.29, 1.39)1.60 (0.99, 1.98)0.29 (0.22, 0.90)<0.001
p-tau181/Aβ422760.15 (0.04, 0.27)0.13 (0.04, 0.24)0.27 (0.15, 0.32)0.04 (0.03, 0.10)<0.001
Plasma AD biomarkers
Aβ42 pg/mL12424 (21, 27.8)24.1 (21.1, 27.2)22.5 (20.3, 26.6)25.9 (24.1, 29.2)0.040
Aβ40 pg/mL123303 (276, 359)309 (276, 359)283 (272, 334)320 (282, 371)0.211
Aβ42/401230.08 (0.07, 0.08)0.08 (0.07, 0.08)0.08 (0.07, 0.08)0.08 (0.07, 0.09)0.093
p-tau181 pg/mL1262.29 (1.69, 3.13)2.17 (1.65, 2.85)2.86 (2.28, 3.49)2.10 (1.62, 3.08)0.009
p-tau217 pg/mL2580.34 (0.15, 0.69)0.31 (0.14, 0.59)0.70 (0.39, 0.98)0.13 (0.11, 0.30)<0.001
p-tau181/Aβ421260.1 (0.07, 0.14)0.09 (0.07, 0.12)0.13 (0.10, 0.15)0.07 (0.06, 0.13)0.001
p-tau217/Aβ421230.015 (0.006, 0.028)0.014 (0.005, 0.023)0.029 (0.015, 0.038)0.005 (0.004, 0.013)<0.001
Other variables
BMI25826.6 (23.89, 29.27)26.6 (24.3, 29.1)25.5 (23.4, 30.4)27.0 (24.6, 28.9)0.718
eGFR26475 (63, 86)73 (62, 86)73 (55, 84)82 (66, 88)0.349
MMSE score26925 (21, 27)25 (23, 27)21 (18, 23)25 (18, 27)<0.001
APOE ε4, n(%)272106 (38%)72 (38%)29 (52%)5 (19%)0.013
Unless otherwise specified, results are presented as median (IQR). p-values were calculated by comparing AD, MCI, and non-AD dementia participants using Kruskal Wallis test for continuous variables and Pearson Chi2 for categorical variables. AD: Alzheimer’s disease; APOE ε4: apolipoprotein E ε4 allele; BMI: body mass index; eGFR: estimated glomerular filtration rate; MCI: mild cognitive impairment; MMSE: Mini-mental state examination; N: number of included participants; non-AD dementia: non-Alzheimer’s disease dementia.
Table 2. Discriminating power of plasma biomarkers for CSF Aβ42/40 status.
BiomarkerAUC (95% CI)SensitivitySpecificityPPANPATotal% of Predictive Accuracy *
Aβ420.668 (0.568–0.768)62.4%61.5%77.9%42.9%62.1%
Aβ400.505 (0.391–0.618)52.4%48.7%69.8%32.8%51.6%
Aβ42/400.796 (0.713–0.879)57.1%89.7%92.6%50.0%68.3%
p-tau1810.808 (0.727–0.890)80.2%75.0%87.3%63.8%78.6%
p-tau181/Aβ420.884 (0.824–0.944)87.1%82.1%91.5%75.0%85.7%
p-tau2170.924 (0.889–0.960)87.3%89.1%93.5%79.6%87.9%
p-tau217/Aβ420.945 (0.900–0.990)89.3%90.9%95.7%78.9%89.8%
AUC: area under the curve; NPA: negative percent agreement; PPA: positive percent agreement. * The percentage of correct classification of Aβ42/40 positive + correct classification of Aβ42/40 negative/all cases.
Table 3. Discriminating power of plasma biomarkers for CSF p-tau181 status.
BiomarkerAUC (95% CI)SensitivitySpecificityPPANPATotal% of Predictive Accuracy *
Aβ420.412 (0.277–0.548)81.3%18.8%75.9%9.7%51.7%
Aβ400.396 (0.257–0.535)66.2%18.8%77.6%11.5%57.1%
Aβ42/400.506 (0.355–0.658)44.1%62.5%83.3%20.8%47.6%
p-tau1810.650 (0.498–0.802)51.4%81.3%92.3%29.2%57.4%
p-tau181/Aβ420.721 (0.580–0.861)56.5%81.3%92.9%30.2%61.2%
p-tau2170.798 (0.701–0.894)71.3%78.3%91.0%47.6%85.5%
p-tau217/Aβ420.804 (0.675–0.933)72.9%75.0%91.5%41.4%72.3%
AUC: area under the curve; NPA: negative percent agreement; PPA: positive percent agreement. * The percentage of correct classification of p-tau181 positive + correct classification of p-tau181 negative/all cases.
Table 4. Predictive power of plasma biomarkers for progression from MCI to AD.
BiomarkerAUC (95% CI)SensitivitySpecificity
Aβ420.374 (0.249–0.500)46.5%31.4%
Aβ400.460 (0.329–0.591)41.9%42.9%
Aβ42/400.673 (0.553–0.793)67.4%65.7%
p-tau1810.795 (0.692–0.898)90.1%63.9%
p-tau181/Aβ420.852 (0.762–0.943)86.0%77.1%
p-tau2170.876 (0.787–0.964)87.2%83.9%
p-tau217/Aβ420.888 (0.803–0.972)84.6%87.1%
Table 5. Binary and three-range reference for CSF Aβ42/40 status.
Binary Reference Point $Three-Range Reference Points
95% *97.5% **
Characteristics≥0.2375 pg/mLCharacteristics<0.1560
≥0.3850 pg/mL
<0.1285
≥0.8410 pg/mL
Participants, n258Participants, n258258
Positive for Aβ42/40, n (%) 177 (68.6)Positive for Aβ42/40, n (%)177 (68.6)177 (68.6)
Positive for plasma p-tau217, n (%)155 (60.1)Negative for plasma p-tau217, n (%)69 (26.7)48 (18.6)
Intermediate for plasma p-tau217, n (%)72 (27.9)170 (61.6)
Positive for plasma p-tau217, n (%)117 (45.3)40 (15.5)
Sensitivity, %87.3%Sensitivity of lower reference point, %95.2%97.6%
Specificity, %89.1%Specificity of upper reference point, %94.6%97.8%
PPA, %93.5%PPA, upper reference point, %95.7%95.0%
NPA, %79.6%NPA, lower reference point, %88.4%91.7%
OPA, %87.9%OPA for plasma p-tau217 positive and negative, %94.9%97.7%
$: The value that yielded the maximum Youden index. *: Three-range reference points with 95% sensitivity at the lower reference points and 95% specificity at the upper reference point; **: Three-range reference points with 97.5% sensitivity at the lower reference point and 97.5% specificity at the upper reference point; Aβ42/40: amyloid beta 42 to 40 ratio; CSF: cerebrospinal fluid; NPA: negative percent agreement; OPA: overall percent agreement; PPA: positive percent agreement; p-tau: phosphorylated tau.
Disclaimer/Publisher’s Note: The statements, opinions and data contained in all publications are solely those of the individual author(s) and contributor(s) and not of MDPI and/or the editor(s). MDPI and/or the editor(s) disclaim responsibility for any injury to people or property resulting from any ideas, methods, instructions or products referred to in the content.

