1. Introduction
Diabetes mellitus is a metabolic disease characterized by elevated blood glucose levels and dysregulation in the metabolism of carbohydrates, proteins, and lipids, leading to impaired homeostasis across multiple metabolic pathways [
1]. Among the secondary complications of diabetes, the most prominent, resulting from microvascular damage to small arterial vessels, are retinopathy, nephropathy, peripheral neuropathy, and cataract. Diabetic retinopathy (DR) has a substantial impact on the quality of life of individuals with diabetes and remains the leading cause of vision loss among working-age adults in industrialized nations [
2,
3]. DR is now recognized as a neurovascular disorder wherein neurodegenerative processes play a pivotal role [
4]. Emerging evidence indicates that retinal glial cells, including macroglia (Müller cells and astrocytes) and microglia, undergo significant alterations in response to hyperglycemic conditions [
5,
6]. Among the macroglial cell types in the retina, Müller glial cells (MGCs) are the most abundant and widely distributed. MGCs span the entire retinal thickness and play a pivotal role in maintaining retinal homeostasis through several mechanisms [
6]. The glial responses not only precede overt vascular alterations but also contribute to the progression of DR by disrupting the neurovascular unit’s integrity [
7]. In Müller cells, the presence of aldose reductase (AKR1B1) expression, particularly in areas adjacent to the inner limiting membrane, was observed [
8]. AKR1B1, the first and rate-limiting enzyme of the polyol pathway, catalyzes the reduction of glucose to sorbitol, which is subsequently converted into fructose by sorbitol dehydrogenase (SORD). Under normoglycemic conditions, this pathway accounts for a minor fraction of glucose metabolism. However, in hyperglycemic states, increased flux through the polyol pathway leads to sorbitol accumulation, osmotic stress, and oxidative damage [
9]. AKR1B1 is not only involved in osmoregulation; it also contributes to inflammatory pathways by promoting the production of reactive oxygen species (ROS) and activation of pro-inflammatory transcription factors such as nuclear factor kappa-light-chain-enhancer of activated B cells (NF-κB) [
10].
Previous studies have demonstrated that AKR1B1 contributes to inflammation in various ocular tissues. For instance, AKR1B1 inhibition has been shown to attenuate lipopolysaccharide-induced inflammatory responses in retinal microglia [
11]. Moreover, in diabetic models, AKR1B1 activity correlates with increased expression of inflammatory cytokines and vascular endothelial growth factor (VEGF), further implicating its role in DR pathogenesis [
12]. Interestingly, the role of AKR1B1 in inflammation appears to be cell-type specific. In human lens epithelial cells, AKR1B1 activity did not significantly induce inflammatory markers, suggesting differential regulatory mechanisms across ocular cell types [
13]. The potential role of AKR1B1 expressed in retinal MGCs as a mediator of inflammatory responses in the diabetic retina has been suggested. However, a deeper investigation into the involvement of the polyol pathway in macroglial cells exposed to acute glycaemic stress is still lacking in the current literature. The acute hyperglycemic events, although temporary, have been associated with inflammatory activation, oxidative stress, and vascular dysfunction in the diabetic retina [
14].
In this study, we aim to elucidate the role of enzymes involved in the polyol pathway, particularly AKR1B1, in mediating acute hyperglycemia-induced inflammation in MIO-M1 cells. Acute hyperglycemia in vitro mimics several in vivo conditions typically observed in diabetic individuals or patients under metabolic stress [
15]. To this end, we will explore, by specific biochemical assays, how short-term glycemic stress modulates the polyol pathway and activates downstream inflammatory signaling in macroglia cells, including the use of a specific aldose reductase inhibitor. Through elucidation of the biochemical mechanisms underlying acute hyperglycemic stress, it will be possible to identify potential molecular targets for therapeutic interventions to reduce retinal inflammation in the early stages of DR.
3. Discussion
In this study, the effect of acute hyperglycemia on the onset of the inflammatory response in human Müller glial cell line MIO-M1 has been investigated, highlighting the role of aldose reductase (AKR1B1) as a key mediator of this process. Acute hyperglycemia would not only cause direct damage to the human body but also may develop into chronic diseases such as diabetes. Among the various stressors contributing to neuronal damage in DR, a microvascular complication of diabetes, acute hyperglycemia represents a crucial metabolic insult capable of triggering early pathogenic responses in retinal cells. Glial cells play a central role in the early pathophysiological response to hyperglycemia, revealing metabolic imbalance and coordinating inflammatory signaling [
16].
AKR1B1, the first enzyme of the polyol pathway, has been implicated in oxidative stress and inflammation under hyperglycemic conditions [
17]. Our findings support the idea that even short-term hyperglycemic exposure is sufficient to activate pro-inflammatory pathways in Müller cells, which may contribute to the early inflammatory milieu of DR [
18,
19]. These early responses, although initially intended as protective or adaptive, may evolve into detrimental processes that exacerbate retinal neurodegeneration and vascular dysfunction as the disease progresses [
20].
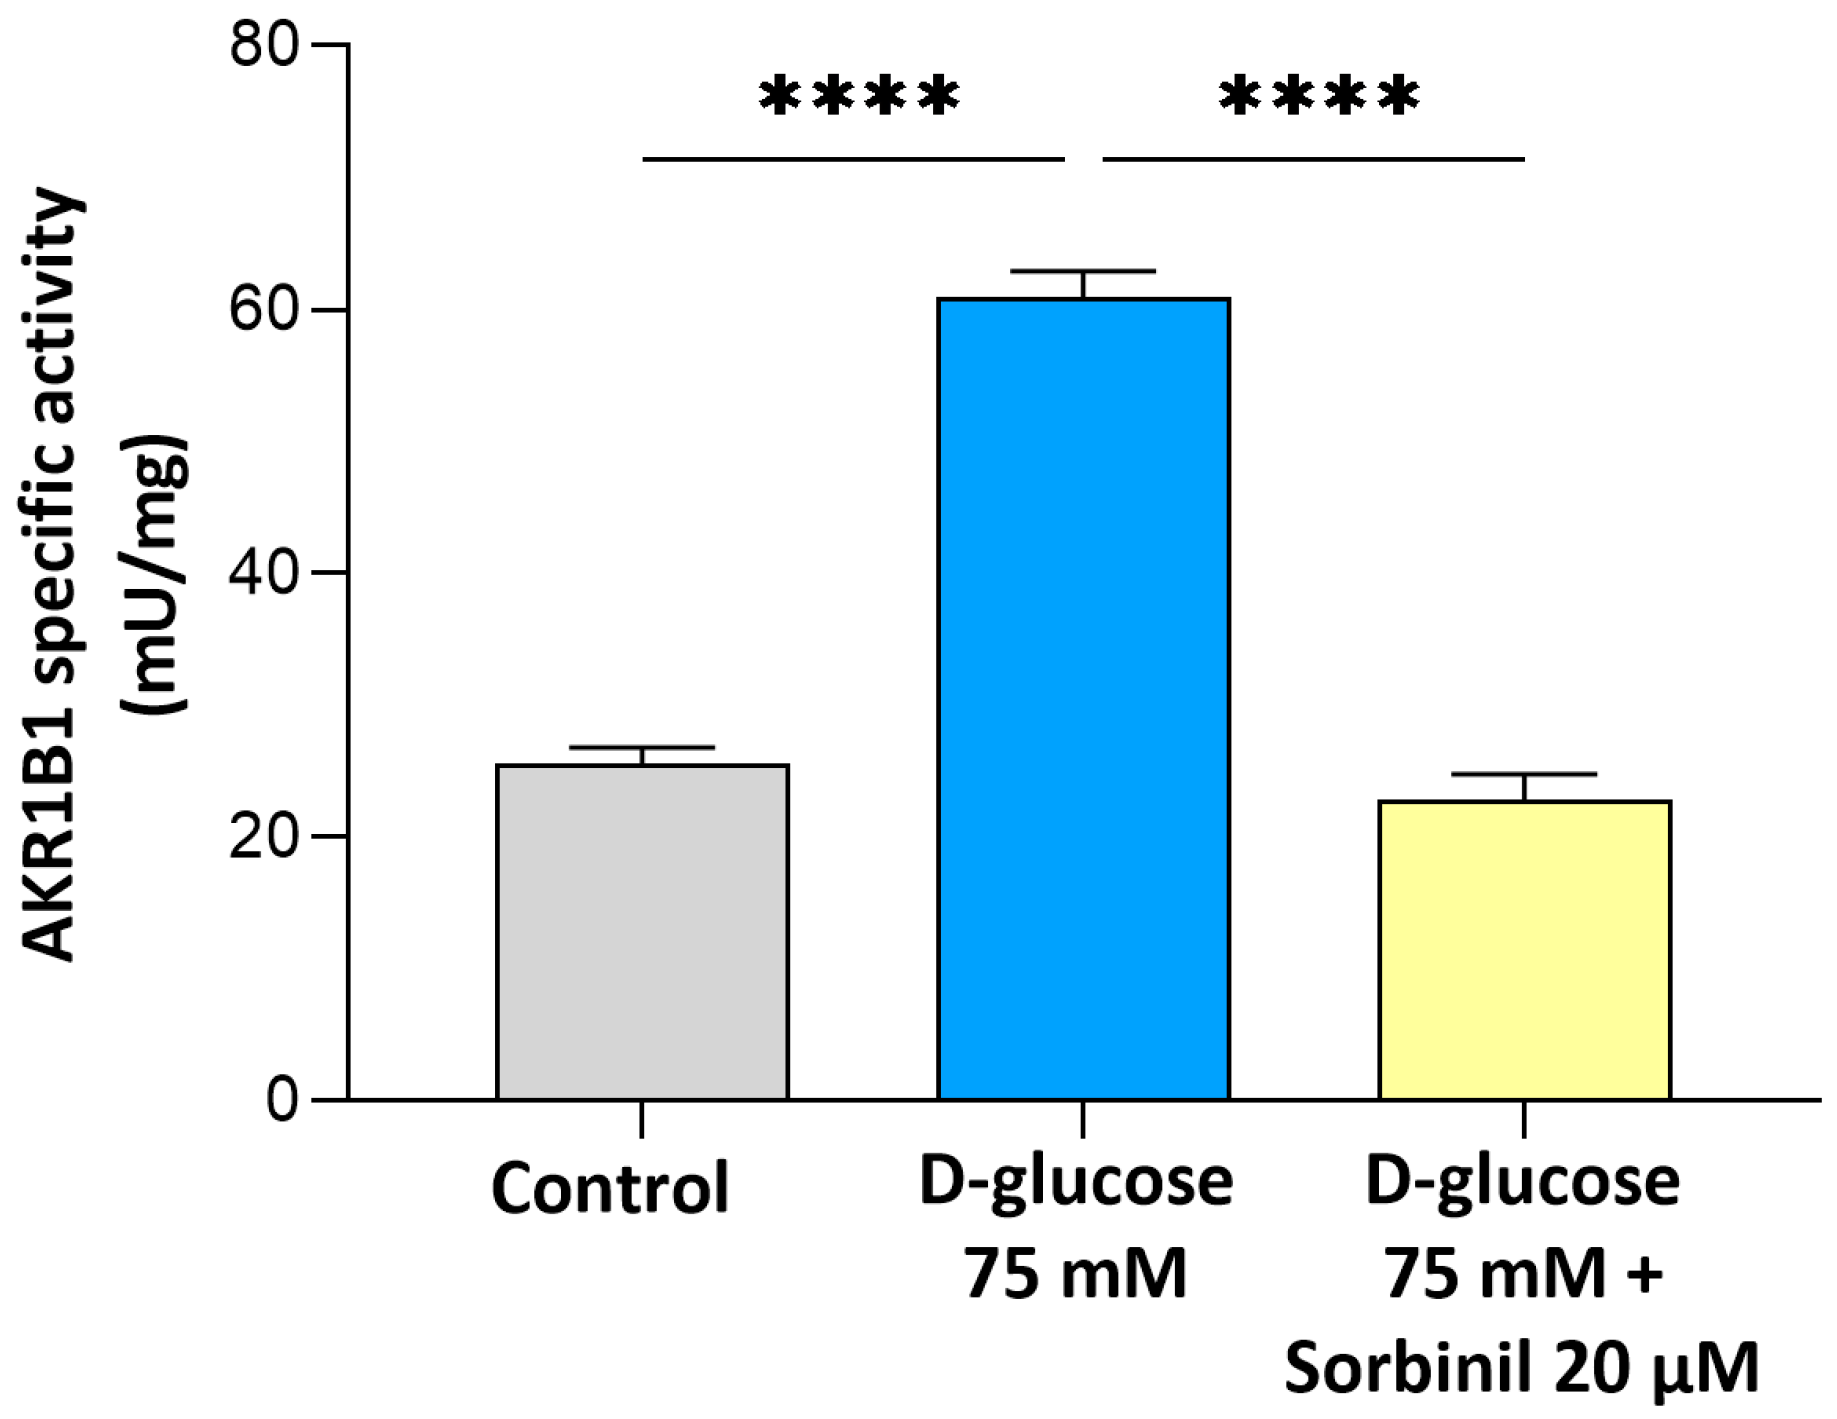
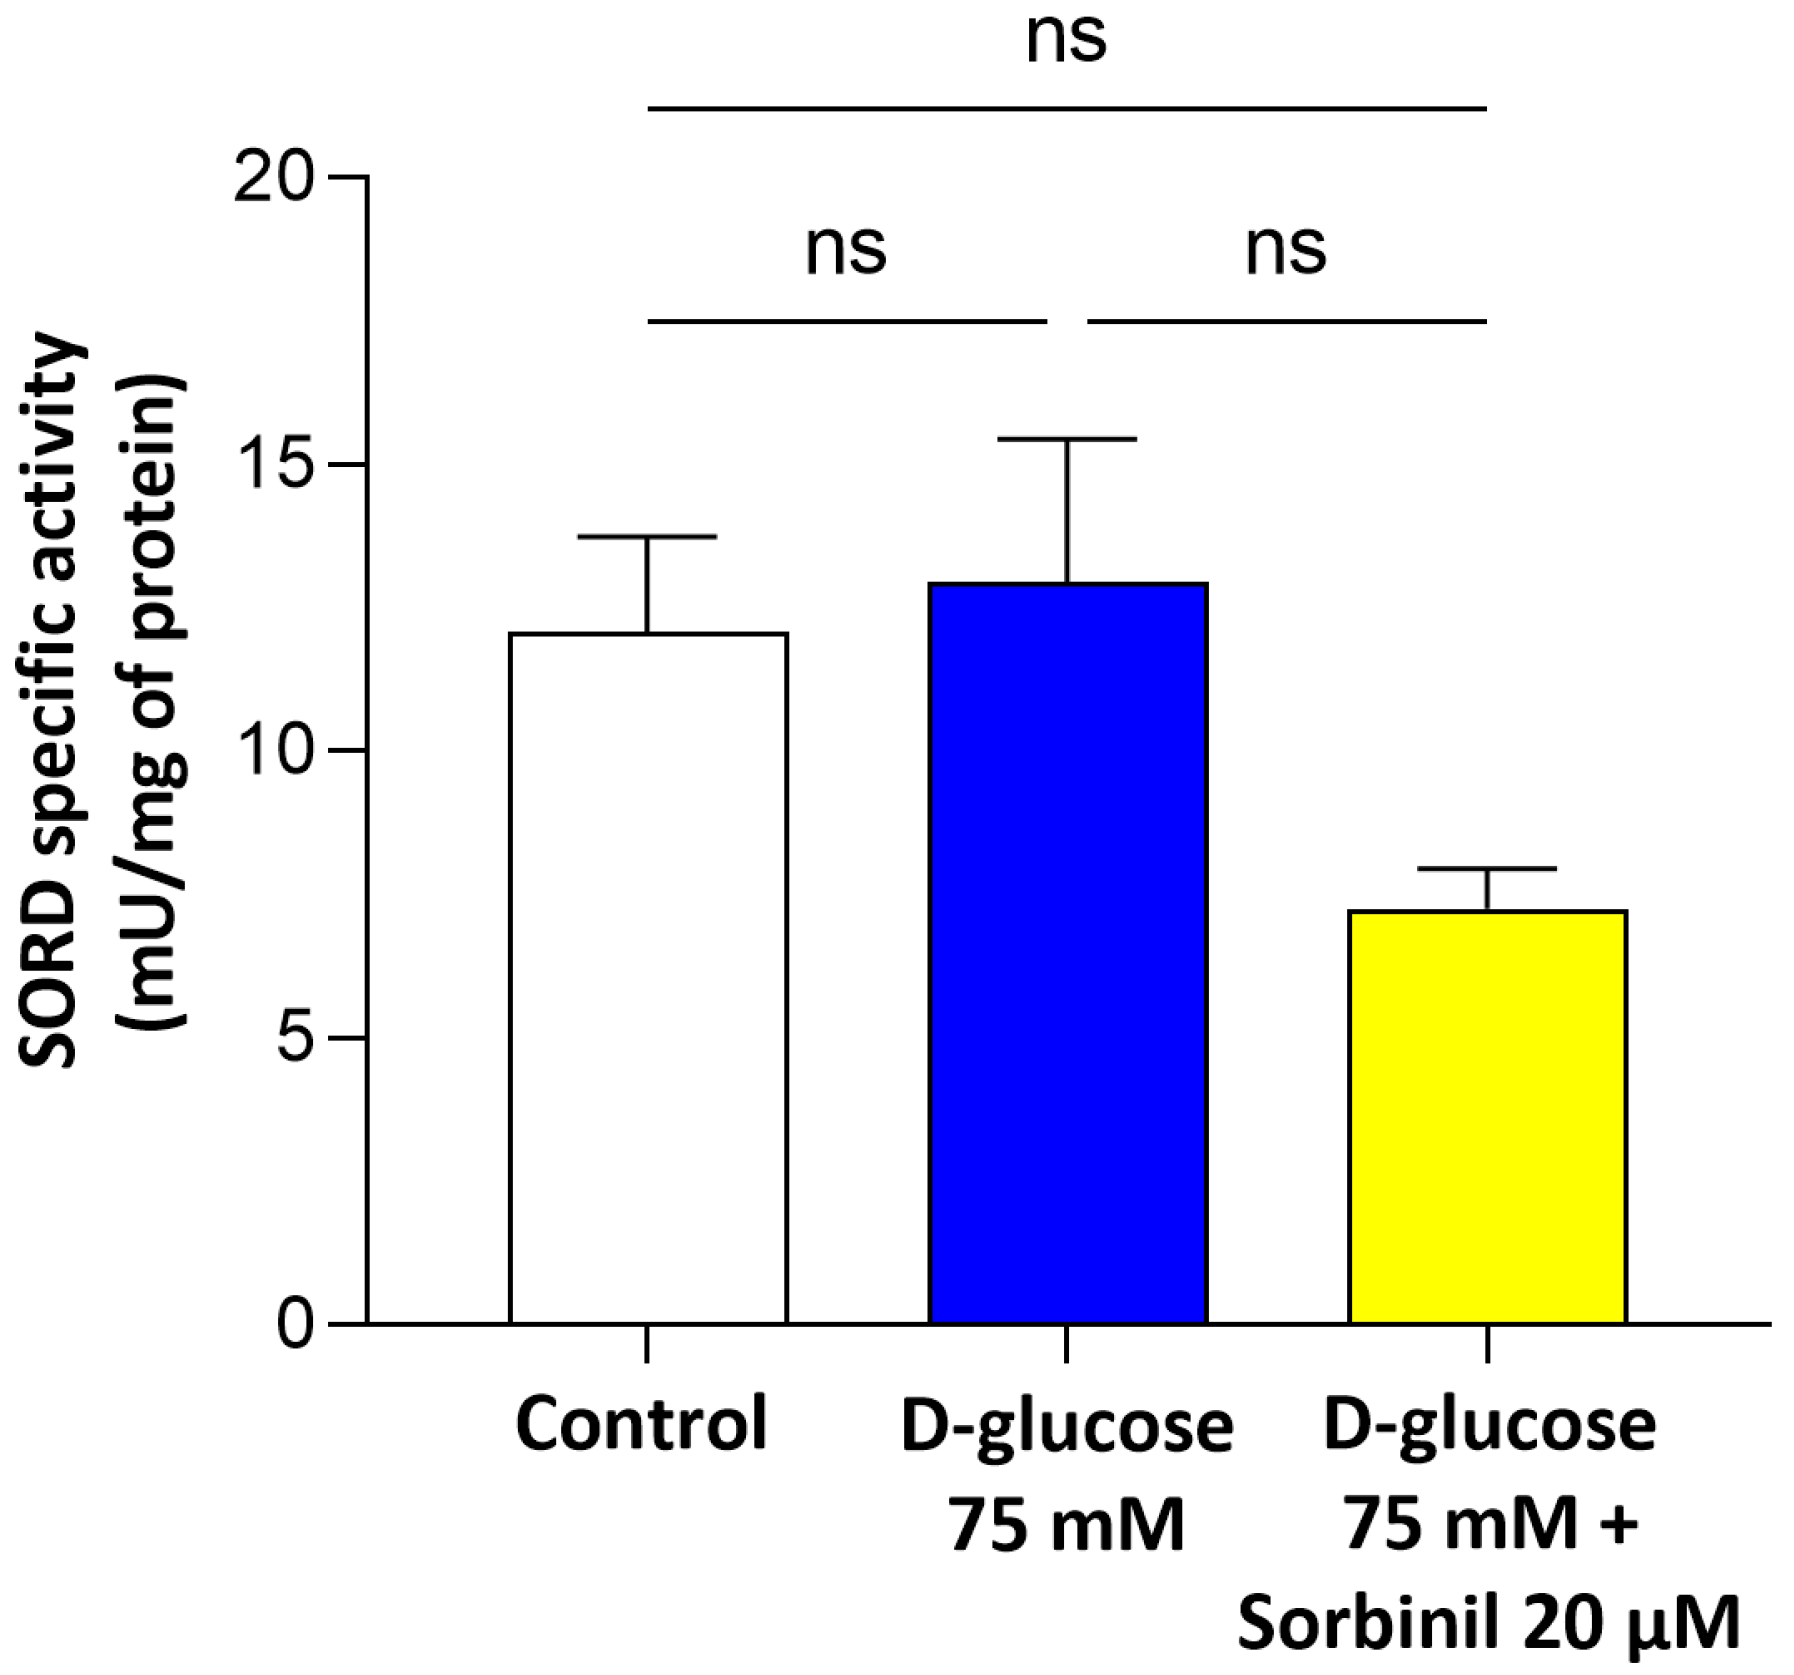
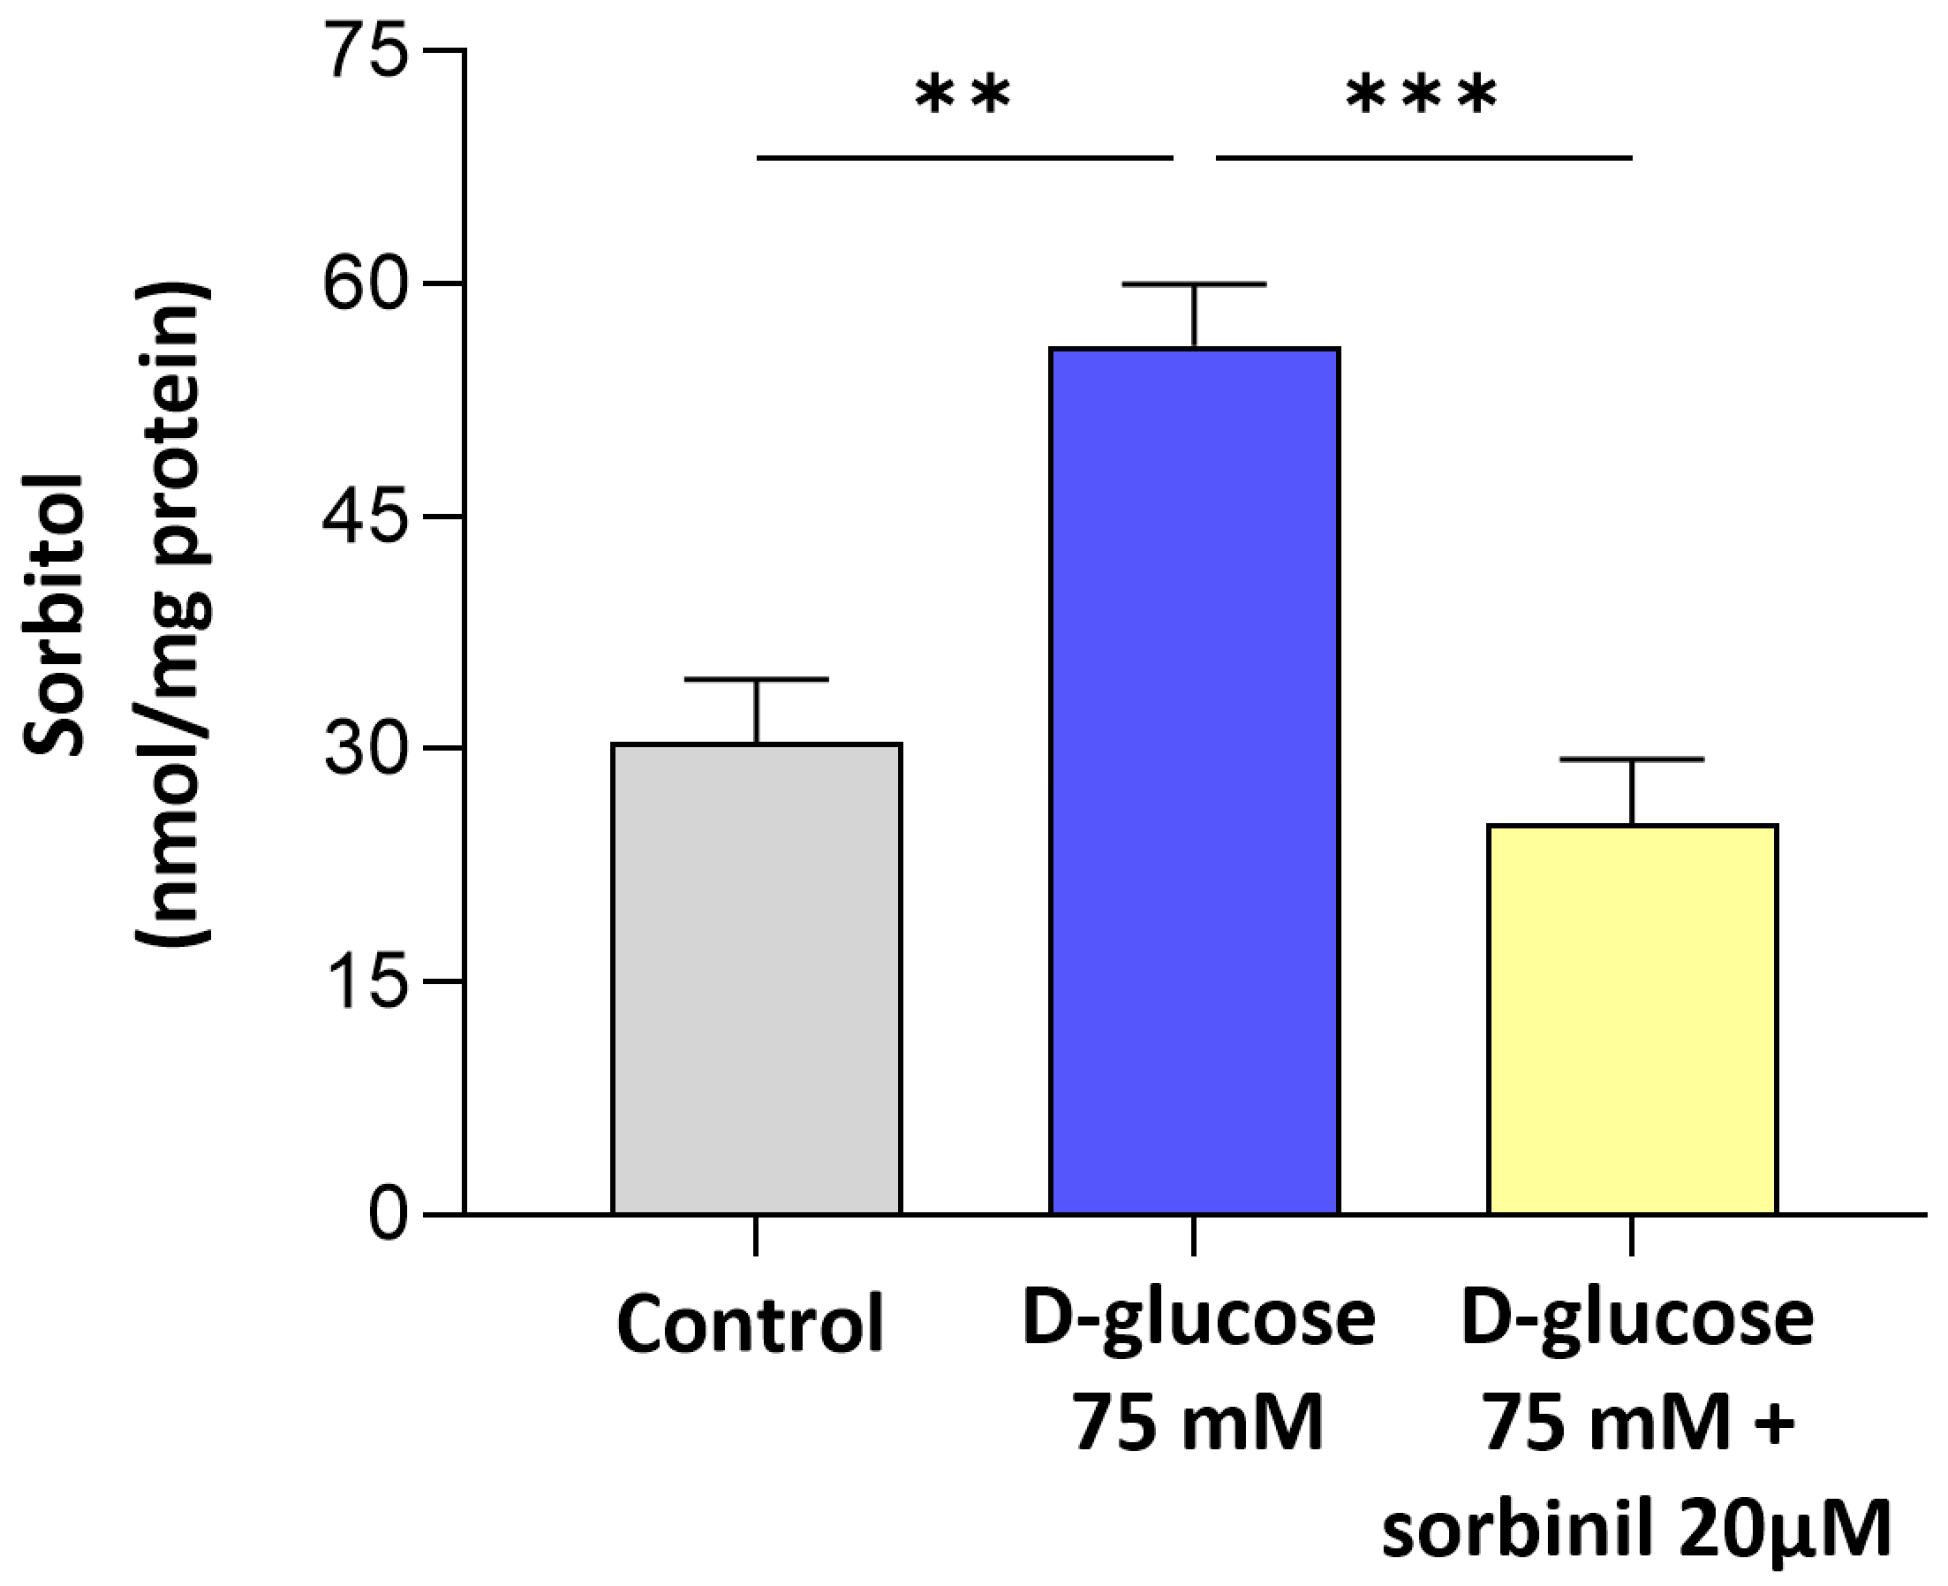
Our study provides new evidence that AKR1B1 actively contributes to the inflammatory response of retinal Müller glial cells under acute hyperglycemic conditions. Although the expression of AKR1B1 in Müller cells has been previously reported, its functional role as a mediator of inflammation within these macroglial cells remains insufficiently characterized. Our findings fill this gap by demonstrating that acute glucose increment enhances AKR1B1 activity and promotes inflammatory signaling in human MIO-M1 cells, independent of changes in cell viability or sorbitol dehydrogenase expression.
It is important to highlight that the present study is based on previous evidence indicating that the polyol pathway may modulate glial cell behavior in DR [
11]. While chronic hyperglycemia has been widely linked to oxidative stress and inflammation, acute glycemic spikes—often experienced during poor glycemic control—are now recognized as pathologically significant. Transient hyperglycemic episodes have been shown to trigger vascular dysfunction and inflammatory activation in the diabetic retina [
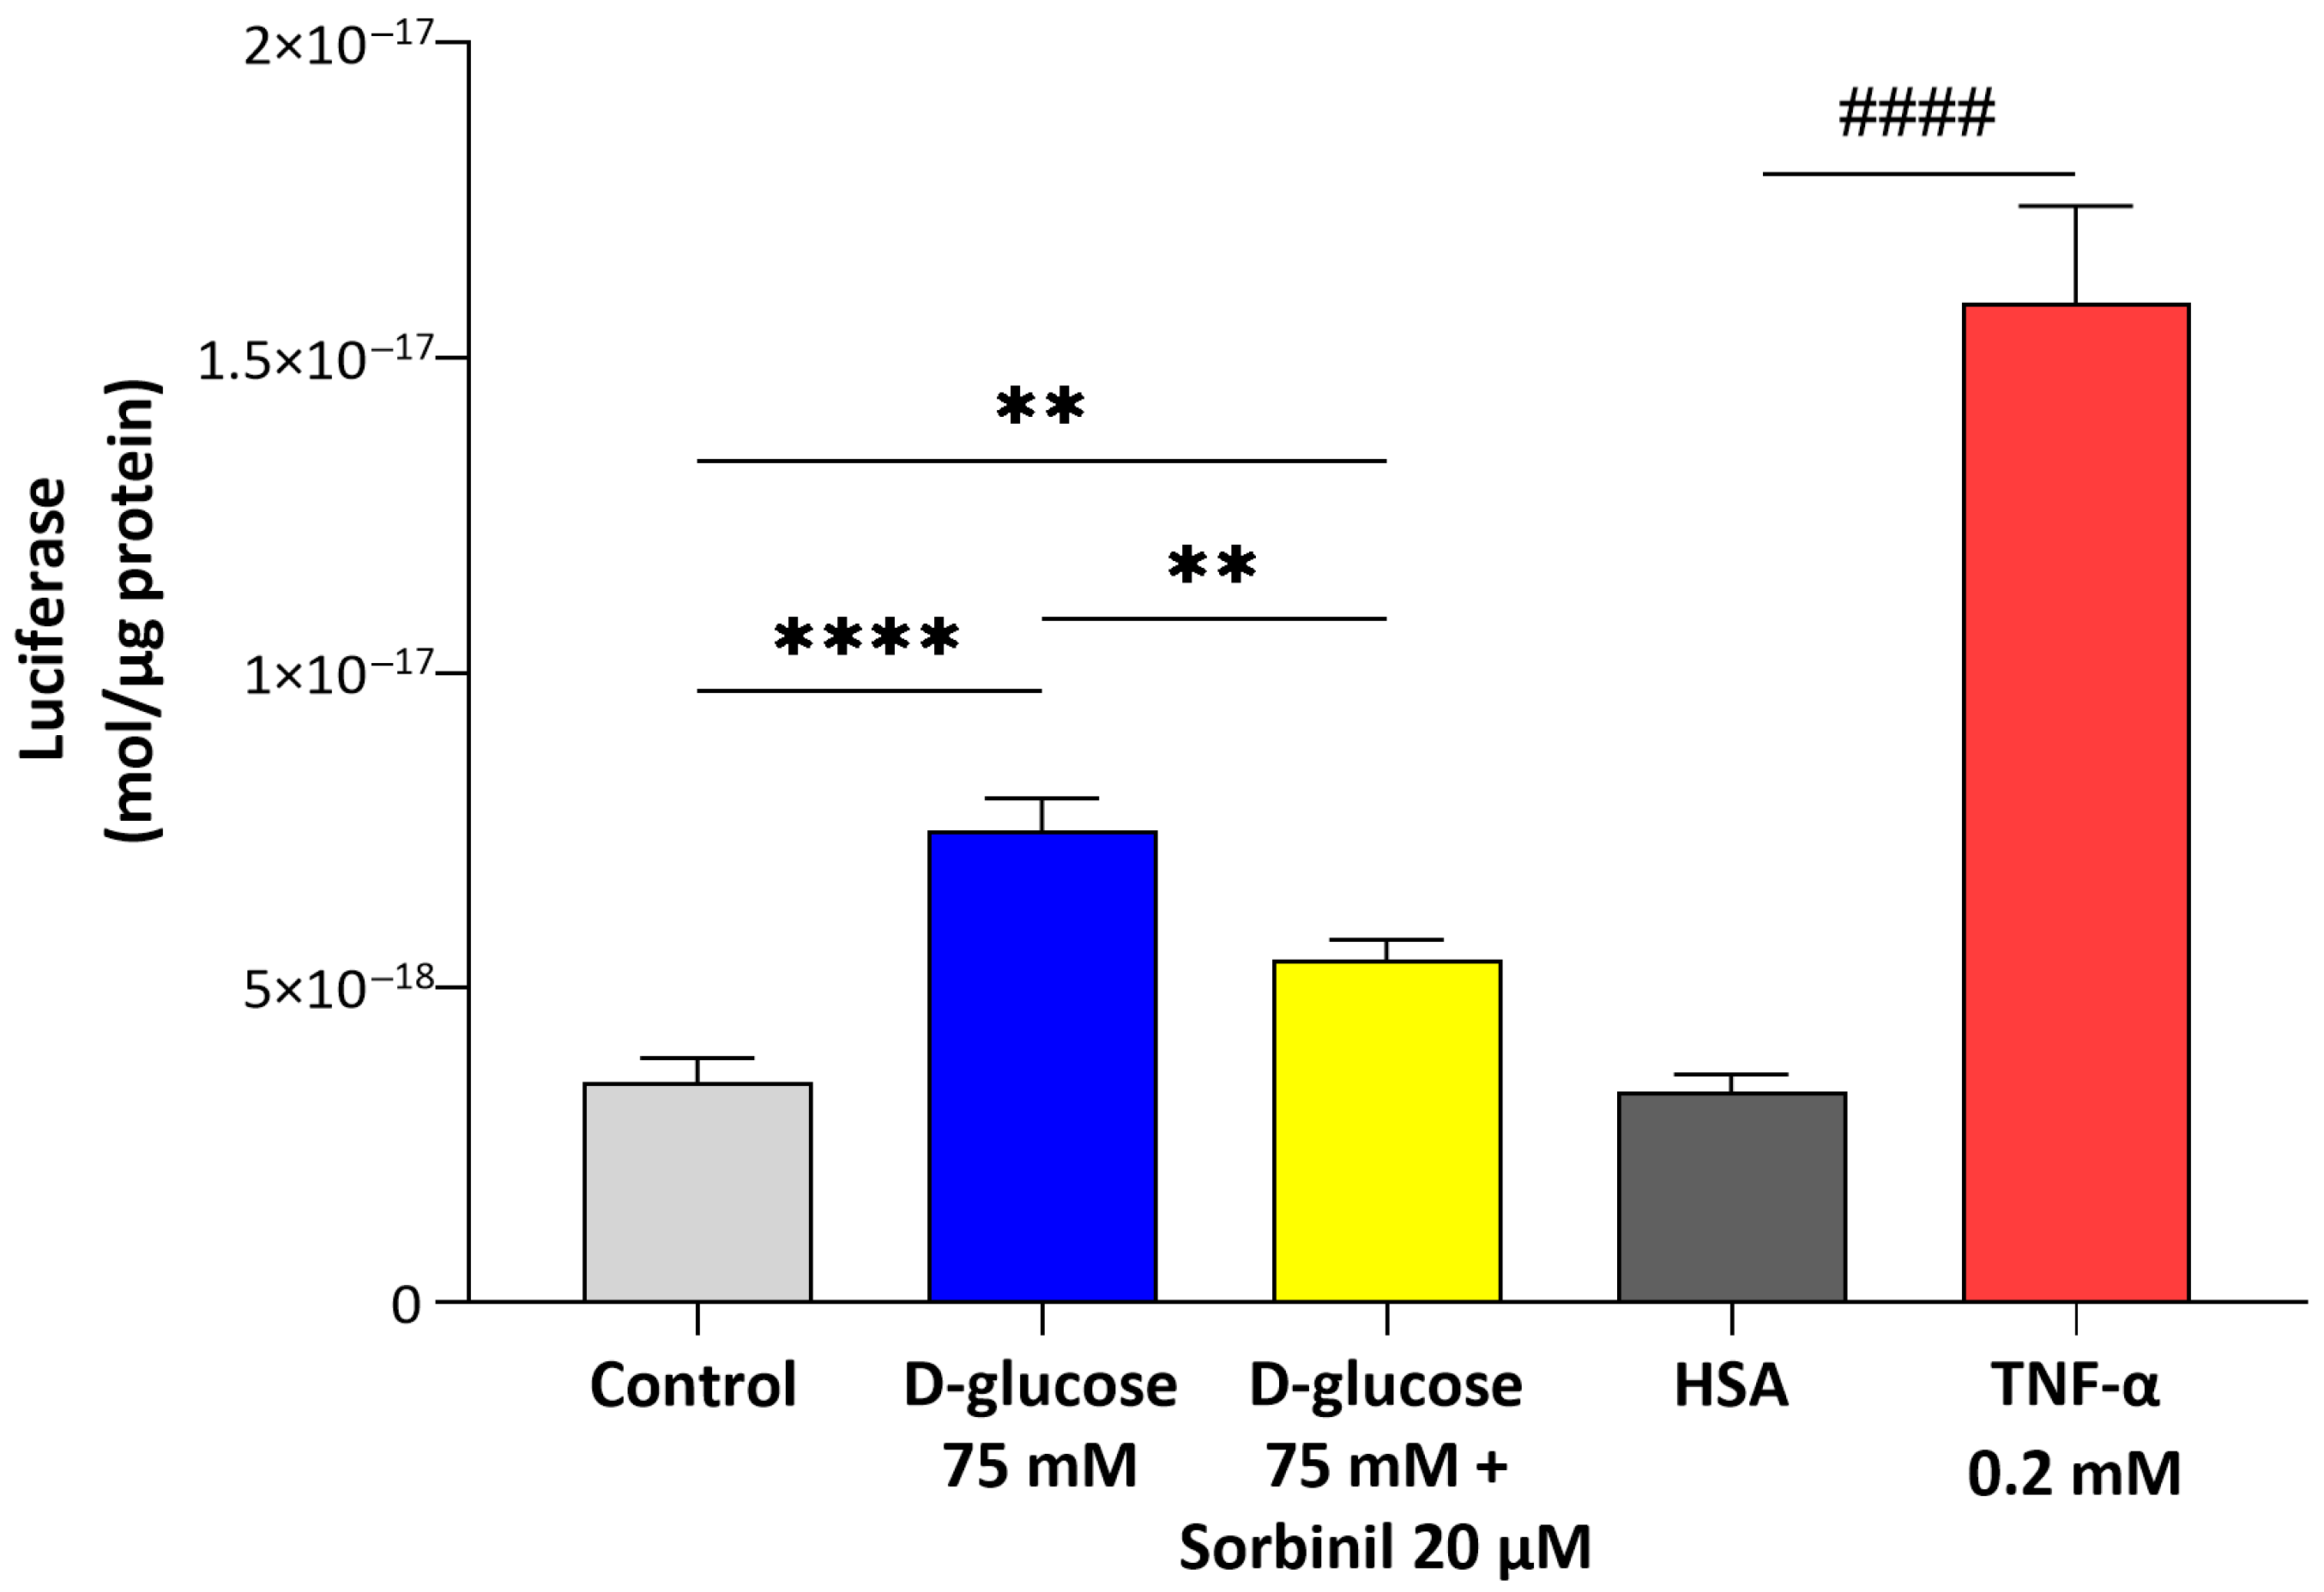
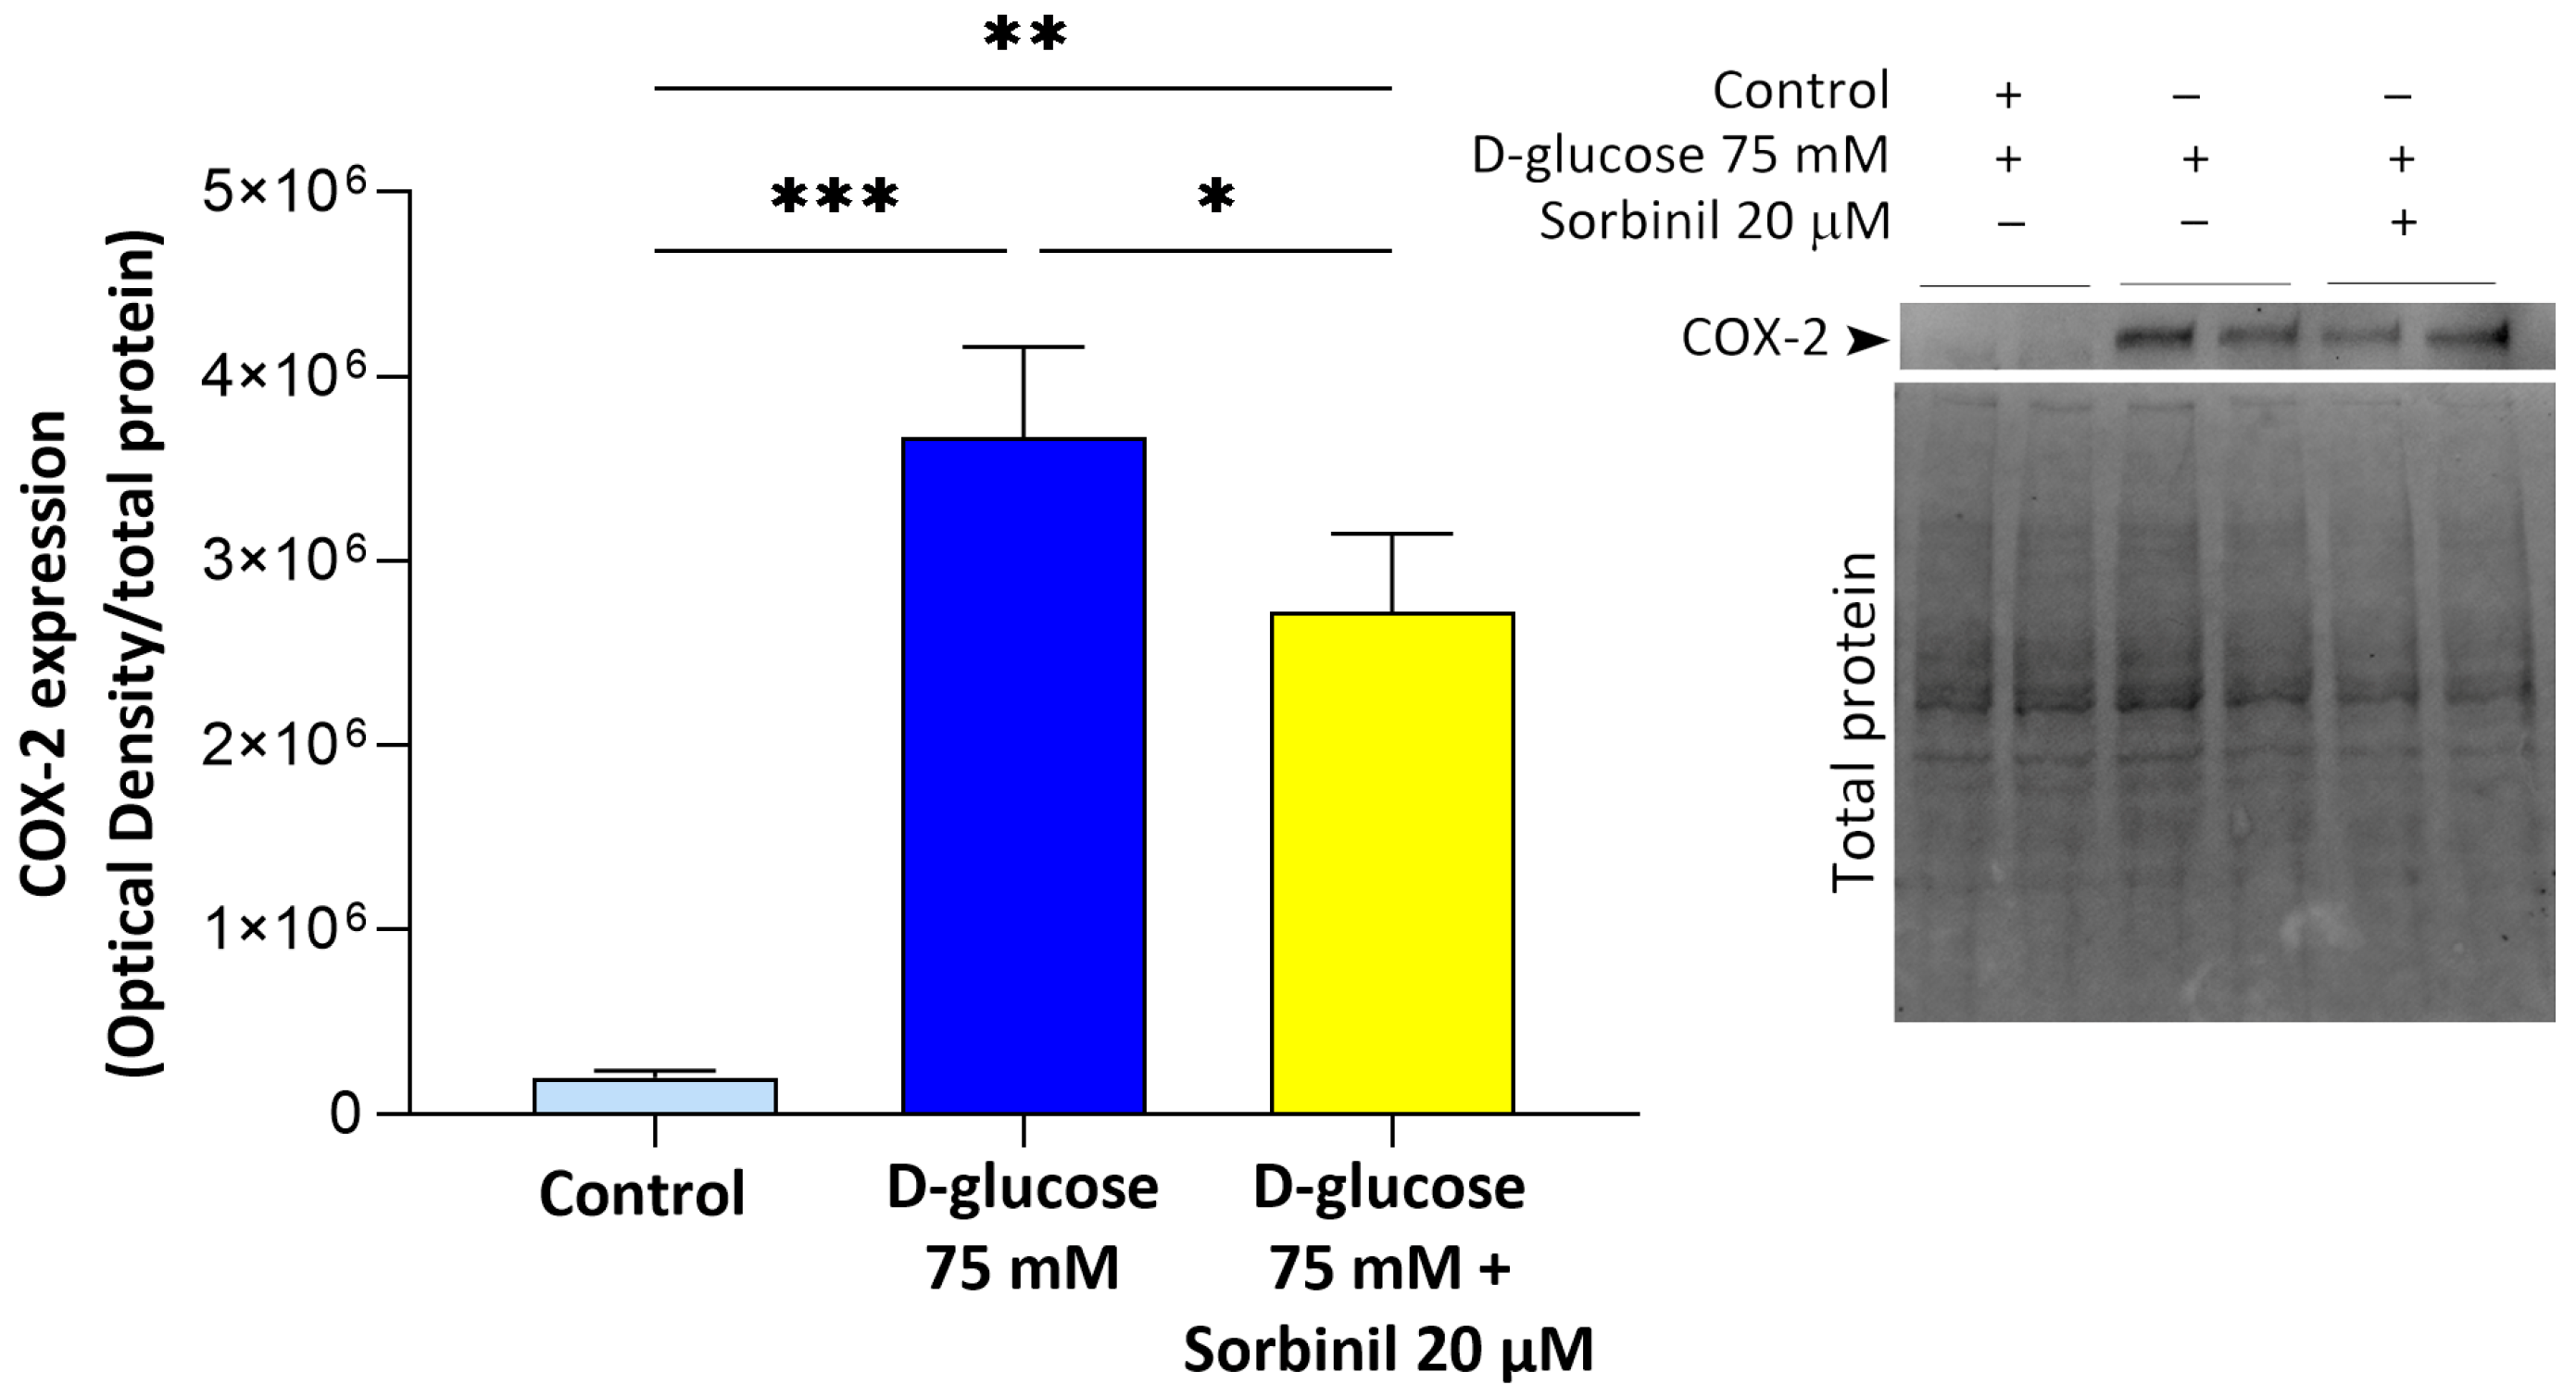
14]. In this context, our data reveal that even short-term glucose elevation is sufficient to activate nuclear factor-κB (NF-κB) and cyclooxygenase-2 (COX-2) pathways in Müller cells, suggesting that macroglial responses may represent an early and sensitive component of the retinal inflammatory cascade.
The finding that sorbitol builds up under high-glucose conditions despite unchanged SORD expression indicates a bottleneck in the polyol pathway, where increased AKR1B1 activity drives metabolic imbalance. This is in line with previous reports in other cell types [
21], but our data extends this concept specifically to retinal glia. Notably, the contribution of AKR1B1 to inflammatory responses appears to be cell type-dependent: while in retinal glia we observed a clear link between AKR1B1 activity and inflammation, in our previous studies on lens epithelial cells, we found that inflammation was independent of AKR1B1 activity. These findings highlight the importance of considering the specific cellular context when investigating the role of AKR1B1 in glucose-induced stress responses and inflammation. In particular, the pharmacological inhibition of AKR1B1 with Sorbinil not only reduced sorbitol levels but also markedly suppressed NF-κB activation and COX-2 upregulation, directly implicating AKR1B1 in the pro-inflammatory signaling elicited by acute hyperglycemia. These findings indicate that AKR1B1 acts both as a metabolic sensor and an upstream regulator of inflammatory gene expression in Müller cells.
Although numerous studies have focused on chronic changes associated with advanced stages of the disease, our findings highlight the importance of early and transient metabolic alterations and the macroglial response to these changes. In consideration of the important role played by Müller cells in maintaining retinal homeostasis, including the regulation of ion balance, neurotransmitter recycling, and neurovascular coupling, their early activation by AKR1B1-mediated pathways could set the stage for later neurovascular dysfunction.
Importantly, the sensitivity of Müller cells to AKR1B1 inhibition under hyperglycemic stress suggests a window of opportunity for early intervention. Current treatments of DR mainly target advanced stages and vascular complications; however, modulating AKR1B1 activity during acute glycemic fluctuations could potentially mitigate glial-driven inflammation and preserve retinal integrity.
In conclusion, our study reveals a central role of the polyol pathway, and particularly AKR1B1, in contributing to inflammatory signaling in retinal Müller glial cells following acute hyperglycemic exposure. The polyol pathway can represent the mechanism for the changes seen in the Müller cells of human diabetic retinas.
While the use of the MIO-M1 cell line provides a reliable model for initial investigations, we acknowledge its limitations in fully replicating the behavior of primary cells. Future studies in primary human Müller cells and murine models of diabetic retinopathy will be essential to confirm and refine these findings, thereby enhancing their physiological and translational relevance.
By identifying AKR1B1 as a key mediator of both metabolic and pro-inflammatory responses, we highlight a potential early therapeutic target in the management of diabetic retinopathy. These results emphasize the importance of viewing glial cells not merely as bystanders, but as key contributors to the early development of retinal pathology in diabetes.
4. Materials and Methods
4.1. MIO-M1 Cell Culture and Transfection
Cell culture media, fetal bovine serum (FBS), penicillin/streptomycin solution, gentamicin, and glutamine were purchased from Euroclone (Pero, Italy), hygromycin was from Merck Life Science (Milan, Italy). In vitro studies were performed using spontaneously immortalized human Müller cells (MIO-M1), kindly provided by Prof. Massimo Dal Monte (Department of Biology, General Physiology Unit, University of Pisa, Pisa, Italy) [
22].
Stable transfection of MIO-M1 cells was performed as previously reported for human lens epithelial cells [
13]. Briefly, MIO-M1 cell lines were transfected with a pGL4.32[luc2P/NF-κB-RE/Hygro] plasmid (Promega, Madison, WI, USA), which contains a hygromycin and ampicillin resistance gene. This plasmid contained five copies of the NF-κB response element (NF-κB-RE), enhancing transcription of the luc2P reporter gene encoding
Photinus pyralis luciferase. To confirm that the luminescent signal originated specifically from the expression of the luc2P reporter gene, control cells were transfected with an empty control plasmid. Transfected cells were routinely cultured at 37 °C in DMEM supplemented with 20% FBS, 1% penicillin/streptomycin, 1% L-glutamine, and 300 μg/mL hygromycin. MIO-M1 cells were sub-cultured when they reached about 70% confluency and used between passages 15–20.
Upon verification after one week that the non-transfected control cells did not survive hygromycin exposure, the selection medium was replaced with a maintenance medium containing DMEM with 20% FBS, 1% penicillin/streptomycin, 1% L-glutamine, and 200 μg/mL hygromycin. This adjustment was made to avoid the potential toxicity of prolonged exposure to high hygromycin concentrations, even in stably transfected cells.
4.2. Evaluation of the Firefly Luciferase Expression
To assess NF-κB activation, the expression of a Firefly luciferase reporter gene was quantified based on the luminescent signal produced and detected using a luminometer. Prior to the assay, the culture medium was removed, and cells were gently washed with phosphate buffer saline (PBS, Merck Life Science, Milan, Italy) before being lysed using Passive Lysis Buffer (Promega, Madison, WI, USA), following the manufacturer’s guidelines (Technical Bulletin 281, Rev. 8/15). Subsequently, 20 µL of the resulting cell lysate was mixed with 100 µL of luciferase Assay Reagent (Promega, Madison, WI, USA) and incubated at 37 °C to initiate the luminescence reaction. The luciferase content was estimated using a calibration curve generated from known quantities of purified Firefly luciferase standard (QuantiLuM, Promega, Madison, WI, USA)), ranging from 10–15 to 10–19 moles. Final values were normalized to the total protein concentration in each sample.
4.3. MIO-M1 Cells Treatment
To induce acute hyperglycemic conditions, cells were serum-starved for 24 h in DMEM containing 0.5% FBS, 50 mU/mL penicillin/streptomycin, 2 mM glutamine, and 1% non-essential amino acid solution and then treated with 75 mM D-glucose dissolved in PBS for 24 h in the same low-serum medium, or with an equal volume of the sole PBS for control group. Sorbinil was dissolved in DMSO (Merck Life Science, Milan, Italy) and, where specified, administered to MIO-M1 cells simultaneously with the serum starvation at a final concentration of 20 μM and a final DMSO percentage of 0.05% (v/v). The control group received the only vehicle, DMSO, at a final concentration of 0.05% (v/v).
To mimic inflammatory stress, cells were treated with 0.2 nM TNF-α (Merck Life Science, Milan, Italy) dissolved in human serum albumin (HSA) or with an equal volume of HSA alone for the control group.
At the end of the reported incubation periods, cells were lysed as indicated for future analysis. Total protein concentration was determined by Bradford assay (Bradford, 1976), using a Bio-Rad protein assay kit.
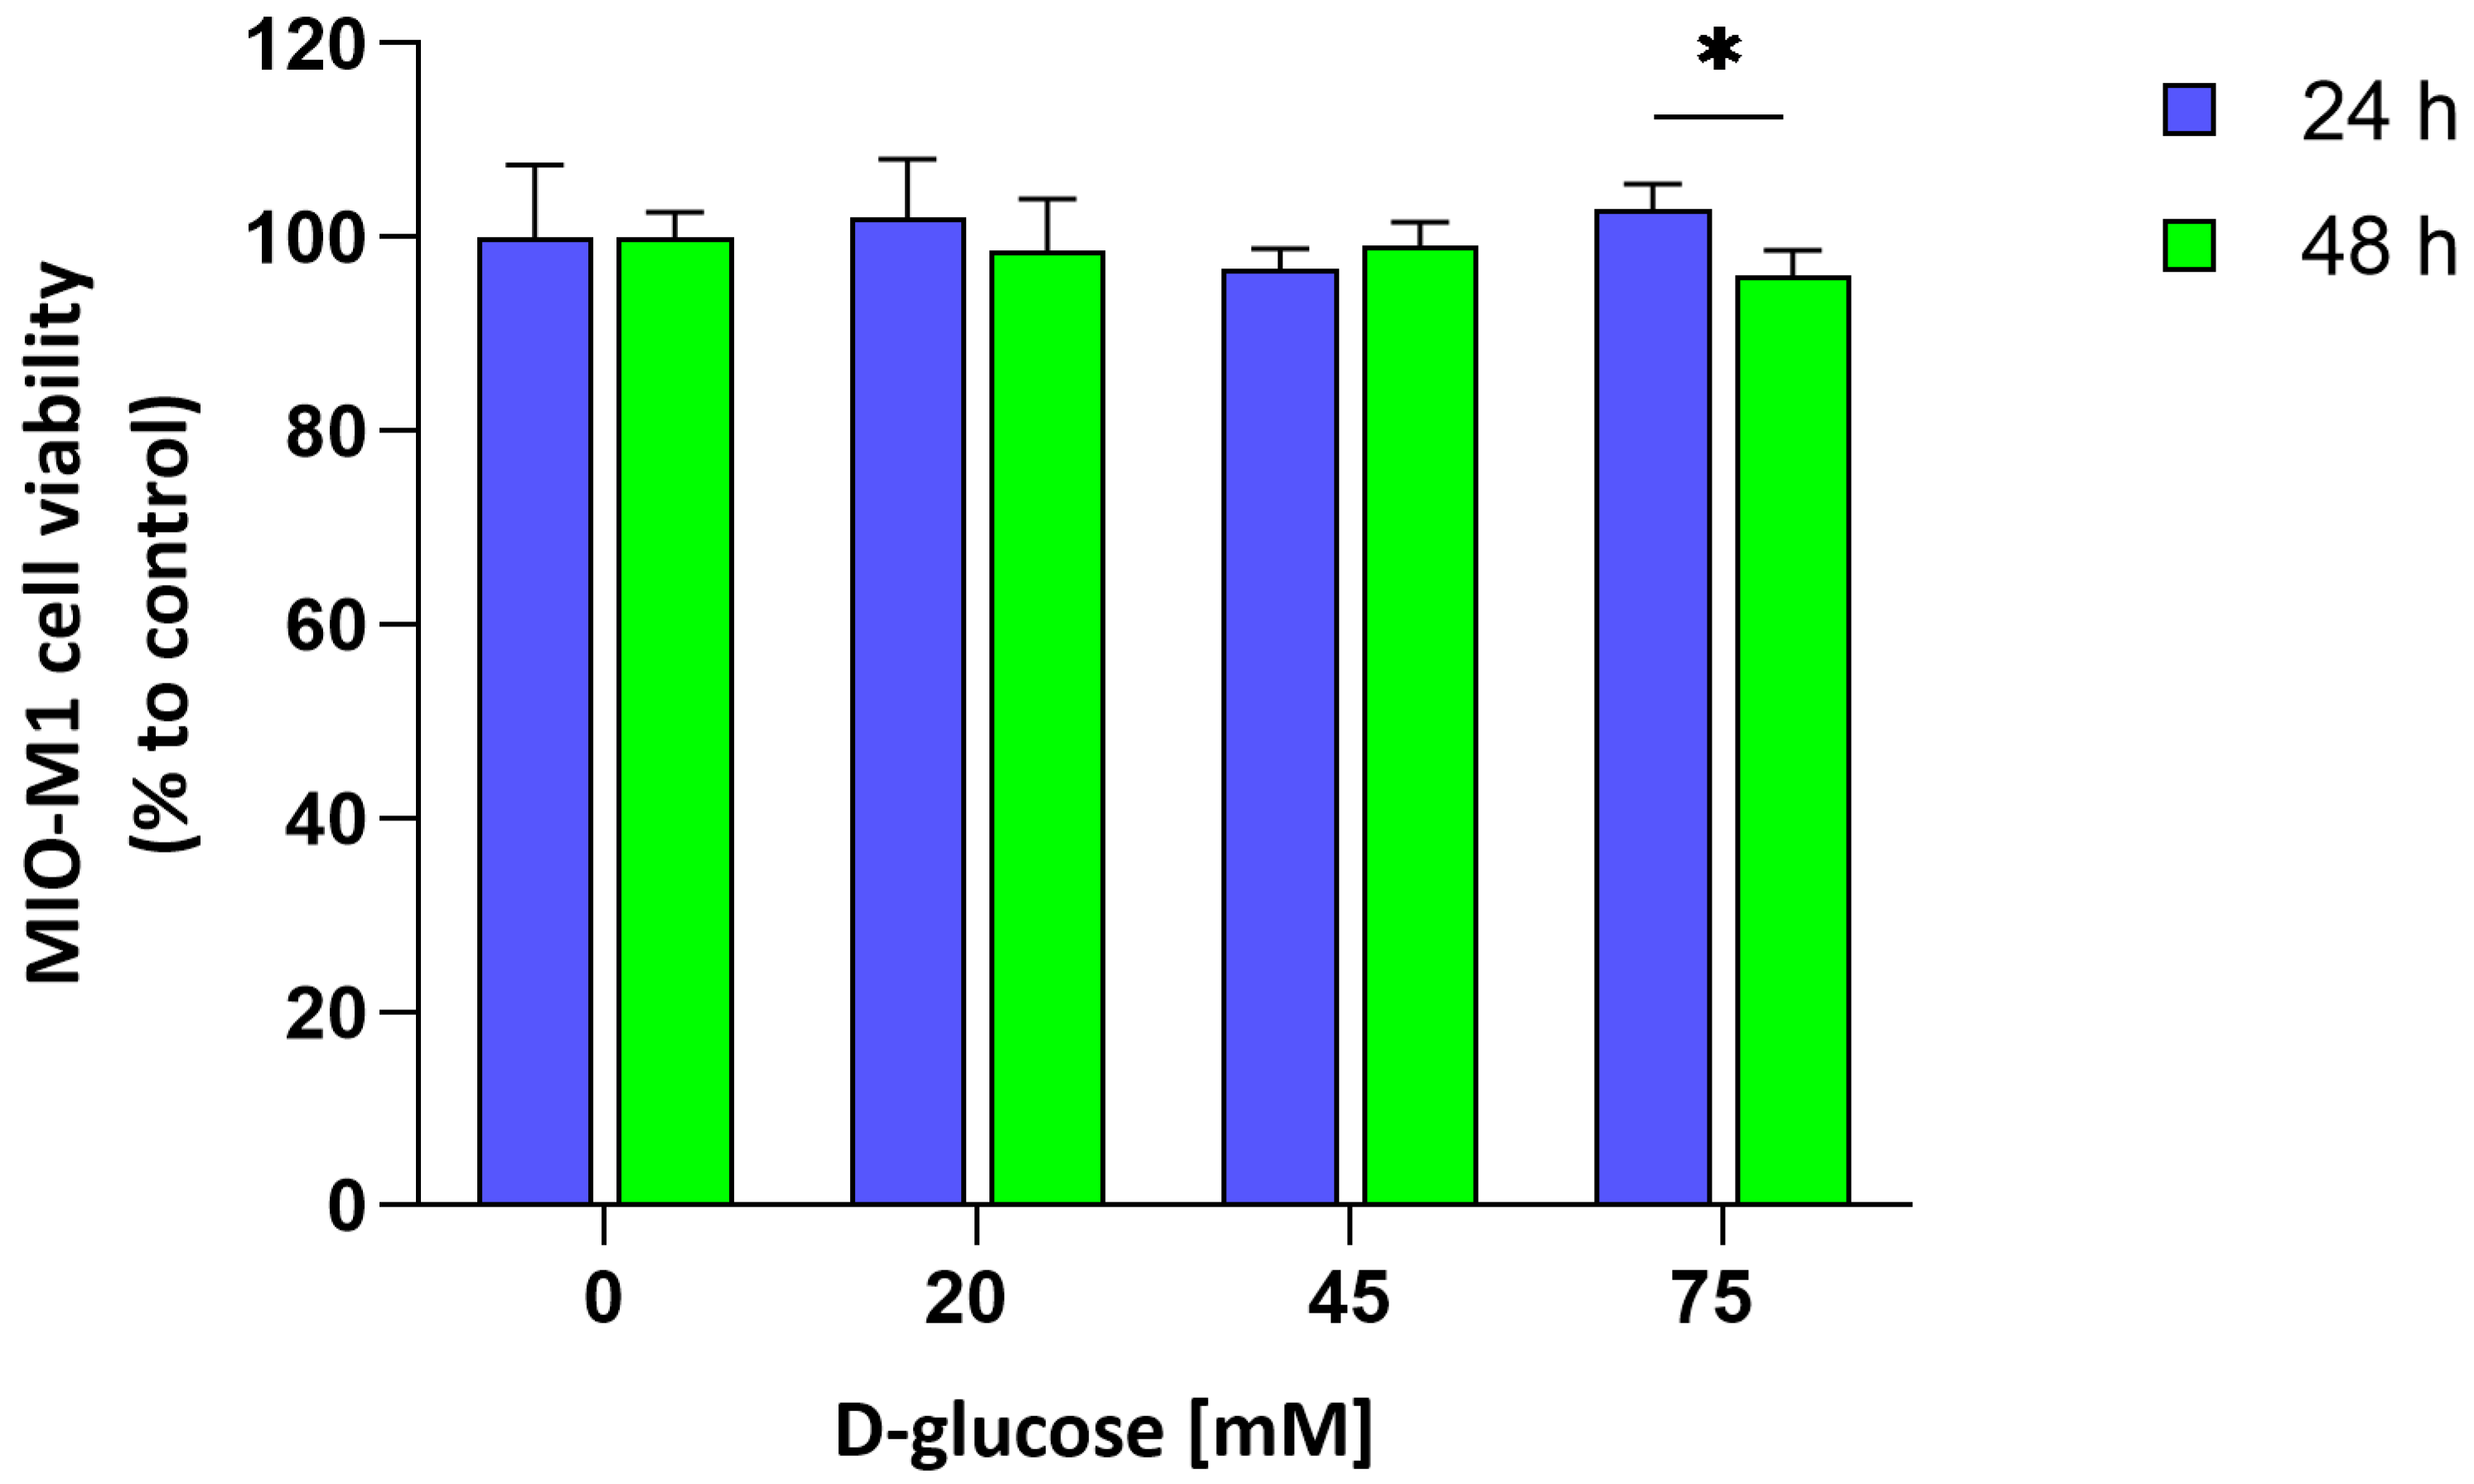
4.4. MIO-M1 Cells Viability
To evaluate the cytotoxic effect of acute hyperglycemia on MIO-M1 cells, a modified MTT assay was performed, following the method originally described [
23]. Briefly, cells were cultured in 24-well plates at a density of 18,000 cells/cm
2 and exposed to 75 mM D-glucose for either 24 or 48 h. At each time point, the medium was removed and cells were incubated with 0.5 mg/mL MTT solution (Merck Life Science, Milan, Italy) at 37 °C for 30 min in a humidified 5% CO
2 atmosphere. After incubation, the formazan crystals were dissolved by the addition of an equal volume of isopropanol containing 0.04 N HCl, and the absorbance at the wavelength of 563 nm was measured through a microplate reader.
4.5. Western Blotting
For the Western blot assay, MIO-M1 cell extracts were collected as follows. Phenylmethylsulfonide fluoride (PMSF) was from Merck Life Science (Milan, Italy). All inorganic chemicals were of reagent grade, from VWR (Poole, Dorset, UK) After medium removal, cells were washed with PBS containing protease and phosphatase inhibitors (10 mM NaF, 10 mM Na
4O
7P
2, 2 mM Na
3VO
4, 33 mM β-glycerophosphate, and 1 mM PMSF, final concentrations). Then, cells were incubated with Lysis Buffer (Cell Signaling, Danvers, MA, USA) for 5 min at room temperature. The obtained cell lysates were collected and incubated on ice for an additional 10 min, followed by centrifugation at 14,000×
g for 10 min at 4 °C. A total of 20 µg of protein was mixed (1:1,
v:
v) with 4× Laemmli Reducer supplemented with 10% (
w/
v) SDS and 0.7 M β-mercaptoethanol, then heated at 70 °C for 10 min and cooled on ice before loading. The protein content was quantified by using Bradford’s assay [
24]. Twenty micrograms of protein from each sample were separated by SDS-PAGE (12%) prepared using the TGX Stain-Free™ FastCast™ Acrylamide Kit (Bio-Rad Laboratories, Hercules, CA, USA). Proteins were transferred onto a 0.2 μm PVDF membrane, using the precast Trans-Blot Turbo Transfer Pack Midi kit (Bio-Rad) at 25 V and 1.3 A for 6 min, using a Trans-Blot Turbo Transfer System (Bio-Rad). Membranes were blocked with 5% (
w/
v) non-fat dry milk in 50 mM Tris-HCl buffer pH 7.5, containing 150 mM NaCl and 0.1% (
v/
v) Tween
® 20 (TBS-T) for 1 h at room temperature and subsequently incubated overnight at 4 °C with mouse anti-AKR1B1 (OriGene, Rockville, MD, USA, cat. number: TA346874, diluted 1:1000 in 5% milk/TBS-T) or rabbit anti-COX-2 (Cell Signaling, cat. number: 4842, diluted 1:1000 in 5% milk/TBS-T) primary antibodies. Subsequently, membranes were washed in TBS-T and incubated for 1 h at room temperature with HRP-conjugated secondary anti-mouse antibody (Cell Signaling, cat. number: 7076, diluted 1:1000 in 5% milk/TBS-T) or anti-rabbit (Cell Signaling, cat. 7074, dilution 1:1000 in 5% milk/TBS-T) antibodies.
Blots were developed using the Immobilon™ Western chemiluminescent HRP substrate (Bio-Rad), and signals were detected with a CCD-based ChemiDoc System device (Bio-Rad). The optical density (OD) of the target bands was evaluated by ImageLab 3.0 software (Bio-Rad). The data were normalized to the corresponding OD of total protein content visualized via stain-free technology (Bio-Rad).
4.6. Enzymatic Determination
For the enzymatic assay, MIO-M1 cells were rinsed with PBS containing 1 mM PMSF, then collected using a scraper and transferred to an Eppendorf tube. Cellular lysis was performed by three rapid F/T cycles, followed by centrifugation at 4 °C for 15 min at 14,000×
g. The supernatant was retained, and protein content was quantified for the subsequent normalization. AKR1B1 activity was measured following previously established protocols [
25], by measuring the decrease in absorbance at 340 nm due to NADPH oxidation (ε
340 = 6.22 mM
−1·cm
−1) at 37 °C using a Biochrom Libra S32 spectrophotometer (Biochrom Ltd., Cambridge, UK). The standard reaction mixture (final volume of 0.7 mL) included 0.25 M of sodium phosphate buffer, a pH of 6.8, 0.5 mM of EDTA, 0.38 M of ammonium sulfate, 0.18 mM of NADPH, and 10 mM of L-idose as a specific substrate.
SORD activity was measured as described by Sardelli et al. [
13], by monitoring the decrease in absorbance at 340 nm due to NADH oxidation (ε
340 = 6.22 mM
−1·cm
−1) at 37 °C using a Biochrom Libra S32 spectrophotometer. The standard reaction mixture (final volume of 0.7 mL) included 100 mM of Tris/HCl buffer at a pH of 7.4, 0.24 mM of NADH, and 0.4 M of fructose as a substrate. The enzymatic reaction was initiated by the addition of the substrate. One unit of enzymatic activity was defined as the amount of enzyme required to convert 1 μmol of substrate per minute under these specific assay conditions.
4.7. Determination of Sorbitol Content
To quantify the intracellular sorbitol content, an in-house spectrofluorimetric assay using purified SORD as an ancillary enzyme was employed. Firstly, MIO-M1 cells were rinsed with PBS containing 1 mM PMSF, then collected using a scraper and transferred to an Eppendorf tube. Cellular lysis was performed by three rapid F/T cycles, followed by centrifugation at 4 °C for 15 min at 14,000× g. The supernatant was retained, and protein content was quantified for the subsequent normalization. Samples underwent protein precipitation with the addition of 1 M perchloric acid and centrifugation at 4 °C for 5 min at 14,000× g. The resulting supernatant was brought to pH 7 by adding KOH, and again centrifuged at 4 °C for 15 min at 14,000× g. For the determination of sorbitol content, aliquots of the prepared supernatant were added to a reaction mixture (final volume 200 μL) containing 0.24 mM NAD+ and 150 mU of purified SDH in 100 mM Tris-HCl buffer, pH 8. The reaction was initiated by the addition of NAD+. Fluorescence was measured at an emission wavelength of 460 nm, with excitation at 355 nm, for a total time of 10 min at 37 °C. Sorbitol concentration was determined using a calibration curve obtained by performing the reaction described with known D-sorbitol concentrations ranging from 5 to 40 µM, and the results were normalized to the protein content of the samples.
4.8. Statistical Analysis
Data are presented as mean ± SEM of independent experiments. Comparisons were made using Student’s t-test or by ANOVA when appropriate, followed by Tukey’s Multiple Comparison post hoc test or Dunnett’s test to compare the difference between two groups. Values of p ≤ 0.05 were considered statistically significant. GraphPad Prism Software, version 6.07 (GraphPad Software, Inc., La Jolla, CA, USA), was used to perform statistical analysis.


 ,
, 


