Article

TIM-3/Galectin-9 Immune Axis in Colorectal Cancer in Relation to KRAS, NRAS, BRAF, PIK3CA, AKT1 Mutations, MSI Status, and the Cytokine Milieu

1
Department of Medical and Molecular Biology, Faculty of Medical Sciences in Zabrze, Medical University of Silesia, 19 Jordana, 41-808 Zabrze, Poland
2
Department of Oncological Surgery, Faculty of Medical Sciences in Zabrze, Medical University of Silesia, 41-808 Katowice, Poland
3
Department of General and Bariatric Surgery and Emergency Medicine in Zabrze, Faculty of Medical Sciences in Zabrze, Medical University of Silesia, 10 Marii Curie-Skłodowskiej, 41-800 Zabrze, Poland
4
Department of Microbiology and Immunology, Faculty of Medical Sciences in Zabrze, Medical University of Silesia, 19 Jordana, 41-808 Zabrze, Poland
*
Author to whom correspondence should be addressed.
Int. J. Mol. Sci. 2025, 26(14), 6735; https://doi.org/10.3390/ijms26146735
Submission received: 20 April 2025 / Revised: 10 July 2025 / Accepted: 12 July 2025 / Published: 14 July 2025

Abstract

In this study, we investigated the expression of TIM-3 and Galectin-9 (Gal-9) in colorectal cancer (CRC) and their associations with oncogenic mutations, MSI status, cytokine profiles, and transcriptional data. TIM-3 and Gal-9 protein levels were significantly increased in CRC tissues compared to matched non-tumor margins (p < 0.05 and p < 0.001, respectively). TIM-3 protein concentration was notably higher in PIK3CA-mutated tumors (p < 0.05), while no associations were found with KRAS, NRAS, BRAF, AKT1, or MSI status. Multiplex cytokine profiling revealed strong correlations between TIM-3 and Gal-9 levels and key immunomodulatory pathways, including IL-10, IL-17, and chemokine signaling. We also observed significant associations with cytokine subsets involved in protumor activity and immune regulation. Gene set enrichment analysis (GSEA) demonstrated that high TIM-3 and Gal-9 expression was associated with upregulation of cell cycle-related pathways, and downregulation of immune signatures, such as interferon responses and TNF-α/NFκB signaling. These findings suggest that increased TIM-3 and Gal-9 expression reflects a shift toward proliferative activity and immune suppression in the CRC tumor microenvironment, highlighting their potential as biomarkers of immunoevasive tumor phenotypes, especially in PIK3CA-mutant CRC tumors.

1. Introduction

Over recent decades, progress in immunology has led to the discovery of novel immune checkpoint molecules, playing a role in shaping current approaches to cancer immunotherapy [1]. Monoclonal antibodies targeting immune checkpoints such as programmed death-1 (PD-1)/programmed death-ligand 1 (PD-L1) and cytotoxic T lymphocyte-associated protein 4 (CTLA-4) have demonstrated remarkable efficacy, including in patients with colorectal cancer (CRC) [2,3]. These therapies enhance the immune system’s capacity to recognize and attack tumor cells and are considered promising for long-term tumor control and lowering the risk of cancer recurrence. Nonetheless, a considerable proportion of patients either fail to respond to these therapies or experience disease progression following an initial response [4]. As a result, extensive research is underway to identify biomarkers and patient subsets that are more likely to benefit from immune checkpoint blockade.
T cell immunoglobulin and mucin domain-containing protein 3 (TIM-3), together with lymphocyte activation gene-3 (LAG-3) and T cell immunoreceptor with Ig and ITIM domains (TIGIT), constitutes the next generation of immune checkpoints [5]. TIM-3, an inhibitory receptor, plays a critical role in maintaining immune tolerance. Initially described as a co-inhibitory molecule involved in regulating Type I immune responses, TIM-3 is expressed on differentiated IFN-γ-producing CD4+ and CD8+ T cells [6]. TIM-3 has also been identified as an important regulator of T cell and apoptosis modulator, particularly affecting CD8+ T cells in the context of chronic infections and cancer [7,8]. Exhausted T cells demonstrate impaired proliferation and diminished effector functions, such as cytokine production and cytotoxic activity, significantly impeding effective antitumor immunity [9]. TIM-3 is expressed on multiple immune cell types, including macrophages, dendritic cells, T lymphocytes, and natural killer (NK) cells [10,11,12]. Its interaction with its primary ligand, Galectin-9 (Gal-9), exerts multifaceted effects on immune regulation and tolerance [13,14]. However, additional ligands also interact with TIM-3, such as phosphatidylserine (PtdSer), carcinoembryonic antigen-related cell adhesion molecule 1 (CEACAM1), and high-mobility group protein B1 (HMGB1), contributing to immune suppression, apoptotic cell clearance, and modulation of T cell immunity [15,16,17]. Therefore, the interaction between TIM-3 and Gal-9 is not exclusive. Both molecules participate in multiple signaling pathways through various receptor-ligand interactions. Nonetheless, Gal-9 has emerged as the most functionally significant ligand of TIM-3, despite the presence of multiple other binding partners. Together, TIM-3 and Gal-9 contribute to the suppression of antitumor immune surveillance [14].
Gal-9, a β-galactoside-binding protein and a member of the galectin family, regulates numerous cellular processes. Due to its strong immunomodulatory activity in various disease settings, Gal-9 has emerged as a promising therapeutic target [18]. Originally identified in rat embryonic kidney tissue as a transmembrane urate transporter and an eosinophil chemoattractant secreted by T cells, Gal-9 is now recognized for its roles in tumor immunology [19,20]. Aberrant expression of Gal-9 in solid malignancies is associated with tumor development and metastasis, with effects on cell proliferation, differentiation, adhesion, communication, and apoptosis [21,22,23,24]. Beyond inducing T cell exhaustion and apoptosis via TIM-3 interaction, Gal-9 can also trigger adaptive immune responses by promoting IL-12 production and fostering dendritic cell maturation and cytokine release [25,26,27]. Moreover, it facilitates the differentiation of regulatory T cells (Tregs) while inhibiting T helper 1 (Th1) and Th17 cells, thereby curbing excessive immune activity and inflammation [11,28,29]. Additionally, Gal-9 modulates other immune receptors, including PD-1, CD40, VISTA, and 4-1BB on T cells, as well as Dectin-1 and CD206 on macrophages, underscoring the complexity of its immunoregulatory functions [26,30,31,32,33,34]. TIM-3 and Gal-9 are increasingly regarded as promising targets for next-generation immunotherapies. However, the molecular determinants, including genetic mutations that govern their expression and functional activity, remain incompletely understood and warrant further investigation.
The NCCN Clinical Practice Guidelines in Oncology recommend testing for seven key biomarkers, including KRAS, NRAS, BRAF, and MSI status, to guide personalized treatment strategies and optimize clinical decision-making in CRC [35]. The mutational profile of CRC tumors, including KRAS, NRAS, BRAF, PIK3CA, and AKT1 gene mutation and MSI status significantly influences the characteristics of the tumor microenvironment (TME) and directly impacts patient prognosis. This also plays a critical role in guiding the selection of appropriate treatment strategies, including targeted therapies and immunotherapeutic approaches. The aim of this study was to quantify the expression levels of the immune checkpoint molecules TIM-3 and Gal-9 in CRC tissues and adjacent non-tumor tissue, and to investigate their associations with key oncogenic mutations, including KRAS, NRAS, BRAF, PIK3CA, and AKT1, as well as MSI status. Furthermore, we analyzed correlations between these immune checkpoint molecules and the expression of 48 selected cytokines, chemokines, and growth factors within tumor tissues to explore their relationship with the CRC TME.

2. Results

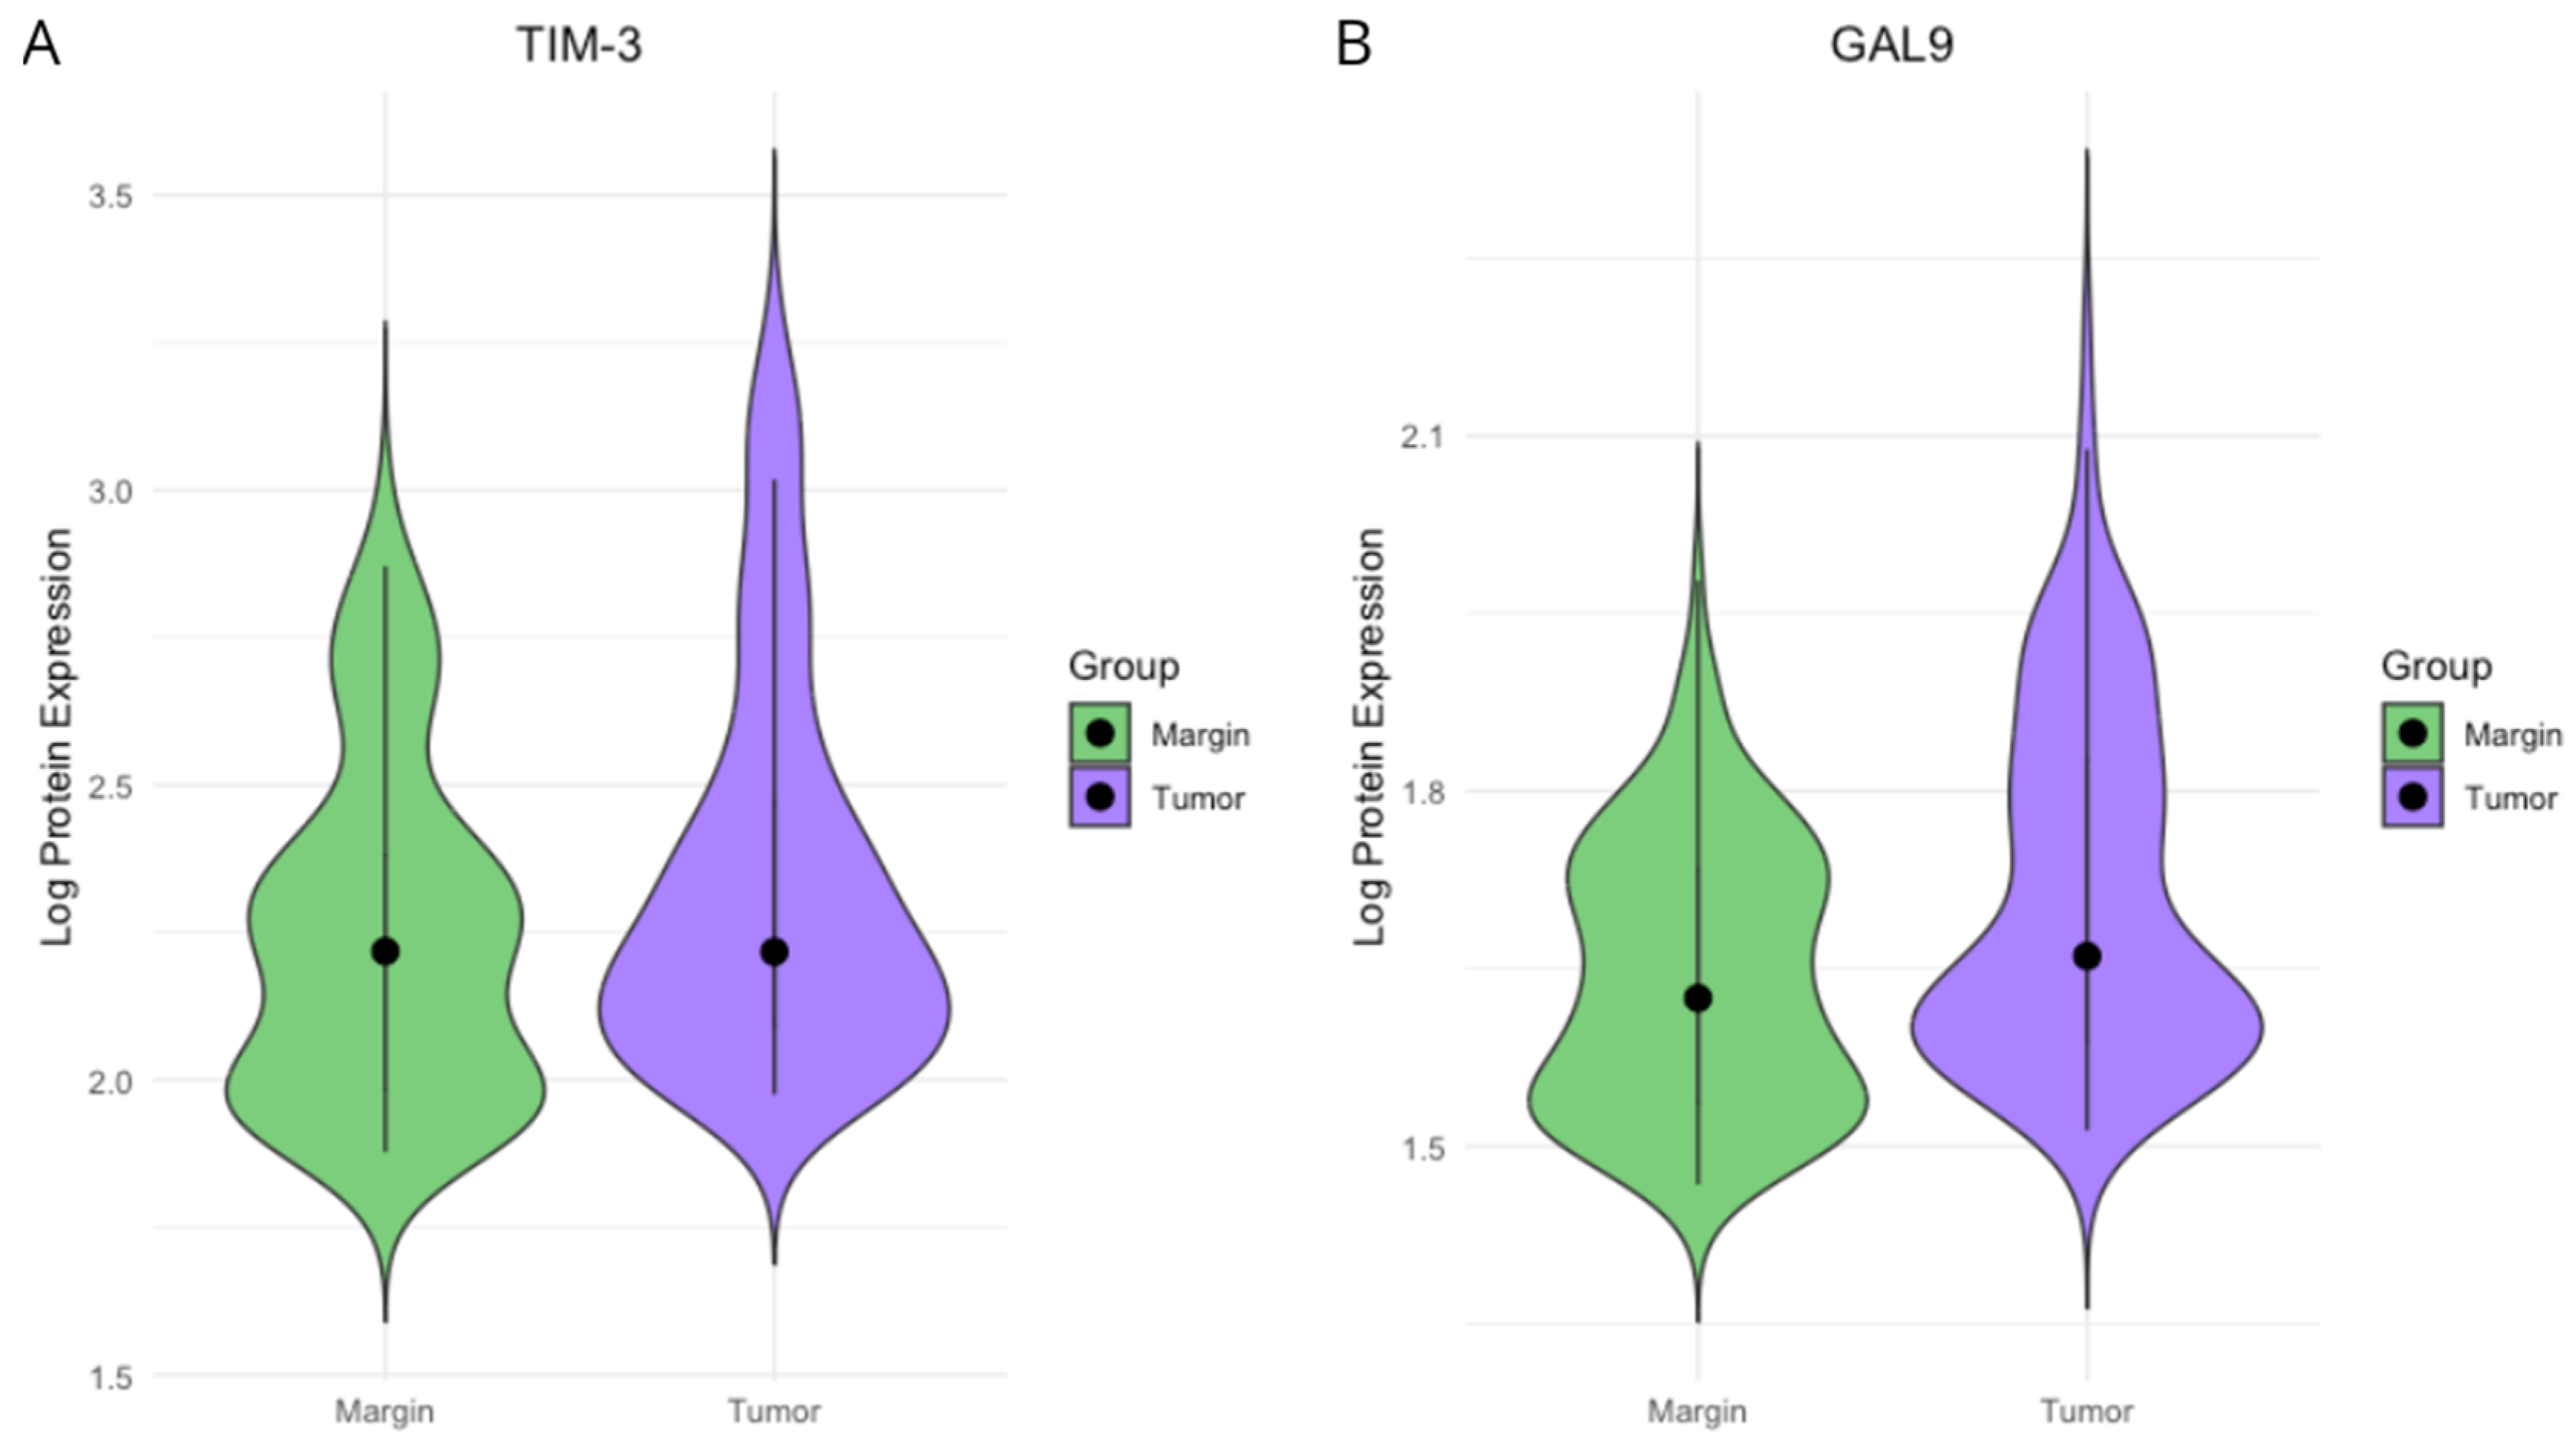
2.1. TIM3 and Gal-9 Protein Concentrations in CRC Tissue and Surgical Margin Tissue

The concentrations of TIM-3 and Gal-9 proteins were quantitatively assessed in homogenates derived from 131 colorectal cancer (CRC) tissues and 131 adjacent non-tumor tissues. To investigate differences in immune checkpoint protein expression between tumor tissue and adjacent normal tissue, we performed both non-parametric and mixed-effects modeling approaches. Preliminary comparisons using the Wilcoxon signed-rank test revealed significantly higher expression of Gal-9 and TIM-3 in tumor samples compared to matched surgical margins (both p < 0.001). To ensure comparability across samples and minimize skewness, protein concentrations were normalized using a base-10 logarithmic transformation. The distribution of TIM-3 and Gal-9 protein expression in both CRC and margin tissues is presented in Figure 1. To account for intra-subject variability, we subsequently fitted linear mixed-effects models with patient ID as a random intercept (See Table S1A,B in Supplementary Material). These models confirmed significantly elevated expression of both proteins in tumor tissue. Gal-9 expression increased by 0.0691 log-units (p < 0.0001), while TIM-3 expression increased by 0.0911 log-units (p < 0.001). Residual variances were modest, and patient-level random effects captured notable inter-individual variability (Gal-9: SD = 0.085; TIM-3: SD = 0.242). Overall, these findings demonstrate a consistent upregulation of Gal-9 and TIM-3 in the CRC tumor microenvironment.

2.2. Associations Between TIM-3 and Gal-9 Expression and KRAS, NRAS, BRAF, PIK3CA, and AKT1 Mutations

Mutational analysis of KRAS, NRAS, BRAF, PIK3CA, and AKT1 genes was performed using real-time PCR. Genetic profiling was conducted on a randomly selected subset of 104 CRC tissue samples from a total cohort of 131 patients diagnosed with CRC. Among the assessed genes, KRAS mutations were the most prevalent, identified in 36.53% (n = 38) of the analyzed cases. The most frequently occurring KRAS mutation variant was located at codons 12/13, representing 76.31% (n = 29) of all KRAS mutations and accounting for 27.88% of the entire cohort. NRAS mutations were detected in 12.50% (n = 13) of samples, while alterations in PIK3CA and BRAF genes were each present in 6.73% (n = 7) of cases. Within the PIK3CA-mutated subgroup, the 542/545 hotspot mutation occurred in 85.71% (n = 6) of cases. A mutation in the AKT1 gene was identified in a single case, corresponding to 0.943% of the examined cohort. In the analyzed cohort, 10 tumors (9.615%) exhibited mutations in more than one of the studied genes. Among these, the most common co-mutation involved KRAS and PIK3CA, identified in 3.85% of tumors (n = 4). This was followed by concurrent mutations in KRAS and NRAS, found in 2.88% of cases (n = 3). Single cases were observed with combined mutations in KRAS and BRAF, KRAS, and AKT1, and a triple mutation involving KRAS, NRAS, and BRAF, each accounting for 0.96% of the total cohort. Comprehensive frequencies and case numbers for each mutation are provided in Table 1.
A significantly increased protein concentration of the TIM-3 protein was observed in tumors harboring PIK3CA mutations (p < 0.05) when compared to tumors with wild-type PIK3CA (Figure 2). In contrast, TIM-3 expression did not show statistically significant variation based on the mutational status of KRAS, NRAS, BRAF, or AKT1 genes (p > 0.05). Similarly, Gal-9 expression was not significantly associated with any of the evaluated gene mutations (p > 0.05). Due to the relatively small number of tumors with multiple gene mutations, we also investigated whether the expression levels of TIM-3 and Gal-9 differed significantly in this whole subgroup compared to tumors lacking mutations in the KRAS, NRAS, BRAF, PIK3CA, and AKT genes. No statistically significant differences were observed in the concentrations of TIM-3 or Gal-9 between tumors with multiple gene mutations and those without detectable mutations in the analyzed genes (p > 0.05). Detailed results of statistical analyses examining TIM-3 and Gal-9 expression in relation to gene mutation status are presented in Supplementary Table S2.

2.3. TIM-3 and Gal-9 Proteins Concentration and Selected Cytokine, Chemokine, and Growth Factor Profiles

To gain a more comprehensive understanding of the associations between key immunological molecules within the CRC TME and the expression of TIM-3 and Galectin-9 proteins, we assessed the expression levels of 48 cytokines, chemokines, and growth factors using a multiplex cytokine screening panel. These molecules were classified into functional groups that represent distinct immunological processes, based on gene ontology terms and KEGG pathway annotations. Subsequently, we conducted principal component analysis (PCA) for each cytokine group to reduce dimensionality and capture dominant expression patterns. Additionally, a specific subset of cytokines previously associated with protumor activity was identified through literature review and analyzed separately using PCA, similar to our previous research [36]. Our analysis revealed that the expression levels of TIM-3 and Gal-9 proteins were significantly associated with cytokines, chemokines, and growth factors involved in several key immunological pathways, including IL-10 signaling (respectively p < 0.05, R = 0.4809, and p < 0.05, R = 0.5036) (Tables S3 and S4, Figure S1), chemokine signaling (TIM3: p < 0.01, R = 0.5698, and Gal-9: p < 0.01, R = 0.5377) (Tables S5 and S6, Figure S2), IL-17 signaling (TIM3: p < 0.05, R = 0.4176, and Gal-9: p < 0.05, R = 0.4536) (Tables S7 and S8, Figure S3), NOD-like receptor signaling (TIM3: p < 0.05, R = 0.4917, and Gal-9: p < 0.05, R = 0.5125) (Tables S9 and S10, Figure S4), macrophage chemotaxis (TIM3: p < 0.01, R = 0.5278, and Gal-9: p < 0.05, R = 0.4353) (Tables S11 and S12, Figure S5), positive regulation of lymphocyte migration (TIM3: p < 0.01, R = 0.6044, and Gal-9: p < 0.01, R = 0.5516) (Tables S13 and S14, Figure S6), and protumor activity (TIM3: p < 0.05, R = 0.422, and Gal-9: p < 0.05, R = 0.4719) (Tables S15 and S16, Figure S7). Within each of these functionally defined cytokine groups, a statistically significant, moderately strong correlation was observed between the expression of TIM-3 and Gal-9 and the first principal component (Factor 1), which accounted for approximately 50–60% of the total variance in each dataset. Detailed statistical results are presented in Table 2. In summary, our findings suggest that TIM-3 and Gal-9 expression is closely linked to distinct cytokine, chemokine, and growth factor expression profiles associated with immunoregulatory, protumor, and chemotactic pathways in the CRC TME. Comprehensive PCA outputs—including eigenvalues, percentages of variance explained for the three principal components, variable loadings after varimax rotation, scree plots, biplots, and correlation matrices—are provided in the Supplementary Materials (Tables S2–S15 and Figures S1–S7). Significant FDR-corrected correlations between Dim.1 and GAL9 expression were found in four pathways: chemokine signaling, IL-10 signaling, NOD-like receptor signaling, and lymphocyte migration (Table S17). For TIM-3, three pathways showed significant associations: chemokine signaling, macrophage chemotaxis, and lymphocyte migration (Table S17).

2.4. TIM-3 and Gal-9 Protein Concentration on TNM Staging, Tumor Grade, Primary Tumor Localization, and MSI Status

We investigated the associations between clinical and pathological tumor characteristics and the concentrations of TIM-3 and Gal-9 proteins in the analyzed cohort. The analyzed parameters included TNM classification, clinical stage, histological grade, primary tumor location (right-sided vs. left-sided), tumor-infiltrating lymphocytes (TILs), and MSI status. No significant associations were observed between TIM-3 or Gal-9 protein concentrations and any of the investigated clinicopathological features (p > 0.05). Detailed statistical outcomes are provided in Supplementary Tables S18 and S19. Based on our findings, neither TIM-3 nor Gal-9 protein levels demonstrated prognostic relevance. Moreover, TIM-3 and Gal-9 concentrations did not differ significantly between tumors with MSI (n = 14) and those with MSS status (n = 65), (p > 0.05).

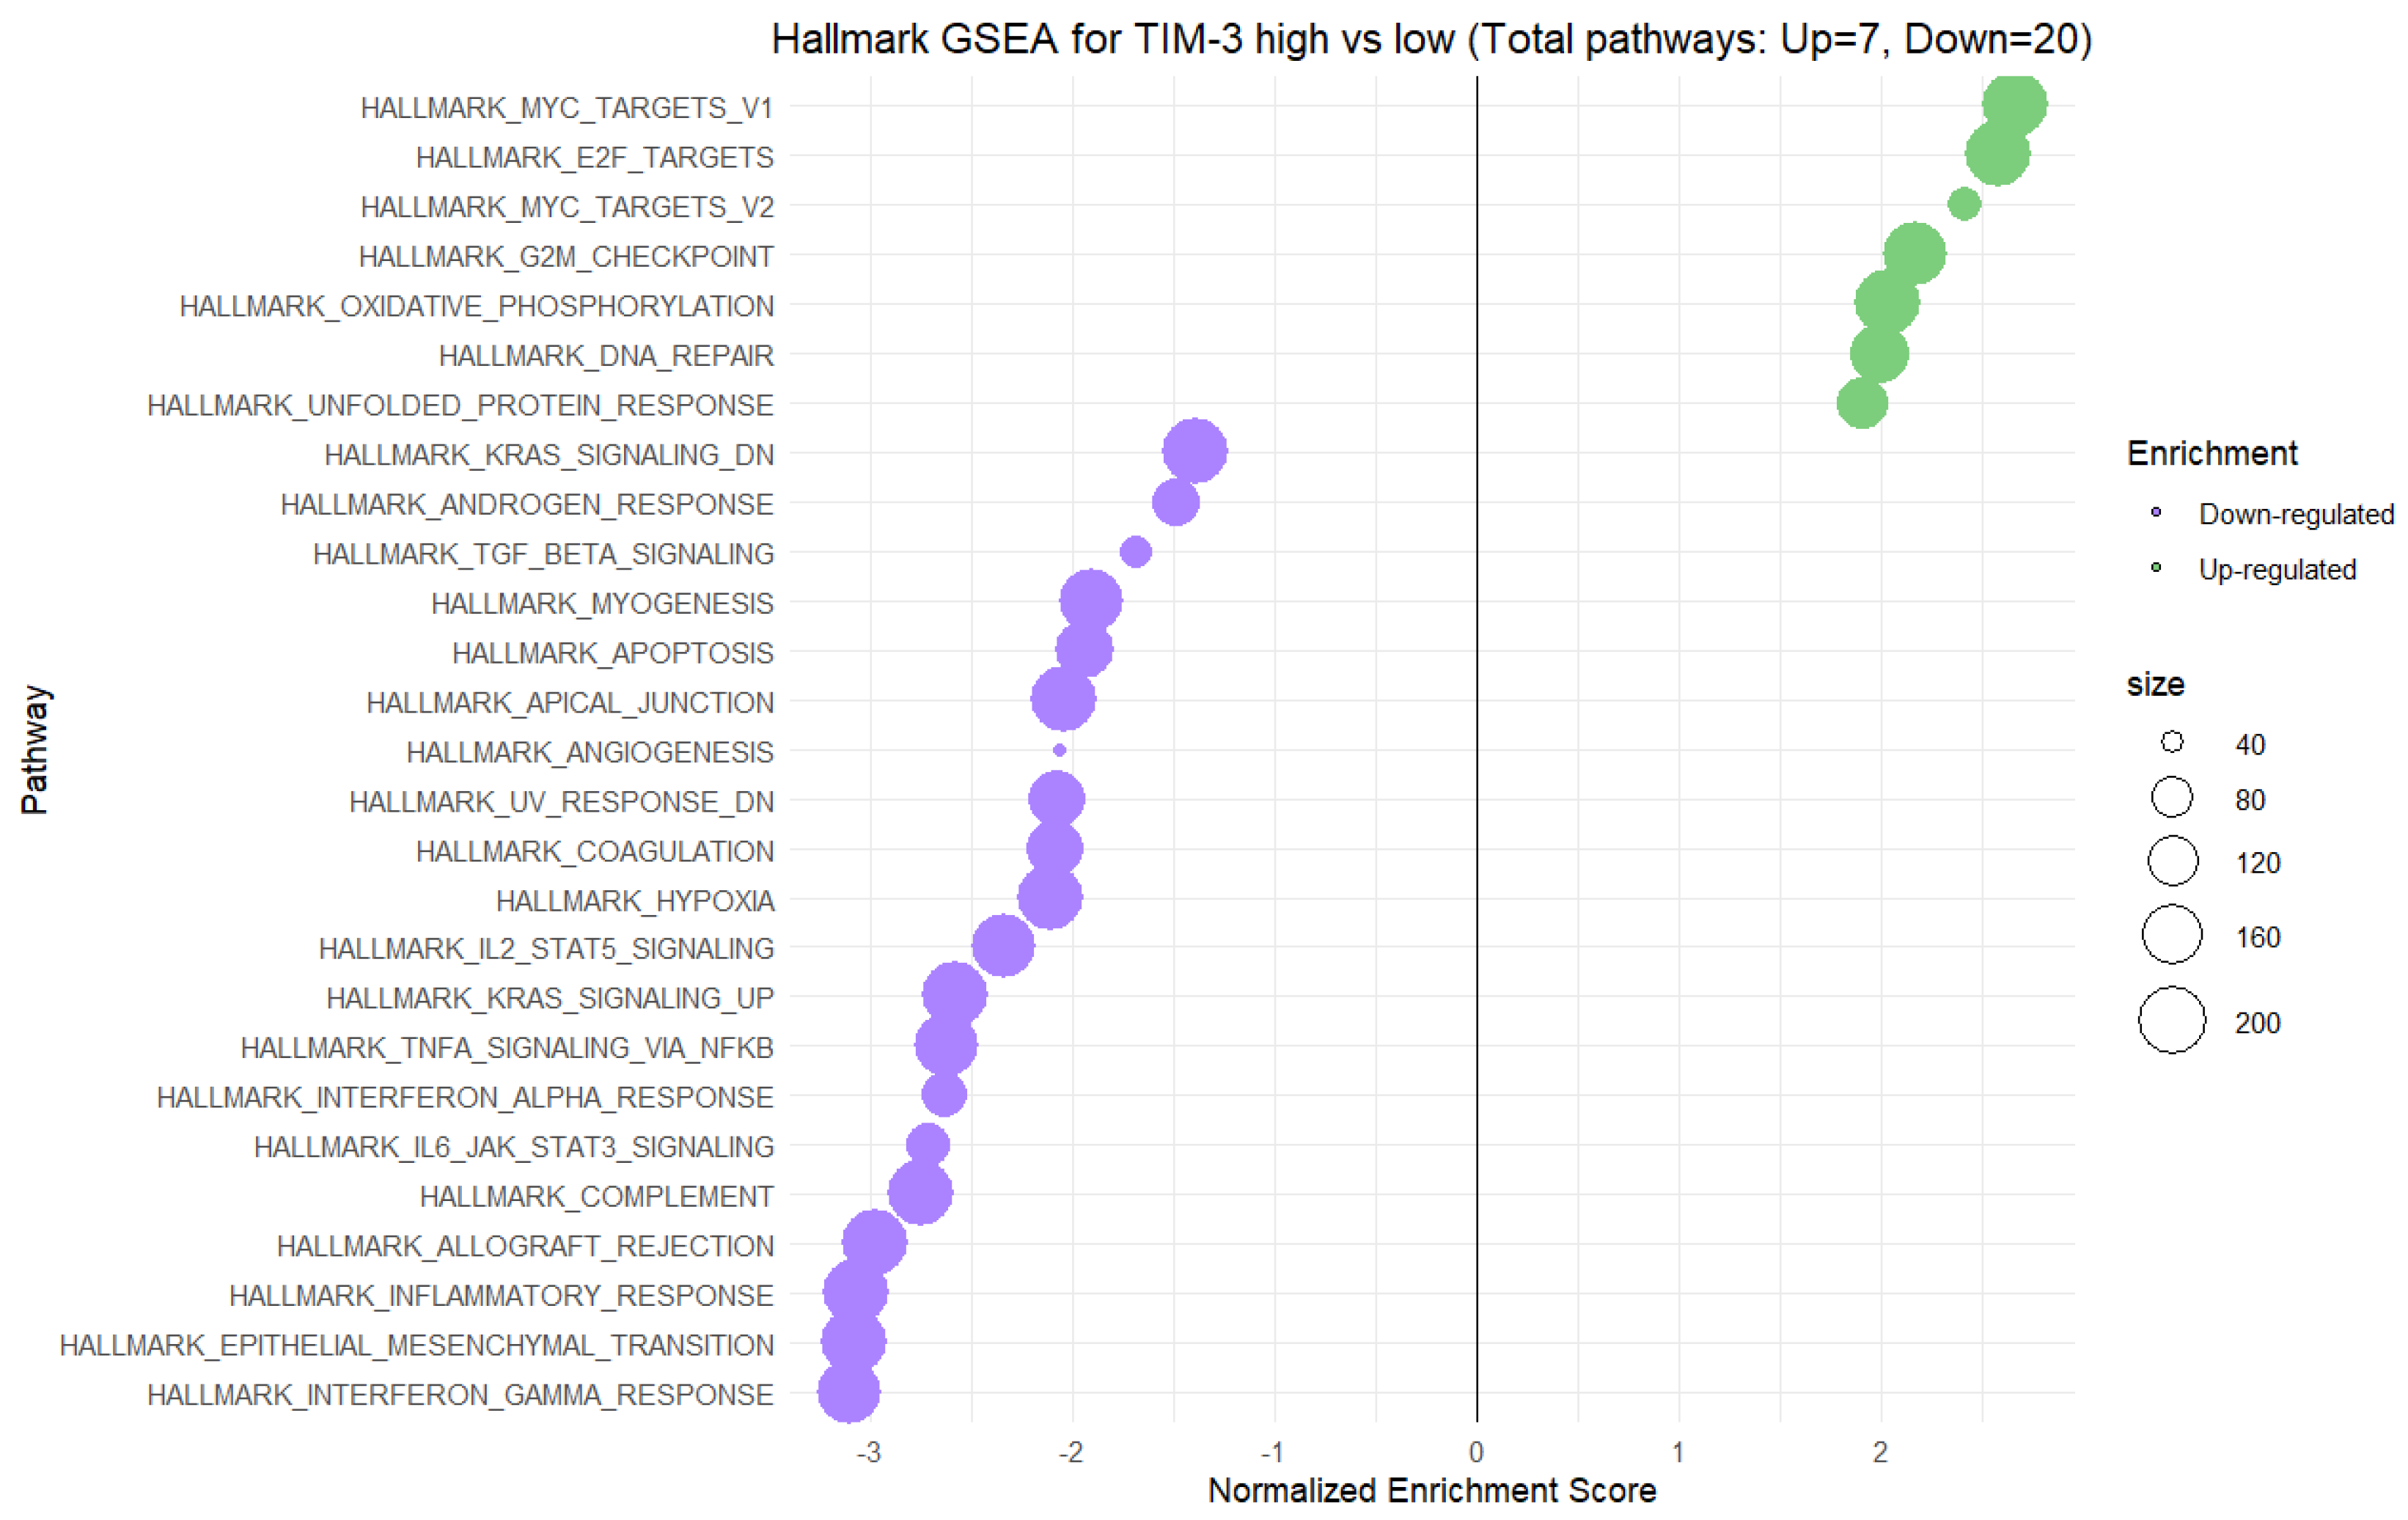
2.5. Gene Set Enrichment Analysis (GSEA) for High vs. Low Gene Expression of TIM-3 and Gal-9 in CRC Tumors

To explore the biological pathways and for a deeper understanding of the interactions between the expression of TIM-3 and Gal-9 with the molecular processes occurred in the CRC TME, we have performed GSEA on CRC tumor data. GSEA results were also used to validate our findings from the PCA analysis of cytokine expression data obtained from the cytokine screening panel. In performed GSEA, samples were stratified into TIM-3 and Gal-9 high- and low-expression groups, and enrichment scores were calculated to identify gene sets significantly associated with differential TIM-3 expression. A total of 27 pathways were significantly enriched at a false discovery rate (FDR) < 0.05, including 7 pathways upregulated and 20 pathways downregulated in the high TIM-3 expression group (Figure 3). Among the upregulated pathways, the most significantly enriched gene sets were MYC Targets V1 (normalized enrichment score (NES)~2.6), E2F Targets (NES~2.6), MYC Targets V2 (NES~2.5), and G2M Checkpoint (NES~2.2). These pathways are mostly involved in cell cycle regulation, and cellular proliferation, indicating that increased TIM-3 expression is strongly associated with enhanced proliferative and cell cycle activity. Conversely, pathways significantly downregulated in the TIM-3 high-expression group included Interferon–gamma response (NES~−3.2), Epithelial–Mesenchymal Transition (NES~−3.1), Inflammatory response (NES~−3.2), and Allograft rejection (NES~−3.0) (Figure 3). Additional negatively enriched pathways encompassed TNF-a signaling via NFkB, and Interferon–alpha response, collectively reflecting a broad suppression of immune-related and inflammatory signaling processes in the context of high TIM-3 expression.
As demonstrated in Figure 4, the GSEA identified a total of 35 enriched Hallmark pathways, of which 5 were significantly upregulated and 30 were downregulated in the Gal-9 high-expression group. Among the positively enriched pathways, the highest NES values were observed for Epithelial–Mesenchymal Transition (NES~1.6), E2F targets (NES~1.5), and G2M checkpoint (NES~1.4), suggesting enhanced cellular processes linked to cell cycle progression, proliferation, and epithelia–mesenchymal transition in the Gal-9 high-expressing CRC samples group. Conversely, the majority of pathways exhibited negative enrichment scores, indicating a strong association between high Gal-9 expression and the downregulation of the following biological processes: Interferon–gamma response (NES~−3.3), Interferon–alpha response (NES~−3.2), TNF-a signaling via NFkB (NES~−2.5), and Inflammatory response (NES~−2.4). These results suggest that high Gal-9 expression may correlate with the suppression of type I and II interferon signaling, and immune-related pathways. These data suggest that elevated gene expression of both TIM-3 and Gal-9 expression is associated with enhanced cell cycle activity, and proliferation, alongside a concurrent repression of immune-related pathways.

3. Discussion

Over the past decades, numerous studies have demonstrated increased TIM-3 expression across a range of malignancies, including CRC. Based on the findings reported by Zhang et al., the expression levels of TIM-3 and Gal-9 in CRC tissues are significantly associated with disease progression and prognosis following radical resection [37]. Immunohistochemical analyses of 171 patient samples revealed that TIM-3 was highly expressed in 70.18% of tumor tissues, while Gal-9 was highly expressed in only 32.16%. Compared to adjacent non-cancerous tissues, TIM-3 expression was significantly upregulated and Gal-9 was downregulated in tumor samples. The study demonstrated that high TIM-3 expression and low Gal-9 expression were significantly associated with deeper tumor infiltration, vascular invasion, and advanced clinical staging. Survival analyses showed that patients with high TIM-3 or low Gal-9 expression had significantly worse relapse-free survival (RFS) and overall survival (OS). These results suggest that TIM-3 and Gal-9 play opposing roles in colorectal cancer pathogenesis: TIM-3 may promote immune evasion and tumor progression, while Gal-9 may contribute to anti-tumor immunity [37]. The study by Wang et al. further elucidates the functional impact of Gal-9 on anti-tumor immunity in CRC. Their findings demonstrate that Gal-9 expression is significantly reduced in colon tumor tissues compared to adjacent normal mucosa, and this downregulation correlates with poor histological differentiation, lymph node metastasis, and decreased overall survival. Importantly, low Gal-9 expression was associated with markedly reduced infiltration of CD56+ natural killer (NK) cells [38]. Based on the study conducted by Yu et al., TIM-3 plays a critical role in the progression of CRC, primarily by enhancing tumor cell proliferation, migration, and invasion. The authors investigated both clinical samples and CRC cell lines, demonstrating that TIM-3 is significantly upregulated in CRC tissues compared to adjacent non-cancerous tissues at both the mRNA and protein levels. Immunohistochemical analysis of CRC cases further revealed that high TIM-3 expression correlated significantly with tumor size, TNM stage, and distant metastasis [38]. In glioblastoma, TIM-3 has emerged as a prominent immune checkpoint molecule, whose overexpression is significantly associated with worse overall survival and has been recognized as an independent predictor of unfavorable prognosis [39,40]. Similarly, in thyroid carcinoma, both TIM-3 and Gal-9 are markedly upregulated compared to normal thyroid tissues [41]. In the context of lung cancer, TIM-3 exhibits a high frequency of expression on both CD4(+) and CD8(+) TILs. Notably, TIM-3 expression on CD4+ T cells has been linked to lymph node metastasis and advanced disease stages [42,43]. Increased TIM-3 expression has also been documented in head and neck squamous cell carcinoma (HNSCC), where it correlates with tumor size, recurrence rates, nodal involvement, and clinical staging, indicating a possible association with adverse prognostic features in HNSCC [44,45]. In gastric cancer, beyond the upregulation of TIM-3, the combined expression profiles of TIM-3 and Gal-9 have been shown to significantly influence patient survival outcomes [46]. Interestingly, in some malignancies, increased TIM-3 or Gal-9 expression has been associated with more favorable clinical outcomes. For example, the presence of TIM-3 on TILs in breast cancer has been reported as an independent predictor of favorable clinical outcomes in breast cancer [47]. Moreover, in advanced triple-negative breast cancer (TNBC), patients exhibiting higher plasma levels of TIM-3 or CTLA-4 have shown better responses to anti-PD-1 immunotherapy combined with VEGFR-2 targeted treatments [48]. Similarly, Gal-9 expression varies substantially between cancer types and their non-cancerous counterparts. Increased expression of Gal-9 has been observed in tumors such as breast cancer, HPV-associated cervical carcinoma, and pancreatic carcinoma [49,50,51], while reduced expression has been reported in gastric, colon, esophageal, melanoma, hepatocellular, renal cell, adrenal, and prostate cancers [38,52,53,54].
In the present study, we identified a significantly increased expression of both TIM-3 and Gal-9 proteins in CRC tissues when compared to non-malignant surgical margin samples (p < 0.05 and p < 0.001, respectively). The distribution of patients across various clinical stages was relatively balanced, with the majority of cases classified as stage II and III (25.19% and 45.80%, respectively), a pattern that closely mirrors epidemiological data reported in the general population. Notably, no statistically significant associations were identified between TIM-3 or Gal-9 expression levels and clinicopathological variables, including TNM stage, histological tumor grade, or tumor-infiltrating lymphocyte (TIL) density. Increased expression of both proteins was observed across all tumor stages and pathological subgroups, relative to matched normal adjacent tissues. These findings stand in contrast to reports from other studies, which may be partially explained by the clinical characteristics of the patient population enrolled, particularly the stage distribution, as well as methodological differences. Notably, our study employed ELISA-based quantification of protein levels in tumor homogenates, providing insight into the local abundance of these proteins within the TME, rather than relying on transcript-level or immunohistochemical assessments. This methodological distinction could account for the discrepancies, as protein-level measurements better capture the spatial and functional dynamics of the immune landscape within tumors. Research on Gal-9 expression using methodologies similar to ours remains scarce, which underscores the need for further studies to clarify its precise role in the CRC TME and its potential value as a prognostic or therapeutic biomarker.
The RAS family comprises a group of small GTPase proteins ubiquitously expressed in human cells, responsible for transmitting intracellular signals that ultimately regulate cell proliferation. The most clinically relevant members of this family in CRC are KRAS and NRAS. These proteins are central regulators of signaling cascades that govern essential cellular functions, including proliferation, differentiation, adhesion, programmed cell death, and migration [55,56]. Recent studies have highlighted the multifaceted role of KRAS mutations in tumor biology—not only do they intrinsically promote tumorigenesis, but they also modulate the immune microenvironment by driving the production of immunosuppressive cytokines and chemokines through downstream signaling pathways [57]. Moreover, KRAS-mutant tumors frequently harbor concurrent mutations in key tumor suppressor genes, enhancing the tumor’s ability to survive under hypoxic conditions and metabolic stress. These co-mutations contribute to distinct immunological profiles within the TME and can influence tumor response to targeted therapies and immune checkpoint inhibitors (ICIs) [58,59,60]. Additionally, KRAS mutations are associated with an increased presence of tumor-associated macrophages (TAMs), further contributing to immunosuppression [61]. BRAF, another gene commonly altered in CRC, encodes a serine/threonine kinase involved in the mitogen-activated protein kinase (MAPK) signaling pathway, which regulates cellular proliferation, survival, differentiation, migration, and apoptosis. The BRAF V600 mutation, in particular, is more prevalent in MSI-high tumors compared to MSI-low tumors and is widely recognized as a biomarker associated with unfavorable clinical outcomes in metastatic CRC (mCRC) [62]. Activating mutations in PIK3CA, which encodes the catalytic p110α subunit of class IA phosphoinositide 3-kinases (PI3Ks), contribute to cancer pathogenesis by promoting cell growth, survival, motility, and glucose metabolism. PIK3CA mutational status has been investigated as a predictive biomarker for response to MAPK/ERK (MEK) inhibitors and anti-EGFR monoclonal antibodies in CRC. Although early data on its prognostic relevance have been conflicting, recent studies suggest that PIK3CA mutations may have a neutral impact on overall survival in CRC patients [63,64]. KRAS mutations are among the most prevalent genetic alterations in colorectal cancer, occurring in approximately 30–50% of cases [65,66]. By contrast, NRAS mutations are relatively uncommon, detected in only 3–10% of CRC cases [67,68]. KRAS mutations are most frequently localized to exon 2, particularly at codons 12 and 13, while alterations in exons 3 and 4 are considerably less common [69,70]. For instance, one large study involving 408 CRC tumors reported that KRAS exon 2 mutations accounted for 33.1% of cases, whereas NRAS mutations were present in 2.4% of tumors [71]. Another study confirmed similar KRAS mutation rates, with more than 90% occurring in exon 2 (68.9% at codon 12 and 24.4% at codon 13), and NRAS mutations identified in 8.8% of cases [72].
In our cohort of 104 CRC patients, KRAS exon 2 mutations were detected at a frequency of 76.31%, aligning with previous observations. Mutations in KRAS exons 3 and 4 were both detected at 7.89%, which is higher than previously reported rates of approximately 2.7% and 3.7%. NRAS mutations were identified in 12.5% of cases, which also exceeds the frequencies reported in the literature [68,73], with the majority occurring in exon 2 (61.54%) and the remainder in exon 3 (38.46%). These divergences likely reflect population-specific variables, including ethnic background, age distribution, gender, and disease stage. We also screened for BRAF exon 15 mutations (including V600E, V600E2, V600D, and V600K) and identified a mutation frequency of approximately 7%, consistent with rates reported in prior studies [74,75]. PIK3CA mutations, primarily affecting exons 9 and 20, were found in approximately 7% of cases, a figure slightly lower than the 10–30% range described in the literature [76]. Our analysis revealed that TIM-3 protein concentrations were significantly higher in PIK3CA-mutated CRC tumors compared to PIK3CA wild-type counterparts. However, no significant associations were observed between the expression levels of either TIM-3 or Gal-9 and the mutational status of KRAS, NRAS, BRAF, or AKT genes. PIK3CA encodes the catalytic subunit of PI3K, a key regulator of cellular growth, proliferation, survival, and apoptosis through activation of the AKT-MTOR signaling pathway [77]. Previous research has linked PIK3CA mutations to enhanced immune resistance and increased PD-L1 expression in breast and prostate cancers [78]. For example, Ugai et al. reported a higher prevalence of CD274 (PD-L1) positivity in PIK3CA-mutated, PTEN-deficient tumors compared to PIK3CA-wild-type, suggesting that PI3K pathway activation modulates immune checkpoint regulation [79]. Contrary to our findings, He et al. demonstrated a positive association between TIM-3 expression and BRAF V600E mutations in CRC, a result further supported by analyses of public datasets, such as TCGA and GEO, which also reported higher TIM-3 expression in BRAF-mutated tumors [80,81]. The associations between genetic mutations and the expression of immune checkpoints such as TIM-3 and Gal-9 remains insufficiently characterized, particularly in CRC. Limited evidence, including a study by Yan et al., has identified a significant positive correlation between NRAS expression and TIM-3 levels at both the mRNA and protein levels in lung adenocarcinoma, suggesting a possible link worthy of further investigation [82]. Given the relatively small number of PIK3CA-mutated cases in our cohort—a little less compared to known mutation frequency—our observation of increased TIM-3 expression in this subgroup needs confirmation in larger, independent datasets. The observed upregulation of TIM-3 in PIK3CA-mutated tumors may indicate a functional interaction between the PI3K signaling pathway and TIM-3–driven immunosuppression, which could have significant implications for the development of TIM-3-targeted therapies in CRC.
Microsatellite instability (MSI) represents a pivotal molecular feature in CRC, profoundly influencing tumor biology and guiding therapeutic decision-making. Consequently, CRC can be broadly stratified into two groups based on their mismatch repair (MMR) status: tumors with deficient mismatch repair (dMMR) or MSI-high (MSI-H), which exhibit a high mutational burden (greater than 12 mutations per 106 DNA bases), and those with proficient mismatch repair (pMMR) or microsatellite stable (MSS), characterized by a low mutational burden (less than 8.24 mutations per 106 bases) [83]. Compared to pMMR tumors, MSI-H CRCs display distinct clinicopathologic features, including a proximal colonic location, mucinous histology, poor differentiation, reduced frequency of KRAS and TP53 mutations, and robust infiltration of immune cells, which correlates with a reduced tendency for metastasis. The majority of CRCs (~85%) are pMMR/MSS and generally do not respond to immune checkpoint blockade. In contrast, approximately 15% of CRCs exhibit MSI, marked by a high frequency of small insertions/deletions and point mutations within microsatellite regions. Monoclonal antibodies targeting immune checkpoints such as PD-1, PD-L1, and CTLA-4 have demonstrated significant efficacy in a range of malignancies. In particular, dMMR/MSI-H tumors have emerged as strong predictors of responsiveness to immune checkpoint inhibitors. Their elevated neoantigen load, dense immune infiltration, and high mutational burden collectively contribute to robust immune activation and effective therapeutic responses [84].
Our study did not reveal any significant differences in TIM-3 or Gal-9 protein expression in relation to MSI status. Previous investigations, including those by An et al. and Katagata et al., reported higher TIM-3 expression in MSI CRC compared to MSS tumors [85,86]. However, in our study, TIM-3 protein was quantified via ELISA, while MSI status was assessed immunohistochemically, unlike previous studies that evaluated both variables using immunohistochemistry [85,86]. This methodological difference may partially explain the divergent results. Given the distinct immunological landscape associated with MSI tumors—including upregulated expression of immune checkpoints such as PD-1, PD-L1, and CTLA-4—it could be hypothesized that TIM-3 expression would similarly be increased in MSI CRC. Nevertheless, in our cohort, increased TIM-3 and Gal-9 levels were observed in both MSI and MSS tumors. Understanding the expression dynamics of TIM-3 and Gal-9 in the context of MSI status is of critical importance, particularly given the therapeutic potential of immune checkpoint inhibitors targeting these molecules. Our findings highlight the need for larger-scale, methodologically unified studies to clarify these associations and guide future therapeutic strategies in CRC.
Gal-9 acts through various receptors, exerting numerous functions in immune cells. Endogenous Gal-9 in T-cells likely participates in TCR signal transduction [87]. Gal-9 knockdown in CD4 T-cells reduces their proliferation and cytokine expression upon antibody-mediated activation, with the strongest decrease in IL-17 secretion [88]. On the other hand, exogenous Gal-9 can induce T-cell apoptosis, meaning that the source of Gal-9 expression may be crucial for T lymphocyte function [89]. Importantly, the protein has a strong apoptotic effect on Th1 cells, mainly through TIM-3 interaction [25]. Studies present contradictory results regarding the influence of exogenous Gal-9 on IFN-γ secretion, with some indicating stimulation, and some a decrease in the cytokine levels upon Gal-9 administration [90,91]. Gal-9 has also been shown to promote immune responses in tumors. It was correlated with stronger infiltrations of mature CD208 + DCs, CD8+ T-cells, and CD3+ T-cells in CRC. In addition, the protein expression on NK cells was associated with stronger IFN-γ and TNF-α secretion, with a higher cytotoxic effect than in the case of Gal-9 knockdown in mice [92,93]. Upon interaction between Gal-9 and NK cells, the expression of genes related to immune functions was suppressed, with reduced NK cell IFN-γ production [94]. In melanoma mouse models, Gal-9 increased macrophage numbers, and its tumor-suppressing functions were abrogated in the absence of macrophages [95]. Gal-9 could also promote FGF2 and monocyte chemotactic protein-1 (MCP-1) production in macrophages, but decreased macrophage-derived chemokine (MDC) secretion [26]. TIM-3 is abundantly expressed on dendritic cells, mainly conventional DCs. In CRC, TIM-3 can inhibit T-cell activity through the downregulation of cytokines secreted by DCs [96,97]. In TME, TIM-3 competitively binds to RAGE on DCs, inhibiting pathways related to pattern recognition receptors that normally lead to IL-12 and IFN-γ secretion with subsequent activation of innate immune responses after stimulation with nucleic acids [17,98]. TIM-3 is also expressed on NK cells and can be induced by numerous cytokines, including IL-15, IL-12, and IL-18. In cancer, its expression serves as a marker of NK cell exhaustion [99,100]. Moreover, Gal-9/TIM-3 signaling has been demonstrated to stimulate IL-6, IL-8, and IL-10 secretion in monocytes in the presence of LPS, playing a role in GC progression [101].
To elucidate the immunological context of TIM-3 and its established ligand Gal-9 within the tumor microenvironment, we combined GSEA with PCA performed on our experimental cytokine expression data. Our integrative analysis combining multiplex cytokine profiling, PCA, and GSEA provides novel insights into the immunobiological landscape shaped by TIM-3 and Galectin-9 expression in CRC TME. The PCA identified strong positive correlations between TIM-3 and Gal-9 protein levels and the first principal component (PC1) across multiple cytokine subsets, particularly those involved in chemokine signaling, IL-10 and IL-17 pathways, lymphocyte migration, and macrophage chemotaxis. Notably, PC1 consistently captured variance in the expression of key chemoattractants such as MCP-1, RANTES, IP-10, IL-8, and SDF-1α—molecules known to regulate immune cell trafficking, particularly of monocytes, T cells, and natural killer (NK) cells. These findings suggest that tumors with elevated TIM-3 and Gal-9 expression maintain an active chemokine gradient capable of recruiting various immune cell populations into the TME. However, this apparent immune recruitment is contrasted by our transcriptome-level findings from GSEA. High TIM-3 and Gal-9 expression was associated with strong negative enrichment of multiple immune effector pathways, including interferon-α and interferon-γ responses, TNF-α/NFκB signaling, and broader inflammatory signaling cascades. These transcriptional profiles indicate an overall suppression of innate and adaptive immune activation, consistent with functional exhaustion or exclusion of effector immune responses despite the chemokine-rich environment. This discrepancy between protein-level cytokine data and transcriptional suppression highlights a critical aspect of immune dysregulation in CRC: the physical presence of immune cells may not correlate with their functional capacity. Tumors may thus exhibit immune infiltration in the absence of effective cytotoxic or pro-inflammatory activity—a phenomenon increasingly described as immune dysfunctional state [102].
Taken together, these findings highlighted the dual role of the TIM-3/Gal-9 in modulating the TME. While both molecules are associated with transcriptional repression of pathways involved in effector T cell function and innate immune activation, their expression coincides with the upregulation of chemokines and pro-tumorigenic cytokines that facilitate immune cell trafficking, stromal remodeling, and potentially immune escape. This underscores a complex and dynamic immunological landscape, wherein TIM-3 and Gal-9 may act as central mediators of immune suppression while simultaneously shaping the chemokines’ expression in a manner that favors tumor progression and immune system modulation. These results reinforce the emerging concept of TIM-3 and Gal-9 as interconnected immune checkpoints that not only blunt antitumor immunity but also contribute to the spatial and functional organization of immune infiltrates within the tumor microenvironment, highlighting their potential as therapeutic targets in immune checkpoint blockade strategies.
Despite the novel insights provided by our protein expression profiling of TIM-3 and Gal-9 in CRC, this study has notable limitations. Our analyses are primarily descriptive and correlative, focusing on the quantification of TIM-3 and Gal-9 protein levels and their associations with common oncogenic mutations and selected immunological parameters in CRC tissues. While these findings offer insight into potential molecular patterns, they do not assess the functional consequences of TIM-3 or Gal-9 expression within the CRC TME. Furthermore, no data on patient outcomes or response to therapy were included, and ligand–receptor interactions were not assessed. These limitations should be addressed in future studies aiming to establish the clinical utility of TIM-3 and Gal-9 as biomarkers or therapeutic targets.

4. Materials and Methods

4.1. Study Group Characteristics

A total of 262 tissue samples were collected and analyzed, including 131 CRC tissue specimens assigned to the study group and 131 tumor-free surgical margin tissues, which served as the control group. The study group consisted solely of tissues with a histopathologically confirmed diagnosis of CRC, while the control group comprised surgical margins without any pathological signs of CRC. Inclusion criteria for the study were as follows: (1) written informed consent from the patient, (2) age over 18 years, and (3) histopathological confirmation of colorectal adenocarcinoma or tumor-free surgical margins. Patients who did not meet these criteria were excluded from the study. The Research Ethics Committee provided approval for the study (PCN/0022/KB1/42/VI/14/16/18/19/20). The median age of patients included in the study was 65 years (±9.22). Most of the tumors (71.76%) were located on the left (distal) side of the colon. Stage III tumors were the most common (45.80%) among the CRC samples, followed by stage II (25.19%). Stage I and stage IV tumors were observed at the same frequency, each accounting for 14.50% of the analyzed specimens. A summary of the clinical and pathological characteristics of the study group is presented in Table 1.
Clinicopathological features of the study group are detailed in Table 3.

4.2. Protein Quantification Protocol for TIM-3 and Gal-9

A total of 131 CRC tumor and 131 margin tissues were homogenized according to a previously established protocol [103]. Samples were homogenized in phosphate-buffered solution using a PRO 200 homogenizer (PRO Scientific Inc., Oxford, CT, USA) at 10,000 rpm and further disrupted using ultrasonic sonication (UP100, Hilscher, Hattersheim am Main, Germany). Total protein content was measured using the pyrogallol-red method (Sentinel Diagnostics, Milan, Italy) with a Technicon RA-XTTM analyzer (Technicon Instruments Corporation, Mahopac, NY, USA) at 600 nm and 37 °C. Concentrations of TIM-3 and Gal-9 proteins were quantified using enzyme-linked immunosorbent assay (ELISA) kits (SEH930Hu and SEA309Hu; Cloud Clone, Wuhan, China), following manufacturer protocols. Optimal sample dilutions were established through preliminary assays. The minimal detectable concentrations for the TIM-3 and Gal-9 assays were <31 pg/mL and <33 pg/mL, respectively. Final results were recalculated to the corresponding total protein content and presented as pg/mL of protein.

4.3. Assessment of KRAS, NRAS, BRAF, PIK3CA, and AKT Mutation Status

The mutational status of KRAS, NRAS, BRAF, PIK3CA, and AKT genes was evaluated using real-time polymerase chain reaction (RT-PCR). Detailed procedures were previously described [36]. Genomic DNA was isolated from fresh-frozen CRC tumor samples stored at −80 °C using an automated extraction system and the Mag-Bind Blood & Tissue DNA HDQ 96 Kit (M6399-00), according to the manufacturer’s protocol. DNA concentrations were determined via spectrophotometry, and all samples were diluted to a final concentration of 2 ng/μL, as specified in the RT-PCR kit instruction. Mutational analysis was performed using the CRC-RT48 Mutation Detection Panel for Real-Time PCR (EntroGen, Woodland Hills, CA, USA). Amplification and detection were conducted with the QuantStudio™ 5 Real-Time PCR System (Thermo Fisher Scientific, Waltham, MA, USA). The panel targets mutations in KRAS (exons 2, 3, and 4), NRAS (exons 2, 3, and 4), BRAF (exon 15), PIK3CA (exons 9 and 20), and AKT1 (exon 4). This approach enabled the identification of specific hotspot mutations, including KRAS 12/13, 117, 61, 146, 59; NRAS 12/13, 117, 61, 146, 59; BRAF V600; PIK3CA 542/545, 1047; and AKT1 E17K (Table 4)

4.4. Microsatellite Instability (MSI) Evaluation

MSI status was determined using immunohistochemistry (IHC) on formalin-fixed, paraffin-embedded (FFPE) CRC tissue blocks, following previously established protocols [104,105]. In total, 79 tumor tissue samples were analyzed for MSI status. Tissue sections (4 μm thick) were prepared and stained on a Dako Autostainer Link 48. Slides were deparaffinized, rehydrated, and subjected to antigen retrieval using EnVision Flex Target Retrieval Solution High pH (Dako, Carpinteria, CA, USA) at 95 °C for 20 min. Blocking was followed by incubation with monoclonal primary antibodies targeting mismatch repair proteins: MSH2 (clone G219-1129, Cell Marque, 1:400 for 30 min), MSH6 (clone 44, Cell Marque, 1:100 for 45 min), PMS2 (clone MRQ-28, Cell Marque, 1:50 for 40 min), and MLH1 (clone G168-728, Cell Marque, 1:100 for 40 min). Detection was performed using EnVision FLEX HRP (Dako) and developed with DAB (3,3′-diaminobenzidine), followed by hematoxylin counterstaining and mounting. Nuclear staining in tumor cells was used to assess protein expression, with stromal and inflammatory cells serving as internal controls. Tumors were considered MSI-positive if there was complete loss of nuclear expression in at least one of the following patterns: MLH1 and PMS2, PMS2 alone, MSH2 and MSH6, or MSH6 alone.

4.5. Principal Component Analysis (PCA) on Cytokine, Chemokine, and Growth Factor Concentration in CRC Homogenates

The concentrations of cytokines, chemokines, and growth factors in homogenized tissue samples from 77 colorectal cancer (CRC) cases were measured using the Bio-Plex Pro Human Cytokine Screening Panel, 48-Plex (Bio-Rad Laboratories, Hercules, CA, USA), in accordance with the manufacturer’s manual. The obtained concentration data were normalized to total protein level in CRC tissue homogenates and subsequently categorized into functional groups based on Gene Ontology (GO) classifications and KEGG pathway annotations (Table 5) [106,107,108]. Principal Component Analysis (PCA) was applied to the decimal log-transformed, normalized expression data to reduce dimensionality. In the analysis, we used the covariance matrix to extract eigenvalues and eigenvectors, and three principal components (PCs) were chosen for analyses. To enhance interpretability of the factor loadings, component axes were rotated using the varimax rotation. Correlations between these principal components with TIM-3 and Gal-9 protein concentrations were then evaluated. Due to the nature of the data distribution, Spearman’s rank correlation coefficient was used, with statistical significance defined as p-values < 0.05. PCA has been performed in R Studio version 4.4.1 using the “factoextra” package.

4.6. Gene Set Enrichment Analysis (GSEA) for TIM-3 and Gal-9 Gene Expression on CRC Data

Gene Set Enrichment Analysis (GSEA) has been conducted using the “FieldEffectCrc” dataset, specifically focusing on colorectal cancer (CRC) samples from Cohort A [24] in R Studio version 4.4.1. This dataset comprised Salmon-generated transcript-level quantifications, which were subsequently summarized to the gene level using the tximport package. It included a total of 834 human colorectal tissue samples with three categories: tumor tissue, adjacent normal tissue, and healthy tissue [109]. Data were retrieved using the ExperimentHub package and filtered to include only tumor-derived CRC samples (n = 311). Differential expression analysis was performed using the DESeq function from the DESeq2 package, which accounts for variability in sequencing depth. Normalized gene counts were extracted for downstream analysis. Samples were categorized based on the median expression values of the TIM-3 (ENSG00000135077) and Gal-9 (ENSG00000168961) genes, with a threshold set at 294.795 normalized counts for TIM-3 gene and 7502.06 normalized counts for Gal-9 gene. Samples exceeding this threshold were classified as “high expression” (n = 156), while those below were designated as “low expression” (n = 155). Gene symbols were mapped using the org.Hs.eg.db package, and a ranked gene list was generated from the differential expression results for GSEA input. Enrichment analysis was conducted using hallmark gene sets from the MSigDB (Molecular Signatures Database) collection [110,111], and implemented with the fgsea function from the fgsea package. The analysis included 10,000 permutations and was restricted to gene sets containing between 15 and 400 genes. Only pathways with an adjusted p-value < 0.05 were retained and subsequently ranked by their normalized enrichment scores (NES).

4.7. Statistical Analyses

The normality of the data was assessed using the Shapiro–Wilk test. The data have been normalized through the use of a decimal logarithmic transformation. To compare protein expression levels (TIM-3 and Gal-9) between tumor tissue and matched surgical margins, we initially employed the Wilcoxon signed-rank test for paired data as a non-parametric approach to assess within-subject differences without assuming normality. To account for inter-individual variability and the paired nature of the measurements, we subsequently used linear mixed-effects models (LMMs) with patient ID as a random intercept. These models allow for robust estimation of fixed effects (tissue type: tumor vs. margin) while adjusting for the correlation structure introduced by repeated measurements within the same subjects. The models were specified as follows: Protein~TissueType + (1 | PatientID), and fitted using restricted maximum likelihood (REML). Degrees of freedom for fixed effects were approximated using Satterthwaite’s method, and p-values were reported accordingly. Model residuals were visually inspected to confirm assumptions of homoscedasticity and approximate normality. Correlations between protein concentrations and TNM parameters were evaluated using Kendall’s Tau rank correlation. For examined protein expression and its association with mutation of examined genes we used the Mann–Whitney U test. For examining other correlations, Spearman’s rank correlation was applied. To account for multiple comparisons in the correlation analyses between principal component scores, TIM-3 and Gal-9 protein expression, we applied the Benjamini–Hochberg procedure to control the false discovery rate (FDR). Specifically, for each pathway-level PCA, we computed Spearman correlation coefficients between Gal-9 and TIM-3, and the first principal components (PC1), reflecting dominant axes of protein expression variation within the pathway. Adjusted q-values were reported alongside Spearman ρ and nominal p-values. Associations were considered statistically significant only if q < 0.05. This correction was applied independently for each PCA/pathway analysis. Results were summarized in Supplementary Table S17 with significant correlations explicitly flagged. Statistical significance was set at p < 0.05. The statistical analyses were performed in R Studio 4.4.1.

5. Conclusions

TIM-3 expression correlated with PIK3CA mutation status, while both proteins showed robust associations with cytokine networks linked to immunoregulation, chemotaxis, and protumor activity. Gene set enrichment analyses further supported a dual role for TIM-3 and Gal-9 in promoting tumor growth while attenuating antitumor immune responses. These results highlight the TIM-3/Gal-9 axis as a potential biomarker of immune escape and proliferative activity in CRC, warranting further investigation as a therapeutic target in immunomodulatory strategies.

Supplementary Materials

The following supporting information can be downloaded at: https://www.mdpi.com/article/10.3390/ijms26146735/s1.

Author Contributions

Conceptualization, B.O.; Data curation, M.S., J.P., D.W. and E.Ś.; Formal analysis, B.O., S.M. and Z.C.; Funding acquisition, B.O. and E.Ś.; Investigation, B.O., A.K. (Anna Kot), S.M., A.K. (Agnieszka Kula), M.D., D.H. and Z.C.; Methodology, B.O., S.M., A.K. (Agnieszka Kula), M.D., D.H., Z.C. and E.Ś.; Project administration, D.W. and E.Ś.; Resources, J.P., D.W. and E.Ś.; Software, B.O. and S.M.; Supervision, E.Ś.; Visualization, B.O.; Writing—original draft, B.O. and A.K. (Anna Kot); Writing—review and editing, B.O. All authors have read and agreed to the published version of the manuscript.

Funding

This project was supported by the statutory funds of the Medical University of Silesia, Katowice, Poland. This research was funded by the Ministry of Education and Science, Poland, grant number SKN/SP/570127/2023, by Ministry of Education and Science, Poland, grant number SKN/SP/496435/2021, and by Metropolitan Fund for Science Support of the Silesian Voivodeship.

Institutional Review Board Statement

The study was conducted according to the guidelines of the Declaration of Helsinki and approved by the Ethics Committee of the Medical University of Silesia No. PCN/0022/KB1/42/VI/14/16/18/19/20, 14 July 2020.

Informed Consent Statement

Informed consent was obtained from all subjects involved in the study.

Data Availability Statement

GSEA data: Dampier CH (2020). “FieldEffectCrc: Tumor, tumor-adjacent normal, and healthy colorectal transcriptomes as SummarizedExperiment objects”. https://bioconductor.org/packages/release/data/experiment/html/FieldEffectCrc.html (accessed on 10 April 2025). Experimental data can be shared upon request.

Conflicts of Interest

The authors declare no conflicts of interest.

Abbreviations

BasicFGFBasic Fibroblast Growth Factor
CCLChemokine (C-C motif) ligand
CRCColorectal cancer
CSFColony-stimulating factor
CTACKCutaneous T Cell-Attracting Chemokine
CTLA-4Cytotoxic T lymphocyte antigen 4
CXCLChemokine (C-X-C motif) ligand
EGFREpidermal growth factor receptor
EotaxinEotaxin (CCL11)
FDRFalse discovery rate
G-CSFGranulocyte Colony-Stimulating Factor
Gal-9Galectin-9
GM-CSFGranulocyte-Macrophage Colony-Stimulating Factor
GOGene Ontology
GRO-αGrowth-Regulated Oncogene Alpha
GSEAGene Set Enrichment Analysis
HGFHepatocyte growth factor
ICBImmune checkpoint blockade
IFN-γInterferon gamma
ILInterleukin
IP-10Interferon Gamma-Induced Protein 10
KEGGKyoto Encyclopedia of Genes and Genomes
KRASKirsten rat sarcoma viral oncogene homolog
LAG-3Lymphocyte activation gene-3
MAPKMitogen-activated protein kinase
MCP-1/MCP-3Monocyte Chemoattractant Protein 1/3
MCSFMacrophage Colony-Stimulating Factor
M-CSFMacrophage colony-stimulating factor
MIFMacrophage Migration Inhibitory Factor
MIGMonokine Induced by Gamma Interferon
MIP-1α/MIP-1βMacrophage Inflammatory Protein 1 Alpha/Beta
MMRMismatch repair
MSIMicrosatellite instability
MSSMicrosatellite stable
NRASNeuroblastoma RAS viral oncogene homolog
PCAPrincipal Component Analysis
PD-1Programmed cell death protein 1
PD-L1Programmed death-ligand 1
PDGF-BBPlatelet-Derived Growth Factor BB
PI3KPhosphoinositide 3-kinase
RANTESRegulated on Activation, Normal T Cell Expressed and Secreted (CCL5)
SCFStem Cell Factor
SDF-1αStromal Cell-Derived Factor 1 Alpha
TAMsTumor-associated macrophages
TCGAThe Cancer Genome Atlas
TGF-βTransforming growth factor beta
TILsTumor-infiltrating lymphocytes
TIM-3T cell immunoglobulin and mucin-domain containing-3
TMETumor microenvironment
TNF-αTumor necrosis factor alpha
TNF-α/TNF-βTumor Necrosis Factor Alpha/Beta
TRAILTNF-related apoptosis-inducing ligand
VCAM-1Vascular cell adhesion protein 1
VEGFAVascular Endothelial Growth Factor A

References

  1. Fan, A.; Wang, B.; Wang, X.; Nie, Y.; Fan, D.; Zhao, X.; Lu, Y. Immunotherapy in Colorectal Cancer: Current Achievements and Future Perspective. Int. J. Biol. Sci. 2021, 17, 3837. [Google Scholar] [CrossRef] [PubMed]
  2. Luis, A.; Diaz, J.; Shiu, K.-K.; Kim, T.W.; Jensen, B.V.; Jensen, L.H.; Punt, C.; Smith, D.; Garcia-Carbonero, R.; Benavides, M.; et al. Pembrolizumab versus Chemotherapy for Microsatellite Instability-High or Mismatch Repair-Deficient Metastatic Colorectal Cancer (KEYNOTE-177): Final Analysis of a Randomised, Open-Label, Phase 3 Study. Lancet Oncol. 2022, 23, 659. [Google Scholar] [CrossRef]
  3. Overman, M.J.; Lonardi, S.; Wong, K.Y.M.; Lenz, H.-J.; Gelsomino, F.; Aglietta, M.; Morse, M.A.; Van Cutsem, E.; McDermott, R.; Hill, A.; et al. Durable Clinical Benefit with Nivolumab Plus Ipilimumab in DNA Mismatch Repair-Deficient/Microsatellite Instability-High Metastatic Colorectal Cancer. J. Clin. Oncol. Off. J. Am. Soc. Clin. Oncol. 2018, 36, 773–779. [Google Scholar] [CrossRef]
  4. Singh, M.; Morris, V.K.; Bandey, I.N.; Hong, D.S.; Kopetz, S. Advancements in Combining Targeted Therapy and Immunotherapy for Colorectal Cancer. Trends Cancer 2024, 10, 598–609. [Google Scholar] [CrossRef]
  5. Joller, N.; Anderson, A.C.; Kuchroo, V.K. LAG-3, TIM-3, and TIGIT: Distinct Functions in Immune Regulation. Immunity 2024, 57, 206–222. [Google Scholar] [CrossRef]
  6. Monney, L.; Sabatos, C.A.; Gaglia, J.L.; Ryu, A.; Waldner, H.; Chernova, T.; Manning, S.; Greenfield, E.A.; Coyle, A.J.; Sobel, R.A.; et al. Th1-Specific Cell Surface Protein Tim-3 Regulates Macrophage Activation and Severity of an Autoimmune Disease. Nature 2002, 415, 536–541. [Google Scholar] [CrossRef] [PubMed]
  7. Golden-Mason, L.; Palmer, B.E.; Kassam, N.; Townshend-Bulson, L.; Livingston, S.; McMahon, B.J.; Castelblanco, N.; Kuchroo, V.; Gretch, D.R.; Rosen, H.R. Negative Immune Regulator Tim-3 Is Overexpressed on T Cells in Hepatitis C Virus Infection and Its Blockade Rescues Dysfunctional CD4+ and CD8+ T Cells. J. Virol. 2009, 83, 9122–9130. [Google Scholar] [CrossRef] [PubMed]
  8. Fourcade, J.; Sun, Z.; Benallaoua, M.; Guillaume, P.; Luescher, I.F.; Sander, C.; Kirkwood, J.M.; Kuchroo, V.; Zarour, H.M. Upregulation of Tim-3 and PD-1 Expression Is Associated with Tumor Antigen-Specific CD8+ T Cell Dysfunction in Melanoma Patients. J. Exp. Med. 2010, 207, 2175–2186. [Google Scholar] [CrossRef]
  9. Zhao, Y.; Shao, Q.; Peng, G. Exhaustion and Senescence: Two Crucial Dysfunctional States of T Cells in the Tumor Microenvironment. Cell. Mol. Immunol. 2019, 17, 27. [Google Scholar] [CrossRef]
  10. Tang, Z.-H.; Liang, S.; Potter, J.; Jiang, X.; Mao, H.-Q.; Li, Z. Tim-3/Galectin-9 Regulate the Homeostasis of Hepatic NKT Cells in a Murine Model of Nonalcoholic Fatty Liver Disease. J. Immunol. 2013, 190, 1788–1796. [Google Scholar] [CrossRef]
  11. Anderson, A.C.; Anderson, D.E.; Bregoli, L.; Hastings, W.D.; Kassam, N.; Lei, C.; Chandwaskar, R.; Karman, J.; Su, E.W.; Hirashima, M.; et al. Promotion of Tissue Inflammation by the Immune Receptor Tim-3 Expressed on Innate Immune Cells. Science 2007, 318, 1141–1143. [Google Scholar] [CrossRef]
  12. Chang, T.; Yang, J.; Deng, H.; Chen, D.; Yang, X.; Tang, Z.-H. Depletion and Dysfunction of Dendritic Cells: Understanding SARS-CoV-2 Infection. Front. Immunol. 2022, 13, 843342. [Google Scholar] [CrossRef] [PubMed]
  13. van de Weyer, P.S.; Muehlfeit, M.; Klose, C.; Bonventre, J.V.; Walz, G.; Kuehn, E.W. A Highly Conserved Tyrosine of Tim-3 Is Phosphorylated upon Stimulation by Its Ligand Galectin-9. Biochem. Biophys. Res. Commun. 2006, 351, 571–576. [Google Scholar] [CrossRef]
  14. Kandel, S.; Adhikary, P.; Li, G.; Cheng, K. The TIM3/Gal9 Signaling Pathway: An Emerging Target for Cancer Immunotherapy. Cancer Lett. 2021, 510, 67–78. [Google Scholar] [CrossRef]
  15. Freeman, G.J.; Casasnovas, J.M.; Umetsu, D.T.; DeKruyff, R.H. TIM Genes: A Family of Cell Surface Phosphatidylserine Receptors That Regulate Innate and Adaptive Immunity. Immunol. Rev. 2010, 235, 172–189. [Google Scholar] [CrossRef]
  16. Huang, Y.-H.; Zhu, C.; Kondo, Y.; Anderson, A.C.; Gandhi, A.; Russell, A.; Dougan, S.K.; Petersen, B.-S.; Melum, E.; Pertel, T.; et al. CEACAM1 Regulates TIM-3-Mediated Tolerance and Exhaustion. Nature 2015, 517, 386–390. [Google Scholar] [CrossRef] [PubMed]
  17. Chiba, S.; Baghdadi, M.; Akiba, H.; Yoshiyama, H.; Kinoshita, I.; Dosaka-Akita, H.; Fujioka, Y.; Ohba, Y.; Gorman, J.V.; Colgan, J.D.; et al. Tumor-Infiltrating DCs Suppress Nucleic Acid–Mediated Innate Immune Responses through Interactions between the Receptor TIM-3 and the Alarmin HMGB1. Nat. Immunol. 2012, 13, 832–842. [Google Scholar] [CrossRef] [PubMed]
  18. Lv, Y.; Ma, X.; Ma, Y.; Du, Y.; Feng, J. A New Emerging Target in Cancer Immunotherapy: Galectin-9 (LGALS9). Genes Dis. 2022, 10, 2366. [Google Scholar] [CrossRef]
  19. Leal-Pinto, E.; Tao, W.; Rappaport, J.; Richardson, M.; Knorr, B.A.; Abramson, R.G. Molecular Cloning and Functional Reconstitution of a Urate Transporter/Channel. J. Biol. Chem. 1997, 272, 617–625. [Google Scholar] [CrossRef]
  20. Matsumoto, R.; Matsumoto, H.; Seki, M.; Hata, M.; Asano, Y.; Kanegasaki, S.; Stevens, R.L.; Hirashima, M. Human Ecalectin, a Variant of Human Galectin-9, Is a Novel Eosinophil Chemoattractant Produced by T Lymphocytes. J. Biol. Chem. 1998, 273, 16976–16984. [Google Scholar] [CrossRef]
  21. Kageshita, T.; Kashio, Y.; Yamauchi, A.; Seki, M.; Abedin, M.J.; Nishi, N.; Shoji, H.; Nakamura, T.; Ono, T.; Hirashima, M. Possible Role of Galectin-9 in Cell Aggregation and Apoptosis of Human Melanoma Cell Lines and Its Clinical Significance. Int. J. Cancer 2002, 99, 809–816. [Google Scholar] [CrossRef] [PubMed]
  22. John, S.; Mishra, R. Galectin-9: From Cell Biology to Complex Disease Dynamics. J. Biosci. 2016, 41, 507–534. [Google Scholar] [CrossRef] [PubMed]
  23. Kasamatsu, A.; Uzawa, K.; Nakashima, D.; Koike, H.; Shiiba, M.; Bukawa, H.; Yokoe, H.; Tanzawa, H. Galectin-9 as a Regulator of Cellular Adhesion in Human Oral Squamous Cell Carcinoma Cell Lines. Int. J. Mol. Med. 2005, 16, 269–273. [Google Scholar] [CrossRef]
  24. Irie, A.; Yamauchi, A.; Kontani, K.; Kihara, M.; Liu, D.; Shirato, Y.; Seki, M.; Nishi, N.; Nakamura, T.; Yokomise, H.; et al. Galectin-9 as a Prognostic Factor with Antimetastatic Potential in Breast Cancer. Clin. Cancer Res. Off. J. Am. Assoc. Cancer Res. 2005, 11, 2962–2968. [Google Scholar] [CrossRef] [PubMed]
  25. Zhu, C.; Anderson, A.C.; Schubart, A.; Xiong, H.; Imitola, J.; Khoury, S.J.; Zheng, X.X.; Strom, T.B.; Kuchroo, V.K. The Tim-3 Ligand Galectin-9 Negatively Regulates T Helper Type 1 Immunity. Nat. Immunol. 2005, 6, 1245–1252. [Google Scholar] [CrossRef]
  26. Enninga, E.A.L.; Chatzopoulos, K.; Butterfield, J.T.; Sutor, S.L.; Leontovich, A.A.; Nevala, W.K.; Flotte, T.J.; Markovic, S.N. CD206-Positive Myeloid Cells Bind Galectin-9 and Promote a Tumor-Supportive Microenvironment. J. Pathol. 2018, 245, 468–477. [Google Scholar] [CrossRef]
  27. Madireddi, S.; Eun, S.-Y.; Mehta, A.K.; Birta, A.; Zajonc, D.M.; Niki, T.; Hirashima, M.; Podack, E.R.; Schreiber, T.H.; Croft, M. Regulatory T Cell-Mediated Suppression of Inflammation Induced by DR3 Signaling Is Dependent on Galectin-9. J. Immunol. Baltim. Md 1950 2017, 199, 2721–2728. [Google Scholar] [CrossRef]
  28. Seki, M.; Oomizu, S.; Sakata, K.; Sakata, A.; Arikawa, T.; Watanabe, K.; Ito, K.; Takeshita, K.; Niki, T.; Saita, N.; et al. Galectin-9 Suppresses the Generation of Th17, Promotes the Induction of Regulatory T Cells, and Regulates Experimental Autoimmune Arthritis. Clin. Immunol. 2008, 127, 78–88. [Google Scholar] [CrossRef]
  29. Wang, Y.; Song, L.; Sun, J.; Sui, Y.; Li, D.; Li, G.; Liu, J.; Shu, Q. Expression of Galectin-9 and Correlation with Disease Activity and Vascular Endothelial Growth Factor in Rheumatoid Arthritis. Clin. Exp. Rheumatol. 2020, 38, 654–661. [Google Scholar]
  30. Yang, R.; Sun, L.; Li, C.-F.; Wang, Y.-H.; Yao, J.; Li, H.; Yan, M.; Chang, W.-C.; Hsu, J.-M.; Cha, J.-H.; et al. Galectin-9 Interacts with PD-1 and TIM-3 to Regulate T Cell Death and Is a Target for Cancer Immunotherapy. Nat. Commun. 2021, 12, 832. [Google Scholar] [CrossRef]
  31. Vaitaitis, G.M.; Wagner, D.H. Galectin-9 Controls CD40 Signaling through a Tim-3 Independent Mechanism and Redirects the Cytokine Profile of Pathogenic T Cells in Autoimmunity. PLoS ONE 2012, 7, e38708. [Google Scholar] [CrossRef]
  32. Yasinska, I.M.; Meyer, N.H.; Schlichtner, S.; Hussain, R.; Siligardi, G.; Casely-Hayford, M.; Fiedler, W.; Wellbrock, J.; Desmet, C.; Calzolai, L.; et al. Ligand-Receptor Interactions of Galectin-9 and VISTA Suppress Human T Lymphocyte Cytotoxic Activity. Front. Immunol. 2020, 11, 580557. [Google Scholar] [CrossRef]
  33. Madireddi, S.; Eun, S.-Y.; Lee, S.-W.; Nemčovičová, I.; Mehta, A.K.; Zajonc, D.M.; Nishi, N.; Niki, T.; Hirashima, M.; Croft, M. Galectin-9 Controls the Therapeutic Activity of 4-1BB-Targeting Antibodies. J. Exp. Med. 2014, 211, 1433–1448. [Google Scholar] [CrossRef] [PubMed]
  34. Daley, D.; Mani, V.R.; Mohan, N.; Akkad, N.; Ochi, A.; Heindel, D.W.; Lee, K.B.; Zambirinis, C.P.; Pandian, G.S.B.; Savadkar, S.; et al. Dectin 1 Activation on Macrophages by Galectin 9 Promotes Pancreatic Carcinoma and Peritumoral Immune Tolerance. Nat. Med. 2017, 23, 556–567. [Google Scholar] [CrossRef] [PubMed]
  35. Benson, A.B.; Venook, A.P.; Al-Hawary, M.M.; Arain, M.A.; Chen, Y.-J.; Ciombor, K.K.; Cohen, S.; Cooper, H.S.; Deming, D.; Farkas, L.; et al. Colon Cancer, Version 2.2021, NCCN Clinical Practice Guidelines in Oncology. J. Natl. Compr. Cancer Netw. 2021, 19, 329–359. [Google Scholar] [CrossRef]
  36. Ochman, B.; Kot, A.; Mielcarska, S.; Kula, A.; Dawidowicz, M.; Koszewska, D.; Hudy, D.; Szrot, M.; Piecuch, J.; Waniczek, D.; et al. Association of SIGLEC9 Expression with Cytokine Expression, Tumor Grading, KRAS, NRAS, BRAF, PIK3CA, AKT Gene Mutations, and MSI Status in Colorectal Cancer. Curr. Issues Mol. Biol. 2024, 46, 13617–13646. [Google Scholar] [CrossRef]
  37. Zhang, Y.; Deng, D.; Yin, W.; Luo, J.; Liu, J.; Xie, C.; Ji, X.; Ma, L.; Zhang, L.; Xia, X.; et al. Relationship Between Tim-3 and Galectin-9 Expression Levels, Clinical Pathological Characteristics, and Prognosis in Patients After Radical Resection of Colorectal Cancer. Sichuan Da Xue Xue Bao Yi Xue Ban 2024, 55, 375–382. [Google Scholar] [CrossRef]
  38. Wang, Y.; Sun, J.; Ma, C.; Gao, W.; Song, B.; Xue, H.; Chen, W.; Chen, X.; Zhang, Y.; Shao, Q.; et al. Reduced Expression of Galectin-9 Contributes to a Poor Outcome in Colon Cancer by Inhibiting NK Cell Chemotaxis Partially through the Rho/ROCK1 Signaling Pathway. PLoS ONE 2016, 11, e0152599. [Google Scholar] [CrossRef]
  39. Sim, J.; Park, J.; Kim, S.; Hwang, S.; Sung, K.; Lee, J.-E.; Yang, S.; Cho, K.; Lee, S.; Moon, J.-S.; et al. Association of Tim-3/Gal-9 Axis with NLRC4 Inflammasome in Glioma Malignancy: Tim-3/Gal-9 Induce the NLRC4 Inflammasome. Int. J. Mol. Sci. 2022, 23, 2028. [Google Scholar] [CrossRef]
  40. Kim, H.-S.; Chang, C.Y.; Yoon, H.J.; Kim, K.S.; Koh, H.S.; Kim, S.S.; Lee, S.-J.; Kane, L.P.; Park, E.J. Glial TIM-3 Modulates Immune Responses in the Brain Tumor Microenvironment. Cancer Res. 2020, 80, 1833–1845. [Google Scholar] [CrossRef]
  41. Stempin, C.C.; Geysels, R.C.; Park, S.; Palacios, L.M.; Volpini, X.; Motran, C.C.; Rodríguez, E.V.A.; Nicola, J.P.; Cheng, S.; Pellizas, C.G.; et al. Secreted Factors by Anaplastic Thyroid Cancer Cells Induce Tumor-Promoting M2-like Macrophage Polarization through a TIM3-Dependent Mechanism. Cancers 2021, 13, 4821. [Google Scholar] [CrossRef]
  42. Su, H.; Xie, H.; Dai, C.; Ren, Y.; She, Y.; Xu, L.; Chen, D.; Xie, D.; Zhang, L.; Jiang, G.; et al. Characterization of TIM-3 Expression and Its Prognostic Value in Patients with Surgically Resected Lung Adenocarcinoma. Lung Cancer Amst. Neth. 2018, 121, 18–24. [Google Scholar] [CrossRef]
  43. Gao, X.; Zhu, Y.; Li, G.; Huang, H.; Zhang, G.; Wang, F.; Sun, J.; Yang, Q.; Zhang, X.; Lu, B. TIM-3 Expression Characterizes Regulatory T Cells in Tumor Tissues and Is Associated with Lung Cancer Progression. PLoS ONE 2012, 7, e30676. [Google Scholar] [CrossRef]
  44. Yang, F.; Zeng, Z.; Li, J.; Ren, X.; Wei, F. TIM-3 and CEACAM1 Are Prognostic Factors in Head and Neck Squamous Cell Carcinoma. Front. Mol. Biosci. 2021, 8, 619765. [Google Scholar] [CrossRef]
  45. Veigas, F.; Mahmoud, Y.D.; Merlo, J.; Rinflerch, A.; Rabinovich, G.A.; Girotti, M.R. Immune Checkpoints Pathways in Head and Neck Squamous Cell Carcinoma. Cancers 2021, 13, 1018. [Google Scholar] [CrossRef]
  46. Cheng, G.; Li, M.; Wu, J.; Ji, M.; Fang, C.; Shi, H.; Zhu, D.; Chen, L.; Zhao, J.; Shi, L.; et al. Expression of Tim-3 in Gastric Cancer Tissue and Its Relationship with Prognosis. Int. J. Clin. Exp. Pathol. 2015, 8, 9452–9457. [Google Scholar]
  47. Burugu, S.; Gao, D.; Leung, S.; Chia, S.K.; Nielsen, T.O. TIM-3 Expression in Breast Cancer. Oncoimmunology 2018, 7, e1502128. [Google Scholar] [CrossRef]
  48. Liu, J.; Li, Y.; Li, Q.; Liang, D.; Wang, Q.; Liu, Q. Biomarkers of Response to Camrelizumab Combined with Apatinib: An Analysis from a Phase II Trial in Advanced Triple-Negative Breast Cancer Patients. Breast Cancer Res. Treat. 2021, 186, 687–697. [Google Scholar] [CrossRef]
  49. Yasinska, I.M.; Sakhnevych, S.S.; Pavlova, L.; Teo Hansen Selnø, A.; Teuscher Abeleira, A.M.; Benlaouer, O.; Gonçalves Silva, I.; Mosimann, M.; Varani, L.; Bardelli, M.; et al. The Tim-3-Galectin-9 Pathway and Its Regulatory Mechanisms in Human Breast Cancer. Front. Immunol. 2019, 10, 1594. [Google Scholar] [CrossRef]
  50. Chen, Z.; Dong, D.; Zhu, Y.; Pang, N.; Ding, J. The Role of Tim-3/Galectin-9 Pathway in T-Cell Function and Prognosis of Patients with Human Papilloma Virus-Associated Cervical Carcinoma. FASEB J. Off. Publ. Fed. Am. Soc. Exp. Biol. 2021, 35, e21401. [Google Scholar] [CrossRef]
  51. Seifert, A.M.; Reiche, C.; Heiduk, M.; Tannert, A.; Meinecke, A.-C.; Baier, S.; von Renesse, J.; Kahlert, C.; Distler, M.; Welsch, T.; et al. Detection of Pancreatic Ductal Adenocarcinoma with Galectin-9 Serum Levels. Oncogene 2020, 39, 3102–3113. [Google Scholar] [CrossRef]
  52. Yang, J.; Zhu, L.; Cai, Y.; Suo, J.; Jin, J. Role of Downregulation of Galectin-9 in the Tumorigenesis of Gastric Cancer. Int. J. Oncol. 2014, 45, 1313–1320. [Google Scholar] [CrossRef]
  53. Lahm, H.; André, S.; Hoeflich, A.; Fischer, J.R.; Sordat, B.; Kaltner, H.; Wolf, E.; Gabius, H.J. Comprehensive Galectin Fingerprinting in a Panel of 61 Human Tumor Cell Lines by RT-PCR and Its Implications for Diagnostic and Therapeutic Procedures. J. Cancer Res. Clin. Oncol. 2001, 127, 375–386. [Google Scholar] [CrossRef]
  54. Hou, N.; Ma, J.; Li, W.; Zhao, L.; Gao, Q.; Mai, L. T-Cell Immunoglobulin and Mucin Domain-Containing Protein-3 and Galectin-9 Protein Expression: Potential Prognostic Significance in Esophageal Squamous Cell Carcinoma for Chinese Patients. Oncol. Lett. 2017, 14, 8007–8013. [Google Scholar] [CrossRef]
  55. Boughdady, I.S.; Kinsella, A.R.; Haboubi, N.Y.; Schofield, P.F. K-Ras Gene Mutations in Adenomas and Carcinomas of the Colon. Surg. Oncol. 1992, 1, 275–282. [Google Scholar] [CrossRef]
  56. Bos, J.L.; Fearon, E.R.; Hamilton, S.R.; Verlaan-de Vries, M.; van Boom, J.H.; van der Eb, A.J.; Vogelstein, B. Prevalence of Ras Gene Mutations in Human Colorectal Cancers. Nature 1987, 327, 293–297. [Google Scholar] [CrossRef]
  57. Xu, M.; Zhao, X.; Wen, T.; Qu, X. Unveiling the Role of KRAS in Tumor Immune Microenvironment. Biomed. Pharmacother. 2024, 171, 116058. [Google Scholar] [CrossRef]
  58. Scheffler, M.; Ihle, M.A.; Hein, R.; Merkelbach-Bruse, S.; Scheel, A.H.; Siemanowski, J.; Brägelmann, J.; Kron, A.; Abedpour, N.; Ueckeroth, F.; et al. K-Ras Mutation Subtypes in NSCLC and Associated Co-Occuring Mutations in Other Oncogenic Pathways. J. Thorac. Oncol. 2019, 14, 606–616. [Google Scholar] [CrossRef]
  59. Fu, X.; Wang, X.; Duanmu, J.; Li, T.; Jiang, Q. KRAS Mutations Are Negatively Correlated with Immunity in Colon Cancer. Aging 2020, 13, 750–768. [Google Scholar] [CrossRef]
  60. Kim, J.H.; Kim, H.S.; Kim, B.J. Prognostic Value of KRAS Mutation in Advanced Non-Small-Cell Lung Cancer Treated with Immune Checkpoint Inhibitors: A Meta-Analysis and Review. Oncotarget 2017, 8, 48248–48252. [Google Scholar] [CrossRef]
  61. Liu, H.; Liang, Z.; Zhou, C.; Zeng, Z.; Wang, F.; Hu, T.; He, X.; Wu, X.; Wu, X.; Lan, P. Mutant KRAS Triggers Functional Reprogramming of Tumor-Associated Macrophages in Colorectal Cancer. Signal Transduct. Target. Ther. 2021, 6, 144. [Google Scholar] [CrossRef]
  62. Afrăsânie, V.-A.; Marinca, M.V.; Alexa-Stratulat, T.; Gafton, B.; Păduraru, M.; Adavidoaiei, A.M.; Miron, L.; Rusu, C. KRAS, NRAS, BRAF, HER2 and Microsatellite Instability in Metastatic Colorectal Cancer–Practical Implications for the Clinician. Radiol. Oncol. 2019, 53, 265–274. [Google Scholar] [CrossRef]
  63. Mei, Z.B.; Duan, C.Y.; Li, C.B.; Cui, L.; Ogino, S. Prognostic Role of Tumor PIK3CA Mutation in Colorectal Cancer: A Systematic Review and Meta-Analysis. Ann. Oncol. Off. J. Eur. Soc. Med. Oncol. 2016, 27, 1836–1848. [Google Scholar] [CrossRef]
  64. Wang, C.; Pan, D. Mutation Patterns and Prognostic Analysis of BRAF/KRAS/PIK3CA in Colorectal Cancer. J. Clin. Lab. Anal. 2022, 36, e24444. [Google Scholar] [CrossRef]
  65. De Roock, W.; De Vriendt, V.; Normanno, N.; Ciardiello, F.; Tejpar, S. KRAS, BRAF, PIK3CA, and PTEN Mutations: Implications for Targeted Therapies in Metastatic Colorectal Cancer. Lancet Oncol. 2011, 12, 594–603. [Google Scholar] [CrossRef]
  66. Zeissig, M.N.; Ashwood, L.M.; Kondrashova, O.; Sutherland, K.D. Next Batter up! Targeting Cancers with KRAS-G12D Mutations. Trends Cancer 2023, 9, 955–967. [Google Scholar] [CrossRef]
  67. Mahdi, Y.; Khmou, M.; Souadka, A.; Agouri, H.E.; Ech-Charif, S.; Mounjid, C.; Khannoussi, B.E. Correlation between KRAS and NRAS Mutational Status and Clinicopathological Features in 414 Cases of Metastatic Colorectal Cancer in Morocco: The Largest North African Case Series. BMC Gastroenterol. 2023, 23, 193. [Google Scholar] [CrossRef]
  68. Benmokhtar, S.; Laraqui, A.; Hilali, F.; Bajjou, T.; El Zaitouni, S.; Jafari, M.; Baba, W.; Elannaz, H.; Lahlou, I.A.; Hafsa, C.; et al. RAS/RAF/MAPK Pathway Mutations as Predictive Biomarkers in Middle Eastern Colorectal Cancer: A Systematic Review. Clin. Med. Insights Oncol. 2024, 18, 11795549241255651. [Google Scholar] [CrossRef]
  69. Koulouridi, A.; Karagianni, M.; Messaritakis, I.; Sfakianaki, M.; Voutsina, A.; Trypaki, M.; Bachlitzanaki, M.; Koustas, E.; Karamouzis, M.V.; Ntavatzikos, A.; et al. Prognostic Value of KRAS Mutations in Colorectal Cancer Patients. Cancers 2022, 14, 3320. [Google Scholar] [CrossRef] [PubMed]
  70. Ucar, G.; Ergun, Y.; Aktürk Esen, S.; Acikgoz, Y.; Dirikoc, M.; Esen, İ.; Bal, Ö.; Uncu, D. Prognostic and Predictive Value of KRAS Mutation Number in Metastatic Colorectal Cancer. Medicine 2020, 99, e22407. [Google Scholar] [CrossRef] [PubMed]
  71. Zeng, J.; Fan, W.; Li, J.; Wu, G.; Wu, H. KRAS/NRAS Mutations Associated with Distant Metastasis and BRAF/PIK3CA Mutations Associated with Poor Tumor Differentiation in Colorectal Cancer. Int. J. Gen. Med. 2023, 16, 4109–4120. [Google Scholar] [CrossRef]
  72. Benmokhtar, S.; Laraqui, A.; El Boukhrissi, F.; Hilali, F.; Bajjou, T.; Jafari, M.; Elzaitouni, S.; Baba, W.; El Mchichi, B.; Elannaz, H.; et al. Clinical Significance of Somatic Mutations in RAS/RAF/MAPK Signaling Pathway in Moroccan and North African Colorectal Cancer Patients. Asian Pac. J. Cancer Prev. APJCP 2022, 23, 3725–3733. [Google Scholar] [CrossRef]
  73. Poulsen, T.S.; de Oliveira, D.V.N.P.; Espersen, M.L.M.; Klarskov, L.L.; Skovrider-Ruminski, W.; Hogdall, E. Frequency and Coexistence of KRAS, NRAS, BRAF and PIK3CA Mutations and Occurrence of MMR Deficiency in Danish Colorectal Cancer Patients. APMIS 2021, 129, 61–69. [Google Scholar] [CrossRef]
  74. Tol, J.; Nagtegaal, I.D.; Punt, C.J.A. BRAF Mutation in Metastatic Colorectal Cancer. N. Engl. J. Med. 2009, 361, 98–99. [Google Scholar] [CrossRef]
  75. Roth, A.D.; Tejpar, S.; Delorenzi, M.; Yan, P.; Fiocca, R.; Klingbiel, D.; Dietrich, D.; Biesmans, B.; Bodoky, G.; Barone, C.; et al. Prognostic Role of KRAS and BRAF in Stage II and III Resected Colon Cancer: Results of the Translational Study on the PETACC-3, EORTC 40993, SAKK 60-00 Trial. J. Clin. Oncol. Off. J. Am. Soc. Clin. Oncol. 2010, 28, 466–474. [Google Scholar] [CrossRef]
  76. Liao, X.; Morikawa, T.; Lochhead, P.; Imamura, Y.; Kuchiba, A.; Yamauchi, M.; Nosho, K.; Qian, Z.R.; Nishihara, R.; Meyerhardt, J.A.; et al. Prognostic Role of PIK3CA Mutation in Colorectal Cancer: Cohort Study and Literature Review. Clin. Cancer Res. Off. J. Am. Assoc. Cancer Res. 2012, 18, 2257–2268. [Google Scholar] [CrossRef]
  77. Papadatos-Pastos, D.; Rabbie, R.; Ross, P.; Sarker, D. The Role of the PI3K Pathway in Colorectal Cancer. Crit. Rev. Oncol. Hematol. 2015, 94, 18–30. [Google Scholar] [CrossRef]
  78. Crane, C.A.; Panner, A.; Murray, J.C.; Wilson, S.P.; Xu, H.; Chen, L.; Simko, J.P.; Waldman, F.M.; Pieper, R.O.; Parsa, A.T. PI(3) Kinase Is Associated with a Mechanism of Immunoresistance in Breast and Prostate Cancer. Oncogene 2009, 28, 306–312. [Google Scholar] [CrossRef]
  79. Ugai, T.; Zhao, M.; Shimizu, T.; Akimoto, N.; Shi, S.; Takashima, Y.; Zhong, R.; Lau, M.C.; Haruki, K.; Arima, K.; et al. Association of PIK3CA Mutation and PTEN Loss with Expression of CD274 (PD-L1) in Colorectal Carcinoma. Oncoimmunology 2021, 10, 1956173. [Google Scholar] [CrossRef]
  80. He, S.; Lin, Q.; Chen, J.; Ma, C.; Liu, Z.; Sun, Y.; Mao, W.; Shen, D.; Wang, J. Differential Expression of Tim3 Protein in Colorectal Cancer Associated with MSI and Braf Mutation. Histol. Histopathol. 2022, 37, 441–448. [Google Scholar] [CrossRef]
  81. Cen, S.; Liu, K.; Zheng, Y.; Shan, J.; Jing, C.; Gao, J.; Pan, H.; Bai, Z.; Liu, Z. BRAF Mutation as a Potential Therapeutic Target for Checkpoint Inhibitors: A Comprehensive Analysis of Immune Microenvironment in BRAF Mutated Colon Cancer. Front. Cell Dev. Biol. 2021, 9, 705060. [Google Scholar] [CrossRef]
  82. Yan, Y.; Gao, Z.; Han, H.; Zhao, Y.; Zhang, Y.; Ma, X.; Chen, H. NRAS Expression Is Associated with Prognosis and Tumor Immune Microenvironment in Lung Adenocarcinoma. J. Cancer Res. Clin. Oncol. 2022, 148, 565–575. [Google Scholar] [CrossRef]
  83. De’ Angelis, G.L.; Bottarelli, L.; Azzoni, C.; De’ Angelis, N.; Leandro, G.; Di Mario, F.; Gaiani, F.; Negri, F. Microsatellite Instability in Colorectal Cancer. Acta Bio-Medica Atenei Parm. 2018, 89, 97–101. [Google Scholar] [CrossRef]
  84. Yamamoto, H.; Watanabe, Y.; Arai, H.; Umemoto, K.; Tateishi, K.; Sunakawa, Y. Microsatellite Instability: A 2024 Update. Cancer Sci. 2024, 115, 1738–1748. [Google Scholar] [CrossRef] [PubMed]
  85. An, S.; Li, W.; Do, H.; Kwon, H.Y.; Kim, B.; Kim, K.; Kim, Y.; Cho, M.-Y. The Expression Patterns of Immune Checkpoint Molecules in Colorectal Cancer: An Analysis Based on Microsatellite Status. Biomedicines 2024, 12, 752. [Google Scholar] [CrossRef]
  86. Katagata, M.; Okayama, H.; Nakajima, S.; Saito, K.; Sato, T.; Sakuma, M.; Fukai, S.; Endo, E.; Sakamoto, W.; Saito, M.; et al. TIM-3 Expression and M2 Polarization of Macrophages in the TGFβ-Activated Tumor Microenvironment in Colorectal Cancer. Cancers 2023, 15, 4943. [Google Scholar] [CrossRef] [PubMed]
  87. Gossink, E.M.; Coffer, P.J.; Cutilli, A.; Lindemans, C.A. Immunomodulation by Galectin-9: Distinct Role in T Cell Populations, Current Therapeutic Avenues and Future Potential. Cell. Immunol. 2025, 407, 104890. [Google Scholar] [CrossRef]
  88. Chen, H.-Y.; Wu, Y.-F.; Chou, F.-C.; Wu, Y.-H.; Yeh, L.-T.; Lin, K.-I.; Liu, F.-T.; Sytwu, H.-K. Intracellular Galectin-9 Enhances Proximal TCR Signaling and Potentiates Autoimmune Diseases. J. Immunol. 2020, 204, 1158–1172. [Google Scholar] [CrossRef] [PubMed]
  89. Kashio, Y.; Nakamura, K.; Abedin, M.J.; Seki, M.; Nishi, N.; Yoshida, N.; Nakamura, T.; Hirashima, M. Galectin-9 Induces Apoptosis Through the Calcium-Calpain-Caspase-1 Pathway1. J. Immunol. 2003, 170, 3631–3636. [Google Scholar] [CrossRef]
  90. Gooden, M.J.M.; Wiersma, V.R.; Samplonius, D.F.; Gerssen, J.; van Ginkel, R.J.; Nijman, H.W.; Hirashima, M.; Niki, T.; Eggleton, P.; Helfrich, W.; et al. Galectin-9 Activates and Expands Human T-Helper 1 Cells. PLoS ONE 2013, 8, e65616. [Google Scholar] [CrossRef]
  91. Lhuillier, C.; Barjon, C.; Niki, T.; Gelin, A.; Praz, F.; Morales, O.; Souquere, S.; Hirashima, M.; Wei, M.; Dellis, O.; et al. Impact of Exogenous Galectin-9 on Human T Cells: CONTRIBUTION OF THE T CELL RECEPTOR COMPLEX TO ANTIGEN-INDEPENDENT ACTIVATION BUT NOT TO APOPTOSIS INDUCTION. J. Biol. Chem. 2015, 290, 16797–16811. [Google Scholar] [CrossRef] [PubMed]
  92. Wang, Y.; Zheng, R.; Zhang, Y.; Guo, Y.; Hui, Z.; Wang, P.; Sun, Y. Galectin-9 Expression Clinically Associated with Mature Dendritic Cells Infiltration and T Cell Immune Response in Colorectal Cancer. BMC Cancer 2022, 22, 1319. [Google Scholar] [CrossRef]
  93. Rahmati, A.; Bigam, S.; Elahi, S. Galectin-9 Promotes Natural Killer Cells Activity via Interaction with CD44. Front. Immunol. 2023, 14, 1131379. [Google Scholar] [CrossRef] [PubMed]
  94. Golden-Mason, L.; McMahan, R.H.; Strong, M.; Reisdorph, R.; Mahaffey, S.; Palmer, B.E.; Cheng, L.; Kulesza, C.; Hirashima, M.; Niki, T.; et al. Galectin-9 Functionally Impairs Natural Killer Cells in Humans and Mice. J. Virol. 2013, 87, 4835–4845. [Google Scholar] [CrossRef]
  95. Nobumoto, A.; Oomizu, S.; Arikawa, T.; Katoh, S.; Nagahara, K.; Miyake, M.; Nishi, N.; Takeshita, K.; Niki, T.; Yamauchi, A.; et al. Galectin-9 Expands Unique Macrophages Exhibiting Plasmacytoid Dendritic Cell-like Phenotypes That Activate NK Cells in Tumor-Bearing Mice. Clin. Immunol. 2009, 130, 322–330. [Google Scholar] [CrossRef] [PubMed]
  96. Chevalier, M.F.; Bohner, P.; Pieraerts, C.; Lhermitte, B.; Gourmaud, J.; Nobile, A.; Rotman, S.; Cesson, V.; Martin, V.; Legris, A.-S.; et al. Immunoregulation of Dendritic Cell Subsets by Inhibitory Receptors in Urothelial Cancer. Eur. Urol. 2017, 71, 854–857. [Google Scholar] [CrossRef]
  97. Sakuma, M.; Katagata, M.; Okayama, H.; Nakajima, S.; Saito, K.; Sato, T.; Fukai, S.; Tsumuraya, H.; Onozawa, H.; Sakamoto, W.; et al. TIM-3 Expression on Dendritic Cells in Colorectal Cancer. Cancers 2024, 16, 1888. [Google Scholar] [CrossRef]
  98. González-Reyes, S.; Marín, L.; González, L.; González, L.O.; del Casar, J.M.; Lamelas, M.L.; González-Quintana, J.M.; Vizoso, F.J. Study of TLR3, TLR4 and TLR9 in Breast Carcinomas and Their Association with Metastasis. BMC Cancer 2010, 10, 665. [Google Scholar] [CrossRef]
  99. Ndhlovu, L.C.; Lopez-Vergès, S.; Barbour, J.D.; Jones, R.B.; Jha, A.R.; Long, B.R.; Schoeffler, E.C.; Fujita, T.; Nixon, D.F.; Lanier, L.L. Tim-3 Marks Human Natural Killer Cell Maturation and Suppresses Cell-Mediated Cytotoxicity. Blood 2012, 119, 3734–3743. [Google Scholar] [CrossRef]
  100. Gleason, M.K.; Lenvik, T.R.; McCullar, V.; Felices, M.; O’Brien, M.S.; Cooley, S.A.; Verneris, M.R.; Cichocki, F.; Holman, C.J.; Panoskaltsis-Mortari, A.; et al. Tim-3 Is an Inducible Human Natural Killer Cell Receptor That Enhances Interferon Gamma Production in Response to Galectin-9. Blood 2012, 119, 3064–3072. [Google Scholar] [CrossRef]
  101. Wang, Z.; Yin, N.; Zhang, Z.; Zhang, Y.; Zhang, G.; Chen, W. Upregulation of T-Cell Immunoglobulin and Mucin-Domain Containing-3 (Tim-3) in Monocytes/Macrophages Associates with Gastric Cancer Progression. Immunol. Invest. 2017, 46, 134–148. [Google Scholar] [CrossRef]
  102. Galassi, C.; Chan, T.A.; Vitale, I.; Galluzzi, L. The Hallmarks of Cancer Immune Evasion. Cancer Cell 2024, 42, 1825–1863. [Google Scholar] [CrossRef] [PubMed]
  103. Ochman, B.; Mielcarska, S.; Kula, A.; Dawidowicz, M.; Robotycka, J.; Piecuch, J.; Szrot, M.; Dzięgielewska-Gęsiak, S.; Muc-Wierzgoń, M.; Waniczek, D.; et al. Do Elevated YKL-40 Levels Drive the Immunosuppressive Tumor Microenvironment in Colorectal Cancer? Assessment of the Association of the Expression of YKL-40, MMP-8, IL17A, and PD-L1 with Coexisting Type 2 Diabetes, Obesity, and Active Smoking. Curr. Issues Mol. Biol. 2023, 45, 2781–2797. [Google Scholar] [CrossRef]
  104. Mielcarska, S.; Dawidowicz, M.; Kula, A.; Kiczmer, P.; Skiba, H.; Krygier, M.; Chrabańska, M.; Piecuch, J.; Szrot, M.; Ochman, B.; et al. B7H3 Role in Reshaping Immunosuppressive Landscape in MSI and MSS Colorectal Cancer Tumours. Cancers 2023, 15, 3136. [Google Scholar] [CrossRef] [PubMed]
  105. Dawidowicz, M.; Kula, A.; Mielcarska, S.; Kiczmer, P.; Skiba, H.; Krygier, M.; Chrabańska, M.; Piecuch, J.; Szrot, M.; Robotycka, J.; et al. B7H4 Expression Is More Frequent in MSS Status Colorectal Cancer and Is Negatively Associated with Tumour Infiltrating Lymphocytes. Cells 2023, 12, 861. [Google Scholar] [CrossRef] [PubMed]
  106. Kanehisa, M.; Goto, S. KEGG: Kyoto Encyclopedia of Genes and Genomes. Nucleic Acids Res. 2000, 28, 27–30. [Google Scholar] [CrossRef]
  107. Kanehisa, M.; Furumichi, M.; Sato, Y.; Kawashima, M.; Ishiguro-Watanabe, M. KEGG for Taxonomy-Based Analysis of Pathways and Genomes. Nucleic Acids Res. 2023, 51, D587–D592. [Google Scholar] [CrossRef]
  108. Ashburner, M.; Ball, C.A.; Blake, J.A.; Botstein, D.; Butler, H.; Cherry, J.M.; Davis, A.P.; Dolinski, K.; Dwight, S.S.; Eppig, J.T.; et al. Gene Ontology: Tool for the Unification of Biology. Nat. Genet. 2000, 25, 25–29. [Google Scholar] [CrossRef]
  109. Dampier, C.H.; Devall, M.; Jennelle, L.T.; Díez-Obrero, V.; Plummer, S.J.; Moreno, V.; Casey, G. Oncogenic Features in Histologically Normal Mucosa: Novel Insights into Field Effect from a Mega-Analysis of Colorectal Transcriptomes. Clin. Transl. Gastroenterol. 2020, 11, e00210. [Google Scholar] [CrossRef]
  110. Subramanian, A.; Tamayo, P.; Mootha, V.K.; Mukherjee, S.; Ebert, B.L.; Gillette, M.A.; Paulovich, A.; Pomeroy, S.L.; Golub, T.R.; Lander, E.S.; et al. Gene Set Enrichment Analysis: A Knowledge-Based Approach for Interpreting Genome-Wide Expression Profiles. Proc. Natl. Acad. Sci. USA 2005, 102, 15545–15550. [Google Scholar] [CrossRef]
  111. Liberzon, A.; Birger, C.; Thorvaldsdóttir, H.; Ghandi, M.; Mesirov, J.P.; Tamayo, P. The Molecular Signatures Database (MSigDB) Hallmark Gene Set Collection. Cell Syst. 2015, 1, 417–425. [Google Scholar] [CrossRef] [PubMed]
Figure 1. (A) TIM-3 protein expression in CRC tissues versus adjacent surgical margins. Wilcoxon signed-rank test (p < 0.001). (B) Gal-9 protein expression in CRC tissues and matched margins. Wilcoxon signed-rank test indicated a highly significant difference, with a p-value < 0.001. All data were subjected to log10 transformation prior to analysis.
Ijms 26 06735 g001
Figure 2. TIM-3 protein concentration according to PIK3CA mutation. Density plot shows case counts (n) and significance level determined by the U–Mann–Whitney U test.
Ijms 26 06735 g002
Figure 3. Hallmark gene set enrichment analysis (GSEA) comparing high vs. low expression of TIM-3 in CRC tissues.
Ijms 26 06735 g003
Figure 4. Hallmark gene set enrichment analysis (GSEA) comparing high vs. low expression of TIM-3 in CRC tissues.
Ijms 26 06735 g004
Table 1. Frequencies of KRAS, NRAS, BRAF, PIK3CA, and AKT1 gene mutations in the analyzed CRC cohort.
GeneMutation StatusPercent (%)
n = 104Wild-TypeMutantPercent Among Mutation of the One Gene Percent Among All Group
KRAS6638 36.53%
KRAS-117-STATUS100410.52%3.84%
KRAS-12/13-STATUS752976.31%27.88%
KRAS-59-STATUS10137.89%2.88%
KRAS-146-STATUS10225.26%1.92%
KRAS-61-STATUS10137.89%2.88%
NRAS9113 12.50%
NRAS-12-13-STATUS96861.54%7.69%
NRAS-61-STATUS99538.46%4.80%
PIK3CA977 6.73%
PIK3CA 542/54599685.71%5.77%
PIK3CA 1047103114.28%0.961%
BRAF977 6.73%
AKT1031 0.961%
Combined gene mutations 9 9.615%
KRAS + NRAS 3 2.88%
KRAS + PIK3CA 4 3.846%
KRAS + BRAF 1 0.961%
KRAS + AKT1 1 0.961%
KRAS + NRAS + BRAF 1 0.961%
Table 2. Principal component analysis (PCA) results for cytokines, chemokines, and growth factors measured using a multiplex cytokine screening panel. Cytokine subsets were defined based on Gene Ontology (GO) terms, KEGG pathway annotations, and—specifically for the protumor cytokine group—literature review. For each subset, the table lists the molecules that showed the strongest contribution (i.e., highest loading values) to Principal Component 1 (PC1), which explained the largest proportion of variance within the given group. Spearman’s correlation analysis was performed to evaluate the association between PC1 scores and the expression levels of TIM-3 and Gal-9. The table presents the correlation coefficients (R-values) and corresponding p-values.
Cytokine SubsetTop-Contributing Variables to Principal Component 1 (Based on Factor Loadings)TIM3Gal-9
p-ValueR-Valuep-ValueR-Value
Chemokine signalingRANTES, SDF-1a, MCP1, CTACK, IL-8 IP-10***0.5698***0.5377
Interleukin-10 signalingIL-18, IL-8, RANTES, TNF-a, MCP1, MIP-1b, G-CSF, IP-10, MIP-1a, IL-10**0.4809**0.5036
Interleukin-17 signaling pathwayTNF-a, IL-4, MCP3, Eotaxin, IL-8, GRO-a, MCP1, GM-CSF, IL-17,**0.4176**0.4536
NOD-Like receptor signaling pathwayIL-18, IL-8, IFN-a2, RANTES, TNF-a**0.4917**0.5125
Macrophage chemotaxisRANTES, MCP1, IL-8, MIG, IP-10***0.5278**0.4353
Positive regulation of lymphocyte migrationSDF-1a, RANTES, CTACK, MIP-1a, IP-10***0.6044***0.5516
Protumor cytokinesIL-18, TNF-a, IL-8, RANTES, MCP3, MCP1**0.4220**0.4719
Statistically significant correlations were marked as p < 0.05 (**) or p < 0.01 (***).
Table 3. Characteristics of the patient group.
FemaleMaleAll
Age66.5 ± 9.6465.0 ± 8.7565 ± 9.22
Tumor localization
Left-side tumor435194 (71.76%)
Right-side tumor181836 (27.48%)
T parameter
T1257 (5.34%)
T212921 (16.03%)
T3414687 (66.41%)
T48816 (12.21%)
N parameter
N0253055 (41.98%)
N1262854 (41.22%)
N2111122 (16.79%)
M parameter
M05556111 (84.73%)
M171320 (15.27%)
TNM Stage
I10919 (14.50%)
II151833 (25.19%)
III303060 (45.80%)
IV71219 (14.50%)
Histological Grading
High101222 (16.79%)
Low5238109 (83.21%)
MSI Status (n = 79)
MSS tumors303565 (82.28%)
MSI tumors95 14 (17.72%)
Table 4. The relevant hotspot mutations detected by the RT-PCR assay across the KRAS, NRAS, BRAF, PIK3CA, and AKT1 genes, with the exon location, specific amino acid substitutions, corresponding nucleotide changes, and their COSMIC database identifiers.
GeneExonAmino Acid ChangeNucleotide ChangeCosmic ID
KRAS2G12Ac.35G>C522
G12Dc.35G>A521
G12Rc.34G>C518
G12Cc.34G>T516
G12Sc.34G>A517
G12Vc.35G>T520
G13Dc.38G>A532
3A59Tc.175G>A546
A59Ec.176C>A547
A59Gc.176C>G28518
Q61Hc.183A>C554
Q61Hc.183A>T555
Q61Lc.182A>T553
Q61Rc.182A>G552
4K117Nc.351A>C19940
K117Nc.351A>T28519
K117Rc.350A>G4696722
K117Ec.349A>G-
A146Tc.436G>A19404
A146Pc.436G>C19905
A146Vc.437C>T19900
NRAS2G12Dc.35G>A564
G12Sc.34G>A563
G12Cc.34G>T562
G13Rc.37G>C569
G13Vc.38G>T574
3A59Tc.175G>A578
A59Dc.176C>A253327
Q61Kc.181C>A580
Q61Lc.182A>T583
Q61Rc.182A>G584
Q61Hc.183A>C586
Q61Hc.183A>T585
4K117Rc.350A>G-
A146Tc.436G>A27174
BRAF15V600Ec.1799T>A476
V600E2c.1799-1800TG>AA-
V600Dc.1799-1800TG>AT477
V600Kc.1798-1799GT>AA473
PIK3CA9E542Kc.1624G>A760
E545Kc.1633G>A763
E545Qc.1633G>C27133
20H1047Rc.3140A>G775
H1047Lc.3140A>T776
AKT14E17Kc.49G>A33765
Table 5. Cytokines, chemokines, and growth factor sets assigned to the appropriate Gene Ontology (GO) terms and Kyoto Encyclopedia of Genes and Genomes (KEGG) annotations.
Process NameCytokines InvolvedOrigin
Positive regulation of immune system processMIF, SCF, MCP1, SDF-1a, VEGFA, MCP3, MCSF, MIP-1a, IL-1a, IL-18, IL-6, RANTES, IL-5, TNF-b, LIF, IL-2, IL-1b, IL-7, IFN-g, IL-13, TNF-a, IL-10, IL-8, IL-4, IP-10, IL-15, IL-2Ra, IL-16, CTACK, IL-12p40, MIP-1b, IL-17GO
Chemokine signaling pathwayIL-8, MCP1, SDF-1a, GRO-a, IP-10, RANTES, MIP-1a, CTACK, Eotaxin, MCP3, MIP-1bKEGG
Positive regulation of lymphocyte migrationIP-10, SDF-1a, MIP-1a, CTACK, MIP-1b, MCP3, RANTESGO
Macrophage chemotaxisMCP1, IL-8, Eotaxin, MIG, IP-10, GRO-a, MIP-1b, MCP3, RANTES, IL-1bGO
PI3K-Akt signaling pathwayIL-2Ra, bNGF, IL-2, IL-3, IL-4, SCF, MCSF, IFN-a2, HGF, G-CSF, IL-7, PDGF-bb, BasicFGF, IL-6, VEGFAKEGG
Leukocyte activationIL-4, IL-15, IFN-g, SCF, IL-2Ra, IL-8, MCSF, IL-13, IL-18, MIP-1a, RANTES, IL-10, GM-CSF, IL-9, IL-7, IFN-a2, IL-2, IL-6, TNF-aGO
Inflammatory responseIL-9, CTACK, Eotaxin, MCP1, IFN-a2, IL-1Ra, IL-2Ra, IFN-g, IL-15, IL-1a, IL-6, IL-17, IL-4, MCP3, MIP-1a, IL-18, CTACK, MIF, TNF-a, RANTES, MCSF, MIG, IL-1b, IL-5, IL-10, IL-8, IL-13, IP-10, MIP-1bGO
Interleukin-10 signalingMCP1, MCSF, IL-8, IL-18, IL-6, GM-CSF, LIF, IL-10, IL-1Ra, IL-1a, IP-10, GRO-a, MIP-1a, IL-1b, MIP-1b, G-CSF, RANTES, TNF-aKEGG
NOD-like receptor signaling pathway IL-8, TNF-a, MCP1, IFN-a2, GRO-a, IL-6, IL-1b, RANTES, IL-18KEGG
Protumor cytokinesIL-1a, IL-1b, IL-6, IL-8, IL-17, IL-18, TNF-a, RANTES, MCP1, MCP3, MIF, G-CSF, GM-CSFOwn literature review
IL-17 signalingMCP1, IL-8, IL-1b, IL-4, IL-5, IL-6, IL-13, IL-17, GM-CSF, IFN-g, G-CSF, TNF-a, MCP3, Eotaxin, GRO-a, IP-10KEGG
Positive regulation of cytokine productionIL-9, IL-12p70, GM-CSF, IL-10, HGF, IL-2, IL-15, IL-1b, IL-18, IFN-g, IL-7, IL-4, TNF-a, IL-17, MIF, TNF-b, IL-16, IL-13, MIP-1a, IL-1a, IL-6GO
Disclaimer/Publisher’s Note: The statements, opinions and data contained in all publications are solely those of the individual author(s) and contributor(s) and not of MDPI and/or the editor(s). MDPI and/or the editor(s) disclaim responsibility for any injury to people or property resulting from any ideas, methods, instructions or products referred to in the content.

