Article

Structural Characterization of Micronized Lignocellulose Date Pits as Affected by Water Sonication Followed by Alcoholic Fractionations

by
Khalid Al-Harrasi
1,
Nasser Al-Habsi
1,
Mohamed A. Al-Kindi
2,
Linghong Shi
3,
Hafiz A. R. Suleria
3,
Muthupandian Ashokkumar
4 and
Mohammad Shafiur Rahman
1,*
1
Department of Food Science and Nutrition, College of Agricultural and Marine Sciences, P.O. Box 34-123, Al-Khod 123, Muscat, Oman
2
Department of Pathology, College of Medicine and Health Sciences, Sultan Qaboos University, P.O. Box 35-123, Al-Khod 123, Muscat, Oman
3
School of Agriculture, Food and Ecosystem Sciences, Faculty of Science, The University of Melbourne, Parkville, VIC 3010, Australia
4
Sonochemistry Group, School of Chemistry, The University of Melbourne, Parkville, VIC 3010, Australia
*
Author to whom correspondence should be addressed.
Int. J. Mol. Sci. 2025, 26(14), 6644; https://doi.org/10.3390/ijms26146644
Submission received: 21 April 2025 / Revised: 12 June 2025 / Accepted: 15 June 2025 / Published: 11 July 2025
(This article belongs to the Special Issue Lignocellulose Bioconversion and High-Value Utilization)

Abstract

Date pits are considered waste, and micronized date pit powder could be developed for use in foods and bio-products. In this study, micronized date pit powders were extracted by alcoholic sedimentation after ultrasound treatment. The control was considered untreated, i.e., without sonication. Six micronized fractions (i.e., three from control and three from treated) were prepared by three stages of alcoholic sedimentation. In the case of untreated date pit powder, the average particle size of the fractionated date pit powder (i.e., residue) from three stages of alcoholic sedimentation varied from 89 to 164 µm, while ultrasonic treatment showed variation from 39 to 65 µm. The average particle size of the supernatant fractions of untreated date pit powder varied from 22 to 63 µm, while ultrasonic treatment showed variation from 18 to 44 µm. Ultrasound treatment produced smaller particles. In all cases, Scanning Electron Microscopy (SEM) showed that supernatant fractions contained lumped particles compared to the residue fractions. Transmission Electron Microscopy (TEM) showed the presence of nanoparticles in all extracted fractions. Two glass transitions were observed in all fractions except for the residue from the first sedimentation stage. In addition, higher levels of degradation in the fractionated date pits could be achieved by ultrasonic treatment, as is evident from the Fourier Transform Infrared (FTIR) analysis.

1. Introduction

Date pits are a by-product of date fruit processing factories that can be used as a low-cost additive in food products to enhance fiber content and bioactive compounds [1]. They are used in beverages, desserts, condiments, meat products, and bakery products [2]. Particle surface area increased with the decrease in particle size and affected hydration and oil absorption properties. The hydrolysis and the particle size of the added date pits increased the healthy functional polyphenols and changed the flavor and texture of muffins incorporated with date pits [3]. Zamzam et al. [4] studied the effect of particle size at 150 and 300 μm on chocolate at different ratios. They observed the highest homogeneity when date pit powder of 150 μm was added at a ratio of 1:9. However, improved taste was observed at the ratios of 1:9 and 3:7 with a particle size of 150 μm. Characteristics of particles (i.e., size) are important when date pits are utilized in food products [5]. Particles of micron size can be incorporated as dietary fiber in fiber-fortified foods [6]. The optimal ratios of added date pits depend on the types of food, particle size, and treatments [2]. These could allow us to incorporate date pits at a higher level in food products. In the case of coconut powder, Raghavendra et al. [7] observed that the reduction in particle size from 1127 to 550 μm resulted in increased hydration properties. This could be due to an increase in surface area and surface porosity as well as structural modification. However, hydration properties decreased with the decrease in particle size when the particle size decreased from 550 μm, which showed the opposite trend when compared to the higher particle size. Therefore, the particle size of fortified powder in foods is an important property that needs to be known before identifying its uses.
It is important to understand the physicochemical properties of fibers when they are used in food products to enhance sensory, structural, and health functionality, and how they provide other health functionalities in the digestive tract in the presence of diversified microorganisms and digestive enzymes. Al-Khalili et al. [8,9] extracted crystalline and amorphous date pit fractions after alkali digestion. They pointed out that a crystalline fraction of date pits could enhance the formation of the desired crust, and an amorphous fraction could enhance the softness of crumbs in bread. Crystalline fibers are commonly used in food products for retaining the stability of ice cream, fat substitutes or replacers, bulking agents, encapsulated wall materials for protection, and reinforcement in edible films. They are insoluble in nature and stable in a colloidal system, thus exhibiting a fat-like mouthfeel. They formed a particle gel network and an inert molecule, which filled the gaps of a tight meat fiber network and did not disturb the protein network. This functionality improved the mechanical properties of formulated meat products. The crystalline fiber was used to replace fats in emulsions, baked products, frozen desserts, mayonnaise, gravies, and sauces. This was due to its low solubility and provided a fat-mimicking texture. Micro- and nanocrystalline components increased the specific surface area, water-holding capacity, swelling capacity, and oil-holding capacity. Similarly, amorphous cellulose provided a fat substitute in fermented sausages and provided a gel-like texture [10]. Plasticized powders are closer to the soluble fibers due to their ability to form a gel-like structure.
The health functionality of fibers depends on their solubility, crystallinity, and amorphous or plastic characteristics. Soluble fibers showed more effectiveness in lowering diabetes, heart disease, cholesterol levels, and obesity [11,12], while showing less effectiveness in preventing colorectal cancer [13]. Crystalline cellulose showed the ability to eliminate contaminants by adsorbing carcinogens since it showed a low degree of digestion [14]. Crystalline components are commonly unaffected by gut microorganisms, and their low fermentability improves fecal bulking with smooth flow [15]. De Maesschalck et al. [16] used amorphous cellulose as a feed-supplemented diet. They observed that amorphous or plasticized cellulose did not show inertness since it altered the gut microbial environment. Digestive processes and microbial fermentation depend on the degree of solubility and viscous mass [17]. In addition, damaged fibers could have the ability to form gels with interlinked networks.
Sakr et al. [18] studied the physicochemical, structural, and functional properties of Moringa leaf powder with three particle sizes (i.e., 1.65, 3.76, and 8.53 μm). Different particle sizes were created by a home grinder and ball mill. They observed that specific surface areas, bulk and trap densities, and water solubility indices increased with the decrease in particle size. Moreover, the angle of repose, water holding capacity and oil holding capacity decreased with the increase in particle size. Scanning Electron Microscopy (SEM) showed particle surface roughness decreased with the decrease in particle size. Solids’ melting temperature decreased with the decrease in particle size. With decreasing crystal size, FTIR showed a lack of formation of new functional groups; however, crystallinity pattern remained the same. In addition, FTIR absorbance of typical peaks decreased with increasing particle size.
Ke et al. [5] prepared edible homology plant powder by ball mill grinding with different grinding times. The average particle sizes of five fractions were 10.44, 10.21, 10.06, 9.83 and 9.96 μm, respectively. With the decrease in particle sizes, they observed increased zeta-potential, coarser particles, as observed using SEM, and increased fat and glucose absorption. However, water-holding capacity, oil-holding capacity, water-swelling capacity, total phenols, total flavonoid and ion exchange capacity did not show any changes. Particles sized 10.06 μm presented the greatest change in the above categories, while powder with particles sized 9.83 μm showed the highest ion exchange capacity.
At present, most reports are based on the basic grinding process of whole date pits, and their use in food products. Other treatments, such as physical (i.e., ultrasound and high-pressure steam cooking), chemical (i.e., alcohol, acids and alkali), microbial, and enzymatic hydrolysis need to be applied to improve the properties of date pits. Al-Mawali et al. [19] produced three types of extracted fibers from defatted date pit powder using alkali treatment at 30 °C. They extracted supernatant and residue fractions by maintaining different levels of pH. Residue date pit powder was produced by alkaline-sodium chloride and potassium hydroxide treatments [20]. Four types of whole date pit powder were produced by water soaking, ethanol pretreatment, microwave heating and pressure cooker cooking [21]. Ultrasound decreased particle size during treatment [22]. Awad et al. [23] reviewed the applications of ultrasound in modifying food products and found that it was relatively cheap, simple and saved energy. Mostafa et al. [24] prepared whole date pit powder using a seed grinder with particles passing through a 250 μm sieve. It was then further treated with hydrochloric acid and ultrasound. The produced powder contained nano-size particles within 50 to 150 nm depending on the treatment. They characterized the treated powder by SEM, FTIR, and phenolic, flavonoid, and antioxidant capacity. A variety of food components, such as oil, protein, polysaccharides, and bioactive components, were extracted from plant and animal sources using ultrasound [25]. Aliyu and Hepher [26] observed that ultrasound at 80 W and 38 kHz fragmented cellulosic biomaterial to glucose and other chemicals.
Considering the applications of fibers in foods and other bioproducts, it is important to know the characteristics of particle (i.e., size and shape), amorphous or crystalline nature, and degree of damage of the fibers. This could determine their performance in achieving desired characteristics. Velsaco et al. found that the degree of fiber damage affected the debonding of composite materials [27]. In the literature, chemical treatments are commonly presented to treat date pit powder and only one type of treated powder has been developed. Limited works are presented on natural treatments and extraction of different date pit fractions with varied particle size.
The objectives of this study were to develop different types of date pit powder by water sonication followed by three stages of the alcoholic sedimentation process. Twelve fractionated date pit powders (i.e., six untreated and six ultrasound-treated) were developed. Three stages of alcoholic fractionations were used for the treated and untreated date pits. In addition, particle size and morphology, alongside thermal and functional group characteristics, were measured. The possible utilization of fractionated date pit powder is discussed based on its measured characteristics. The characteristics of each type of fiber were aligned with their possible uses in foods and bioproducts and when these could be beneficial.

2. Result and Discussion

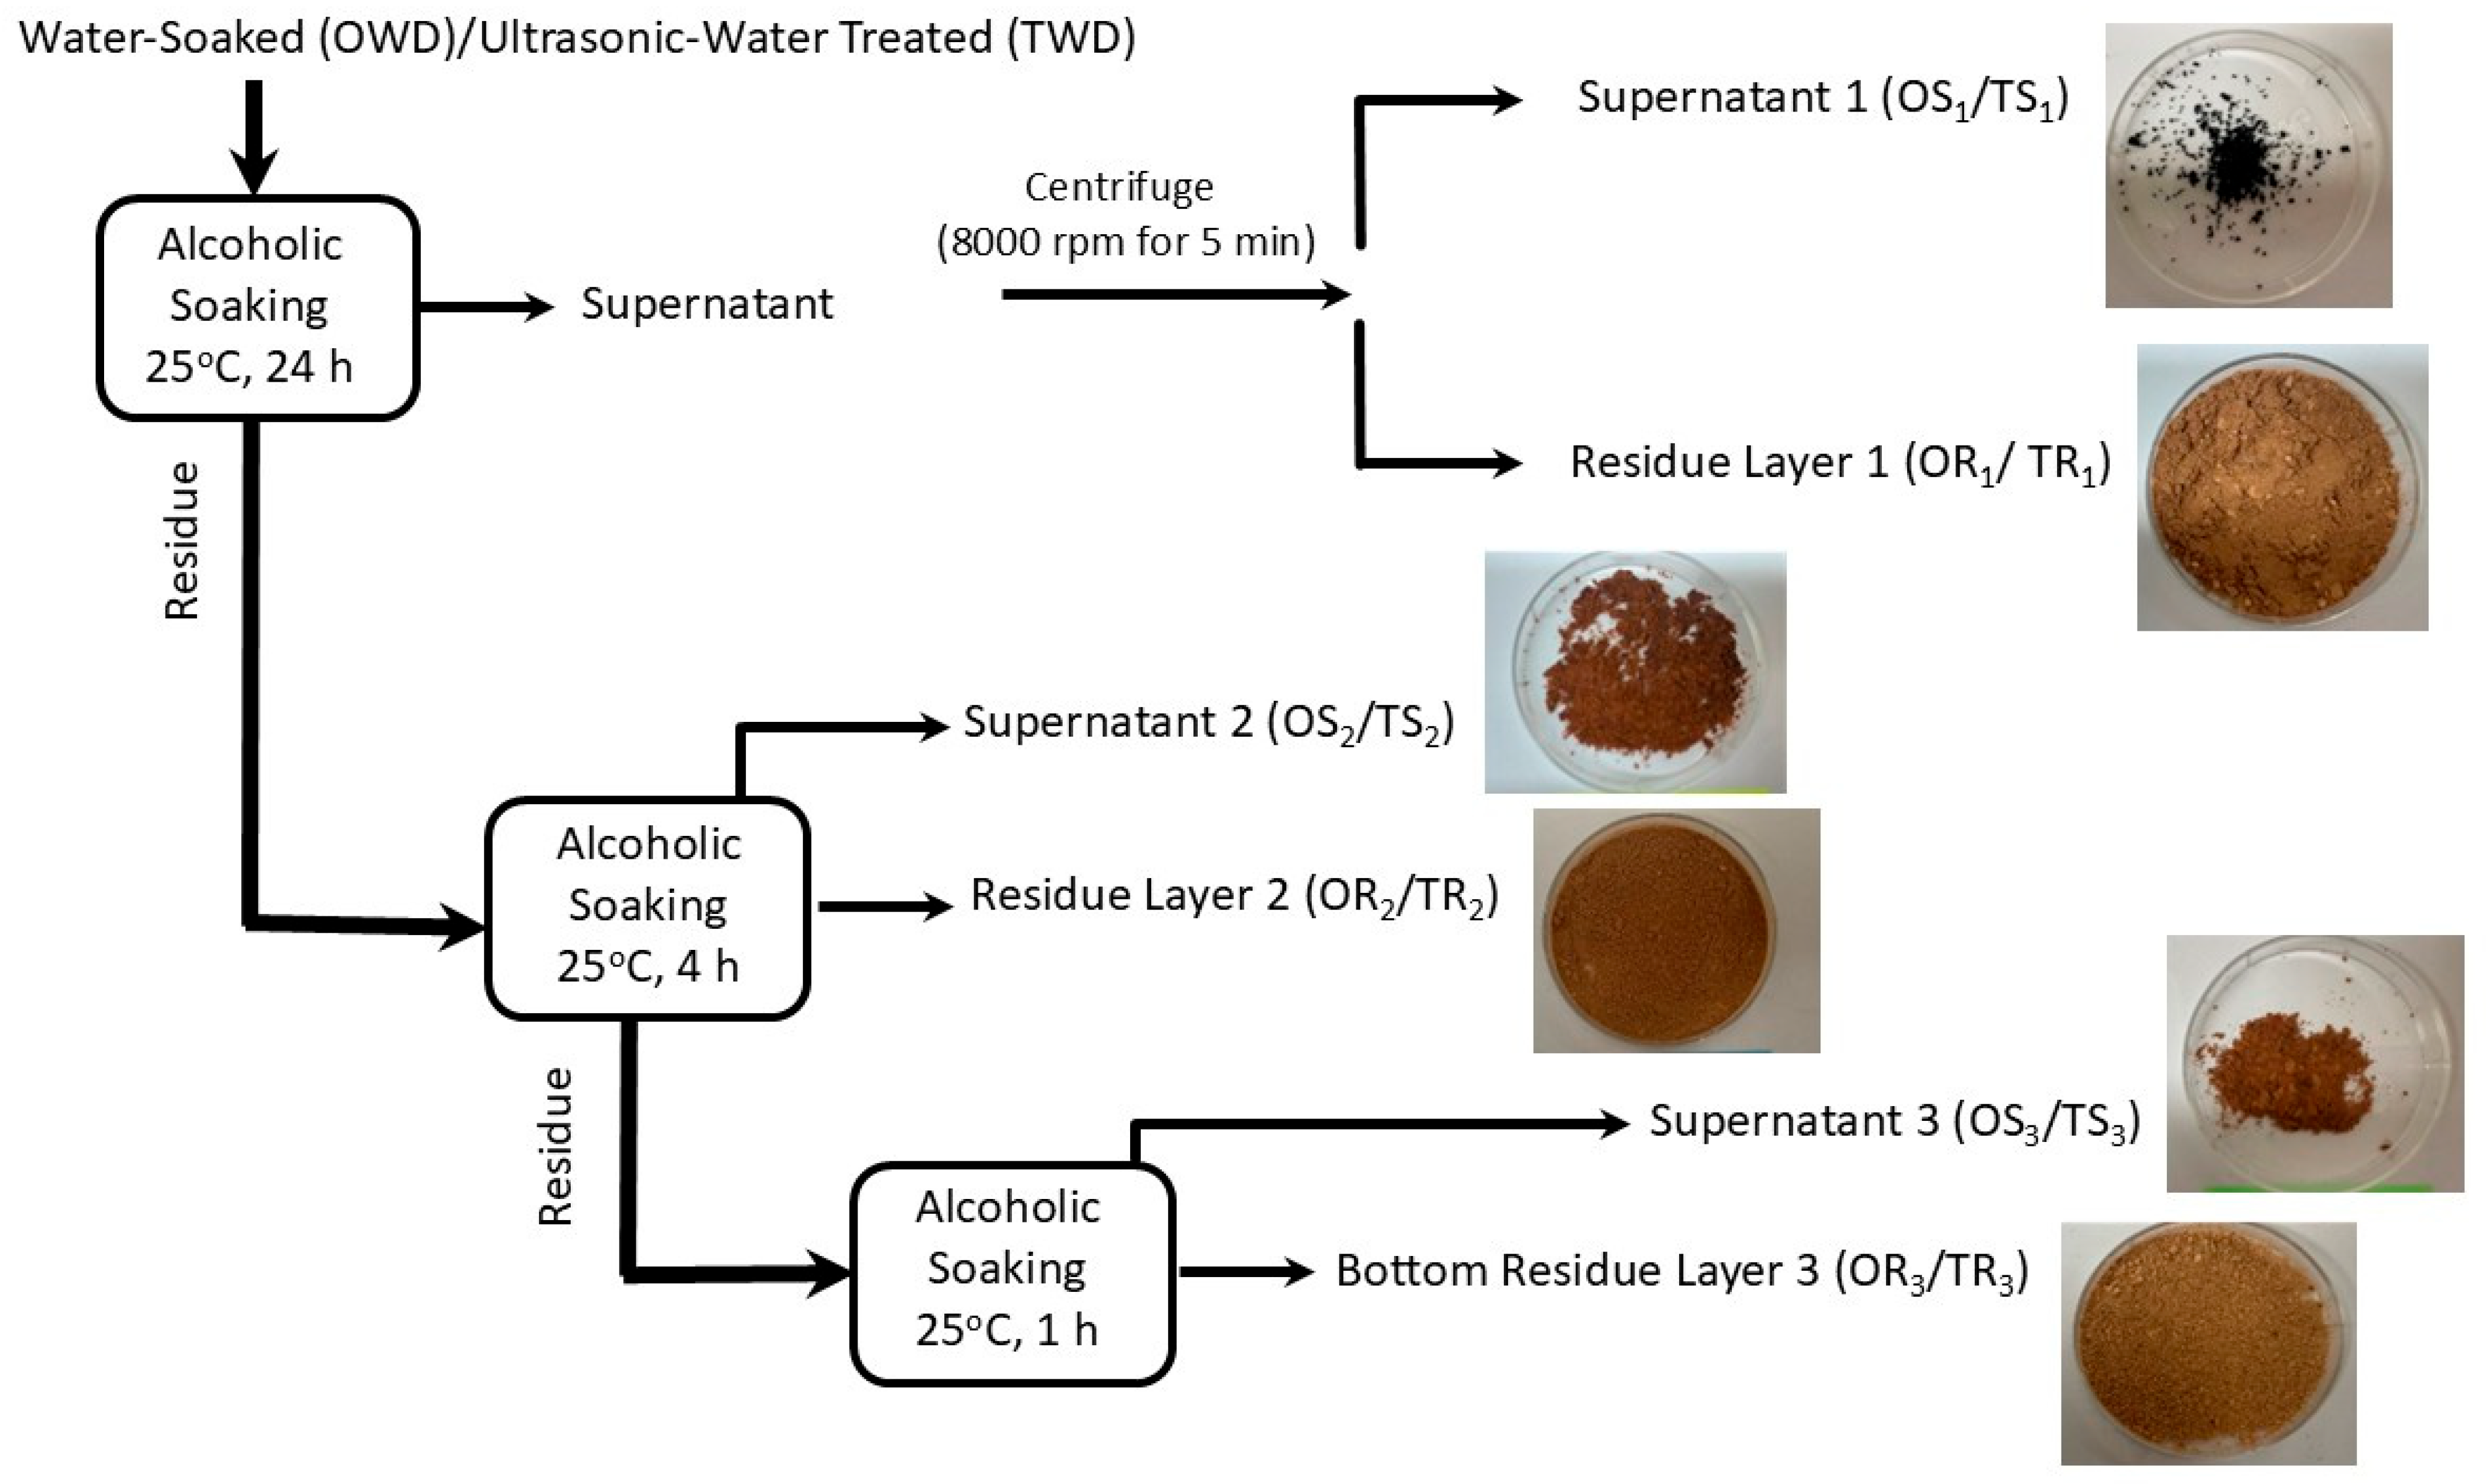
2.1. Fractionation Mechanisms

The supernatants (OS1 and TS2) contained the highest levels of lignin compared to other fractions since lignin could easily dissolve in alcohol. Earlier, it was also observed that supernatant fractionations of date pits suspended in alcohol contained a high level of lignin [7,21]. Alcohol as a solvent was used to fractionate date pits since alcohol was reported to separate lignin and holocellulose from lignocellulosic materials [28]. Ethanolic extraction provided a balance between efficiency of lignin extraction and the structure of the resulting lignin [29]. In addition, ethanol was easy to separate from the extracted fractions. Alcohol disrupted the lignin–carbohydrate bonds and suspended in alcohol. The solvent sedimentation process produced different fractions of varied particle sizes. The fractionation was due to density differences of particles. The average size of particles increased with the increase in the fractionation stage, i.e., the first-stage extraction produced smaller particles (Table 1). Ultrasonic treatment further decreased the particle size of date pits, since it created and caused tiny bubbles in a liquid, resulting in expanding and collapsing. This generated a powerful force that can break particles and disrupt lignin–carbohydrate bonds [30,31].

2.2. Particle Size Distribution

Table 1 shows the mass average particle size distribution of water-soaked (OWD) and ultrasonic-water-treated (TWD) fractionated whole date pits. The data reveal that most particles in the OWD- and TWD-treated whole date pits were larger, ≥250 μm (i.e., 85.58% and 84.95%, respectively). The smaller size fraction of the treated sample was increased to 1.44% as compared to 0.48% in the case of the untreated sample (Table 2). This indicated that ultrasonic treatment effectively produced smaller particles in the date pits.
Table 1 illustrates the average particle size of the fractionated (i.e., treated and untreated) whole date pits. Average particle sizes of the treated fractions (i.e., residues and supernatants) were smaller as compared to the untreated fractions (p < 0.05). The treated supernatant (i.e., TS1) showed the smallest average size (i.e., 18 ± 9 μm), while untreated residue (i.e., OR3) showed the largest particle size (i.e., 164 ± 106 μm). It was clear that ultrasonic treatment reduced the average particle sizes of all the fractionated date pit powder (Table 1). The average particle sizes of the fractionated date pits at the nano level were measured by TEM and it showed similar trends in the case of micro-size particles, as measured by SEM. In other words, ultrasonic treatment also decreased the average sizes of all fractions (i.e., residues and supernatants). Mostafa et al. [24] observed that ultrasound treatment decreased the particle size of acid-hydrolyzed whole date pit powder.

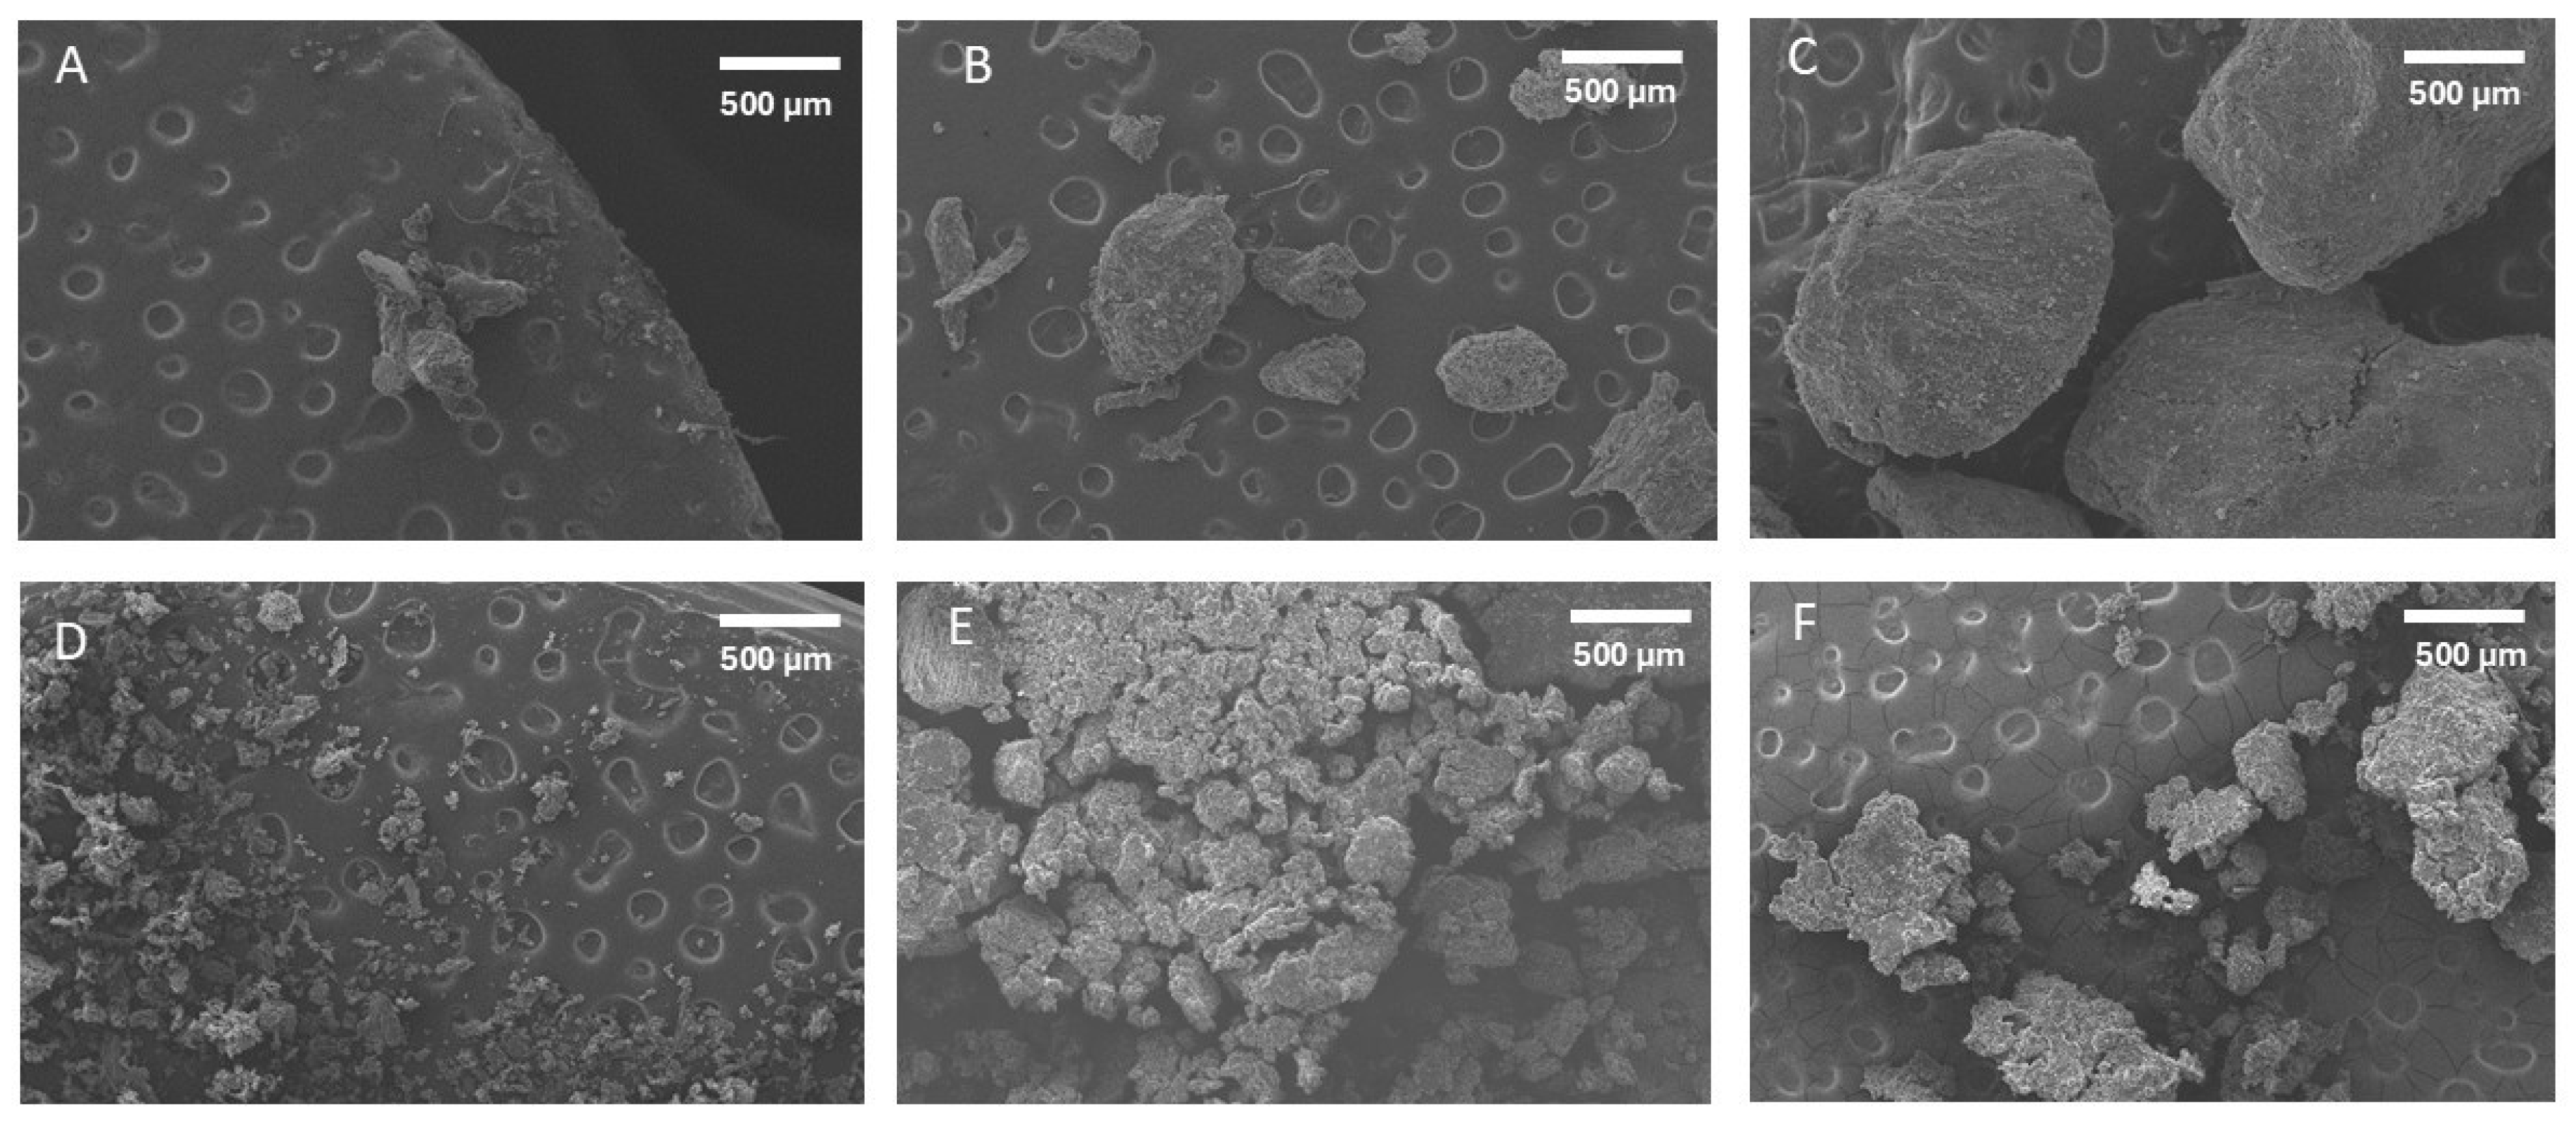
2.3. Scanning Electron Microscopy (SEM)

Figure 1 shows the particle morphology of the extracted date pit fractions (i.e., without sonication). The particle size of the residue fractions increased with the increased extraction stages. This was due to the separation of smaller particles with the supernatant in stage one and stage two. The shapes of the third residue fraction were relatively spherical, while the first and second residue fractions contained some needle-shaped particles. In addition, particles in the first residue were lumped together. However, all water-soaked treated supernatant fractions showed relatively lumped particles.
Figure 2 shows the particle morphology of the ultrasonic-water-treated residue and supernatant fractions. All the treated fractions showed relatively lumped particles except residues TR2. The TR2 fraction showed relatively fine particles, and these are not agglomerated; however, TR3 showed that the particles are intact and separated. In the case of Moringa leaf powder, Sakr et al. [18] observed increased particle roughness with the decrease in size. This may cause the lumping of the particles with a decrease in particle size, as observed in this study. In the case of edible homology plant powder, an increased agglomeration was observed with the decrease in particle size [5]. If the particle size was small, and the specific surface area was large, agglomeration occurred more easily among the particles [32].

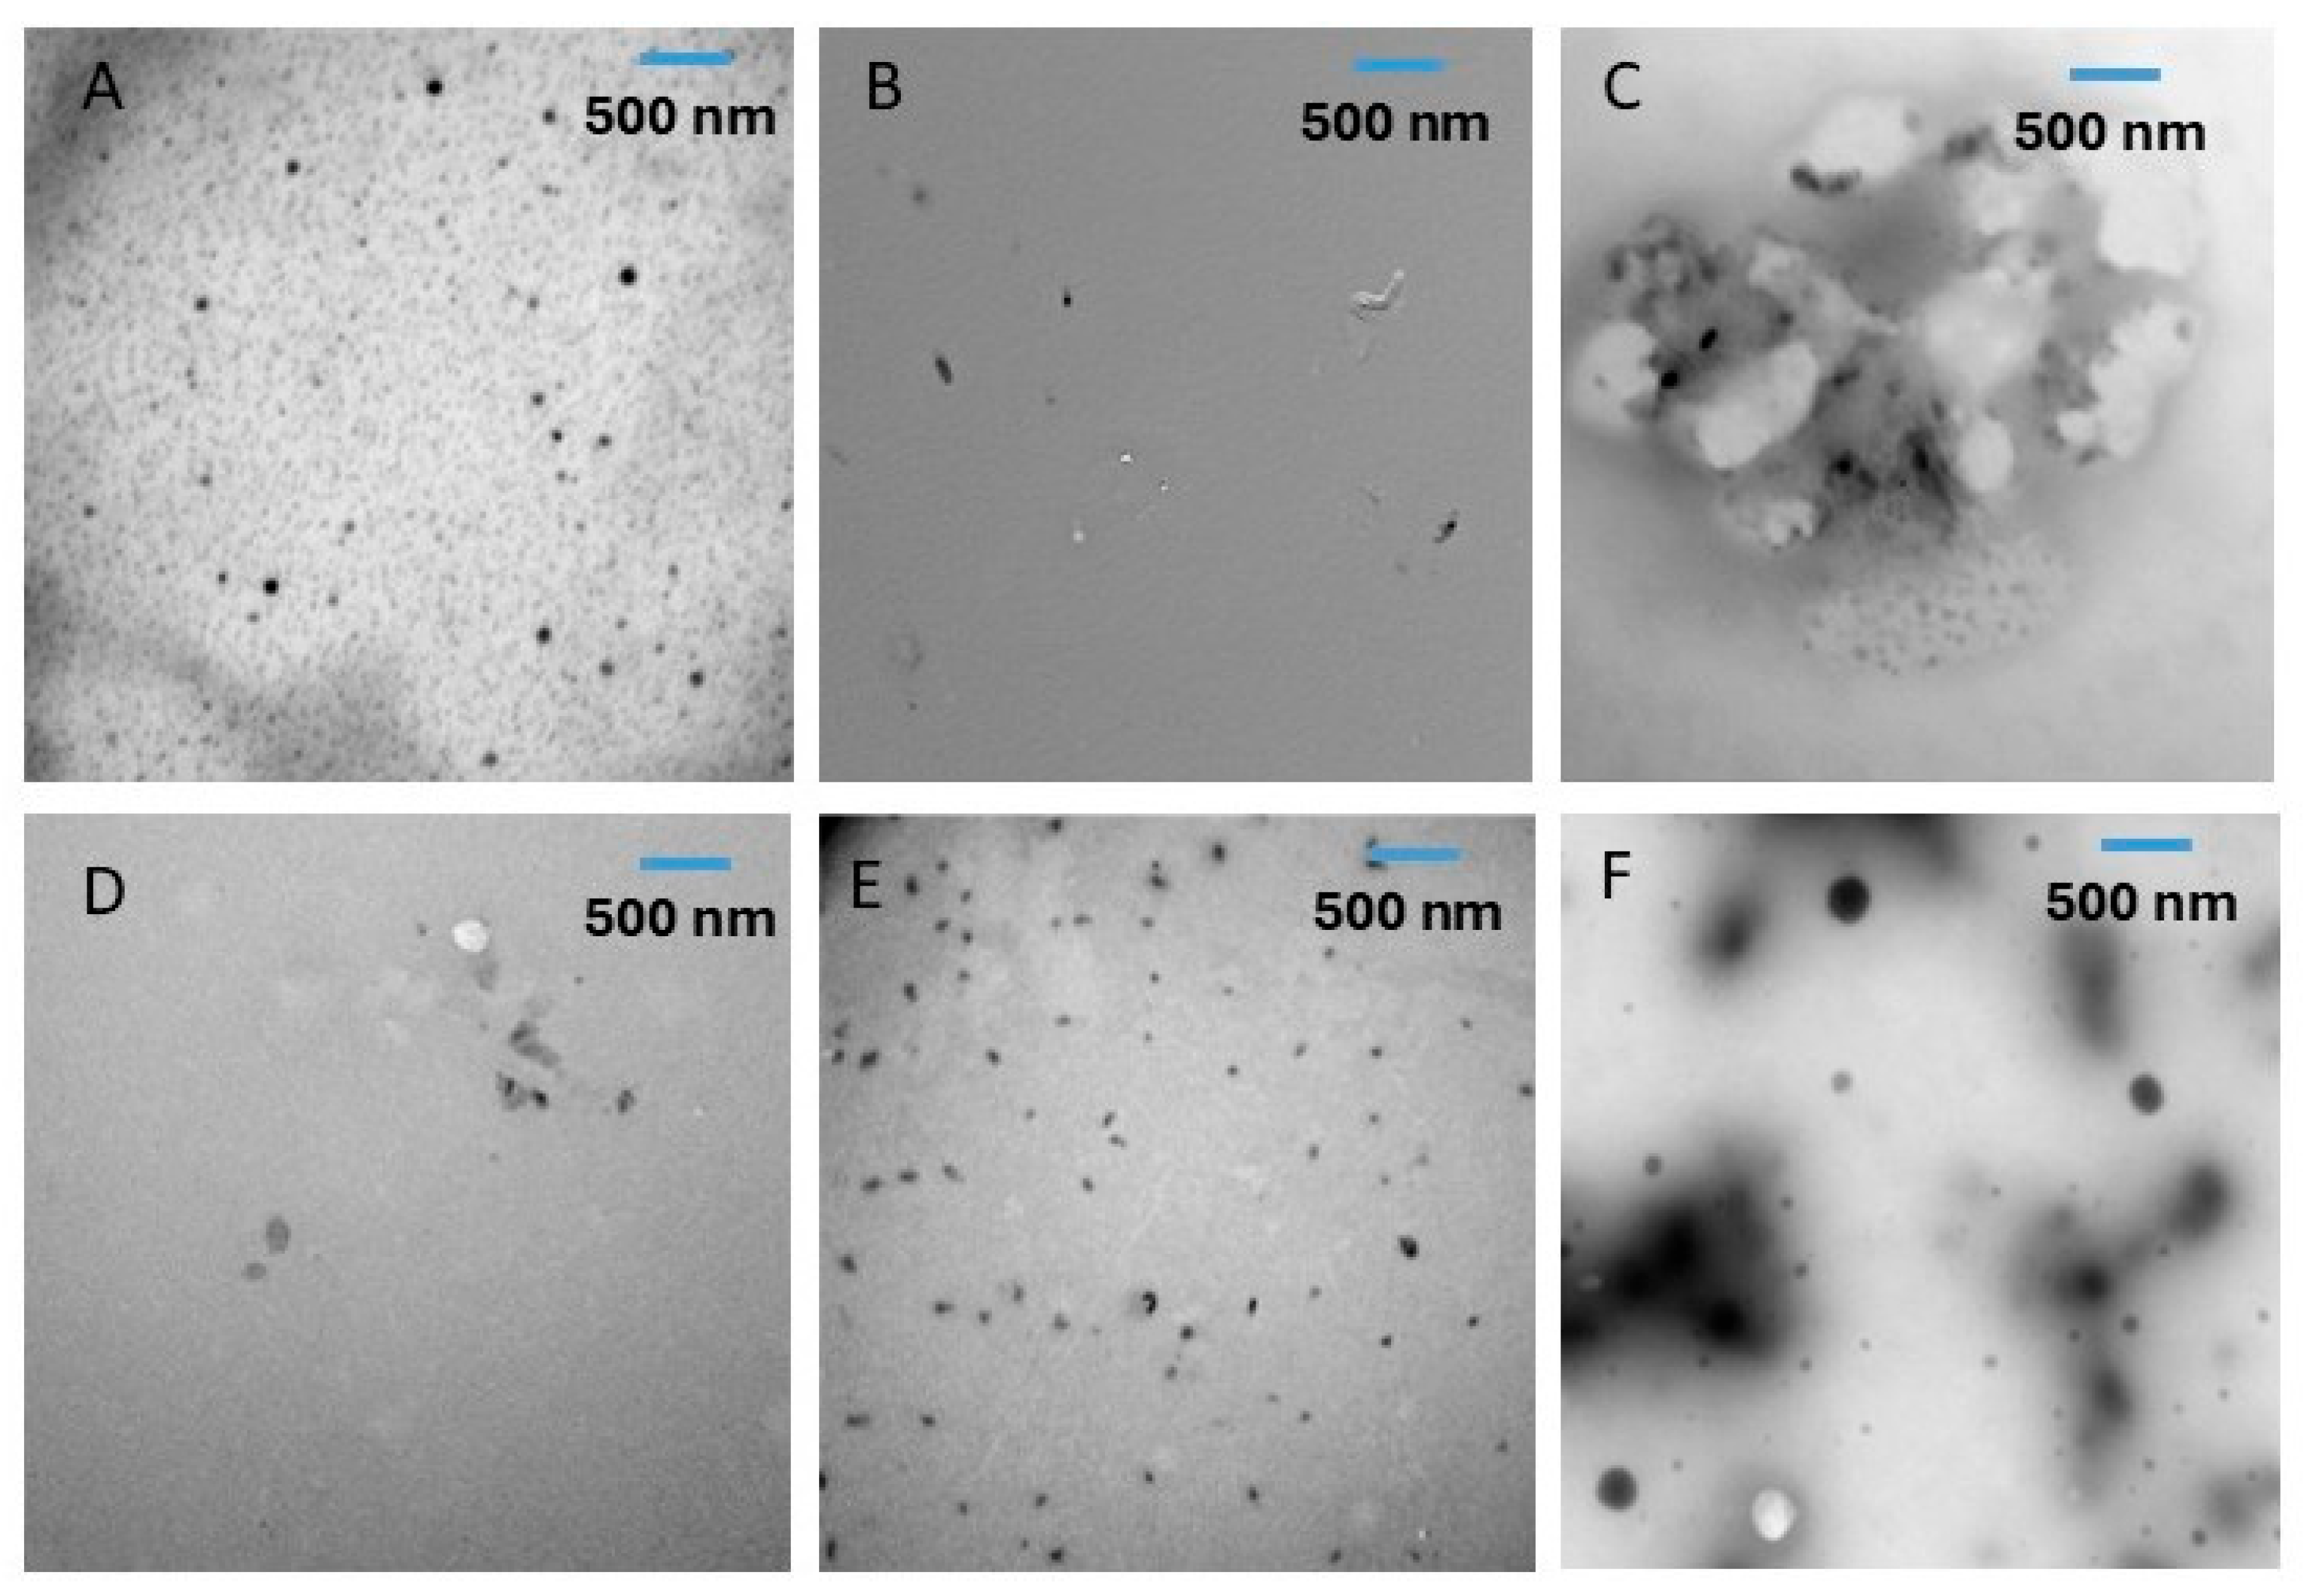
2.4. Transmission Electron Microscopy (TEM)

TEM microscopy was performed to identify the presence of nano size particles in the water-soaked and ultrasonic-water-treated fractions (Figure 3 and Figure 4). The ultrasonic-water treatment decreased the particle sizes of all fractionated residues and supernatants. Similarly, Mostafa et al. [24] observed that ultrasonic-water treatment decreased the particle size to the nano-level of acid-hydrolyzed whole date pit powder, as measured by Zetasizer. However, they did not visualize the nano-size particles by TEM or AFM.

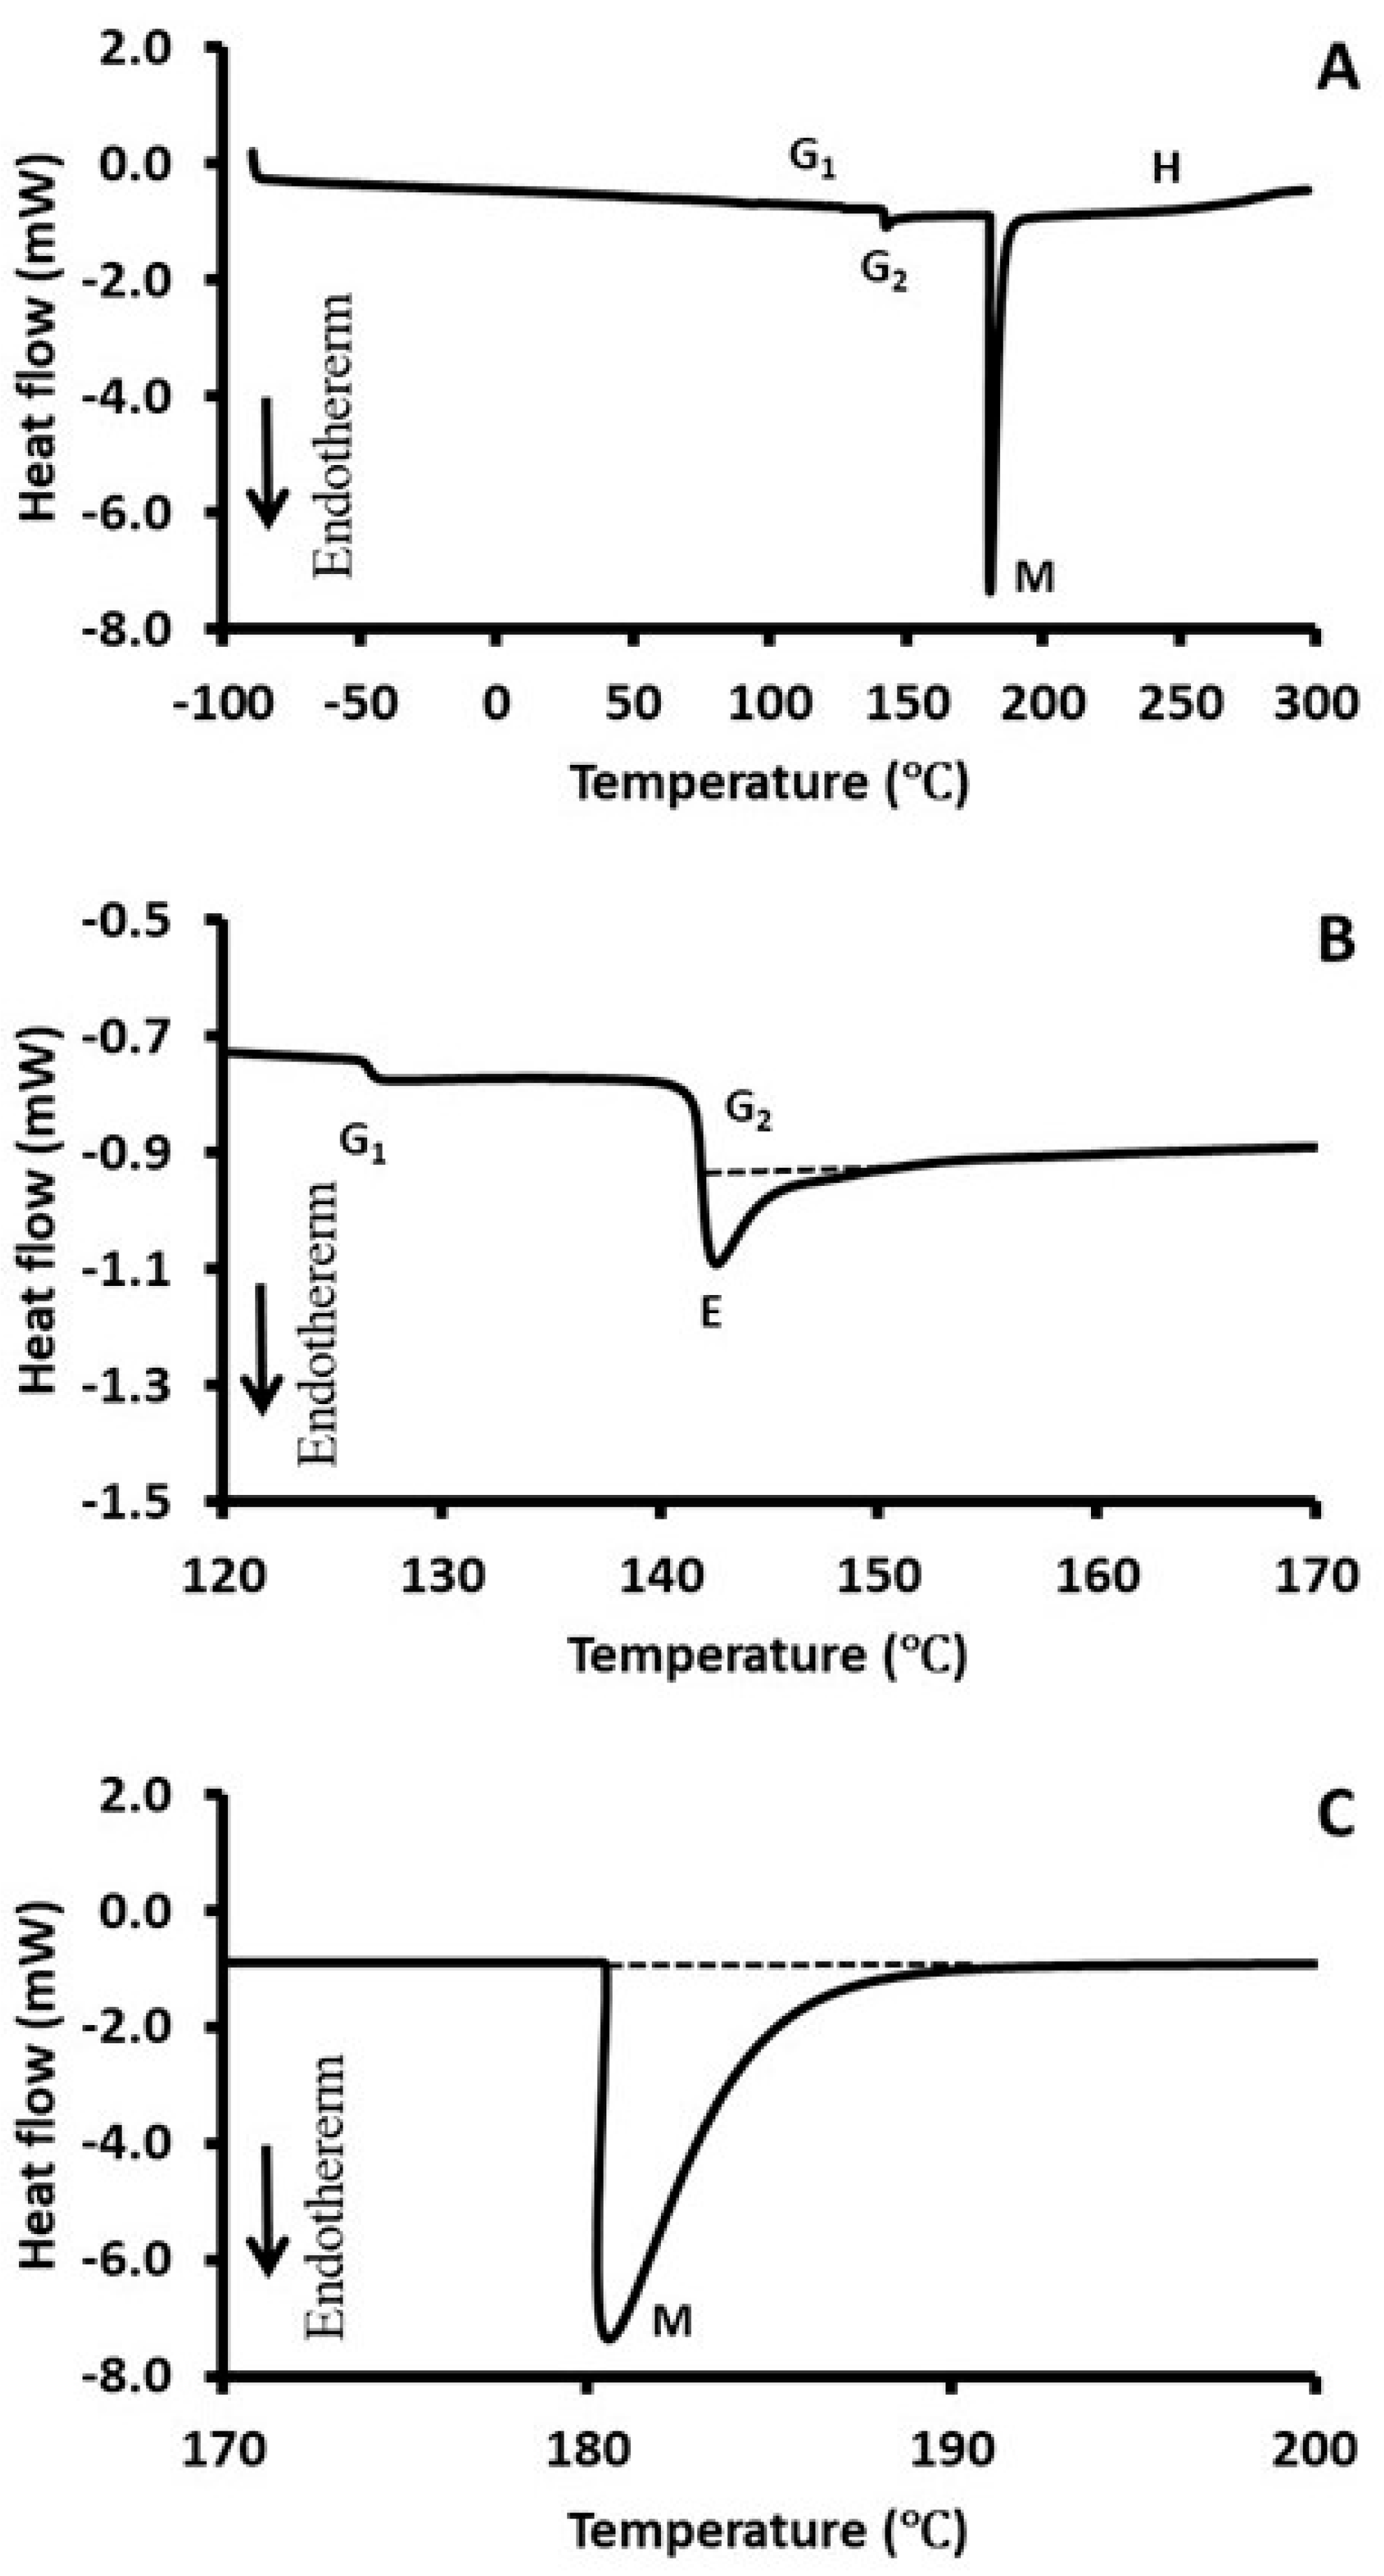
2.5. Differential Scanning Calorimetry (DSC)

Figure 5 shows a typical DSC thermogram of the selected fraction (i.e., TS1). It shows two shifts as glass transitions (i.e., G1 and G2) and one endothermic peak as solids melting (i.e., M). There was an structural building (i.e., H) after solids melting (i.e., M). Glass transition 2 shows an endothermic peak (i.e., E) after the glass transition is evident. In the case of date pits, an endothermic peak was evident after the glass transition [2,19]. Table 3 shows the characteristics of the first and second glass transitions. The first glass transition varied from 126 to 144 °C in the water-soaked and ultrasonic-water-treated fractions. The TR1 fraction did not show the first glass transition. This indicates that this TR1 fraction resulted in crystalline or higher order, with minimal amorphous components. The specific heat change at the first glass transition (∆Cp)1 increased in all ultrasonic-treated fractions (i.e., residues and supernatants). This shows clearly that ultrasonic treatment caused plasticization in the treated fractions. Regarding treated residues, (∆Cp)1 increased with the increase in extraction stages, while in the case of supernatants, it decreased. Therefore, treated residues contained more plasticized components, while the treated supernatant contained more ordered molecular fractions. On the other hand, water-soaked supernatants showed a similar decreasing tendency, with the increase in extraction stage. However, in the case of residues, no trend was observed.
A lower trend in the second glass transition temperature was observed in the case of ultrasonic treatment (p < 0.05). This could be due to the molecular defects caused by the ultrasound. With regard to residue, the second glass transition temperature decreased with the increase in extraction stage, whereas there was an increasing trend in the case of supernatant. Similar trends were also observed in the case of ultrasonic-water treatment. Treated residue fraction TR1 showed the lowest (∆Cp)2 (i.e., 64 J/kg °C), while TS2 and TS3 showed the highest change in the (∆Cp)2 (i.e., 1018 and 1109 J/kg °C, respectively). Therefore, TR1 was the most crystalline or ordered fraction, while OS1, TS2, and TS3 were the most plasticized fractions. Therefore, TR1 was stable in the long term, compared to the other factions; however, OS1, TS2, and TS3 were the least stable due to the high number of plasticized fractions. In relation to the applications, crystalline powder could be used in bio-composite as fillers, and crust formation in food products. It can also be used to stabilize ice cream and make particle gel-like colloidal structure in emulsions, frozen desserts, mayonnaise, gravies and sauce, and exhibits a fat-like mouth feel. These crystalline fractions of date pit powder can be used to eliminate contamination or carcinogens and provide a low degree of digestion [14]. These could be less affected by gut microorganisms and improve fecal bulking with smooth flow in the digestive tract [15]. However, amorphous or plasticized fractions could be good in the formation of soft crumb in bread and gel-like interlinked matrix in food products, such as biscuits, cakes and muffins [21]. Plasticized fractions could be easily fermented in the digestive system and could be formed into a viscous mass. Plasticized fibers are close to soluble fibers since these have the ability to form a viscous mass with an interlinked matrix, and could be beneficial in lowering the incidence of diabetes, heart diseases, high cholesterol, and obesity.
The solid melting temperature varied from 181 to 192 °C, whereas melting enthalpy varied from 50 to 174 J/g (Table 4). It was difficult to find any clear tendency on the solid melting peak as a function of particle size. Sakr et al. [18] observed a decreasing peak temperature with the decrease in particle size of Moringa leaf powder. The decreasing particle size caused the exposure of specific components (e.g., protein and polysaccharides) and this caused the instability of the powder. The lowest solid melting enthalpy (i.e., 50 J/g) was observed for TR1 and this fraction was completely different from the observed glass transition (Table 4). The highest enthalpy was observed in the case of OR1 (i.e., 174 J/g).

2.6. Fourier Transform Infrared (FTIR) Analysis

FTIR spectra of water-soaked (OR1, OR2, OR3 and OS1, OS2, and OS3) and ultrasonic-water-treated samples (OR1, OR2, OR3 and OS1, OS2, and OS3) are shown in Figure 6 and Figure 7. The degree of damage in the functional groups decreased with the increase in extraction stage (Figure 6A,B) of water-soaked fractionated residues. However, in the case of fractionated supernatants, the fraction from the first extraction stage (i.e., OS1) showed the lowest damage compared to the fractions from stages two and three (Figure 6C,D). Similar observations were seen in the ultrasonic-water-treated fractions (Figure 7). However, the degree of damage (i.e., absorption intensity) depended on the types of functional groups. In the case of Moringa leaf powder, FTIR spectroscopy showed similar functional groups; however, absorbance of typical peaks decreased with the increasing particle size. This indicated lower structural damage of the functional groups in the case of larger particles [18]. Similarly, Ke et al. [5] also observed that there was no change in the type of functional groups in dietary fibers; however, peak strengths were enhanced. In the case of defatted millet bran with high pressure and high temperature with ultrasonic treatment, there was no appearance of new peaks, indicating that there was no modification in the functional groups; however, ultrasonic-treated rice bran showed the highest absorption intensities [33]. The degree of structural damage of lignocellulosic fibers indicated how fibers could interact in food and the bio-composite matrix. High molecular damage (i.e., structural splitting) in the date pits’ fractionated fibers, as evidenced by FTIR analysis, indicated their ability to form a bonding or structural network when used in foods or bio-composite [21]. The fractions OS1, TR1, and TS1 showed the highest molecular damage as compared to other fractions (Figure 6 and Figure 7). Therefore, these fractions could form gel-like interlinked matrices, whereas less damaged fractions could be used to make colloidal matrices in food products.
In whole date pit powder (OWD), O-H stretching was observed within 3401–3455 cm−1, whereas in the case of TWD treatment, these were variations within 3371–3408 cm−1. These stretches could be observed from the O-H functional group from alcohol, water, and hydrates. These could also appear from amino compounds and ammonium compounds, however date pits did not contain these compounds [24]. These could be the stretching effects of the backbone of cellulose and hemicellulose [34,35]. In the case of untreated and treated date pits (i.e., hydrolyzed and hydrolyzed-ultrasound), these peaks were observed to be within 3316–3290 cm−1, which, in turn, was lower than observed in this study [24]. The OR1 and OS1 showed the highest intensities (i.e., 0.421 and 0.365 AU), while OR3 showed the lowest intensity (i.e., 0.107 AU), indicating minimal damage to the O-H stretching in OR3. Ultrasonic-water-treated samples showed higher intensities, except samples TS2 and TS3 (i.e., 0.773 and 0.570 AU). This indicated less damage to the O-H stretching by ultrasound. The peak of OS1 was sharp and split into three as compared to the other samples, which indicated a higher level of damage in the O-H stretching (Figure 6D).
The peaks within 2925–2935 cm−1 were due to the C-H stretching, while the peaks within 2861–2858 cm−1 were due to the H-C-H stretching vibration. These could be stretching in methyl and methylene group of cellulose [34,35]. C-H stretching existed in all ultrasonic-water-treated and water-soaked samples, whereas H-C-H was absent in the cases of OR2, OS1, OS3, TR2, TR3, and TS1. In all ultrasonic-water-treated samples, these intensities were higher, which indicated a higher damage to these functional groups by ultrasound. In the case of untreated date pits, two intense and sharp peaks at 2910 and 2924 cm−1 were observed, while acid-hydrolyzed and hydrolyzed-ultrasound-treated date pits showed one low peak and another wide peak [24].
Weak peaks were obtained between 1864–1871 cm−1 and 1833–1836 cm−1. All extracted fractions showed absorption bands within 1739–1749 cm−1. These are due to the carboxylic (i.e., C=O-OH) or carbonyl (C=O) groups. This is possibly due to ester linkage of carboxylic groups of the ferulic and p-coumaric acids of lignin and/or hemicelluloses or carbonyl group of acetyl and uronic ester groups within the structure of hemicelluloses. Similar peaks were also observed in the whole date pits and residue fibers of alkaline–salt–alkaline treatment. The absorption intensities varied from 0.032 to 0.601 cm−1 in the case of samples without ultrasound treatment, while it varied from 0.059 to 0.768 cm−1 in the case of ultrasound-treated samples.
The observed absorption peaks within 1625–1648 cm−1 were due to the C=C stretching of aromatic skeletal mode, and peaks within 1519–1543 cm−1 could be due to the aromatic C=C bending. The peak appearing around 1540 cm−1 can also be assigned to the aromatic C=C bending vibration [36]. These could be due to the stretching and bending of the aromatic ring of the lignin. However, peaks within 1442–1612 cm−1 could be due to the aromatic stretching of C=C from lignin [34,35].
The peaks 1446–1459 cm−1 were due to C-H bending. The peaks were observed 1377–1394 cm−1 due to the C-H bending of cellulose and hemicellulose. It was mentioned that it could be within 1371–1427 cm−1 in the case of lignocellulosic biomaterials [34,35]. Ultrasonic-water-treated fractionated date pits showed peaks within wave number 1322–1323 cm−1 in the case of TR2 and TS1, while other water-soaked fractionated samples did not show these peaks.
The peaks within 1244–1268 cm−1, 1102–1159 cm−1 and 1057–1070 cm−1 were due to the glycosidic C-O-C bond vibration. The glycosidic bond vibration was observed within cellulose and hemicellulose at peaks within 1000–1244 cm−1 [34,35]. In the case of millet bran, a strong absorption was observed at 1124 cm−1 due to glycosidic bond vibration and OH deformation vibration [33]. The sample without sonication (i.e., OS3) showed a peak at wave number 998 cm−1. Only samples without sonication (i.e., OR1, OS2, and OS3) and with sonication (i.e., TR1 and TR3) indicated peaks between 933 and 943 cm−1. Peaks within 869–877 cm−1 indicated the existence of mannosidic bonds. A similar peak at 897 cm−1 was observed in the case of millet bran [33] and tea polysaccharides [37].
The peaks observed between 810–824 cm−1 and 773–779 cm−1 were due to C-H bending. Samples with sonication (i.e., TR1, TS2 and TS3) indicated peaks within 712–725 cm−1, whereas these peaks were absent in the case of other samples. The sonicated sample (i.e., TR1, TR2, TR3, TS2, and TS3) showed peaks within 521–554 cm−1, while the samples without sonication did not show these peaks. In the case of selected functional groups, stretching and bending are identified. Stretching indicated a change in length of a bond, whereas bending indicated curving, i.e., change in bond angles.
In the literature, crystallinity from FTIR signals was defined considering the ratio of the bands at specific wave numbers based on models [14]. Nada et at. [38] defined FTIR crystallinity index as the ratio of 3340 cm−1/1337 cm−1 (i.e., ratio of O-H stretching and C-H bending). Considering the original extracted samples, the values of the ratios were 2.83, 2.04, 5.63, 1.79, 3.16, and 5.74 for OR1, OR2, OR3, OS1, OS2, OS3, respectively. This indicated that OS3 had the highest crystalline characteristic and OS1 had the the highest amorphous characteristic and OS1 provided similarity with the DSC crystallinity, as shown in Table 3 (i.e., lowest and highest ∆Cp changed at glass transition). However, the order of crystalline characteristics did not follow the same order as in Table 3. Considering the ultrasound extracted samples, the values of the ratios were 2.88, 1.75, 1.63, 2.40, 2.00, and 2.38 for TR1, TR2, TR3, TS1, TS2, and TS3, respectively. This indicated that TR1 had the highest crystalline characteristic and TR3 had the highest amorphous characteristic. This was similar to the highest DSC crystalline nature for TR1, but different in the lowest value for TS3, as shown in Table 3. Therefore, FTIR crystallinity did not exactly represent structural behavior as observed by DSC. This could be due to the possibility of additional relaxation at the glass transition in addition to the ∆Cp change due to the fraction of crystalline component in the sample [39].

3. Materials and Methods

3.1. Raw Materials

Dates of the Medjool variety (i.e., tamr stage) (5 kg) were obtained from a local market in Melbourne (Victoria, Australia) for this experiment. Flesh and seeds were separated from whole date pits. Date pits were dried in a fume hood for a week and then reduced to powder with an 800 g grinder (Laobenhang, model 400Y, Yongkang, Zhejiang, China). The flesh and seed samples were then stored at −20 °C until further analysis.

3.2. Extraction of Different Fractions

The whole date pit powder was soaked in distilled water at a ratio of 1:10 and dried at 60 °C for 24 h (OWD). Different fractions were extracted using absolute ethanol. Three main stages of extraction protocol are shown in Figure 8 and extracted powders are marked as residues (OR1: first residue, OR2: second residue, OR3: third residue) and supernatants (OS1: first supernatant, OS2: second supernatant, OS3: third supernatant). The extraction process involved soaking at 25 °C for 24 h with continuous stirring. The treated sample was centrifuged using 8000 rpm at 4 °C for 15 min (Hettich Refrigerated Centrifuge ROTINA380R Tuttlingen Baden Württemberg, Germany). Supernatant and residue were pre-frozen at −80 °C for 12 h and then freeze-dried at −60 °C for 72 h (Labconco Benchtop Freeze Dryer, Kansas City, MO, USA).
Another batch of date pit powder was soaked in distilled water with a ratio of 1:10 (i.e., 4 g sample in 40 mL water in a 50 mL tube). The mixture in the beaker was treated by sonication for 5 min at 25 °C using an ultrasonic probe (Digital Sonifier 450, Branson Ultrasonics, Brookfield, CT, USA) operating at 20 kHz and 40% amplitude (nominal power: 400 W) (TWD). The sonication probe was directly dipped into the mixture and then the sonication process was turned on. The treated powder was dried similarly to the one mentioned earlier. Different fractions were extracted in ethanol as mentioned earlier and these were marked as residues (TR1: first residue, TR2: second residue, TR3: third residue) and supernatants (TS1: first supernatant, TS2: second supernatant, TS3: third supernatant). All fractions were equilibrated at an atmospheric relative humidity of 11.1% (i.e., water activity: 0.111) and then had their properties measured.

3.3. Measurement of Particle Size Distribution

A vibratory sieve shaker (Retsch GmbH, Haan, Germany) was used to determine the particle size distribution of the untreated and sonicated extracted date pit powders. Sieves with different sizes (i.e., 1000, 500, 250, 125, 90 and 63 µm, respectively) were assembled one above another according to their size. Sieves were tightly fixed on the shaker and the shaker was set for 10 min at 50 rpm. Sample powder (10 g) was placed in the middle of the first sieve (i.e., 1000 μm) and then run in the shaker. The fractions were weighed and used to calculate the mass of particles in each sieve. Mass average particle sizes were calculated.

3.4. Morphological Analysis by Scanning Electron Microscopy (SEM)

The morphological structure of the treated and untreated date pit fractions was scanned using Scanning Electron Microscopy (SEM) (FESEM: JEOL JSM-5600 LV, Tokyo, Japan) operated at 20 kV with a working distance of 20 mm. Samples were prepared according to the method used by Suresh et al. [40]. A sample was placed on the top of an SEM stub using double-sided carbon adhesive tape and then coated with a thin layer of gold (i.e., 10–20 nm) to prevent charging during measurement and increase the conductivity of a sample using Jeol Smart Coater DIL-29030SCTR, Tokyo, Japan. Stapes were exposed to a 0.2 Torr vacuum pressure using a sputter coater (SPI-module, Santa Clara, CA, USA). Digital micrographs were captured at various magnifications and saved on a computer.

3.5. Morphological Analysis by Transmission Electron Microscopy (TEM)

Morphological structures of the nano-size present in the extracted date pit powder were measured using Transmission Electron Microscope (TEM) (JEOL, JEM-5600 LV, Tokyo, Japan) operated at 80 kV. Samples were soaked in ethanol and a drop from the supernatant was placed on the TEM 300-mesh formvar carbon-coated grids. Digital micrographs were recorded at different magnifications and saved on a computer [41].

3.6. Thermal Analysis by Differential Scanning Calorimetry (DSC)

The thermal behavior of different extracted samples (i.e., fibers) was analyzed by Differential Scanning Calorimetry (DSC) (DSC Q20, TA Instrument, New Castle, DE, USA) [29]. The sample (i.e., approximately 3–5 mg) was placed in a Tzero hermetic DSC aluminum pan and sealed with a lid. A blank empty pan was considered as reference. Nitrogen gas flow (i.e., 50 mL min−1) was used during DSC measurement. Samples were run considering the protocol used by Al-Harrasi et.al. [42]. A shift in the heat flow curve was referred to as glass transition; however, the endothermic peaks represented oil melting or solids melting. Data were analyzed by Universal Analysis 2000 DSC Q20 program (v5.5.3).

3.7. Functional Group Measurement by Fourier Transform Infrared (FTIR) Analysis

Extracted date pit powder and potassium bromide were mixed thoroughly in a mortar–pestle at a ratio of 1:100 (i.e., 0.02 g sample and 2 g KBr). A hydraulic press (Atlas Manual Hydraulic Press, GS25011, Specac, London, UK) was used to prepare a tablet of 13 mm diameter by compressing the mixture under 10 tons (i.e., 739 MPa) of hydraulic pressure. Samples were analyzed via Bruker FTIR (Bruker, Ettlingen, Germany) spectrometer [20]. The dry condition of the instrument was maintained by using nitrogen gas flow. A background spectrum was verified at 20 °C before running the experimental sample. Fifteen replicates were measured in triplicated reading for 5 tablets. FTIR data were recorded from 4000 to 400 cm−1 wave number with 32 scans at a resolution of 4 cm−1. Collected data was presented as means ± standard deviation (SD).

3.8. Statistical Analysis

Triplicate analyses were applied for each extracted date pit fraction. The data were presented as mean ± standard deviation (SD). One-way analysis of variance (ANOVA) was conducted to test the significance of difference between samples, while Tukey tests were performed to determine significant differences between means (IBM SPSS Statistics 23, v23.0.0.0). The significance was considered when p < 0.05.

4. Conclusions

Twelve types of micronized date pit powder were developed by ultrasonic-treated and water-soaked date pits followed by three-stage alcoholic sedimentation. The use of ultrasound treatment with alcoholic sedimentation produced date pit powder fractions with different particle sizes possessing different characteristics, i.e., amorphous, crystalline, and degrees of molecular damage. The average particle size varied from 18 to 164 µm and nanoparticles were also observed in all fractions. However, the mass fraction of nanoparticles was not measured. In the residues and supernatants from control (i.e., water-soaked) and ultrasonic-treated, the average particle size increased with the increase in the stages of alcoholic sedimentation. The developed micronized date pit powder possessed varying degrees of amorphous or crystalline (i.e., higher order) characteristics with varied molecular damage. This study indicated that in addition to the particle size, types of fractionated particles also affected the molecular and structural characteristics. In the future, it is important to apply date pit powder in food products to determine its improvement in functionality.

Author Contributions

Conceptualization, K.A.-H., N.A.-H., M.S.R.; methodology, K.A.-H., N.A.-H., M.A.A.-K., L.S., H.A.R.S., M.A., M.S.R.; software, K.A.-H., M.A.A.-K.; validation, M.A.A.-K., H.A.R.S., M.S.R.; formal analysis, K.A.-H., M.A.A.-K., L.S.; investigation, K.A.-H., L.S.; resources, M.A.A.-K., H.A.R.S., N.A.-H., M.S.R.; data curation, K.A.-H., N.A.-H., H.A.R.S., M.S.R.; writing—original draft preparation, K.A.-H., L.S., M.S.R.; writing—review and editing, N.A.-H., M.A.A.-K., H.A.R.S., M.A., M.S.R.; visualization, M.A.A.-K.; supervision, H.A.R.S., M.S.R.; project administration, N.A.-H., M.S.R.; funding acquisition, N.A.-H., M.S.R. All authors have read and agreed to the published version of the manuscript.

Funding

This research was funded by projects from The Research Council (Project No RC/RG-AGR/FOOD/23/01), and His Majesty Trust Funds (Project No SR/AGR/Food/23/01 and SR/AGR/Food/19/01). APC was funded from Sultan Qaboos Univeristy.

Institutional Review Board Statement

Not applicable.

Informed Consent Statement

Not applicable.

Data Availability Statement

The additional data supporting the manuscript are available from the corresponding author upon request.

Acknowledgments

All authors would like to acknowledge the support of Sultan Qaboos University for this project.

Conflicts of Interest

The authors declare no conflicts of interest.

References

  1. Abushal, S.A.; Elhendy, H.A.; Abd, E.L.; Maged, E.M.; Darwish, A.M. Impact of ground Ajwa (Phoenix dactylifera L.) seeds fortification on physical and nutritional properties of functional cookies and chocolate sauce. Cereal Chem. 2021, 98, 958–967. [Google Scholar] [CrossRef]
  2. Al-Khalili, M.; Al-Habsi, N.; Rahman, M.S. Applications of date pits in foods to enhance their functionality and quality: A review. Front. Sustain. Food Syst. 2023, 6, 1101043. [Google Scholar] [CrossRef]
  3. Salem, E.M.; Almohmadi, N.; Al-Khataby, N.F. Utilization of Date seeds powder as antioxidant activities components in preparation of some baking products. J. Food Dairy Sci. 2011, 2, 399–409. [Google Scholar] [CrossRef]
  4. Zamzam, S.; Nafiea, E.R.; Al-Hadhromi, H.A.; Ali, F.A. Utilization of date-pits in the production of functional chocolates. In Proceedings of the Qatar Foundation Annual Research Conference Proceedings, Doha, Qatar, 19–20 March 2018. [Google Scholar]
  5. Ke, J.; Wang, X.; Gao, X.; Zhou, Y.; Wei, D.; Ma, Y.; Li, C.; Liu, Y.; Chen, Z. Ball milling improves physicochemical, functionality, and emulsification characteristics of insoluble dietary fiber from polygonatum sibiricum. Foods 2024, 13, 2323. [Google Scholar] [CrossRef]
  6. Chitrakar, B.; Zhang, M.; Zhang, X.; Devahastin, S. Bioactive dietary Fiber powder from asparagus leaf by-product: Effect of nlow-temperature ball milling on physico-chemical, functional and microstructural characteristics. Powder Technol. 2020, 366, 275–282. [Google Scholar] [CrossRef]
  7. Raghavendra, S.N.; Ramachandra Swamy, S.R.; Rastogi, N.K.; Raghavarao, K.S.M.S.; Kumar, S.; Tharanathan, R.N. Grinding characteristics and hydration properties of coconut residue: A source of dietary fibre. J. Food Eng. 2006, 72, 281–286. [Google Scholar] [CrossRef]
  8. Al-Khalili, M.; Al-Habsi, N.; Al-Alawi, A.; Al-Subhi, L.; Myint, M.T.Z.; Al-Abri, M.; Waly, M.I.; Al-Harthi, S.; Al-Mamun, A.; Rahman, M.S. Structural characteristics of alkaline treated fibers from date-pits: Residual and precipitated fibers at different pH. Bioact. Carbohydr. Diet. Fibre 2021, 25, 100251. [Google Scholar] [CrossRef]
  9. Al-Khalili, M.; Al-Habsi, N.; Al-Kindi, M.; Rahman, M.S. Characteristics of crystalline and amorphous fractions of date-pits as treated by alcohol-water pressure cooking. Bioact. Carbohydr. Diet. Fibre 2022, 28, 100331. [Google Scholar] [CrossRef]
  10. Campagnol, P.C.B.; dos Santos, B.A.; Wagner, R.; Terra, N.N.; Pollonio, M.A.R. Amorphous cellulose gel as a fat substitute in fermented sausages. Meat Sci. 2012, 90, 36–42. [Google Scholar] [CrossRef]
  11. El-Salhy, M.; Ystad, S.O.; Mazzawi, T.; Gundersen, D. Dietary fiber in irritable bowel syndrome. Int. J. Mol. Med. 2017, 40, 607–613. [Google Scholar] [CrossRef]
  12. Smith, C.E.; Tucker, K.L. Health benefits of cereal fibre: A review of clinical trials. Nutr. Res. Rev. 2011, 24, 118–131. [Google Scholar] [CrossRef] [PubMed]
  13. Ferguson, L.; Roberton, A.; Watson, M.; Triggs, C.; Harris, P. The effects of soluble-fibre polysaccharide on the adsorption of carcinogens to insoluble dietary. Chem.-Biol. Interact. 1995, 95, 245–255. [Google Scholar] [CrossRef] [PubMed]
  14. Kruer-Zerhusen, N.; Cantero-Tubilla, B.; Wilson, D.B. Characterization of cellulose crystallinity after enzymatic treatment using Fourier transform infrared spectroscopy (FTIR). Cellulose 2018, 25, 37–48. [Google Scholar] [CrossRef]
  15. Nsor-Atindana, J.; Chen, M.; Goff, H.D.; Zhong, F.; Sharif, H.R.; Li, Y. Functionality and nutritional aspects of microcrystalline cellulose in food. Carbohydr. Polym. 2017, 172, 159–174. [Google Scholar] [CrossRef] [PubMed]
  16. De Maesschalck, C.; Eeckhaut, V.; Maertens, L.; De Lange, L.; Marchal, L.; Daube, G.; Dewulf, J.; Haesebrouck, F.; Ducatelle, R.; Taminau, B.; et al. Amorphous cellulose feed supplement alters the broiler caecal microbiome. Poult. Sci. 2019, 98, 3811–3817. [Google Scholar] [CrossRef]
  17. Hu, R.; Li, S.; Diao, H.; Huang, C.; Yan, J.; Wei, X.; Zhou, M.; He, P.; Wang, T.; Fu, H.; et al. The interaction between dietary fiber and gut microbiota, and its effect on pig intestinal health. Front. Immunol. 2023, 14, 1095740. [Google Scholar] [CrossRef]
  18. Sakr, H.; Ammar, A.; Zaki, H.; Salama, M.A.; Ali, M. Impact of ball milling on physicochemical structural functional properties of Moringa oleifera, L. leaf powders. J. Food Meas. Charact. 2024, 18, 320–330. [Google Scholar] [CrossRef]
  19. Al-Mawali, M.; Al-Habsi, N.; Rahman, M.S. Thermal characteristics and proton mobility of date-pits and their alkaline treated fibers. Food Eng. Rev. 2020, 13, 236–246. [Google Scholar] [CrossRef]
  20. Nabili, A.; Fattoum, A.; Passas, R.; Elaloui, E. Extraction and characterization of cellulose from date palm seeds (Phoenix dactylifera L.). Cellul. Chem. Technol. 2016, 50, 1015–1023. [Google Scholar]
  21. Al-Mamari, A.; Al-Habsi, N.; Al-Khalili, M.; Rahman, M.S. Extraction and characterization of residue fibers from defatted date-pits after alkaline-acid digestion: Effects of different pretreatments. J. Therm. Anal. Calorim. 2022, 147, 9405–9416. [Google Scholar] [CrossRef]
  22. Yang, G.; Lin, W.; Lai, H.; Tong, J.; Lei, J.; Yuan, M.; Zhang, Y.; Cui, C. Understanding the relationship between particle size and ultrasonic treatment during the synthesis of metal nanoparticles. Ultrason. Sonochemistry 2021, 73, 105497. [Google Scholar] [CrossRef] [PubMed]
  23. Awad, T.S.; Moharram, H.A.; Shaltout, O.E.; Asker, D.; Youssef, M.M. Applications of ultrasound in analysis, processing and quality control of food: A review. Food Res. Int. 2012, 48, 410–427. [Google Scholar] [CrossRef]
  24. Mostafa, H.; Airouyuwa, J.O.; Maqsood, S. A novel strategy for producing nano-particles from date seeds and enhancing their phenolic content and antioxidant properties using ultrasound-assisted extraction: A multivariate based optimization study. Ultrason. Sonochemistry 2022, 87, 106017. [Google Scholar] [CrossRef]
  25. Vilkhu, K.; Mawson, R.; Simons, L.; Bates, D. Applications and opportunities for ultrasound assisted extraction in the food industry- A review. Innov. Food Sci. Emerg. Technol. 2008, 9, 161–169. [Google Scholar] [CrossRef]
  26. Aliyu, M.; Hepher, M.J. Effects of ultrasound energy on degradation of cellulose material. Ultrason. Sonochemistry 2000, 7, 265–268. [Google Scholar] [CrossRef]
  27. Velasco, M.I.; Correa, E.; Paris, F. Interaction between fibres in the transverse damage in composites. Eng. Fract. Mech. 2020, 239, 107273. [Google Scholar] [CrossRef]
  28. Lancefield, C.S.; Panovic, I.; Deuss, P.J.; Barta, K.; Westwood, N.J. Pre-treatment of lignocellulosic feedstocks using biorenewable alcohols: Towards complete biomass valorisation. Green Chem. 2017, 19, 202–214. [Google Scholar] [CrossRef]
  29. Zijlstra, D.S.; Lahive, C.W.; Analbers, C.A.; Figueireedo, M.B.; Wang, Z.; Lancefield, C.S.; Deuss, P.J. Mild organosolv lignin extraction with alcohols: The importance of benzylic alkoxylation. ACS Sustain. Chem. Eng. 2020, 8, 5119–5131. [Google Scholar] [CrossRef]
  30. Jambrak, A.R.; Mason, T.J.; Lelas, V.; Paniwnyk, L.; Herceg, Z. Effect of ultrasound treatment on particle size and molecular weight of whey proteins. J. Food Eng. 2014, 121, 15–23. [Google Scholar] [CrossRef]
  31. Bussemaker, M.J.; Xu, F.; Zhang, D. Manipulation of ultrasonic effects on lignocellulose by varying the frequency, particle size, loading and stirring. Bioresour. Technol. 2013, 148, 15–23. [Google Scholar] [CrossRef]
  32. Che, L.M.; Li, D.; Wang, L.J.; Chen, X.D.; Mao, Z.H. Micronization and hydrophobic modification of cassava starch. Int. J. Food Prop. 2007, 10, 527–536. [Google Scholar] [CrossRef]
  33. Wei, C.; Ge, Y.; Liu, D.; Zhao, S.; Wei, M.; Jiliu, J.; Hu, X.; Quan, Z.; Wu, Y.; Su, Y.; et al. Effects of high-temperature, high-pressure, and ultrasonic treatment on the physicochemical properties and structure of soluble dietary fibers of millet bran. Front. Nutr. 2022, 8, 820715. [Google Scholar] [CrossRef] [PubMed]
  34. Salim, R.M.; Asik, J.; Sarjadi, M.S. Chemical functional groups of extractives, cellulose and lignin extracted from native Leucaena leucocephala bark. Wood Sci. Technol. 2021, 55, 295–313. [Google Scholar] [CrossRef]
  35. Ghodake, V.; Khare, R.; Mhaske, S. An insight into formation and characterization of nanocellulose prepared from industrial cellulosic wastes. J. Polym. Environ. 2021, 30, 319–332. [Google Scholar] [CrossRef]
  36. Larkin, P. IR and Raman spectra-structure correlations: Characteristic group frequencies. In Infrared and Raman Spectroscopy; Elsevier Science: Amsterdam, The Netherlands, 2011. [Google Scholar]
  37. Li, W.W.; Wang, C.; Yuan, G.Q. Physicochemical characterisation and α-amylase inhibitory activity of tea polysaccharides under simulated salivary, gastric and intestinal conditions. Int. J. Food Sci. Technol. 2018, 53, 423–429. [Google Scholar] [CrossRef]
  38. Nada, A.; Kamel, S.; El-Sahkhawy, M. Thermal behavior and infrared spectroscopy of cellulose carbamates. Polym. Degrad. Stab. 2000, 70, 347–355. [Google Scholar] [CrossRef]
  39. Al-Areimi, M.; Al-Habsi, N.; Al-Jufaili, S.M.; Rahman, M.S. State Diagram of Freeze-dried Sardines (Sardinella longiceps, Valenciennes). J. Food Eng. 2024, 379, 112107. [Google Scholar] [CrossRef]
  40. Suresh, S.; Al-Habsi, N.; Guizani, N.; Rahman, M.S. Thermal characteristics and state diagram of freeze-dried broccoli: Freezing curve, maximal-freeze-concentration condition, glass line and solids-melting. Thermochimica Acta 2017, 655, 129–136. [Google Scholar] [CrossRef]
  41. Mittal, V.; Chaudhry, A.U.; Matsko, N.B. “True” biocomposites with biopolyesters and date seed powder: Mechanical, thermal, and degradation properties. J. Appl. Polym. Sci. 2014, 131, 40816. [Google Scholar] [CrossRef]
  42. Al-Harrasi, K.; Al-Habsi, N.; Myint, M.T.Z.; Rahman, M.S. Molecular and structural characterization of micronized lignocellulose from date-pits by alcoholic fractionations. Carbohydr. Polymer Technol. Applications. 2024, 7, 100451. [Google Scholar] [CrossRef]
Figure 1. Scanning Electron Micrograph (SEM) of water-soaked (OWD) date pits without ultrasonic treatment. (A) (OR1): first residue, (B) (OR2): second residue, (C) (OR3): third residue, (D) (OS1): first supernatant, (E) (OS2): second supernatant, (F) (OS3): third supernatant.
Ijms 26 06644 g001
Figure 2. Scanning Electron Micrograph (SEM) of ultrasonic-water-treated (TWD). (A) (TR1): first residue, (B) (TR2): second residue, (C) (TR3): third residue, (D) (TS1): first supernatant, (E) (TS2): second supernatant, (F) (TS3): third supernatant.
Ijms 26 06644 g002
Figure 3. Transmission Electron Microscopy (TEM) of water-soaked (OWD) date pits without ultrasonic treatment. (A) (OR1): first residue, (B) (OR2): second residue, (C) (OR3): third residue, (D) (OS1): first supernatant, (E) (OS2): second supernatant, (F) (OS3): third supernatant.
Ijms 26 06644 g003
Figure 4. Transmission Electron Microscopy (TEM) of ultrasonic-water treatment (TWD). (A) (TR1): first residue, (B) (TR2): second residue, (C) (TR3): third residue, (D) (TS1): first supernatant, (E) (TS2): second supernatant, (F) (TS3): third supernatant.
Ijms 26 06644 g004
Figure 5. A typical heat DSC flow curve of extracted date pits with ultrasonic-water treatment (i.e., TS1). (A): Complete thermogram, (B): rescaled to clearly visualize first and second glass transitions, (C): rescaled to show solids melting.
Ijms 26 06644 g005
Figure 6. FTIR spectra of selected date pit fractions with water soaking without ultrasonic treatment followed by alcoholic sedimentation of date pits (OWD). (A): Residue with 2000 to 200 cm−1, (B): residue within 4000 to 2000 cm−1, (C): supernatant with 2000 to 400 cm−1, (D): supernatant with 4000 to 2000 cm−1 (1: O-H stretching, 2: C-H stretching, 3: H-C-H stretching, 4: C=O-OH or C=O, 5 and 6: C=C, 7, 8 and 9: C-H bending, 10, 11 and 12: C-O-C vibration, 13 and 14: C-H bending, 15: C-OH and C-C stretching).
Ijms 26 06644 g006
Figure 7. FTIR spectra of selected date pit fractions with ultrasonic-water treatment followed by alcoholic sedimentation of date pits (TWD). (A): Residue with 2000 to 200 cm−1, (B): residue within 4000 to 2000 cm−1, (C): supernatant with 2000 to 400 cm−1, (D): supernatant with 4000 to 2000 cm−1 (1: O-H stretching, 2: C-H stretching, 3: H-C-H stretching, 4: C=O-OH or C=O, 5 and 6: C=C, 7 and 8: C-H bending, 10, 11 and 12: C-O-C vibration, 13 and 14: C-H bending, 15: C-OH and C-C stretching).
Ijms 26 06644 g007
Figure 8. Flow diagram of the water-soaked or ultrasonic-water-treated whole date pit powder followed by alcoholic sedimentation: water-soaked (OWD), OR1: first residue, OR2: second residue, OR3: third residue, OS1: first supernatant, OS2: second supernatant, OS3: third supernatant. Ultrasonic-water-treated whole date pit powder followed by alcoholic sedimentation (TWD). TR1: first residue, TR2: second residue, TR3: third residue, TS1: first supernatant, TS2: second supernatant, TS3: third supernatant (photos included for treated date pits).
Ijms 26 06644 g008
Table 1. Particle size in the range of macro- and nano-level in the alcoholic fractionated whole and ultrasound-treated date pits.
Particles Size in the Micro-Range (µm)Particles Size in the Nano-Range (nm)
FiberFractionSize RangeAverage SizeSize RangeAverage Size
OWDOR115–13789 ± 27 c44–9873 ± 15 b
OR221–35498 ± 49 c60–13498 ± 20 b
OR338–494164 ± 106 b71–1335235 ± 114 c
OS15–5722 ± 19 a48–7666 ± 8 b
OS27–12259 ± 20 a55–8673 ± 11 b
OS328–21963 ± 25 a78–196139 ± 52 a
p < 0.05p < 0.05p < 0.05
TWDTR18–7939 ± 20 c13–8542 ± 14 a
TR225–9544 ± 15 c25–8052 ± 9 d
TR334–15065 ± 25 b194–23491 ± 45 c
TS16–5418 ± 9 a13–4127 ± 7 a
TS211–7838 ± 19 c15–5730 ± 10 a
TS314–14344 ± 34 c14–11949 ± 28 d
p < 0.05p < 0.05p < 0.05
Note: OWD: water-soaked, TWD: ultrasonic-water-treated. Data are presented as mean ± SD. Water-soaked (Control): OR1: first residue after centrifuge, OR2: second residue, OR3: third residue, OS1: first supernatant after centrifuge, OS2: second supernatant, OS3: third supernatant. Ultrasonic-water-treated (TWD): TR1: first residue after centrifuge, TR2: second residue, TR3: third residue, TS1: first supernatant after centrifuge, TS2: second supernatant, TS3: third supernatant. Different letters in a column indicate significant difference (p < 0.05).
Table 2. Average particle size of the water-soaked and ultrasonic-alcoholic-treated whole date pits.
SampleFiberMass (%)
OWD≥25085.58
≥12513.94
≥630.48
TWD≥25084.95
≥12513.61
≥631.44
Note: Data are presented as mean%. OWD: water-soaked whole date pits, TWD: ultrasonic-water-treated whole date pits.
Table 3. First and second glass transitions of different water-soaked and ultrasonic-water-treated samples followed by alcoholic fractionation by sedimentation.
First Glass TransitionSecond Glass Transition
SampleFractionTgi (°C)Tgp (°C)Tge (°C)(∆Cp)1 (J/kg °C)Tgi (°C)Tgp (°C)Tge (°C)(∆Cp)2 J/kg (°C)
OWDOR1144 ± 9 f144 ± 9 f144 ± 9 f105 ± 7 b158 ± 5 d158 ± 5 d158 ± 5 d636 ± 8 c
OR2129 ± 1 bc129 ± 1 bc129 ± 1 bc232 ± 1 e146 ± 3 abc146 ± 3 abc146 ± 3 abc696 ± 3 d
OR3133 ± 1 cd133 ± 1 cd134 ± 1 cd205 ± 8 e147 ± 2 abc147 ± 2 abc147 ± 2 abc705 ± 1 e
OS1129 ± 2 bc129 ± 2 bc129 ± 2 bc224 ± 6 f144 ± 3 ab144 ± 3 ab145 ± 3 ab928 ± 1 i
OS2139 ± 2 ef140 ± 1 ef140 ± 2 ef113 ± 8 b152 ± 8 bcd152 ± 8 bcd152 ± 8 bcd773 ± 2 h
OS3139 ± 2 ef139 ± 2 ef140 ± 2 ef112 ± 3 b153 ± 4 cd153 ± 4 cd153 ± 4 cd477 ± 4 b
TWDTR1NNNN153 ± 9 cd153 ± 9 cd153 ± 9 cd64 ± 1 a
TR2130 ± 1 bc130 ± 1 bc130 ± 1 bc178 ± 6 c145 ± 1 a145 ± 1 a145 ± 1 a736 ± 2 f
TR3131 ± 1 bcd131 ± 1 bc131 ± 1 bcd270 ± 1 g145 ± 1 abc145 ± 1 abc145 ± 1 abc762 ± 8 g
TS1126 ± 1 b127 ± 1 b128 ± 1 b242 ± 8 f141 ± 1 a141 ± 1 a141 ± 1 a926 ± 3 i
TS2136 ± 1 de136 ± 1 de137 ± 1 de195 ± 2 d152 ± 2 bcd152 ± 2 bcd152 ± 2 bcd1018 ± 4 j
TS3141 ± 2 f141 ± 2 ef142 ± 2 f170 ± 9 c150 ± 3 bcd150 ± 3 bcd151 ± 4 bcd1109 ± 8 k
Note: Data are presented as mean ± SD. OWD: water-soaked (control): OR1: first residue after centrifuge, OR2: second residue, OR3: third residue, OS1: first supernatant after centrifuge, OS2: second supernatant, OS3: third supernatant; TWD: ultrasonic-water-treated: TR1: first residue after centrifuge, TR2: second residue, TR3: third residue, TS1: first supernatant after centrifuge, TS2: second supernatant, TS3: third supernatant, N: not detected. Different letters in a column indicate significant difference (p < 0.05).
Table 4. Solid melting of different fractionated date pit powder.
Solid Melting—Decomposition
SampleFractionTmi (°C)Tmp (°C)Tme (°C)H (J/g)
OWDOR1190 ± 5 abc192 ± 5 bc219 ± 9 e174 ± 8 h
OR2192 ± 1 bc193 ± 1 bc201 ± 8 abc87 ± 4 d
OR3192 ± 1 bc193 ± 1 bc206 ± 7 bcd73 ± 1 c
OS1187 ± 8 abc188 ± 7 abc196 ± 6 abc111 ± 3 f
OS2189 ± 3 abc193 ± 2 bc215 ± 4 de81 ± 5 cd
OS3185 ± 2 ab186 ± 1 ab192 ± 1 a137 ± 3 g
TWDTR1184 ± 9 ab186 ± 8 ab199 ± 3 abc50 ± 5 a
TR2181 ± 8 a182 ± 8 a196 ± 1 ab100 ± 3 e
TR3197 ± 5 c197 ± 5 c207 ± 4 cd86 ± 4 d
TS1186 ± 1 ab187 ± 1 ab199 ± 2 abc105 ± 1 ef
TS2191 ± 6 abc192 ± 5 bc202 ± 8 abc64 ± 3 b
TS3189 ± 3 abc191 ± 4 abc198 ± 5 abc100 ± 9 e
Note: Data are presented as mean ± SD. OWD: water-soaked (control): OR1: first residue after centrifuge, OR2: second residue, OR3: third residue, OS1: first supernatant after centrifuge, OS2: second supernatant, OS3: third supernatant; TWD: ultrasonic-water-treated: TR1: first residue after centrifuge, TR2: second residue, TR3: third residue, TS1: first supernatant after centrifuge, TS2: second supernatant, TS3: third supernatant. Different letters in a column indicate significant difference (p < 0.05).
Disclaimer/Publisher’s Note: The statements, opinions and data contained in all publications are solely those of the individual author(s) and contributor(s) and not of MDPI and/or the editor(s). MDPI and/or the editor(s) disclaim responsibility for any injury to people or property resulting from any ideas, methods, instructions or products referred to in the content.

