Article

Unveiling Synergistic Antioxidant Effects of Green Tea and Peppermint: Role of Polyphenol Interactions and Blend Preparation

1
Department of Pharmacognosy and Botany, Faculty of Pharmacy, Comenius University, Odbojárov 10, 83232 Bratislava, Slovakia
2
4th Department of Surgery, Faculty of Medicine, University Hospital Bratislava, Comenius University, Ružinovská 6, 82606 Bratislava, Slovakia
3
Mathematical Institute, Slovak Academy of Sciences, Štefánikova 49, 81473 Bratislava, Slovakia
*
Author to whom correspondence should be addressed.
These authors contributed equally to this work.
Int. J. Mol. Sci. 2025, 26(13), 6257; https://doi.org/10.3390/ijms26136257
Submission received: 21 May 2025 / Revised: 25 June 2025 / Accepted: 26 June 2025 / Published: 28 June 2025

Abstract

This study explores the antioxidant activity of green tea (Camellia sinensis, GT) and peppermint (Mentha × piperita, PM) infusions, individually and in combination, focusing on how preparation methods affect their efficacy. Antiradical and intracellular antioxidant activity was assessed using DPPH, ABTS, and DCF assays, alongside interaction analysis via combination index (CI) and dose reduction index (DRI). HPLC analysis determined the polyphenolic profiles of GT and PM. GT showed the strongest antioxidant activity, with the lowest IC50 values (4.81 µg/mL in DPPH, 2.70 µg/mL in ABTS, 3.71 µg/mL in DCF), indicating potent radical-scavenging potential. PM exhibited moderate antiradical capacity but similar intracellular activity (IC50 = 3.80 µg/mL). Co-maceration followed by lyophilization of GT:PM extracts led to nearly additive interactions (CI~1.0) and allowed significant dose reduction (DRI up to 4.44). In contrast, post-mixed extracts showed assay-dependent effects, including antagonism in intracellular ROS inhibition (CI = 1.83). Equimolar mixtures of model polyphenols: EGCG, quercetin, and rosmarinic acid demonstrated enhanced effects, with the strongest synergy in ternary mixtures (CI = 0.67–0.86), potentially achievable in GT:PM combinations. These findings highlight that extract preparation critically influences antioxidant efficacy, supporting co-maceration as a promising strategy for developing effective functional formulations based on plant extract combinations.

1. Introduction

Green tea (Camellia sinensis Kuntze, GT) and peppermint (Mentha × piperita L., PM) are botanically distinct plants that have been widely consumed for centuries in the form of GT and PM tea, respectively. These beverages are not only valued for their specific flavors but also for their numerous health benefits, attributed to their rich polyphenol content [1,2]. Among the various biological activities described for both plants, antioxidant properties have been studied in depth, as their role in promoting health is undeniable [3,4,5,6]. While the individual effects of GT and PM tea have been extensively studied, the potential interactions between their bioactive compounds remain unexplored.
GT is particularly rich in catechins, such as (-)-epigallocatechin gallate (EGCG), (-)-epicatechin, (-)-epicatechin gallate, and (-)-epigallocatechin [7,8,9]. Furthermore, leaves of Camellia sinensis contain other phenolic compounds as flavonoids and hydroxybenzoic and hydroxycinnamic acids, including gallic acid, p-coumaric acid, quinic acid, and caffeoylquinic acid isomers [10]. In contrast, PM leaves contain essential oils (dominated by monoterpenes and sesquiterpenes), rosmarinic acid, chlorogenic acid, and flavonoids like eriodictyol, hesperetin, luteolin, apigenin, and their glycosides [11,12].
In medicinal applications, GT is recognized as a traditional herbal medicinal product for the relief of fatigue and sensation of weakness [13]. Other biological effects of GT were studied as well, such as its anticancer, anti-diabetic, cardioprotective, and neuroprotective properties [14]. On the other hand, PM tea is recognized as a traditional herbal medicinal product for the symptomatic relief of digestive disorders such as dyspepsia and flatulence [15]. Antioxidant, anti-inflammatory, immunomodulatory, hepatoprotective, and antimicrobial activities were described for PM essential oils and extracts [12].
Food and beverage combinations, including tea blends, are nowadays studied under the concept of “food pairing,” which aims to enhance sensory appeal [16]. In this case, the combination of GT and mint is famous in the area of North Africa, where GT gun powder is prepared in combination with fresh mint leaves, known as Tuareg, Moroccan, Tunisian, or Algerian mint tea, which is served sweetened [17]. In this area, Mentha spicata and Mentha viridis are the most consumed species [18]. Combining different types of teas or teas with herbs (tea blends) can result in synergistic effects that enhance antioxidant, anti-inflammatory, anti-diabetic, and antimicrobial activities. These combinations not only improve the therapeutic potential of individual components but also contribute to balanced phytochemical composition, sensory properties, and overall consumer and economic value [19].
Given the well-documented health benefits of both herbal substances, this study aims to evaluate the combined effects of GT and PM on antioxidant activity, investigating potential synergistic interactions between their bioactive compounds. Description and evaluation of these interactions can contribute to the development of novel tea blends that maximize both sensory and health-promoting attributes, further expanding the field of functional nutrition and plant-based therapeutics.

2. Results

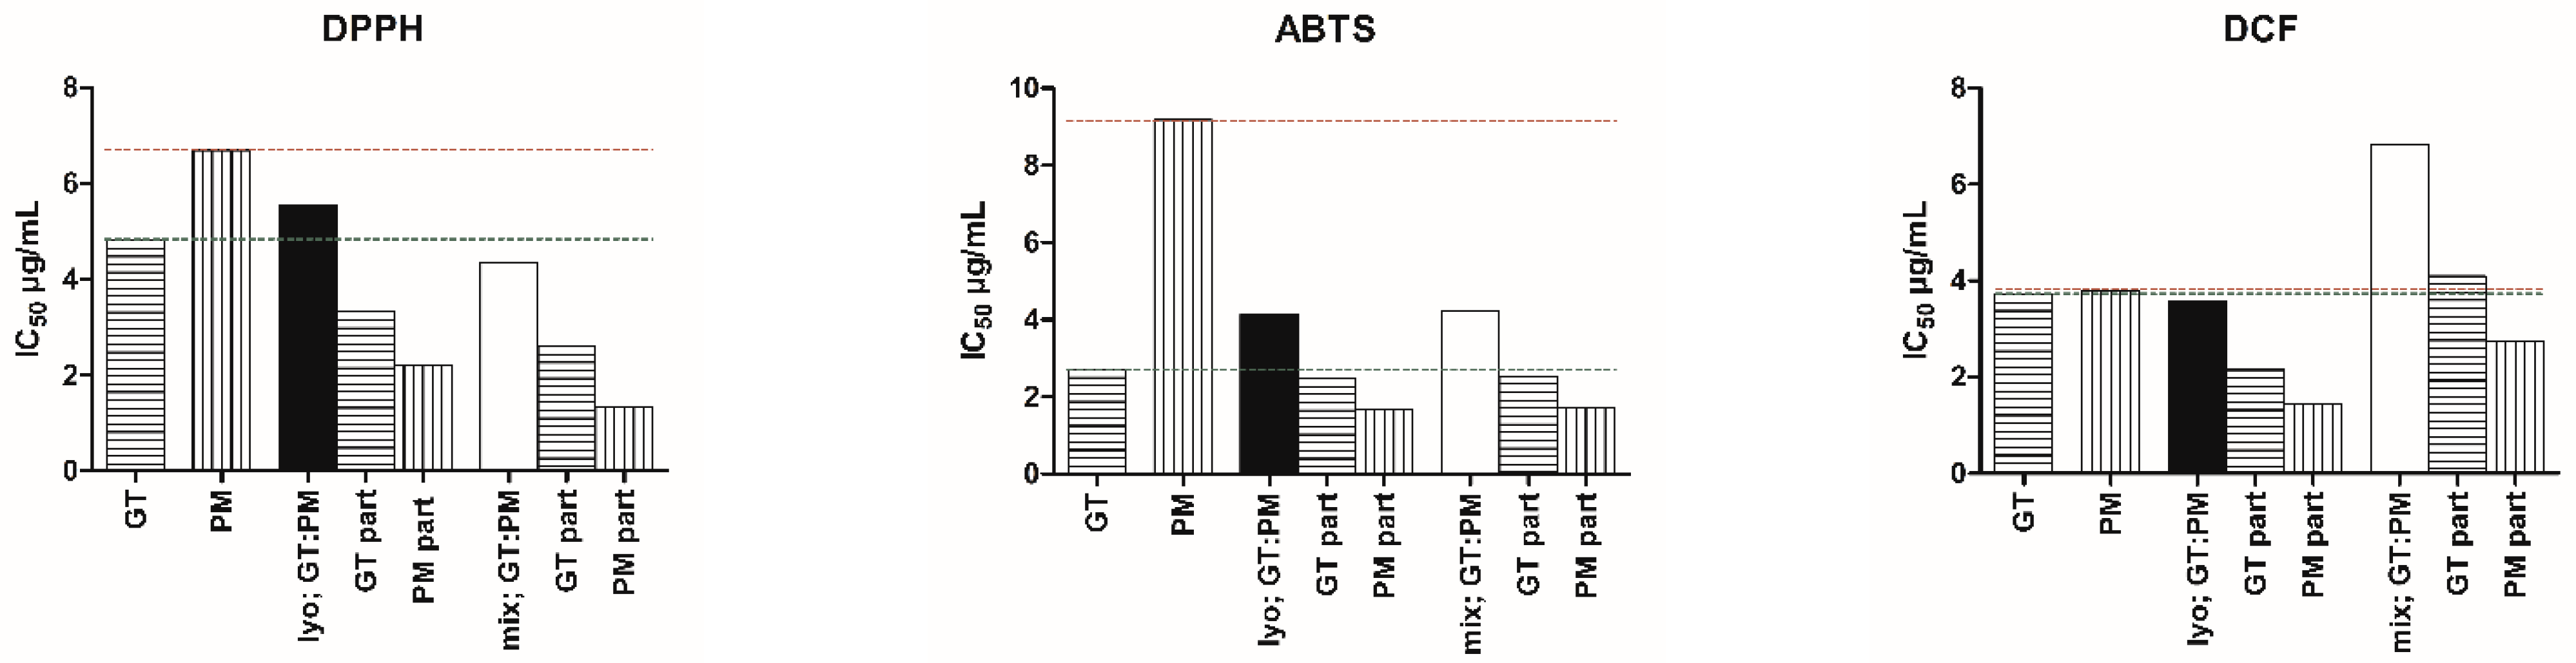
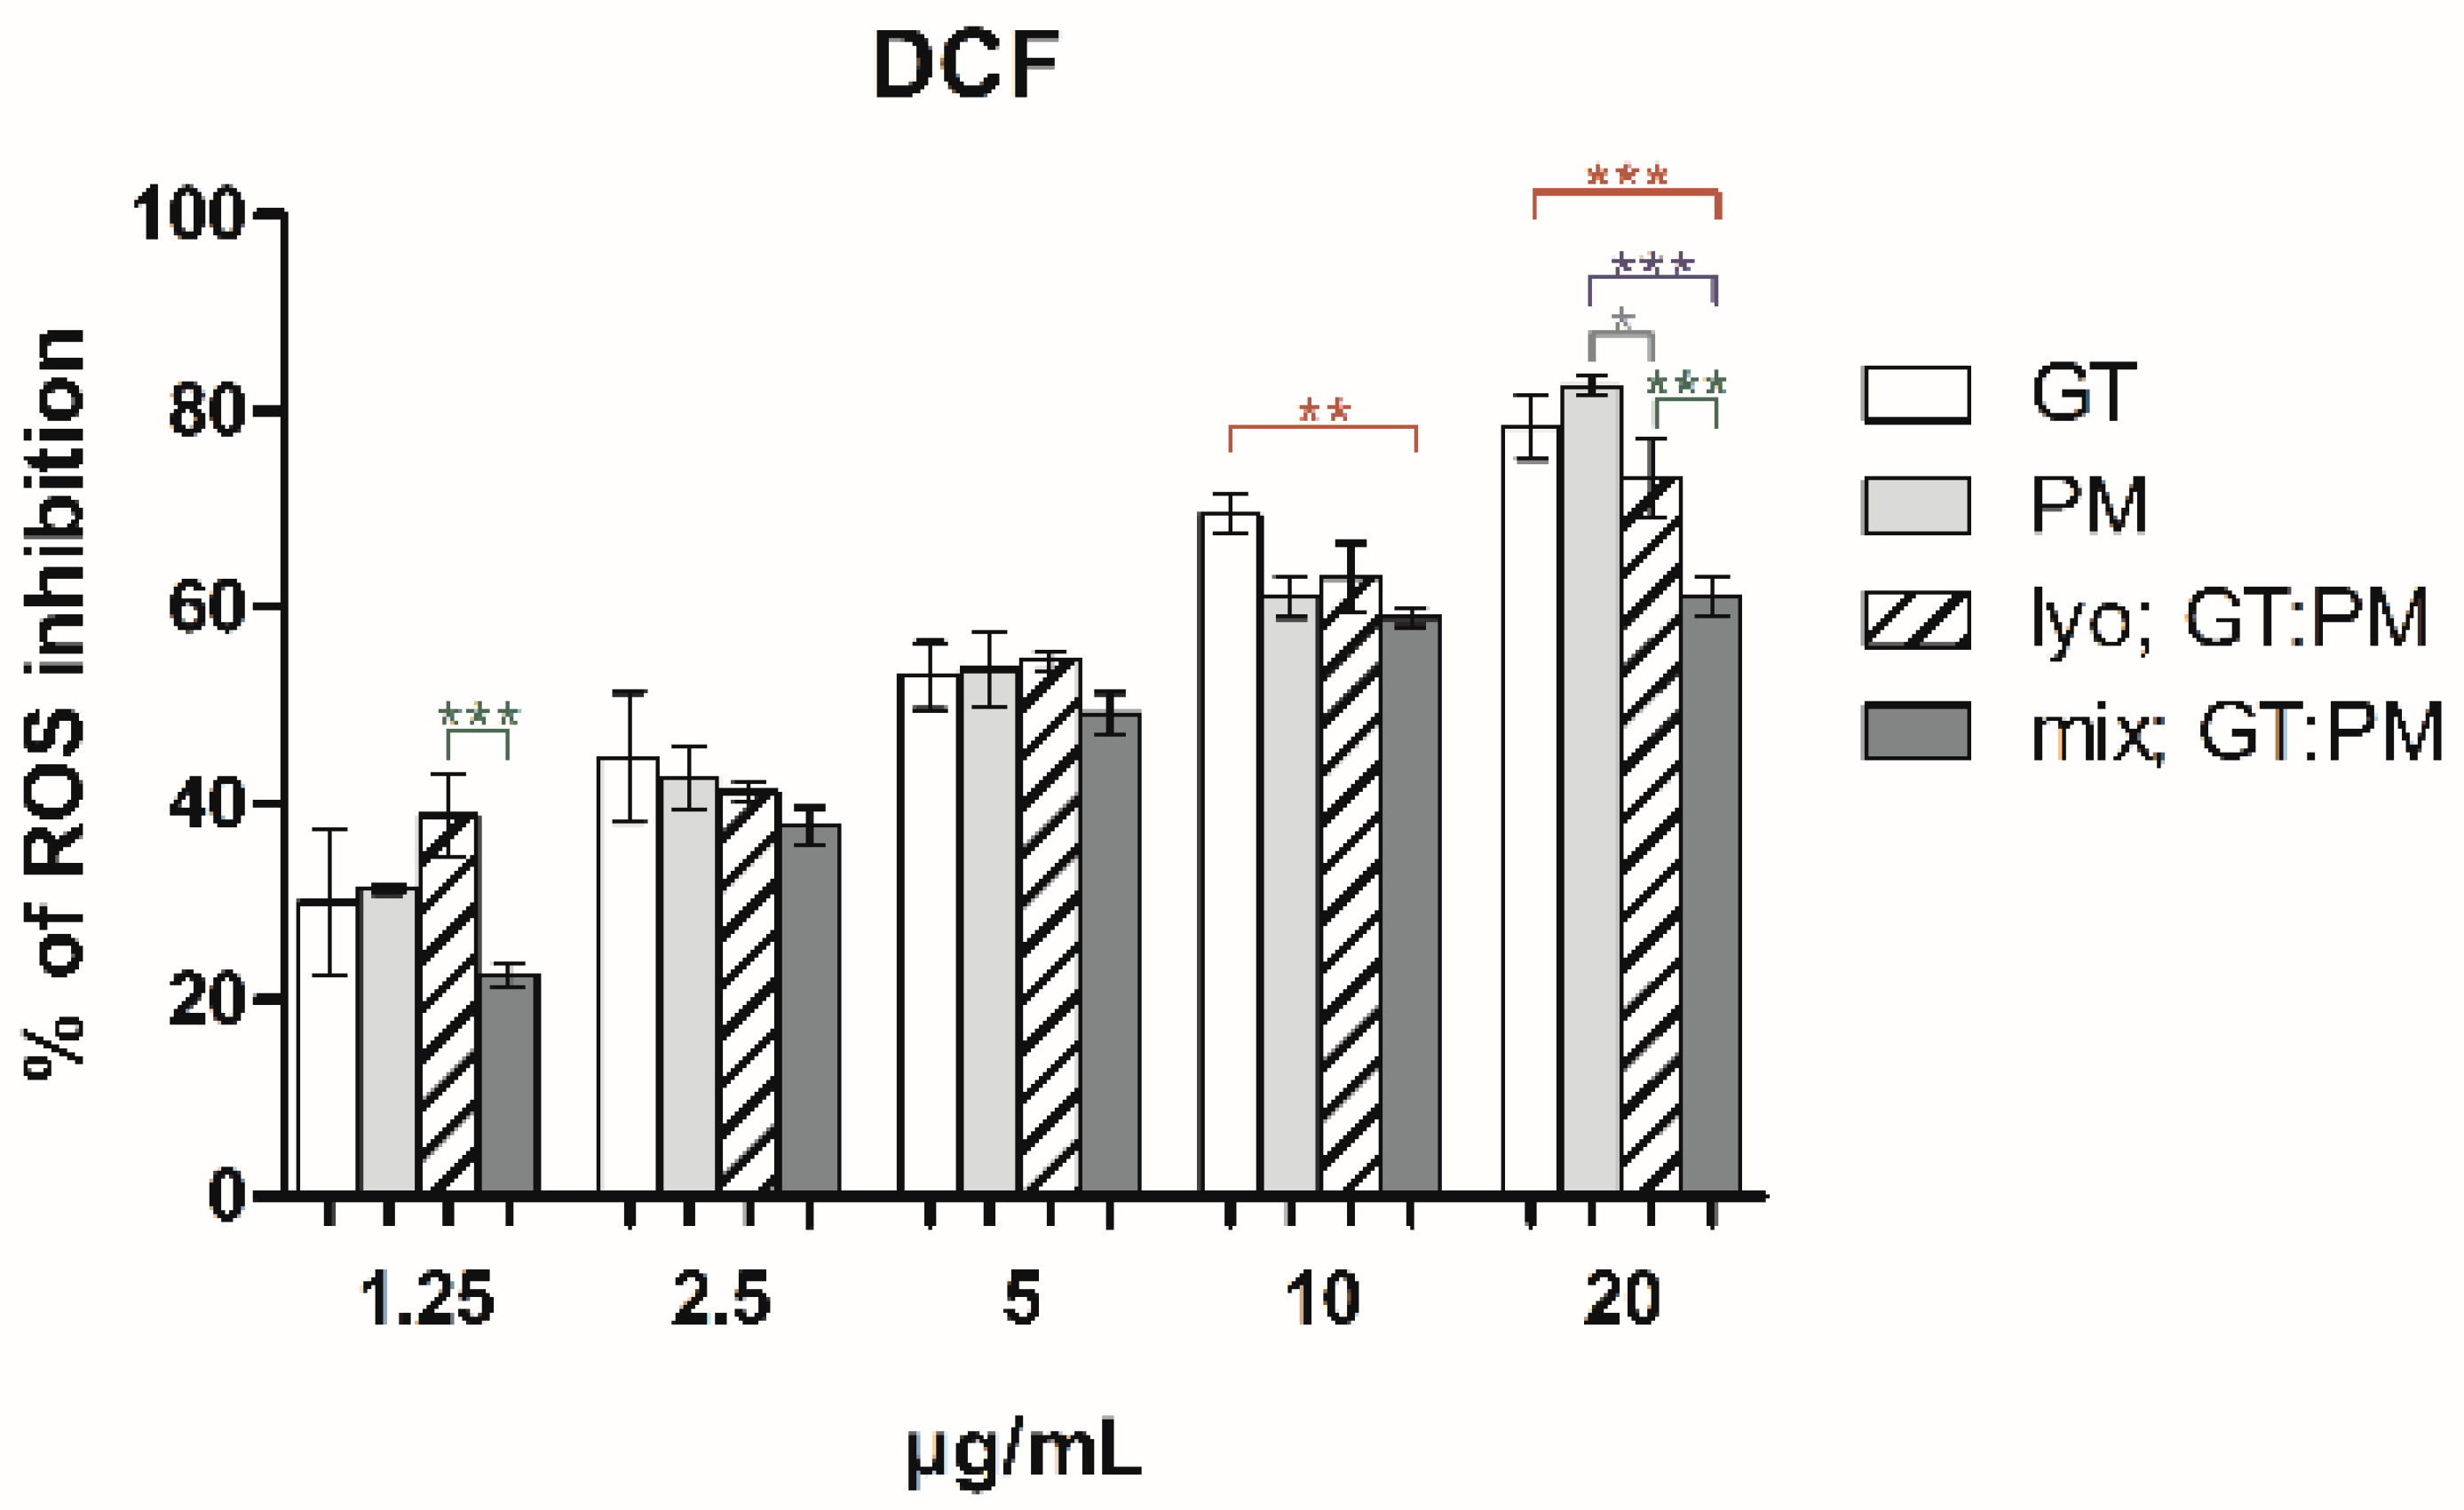
2.1. Antioxidant Activity and the Impact of Preparation Method on GT and PM Extracts and Mixtures

GT and PM extracts and their combinations were explored, with emphasis on how preparation methods influence radical scavenging potential. Co-maceration (“lyo; GT:PM”) versus mixing of separately prepared extracts (“mix; GT:PM”) were compared to determine how formulation affects radical scavenging activity.
The radical scavenging activity of GT, PM, their mixtures (co-macerated vs. mixed extracts), and selected polyphenols (EGCG, quercetin, rosmarinic acid) naturally occurring in the studied teas, chosen as model antioxidants was assessed using DPPH (2,2-diphenyl-1-picrylhydrazyl) and ABTS (2,2′-azino-bis (3-ethylbenzothiazoline-6-sulfonic acid)), while intracellular antioxidant effects were evaluated with DCF (dichlorofluorescein) assays (Table 1). Among samples, the strongest antioxidant activity across assays was observed in GT: IC50 values of 4.81 µg/mL (DPPH), 2.70 µg/mL (ABTS), and 3.71 µg/mL (DCF), respectively. Moderate activity was observed in PM, with IC50 values of 6.69, 9.18, and 3.80 µg/mL, respectively.
As seen in Table 1 and Figure 1, some combinations appear less potent absolutely but require lower doses for a similar effect. In intracellular antioxidant DCF assay, co-macerated, lyophilized GT:PM was nearly twice as effective as the post-mixed version. When components were prepared separately, an antagonistic effect occurred. Co-maceration followed by lyophilization shifted interactions toward additivity, reducing required doses.
As shown in Figure 2, intracellular antioxidant effects measured by ROS inhibition in NIH-3T3 cells increased with concentration (1.25–20 µg/mL). Among samples, “mix; GT:PM” was least effective, especially at 10 and 20 µg/mL, whereas “lyo; GT:PM” and individual extracts showed higher efficacy. Rosmarinic acid, used as a positive control (IC50 = 1.23 µg/mL, r = 0.97), demonstrated potent intracellular antioxidant activity, which was notably comparable to that of the tested extracts.

2.2. Interaction Analysis of GT and PM Extracts and Mixtures

The interaction effects of GT:PM combinations were evaluated using radical scavenging assays DPPH and ABTS, and intracellular antioxidant effects measured by DCF assay, as summarized in Table 2, comparing co-lyophilized and post-mixed formulations. In the lyophilizate (“lyo; GT:PM”) prepared by co-macerating GT and PM before lyophilization, the combination index (CI) values were close to 1 in all three assays (DPPH: 0.99, ABTS: 0.99, DCF: 0.96), indicating nearly additive effects. The Dose-Reduction Index (DRI), which reflects how much the dose of each component can be reduced without loss of activity, showed varying levels of efficiency. The highest dose reductions were observed after co-maceration (“lyo; GT:PM”) in the ABTS assay (1.30:4.44), followed by DCF (1.72:2.65) and DPPH (2.42:1.74).
In contrast, the mixture (“mix; GT:PM”) made by combining separately lyophilized GT and PM showed different interaction patterns. In the DPPH assay, it exhibited slight synergism (CI = 0.80) and a more pronounced dose reduction (DRI = 3.85:1.84) than the lyophilizate. In the ABTS assay, interaction remained nearly additive (CI = 1.02) with a similar DRI trend (1.27:4.33). However, in the DCF assay, antagonism of the mixture was shown (CI = 1.83) with lower dose efficiency (DRI = 0.91:1.39) compared to the lyophilizate.

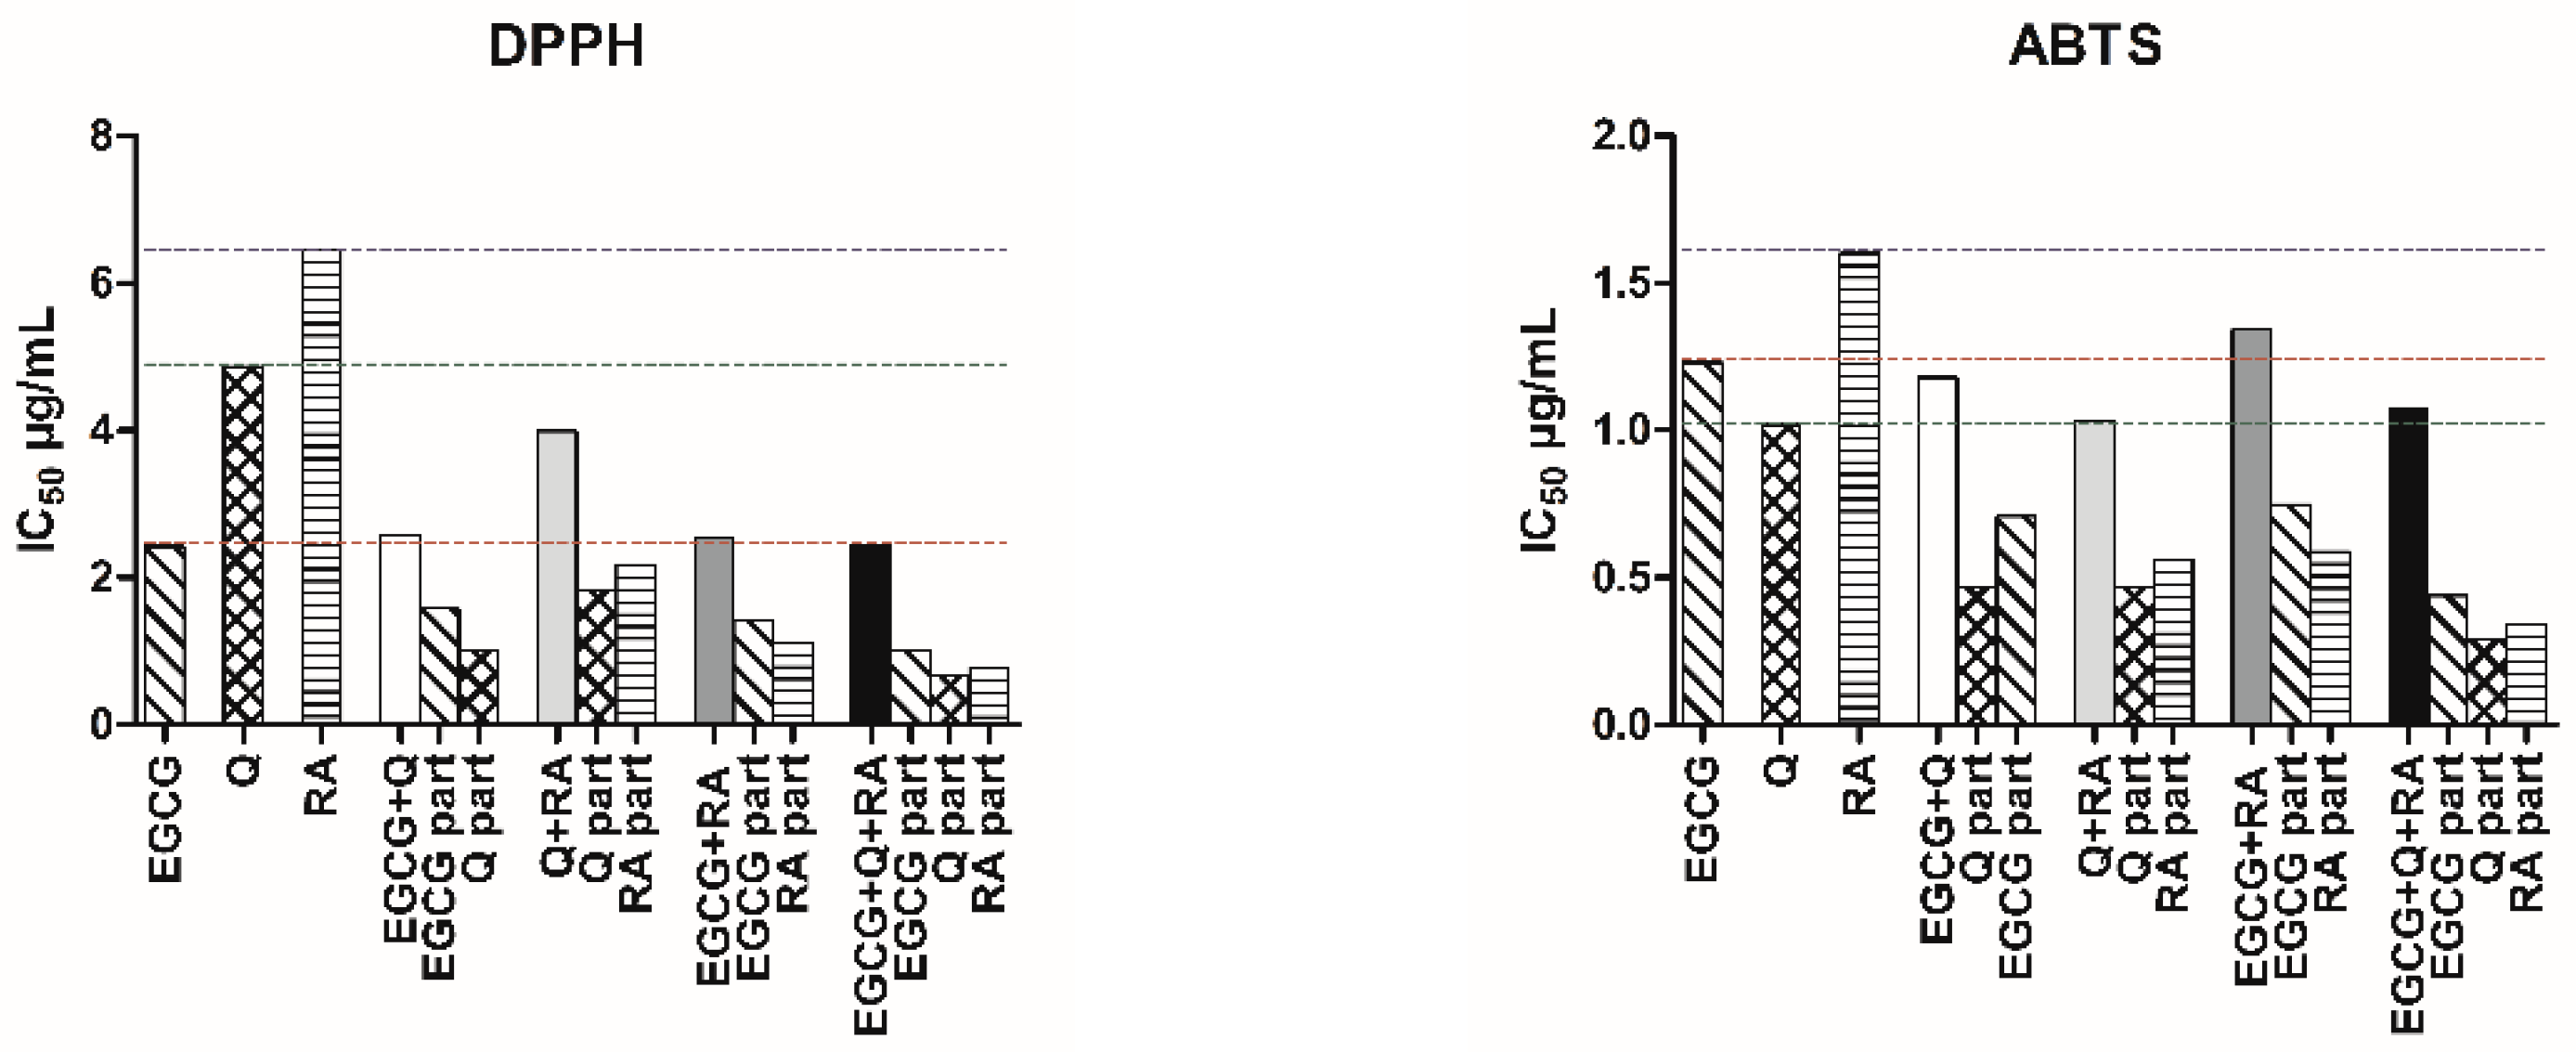
2.3. Antioxidant Activity of Polyphenols and Their Combinations

The radical scavenging activity of individual polyphenols–epigallocatechin gallate (EGCG), quercetin (Q), and rosmarinic acid (RA), as well as their equimolar mixtures, was evaluated using DPPH and ABTS assays. These results are summarized in Table 3. Among the individual compounds, the strongest radical scavenging activity was exhibited by EGCG, with IC50 values of 5.28 µM (DPPH) and 2.68 µM (ABTS), respectively. Moderate effects were observed for quercetin and rosmarinic acid, with DPPH IC50 values of 16.11 µM and 17.90 µM, respectively, and ABTS values of 3.36 µM and 4.44 µM, respectively. Enhanced radical scavenging capacity compared to individual compounds was observed in binary combinations. The Q + EGCG mixture was found to significantly improve activity, with IC50 values of 6.91 µM (DPPH) and 3.09 µM (ABTS), respectively. Similar improvements were observed in RA + EGCG and Q + RA mixtures. The most pronounced synergistic effect was displayed by the ternary combination (Q + RA + EGCG), which achieved the lowest IC50 values of all groups: 6.56 µM (DPPH) and 2.86 µM (ABTS), respectively.

2.4. Interaction Analysis of Polyphenol Combinations

To further explore the nature of interactions between polyphenols, combination index (CI), sequential deletion analysis (SDA), and dose reduction index (DRI) values were calculated for their equimolar mixtures at the 50% effective dose level (Table 4). Slight synergism in the DPPH assay was observed for the combination of Q + EGCG (CI = 0.87 ± 0.01), while moderate antagonism (CI = 1.40 ± 0.01) in the ABTS model was observed. Mixtures of Q + RA and EGCG + RA showed moderate synergism in DPPH (CI = 0.70 and 0.76) and slight to moderate synergy in ABTS (CI = 0.82 and 0.98). The ternary mixture (Q + RA + EGCG) exhibited the strongest synergistic effect in both assays, with CI values of 0.67 (DPPH) and 0.86 (ABTS), indicating enhanced efficacy. High DRI values confirmed that polyphenol combinations required lower doses for the same effect, demonstrating their advantage. As illustrated in Figure 3, the IC50 values of individual compounds were significantly higher compared to those in the mixtures, showing the enhanced antiradical efficiency achieved through their combination.

2.5. Phytochemical Profile of Infusions

The phytochemical analysis of PM and GT infusions revealed a complex profile of polar phenolic compounds, primarily phenolic acids and flavonoid glycosides (Table 5). These compounds were identified based on retention time (TR), pseudomolecular ions ([M–H]), MS/MS fragmentation patterns, and comparison with available literature data, chiefly by means of databases Pubchem (https://pubchem.ncbi.nlm.nih.gov/ accessed on 3 March 2025) and MassBank (https://massbank.eu/MassBank/ accessed on 5 March 2025).
In the PM (Mentha × piperita L.) extract, peak 1 (TR = 6.693 min) was confirmed as caffeic acid with [M–H] at m/z 179, which aligns with the identification via standard compounds. Similarly, chlorogenic acid was assigned to peak 2 (TR = 9.507 min, m/z 353), with typical MS2 fragments such as m/z 191, confirming the esterified caffeic acid structure. Peak 4, identified as luteolin-7-diglucuronide (TR = 15.807 min, m/z 637), displayed a major fragment at m/z 285, indicating the aglycone. Notably, luteolin glycosides were abundant in PM, as confirmed also by peak 8 (luteolin-7-O-rutinoside, m/z 593), showing characteristic fragmentation to m/z 285, consistent with the loss of a disaccharide moiety. Among all the flavonoids, this one was present in the highest amount (262.4 μg/mL). A significant compound of interest, rosmarinic acid, was found as peak 11 (TR = 25.267 min) with m/z 359 and fragment ions such as m/z 197 and 161, respectively. Its quantification showed the highest concentration among phenolic acids in PM (326.0 μg/mL), confirming its dominance in Lamiaceae species [20]. Peak 6, assigned as lithospermic acid (m/z 537), exhibited fragmentation (e.g., m/z 295), in accordance with known data. This compound, structurally related to rosmarinic acid, further emphasizes the richness of cinnamic acid derivatives in PM extract. Additional phenolics such as salvianolic acids B and L (peaks 9 and 14, respectively) were also identified, both presenting [M–H] ions at m/z~717 and rich fragmentation patterns. These derivatives represent polymerized forms of caffeic acid esters, contributing to the antioxidant potential [21]. Flavonoids such as hesperidin (peak 12, m/z 609) and diosmin (peak 13, m/z 607) were also found in moderate concentrations, highlighting the diversity of glycosylated flavones.
The LC-MS analysis of GT water extract revealed a rich and diverse composition of phenolic compounds, including hydroxybenzoic acids, flavan-3-ols, and their galloylated derivatives, as well as flavonol glycosides. A total of 20 peaks were detected and identified. One of the most abundant compounds identified was epigallocatechin gallate (EGCG) (peak 13, TR = 16.860 min, [M–H] = 457), a major bioactive catechin known for its antioxidant, anti-inflammatory, and chemopreventive properties [22]. The MS2 fragmentation yielding ions at m/z 305 and 169, respectively, confirms the presence of the epigallocatechin core and galloyl moiety, respectively. Similarly, epigallocatechin itself (peak 6, TR = 12.100 min, m/z 305) was detected in notable amounts (97.2 μg/mL), indicating the prevalence of non-galloylated flavan-3-ols as well. In addition, gallocatechin gallate (GCG) and catechin gallate (CG) were identified as peaks 14 and 16, respectively, with [M–H] ions at m/z 457 and 441, respectively. These compounds contribute to the overall antioxidant potential and bitter astringent taste typical of GT infusions [23]. Theogallin (peak 1, m/z 343), a galloylquinic acid derivative, was found in high concentration (152.9 μg/mL) and is considered an important compound for cognitive benefits attributed to GT [24]. Gallic acid (peak 2, m/z 169) and 2,5-dihydroxybenzoic acid (peak 3, m/z 153) further complemented the profile of hydroxybenzoic acids. Among hydroxycinnamic acid derivatives, chlorogenic acid (peak 5, m/z 353) and cryptochlorogenic acid (peak 8) were identified, both characterized by prominent fragments at m/z 191, typical for caffeoylquinic acids. A derivative, 5-O-caffeoylquinic acid (peak 7), was also observed, suggesting the presence of isomeric or structurally modified caffeoylquinates. An interesting polymeric phenolic compound, monogalloyl-HHDP-glucose (peak 9, m/z 633), exhibited fragment ions at m/z 463 and 349, respectively, confirming its identity as a hydrolyzable tannin, which may contribute to the extract’s astringency and potential health benefits. Flavonol glycosides were represented by rutin (peak 17, m/z 609), kaempferol-3-rutinoside (peak 18, m/z 593), and quercetin rhamnoside (peak 19, m/z 447), all showing characteristic fragments corresponding to their aglycones (quercetin and kaempferol) at m/z 301 and 285, respectively. The detection of (+)-catechin (peak 12, m/z 289), epigallocatechin 3-O-(3′-O-methyl)gallate (peak 10), and p-coumaroylquinic acid (peak 11) further illustrates the metabolic diversity of GT. Although most compounds were successfully identified, peaks 15 and 20 remained unassigned, though their m/z and fragmentation patterns suggest they may represent novel or less commonly reported phenolics. Overall, the profile confirms GT as a rich source of flavan-3-ols, galloylated derivatives, and flavonol glycosides, in agreement with previous literature. The high concentration of EGCG (249.7 μg/mL) and other catechins underlines GT’s relevance as a functional beverage with potential health-promoting properties, particularly in antioxidant, cardioprotective, and neuroprotective contexts [14].
Quantitatively, rosmarinic acid and its derivatives dominated in PM extract, while theogallin and catechin derivatives were more abundant in GT. The external standards used for quantification the rosmarinic acid (at λ = 280 nm) demonstrated excellent linearity (r2 > 0.998), enabling reliable quantification.
In terms of total percentage content (Table 6), PM extract showed significantly higher levels of THD (18.9%), and flavonoids (2.8% at λ = 392 nm) compared to GT (THD–4.7%, flavonoids–0.5%), although GT exhibited the highest total polyphenol content (29.8%), likely due to its rich catechin profile.

3. Discussion

Building on our previous work focused on interactions between red wine polyphenols [25], the scope was expanded by incorporating plant extracts as complex polyphenol-rich matrices. Although the antioxidant effects of GT [26,27,28] and PM [6,29,30] have been widely examined individually, their combinations have been explored less frequently. Notably, GT combined with Ocimum gratissimum (1:1) showed maximal synergism [31], and a GT, honey, and citrus blend enhanced antioxidant capacity [32]. Similarly, GT and stevia mixtures and PM with Equisetum arvense or Desmodium molliculum improved antioxidant profiles [33,34]. While limited data are available regarding GT and PM combinations, Moroccan mint tea (gunpowder GT and fresh spearmint) is recognized as a well-known traditional blend [17,18]. In our study, PM was selected to reflect the Central European preference for PM.
GT showed the strongest antiradical activity, consistent with its high catechin (especially EGCG) and micronutrient content that enhance its radical-scavenging activity [26]. PM showed moderate activity, with efficacy strongly associated with total phenolic content, particularly rosmarinic acid and related compounds [35].
The DPPH assay involves hydrogen atom transfer and proton-coupled electron transfer, reacting with polyhydroxy aromatics [36,37]. DPPH serves as a model for hydrogen donation from phenols and other antiradicals, providing good correlation with antiradical capacity. ABTS•+ scavenging occurs through hydrogen atom transfer, single electron transfer, or predominantly through sequential proton loss electron transfer mechanisms, especially in water or alcohol, where phenols ionize to phenoxide anions that act as electron donors [38,39]. These mechanistic differences highlight assay-specific reactivity of antiradicals. In the lyophilizate (“lyo; GT:PM”) obtained through co-maceration prior to lyophilization, additive effects were observed across all three assays. Notably, the greatest dose reductions were achieved after co-maceration, particularly in the ABTS assay, followed by DCF and DPPH. It is suggested that even if absolute antioxidant activity slightly declined in some assays, co-maceration enabled more efficient utilization of bioactive compounds.
The DCF assay reflects general intracellular ROS levels, not specific reactive species. Using H2O2 as a trigger, both GT and PM reduced ROS comparably, likely via scavenging, suppression, or enhancement of endogenous defenses [40]. Preparation methods markedly influenced bioactivity in cell-based experiments; co-maceration followed by lyophilization enhanced effectiveness and reduced required doses compared to separate or post-mixed extracts, suggesting that this approach enhances both potency and contributes to optimized antioxidant performance with lower input.
This improvement is likely linked to the increased content of THD (total hydroxycinnamic derivatives), which are effective antioxidants, largely due to the number of hydroxyl groups on the aromatic ring, which stabilize phenoxy radicals formed upon oxidation by ROS through electron donation. Moreover, higher levels of total hydroxycinnamic derivatives may contribute to additional health benefits, as they can enhance LDL resistance to lipid peroxidation, protect proteins, chelate metals, scavenge ROS, and inhibit enzymes involved in oxidative stress [41].
However, the preparation method significantly influenced interaction behavior. While the post-mixed extract showed some synergism (e.g., DPPH), it also resulted in antagonism in the DCF model. In contrast, co-maceration followed by lyophilization consistently shifted interactions toward additivity, particularly in the DCF model, demonstrating its importance in optimizing antioxidant interactions and underscoring the significance of the preparation method in modulating bioactivity.
Polyphenols are well-known for their antiradical effects, functioning primarily as free radical scavengers through mechanisms such as hydrogen/electron donation, singlet oxygen quenching, and metal chelation [42]. To further explore these properties, we evaluated the antiradical activity of individual model polyphenols: EGCG, quercetin, and rosmarinic acid, as well as their equimolar mixtures using DPPH and ABTS assays. Among the tested compounds, EGCG exhibited the strongest individual antiradical activity, while the ternary combination (Q + RA + EGCG) showed the most pronounced synergistic effect, achieving the lowest IC50 values across both assays.
Structural features of the tested compounds may explain these results. A wide range of phenol-derived compounds, especially those with ortho-dihydroxyl groups or pyrogallol-type substituents, contribute to ABTS•+ quenching, correlating with their strong antiradical performance. Quercetin and RA meet these criteria, while EGCG’s gallate moiety provides additional ester and hydroxyl functionality, further boosting its efficacy. The presence of a carbonyl group, such as the ester group in EGCG, also enhances antiradical potential [38,43]. These structural characteristics are aligned with the compounds’ performance in both assays, confirming the important role of molecular configuration in antiradical behavior.
EGCG + Q + RA combination exhibited the strongest synergism and lowest IC50, often outperforming individual compounds.
HPLC confirmed the presence of EGCG and quercetin glycosides in GT, and RA in PM, indicating that the enhanced antiradical potential of their combination likely results from synergistic interactions. This supports the idea that even low-activity or low-abundance compounds (multiple conjugated phenolics, especially glucuronidated and rutinosylated flavones) in herbal extracts reflect the metabolic complexity of the plant matrices and can, through interaction, contribute to substantial bioactivities.
In summary, our findings suggest that while individual compounds such as EGCG and RA play a major role in the antioxidant activity of GT and PM extracts, the method of preparation (co-macerating vs. mixing) and the complex interplay of active components also significantly influence overall efficacy. These insights underscore the importance of considering both chemical composition and processing methods when designing plant-based antioxidant formulations, particularly those intended for intracellular action or therapeutic applications.

4. Materials and Methods

4.1. Plant Material

The plant species Mentha × piperita cv. ‘Perpeta’ was cultivated by the Medicinal Plants Garden–Hortus Plantarum Medicarum, Faculty of Pharmacy, Comenius University Bratislava, Slovakia (GPS coordinates: 48.142073 N, 17.188698 E). The aerial parts, including leaves, were harvested at the flowering stage in July 2023 under clear, sunny weather conditions. The plants were air-dried in the shade at room temperature (25 °C). The leaves were carefully separated from the stems and flowers. Dried leaves of Camellia sinensis (gunpowder green tea) were purchased from Juvamed (Rimavská Sobota, Slovakia). The plant material was identified by Silvia Bittner Fialová. The identity of the plant materials was confirmed based on anatomical and morphological parameters. Voucher specimens (Vouchers No. PM_07/2023_ZLR and No. GT-Juvamed-23) are deposited at the Department of Pharmacognosy and Botany, Comenius University Bratislava.

4.2. Preparation of Infusions and Lyophilizates

Water infusions were prepared from GT leaves, PM leaves, and their 1:1 (w/w) mixture (“lyo; GT:PM”) following the Czechoslovakian Pharmacopoeia, 4th edition [44]. For each infusion, 15 g of dried leaves were moistened with five times their weight in deionized water and left to soak for 15 min. Subsequently, 150 mL of boiling deionized water was added, and the mixture was heated in a water bath for 5 min, followed by cooling at room temperature for 45 min. The infusions were then filtered, frozen, and lyophilized according to the manufacturer’s instructions (SCANVAC CoolSafeTM, LaboGeneTM, Lynge, Denmark). The lyophilization process was performed at −53 °C and 0.043 Pa.
The final lyophilized yields were 4.4368 g (29.6%) for GT, 3.0113 g (20.0%) for PM, and 3.6980 g (24.7%) for the “lyo; GT:PM” mixture. To evaluate potential synergistic effects, a mixture of the individual lyophilizates was subsequently prepared in a 3:2 (w/w) ratio (“mix; GT:PM”), reflecting the extraction yields of the individual extracts.
Additionally, an equimolar combination of ethanolic solutions containing the major polyphenols from each infusion was prepared. These included epigallocatechin gallate (EGCG) (≥95%; Sigma-Aldrich, St. Louis, MO, USA) and quercetin (Q) (≥95%; Sigma-Aldrich, St. Louis, MO, USA) from green tea, as well as rosmarinic acid (RA) (≥96%; Sigma-Aldrich, St. Louis, MO, USA) from PM.

4.3. DPPH Scavenging Assay

The DPPH radical scavenging assay was conducted following the method described by Blois [45], with minor modifications. Briefly, the stable 2,2-diphenyl-1-picrylhydrazyl (DPPH) radical (Sigma-Aldrich, St. Louis, MO, USA) was freshly dissolved in methanol. A 225 µL aliquot of DPPH solution (55 µM) was mixed with 25 µL of the test sample, which included individual lyophilizates and their mixtures dissolved in deionized water, as well as polyphenols and their mixtures dissolved in ethanol. After a 30 min incubation, absorbance changes were measured at 517 nm using a Tecan Infinite M200 microplate reader (Tecan AG, Grödig/Salzburg, Austria) in 96-well microplates (Greiner Bio-One GmbH, Frickenhausen, Germany). All measurements were performed in quadruplicate. The IC50 values were determined from the dose-response curves.

4.4. ABTS Scavenging Assay

The ABTS radical scavenging assay was conducted following the method described by Re [46], with minor modifications. Briefly, a 7 mM aqueous solution of 2,2′-azinobis-(3-ethylbenzothiazoline-6-sulfonic acid) (ABTS) (Sigma-Aldrich, St. Louis, MO, USA) was prepared and mixed in an equimolar ratio with 2.45 mM potassium persulfate (K2S2O8) (Sigma-Aldrich, St. Louis, MO, USA). The mixture was kept in the dark at room temperature for 24 h to allow the formation of ABTS radicals. The resulting ABTS solution was then diluted with ethanol (1.1 mL) to a final volume of 50 mL. A 2.5 µL aliquot of the test sample, including individual lyophilizates and their mixtures dissolved in deionized water, as well as polyphenols and their mixtures dissolved in ethanol, was added to 247.5 µL of the ABTS solution. Absorbance changes were recorded after 6 min at 734 nm using a Tecan Infinite M200 microplate reader (Tecan AG, Grödig/Salzburg, Austria) in 96-well microplates (Greiner Bio-One GmbH, Frickenhausen, Germany). All measurements were performed in quadruplicate. The IC50 values were determined from the dose-response curves.

4.5. Intracellular Detection of Oxidative Stress Using the DCF Assay

Intracellular oxidative stress was evaluated in NIH/3T3 cells (mouse embryonic fibroblasts) by measuring reactive oxygen species (ROS) using dichlorodihydrofluorescein diacetate (DCFH-DA) (purity ≥ 97%, Sigma-Aldrich, St. Louis, MO, USA) as a fluorescent probe, following the method described by the Miranda-Rottmann team [47], with minor modifications. NIH/3T3 cells used in this study were obtained from the Department of Pharmacology and Toxicology, Faculty of Pharmacy, Comenius University, Bratislava, Slovakia. Cells were cultured in Dulbecco’s Modified Eagle Medium (DMEM) (Sigma-Aldrich, St. Louis, MO, USA) supplemented with 10% fetal bovine serum (Sigma-Aldrich, St. Louis, MO, USA), 100 µg/mL streptomycin (Sigma-Aldrich, St. Louis, MO, USA), and 100 IU/mL penicillin (Sigma-Aldrich, St. Louis, MO, USA), and maintained at 37 °C in a humidified incubator MCO-19 AIC (UV) CO2 Incubator with 5% CO2 (Panasonic, Osaka, Japan). Cells were routinely passaged approximately twice per week. For the assay, cells were seeded at a density of 15,000 cells/100 µL per well in black 96-well microplates (Greiner Bio-One GmbH, Frickenhausen, Germany) and incubated for 24 h. Following medium replacement with serum-free DMEM, 5 µL of single lyophilized samples or their mixtures were added to the wells, followed by 5 µL of DCFH-DA (final concentration of 5 µg/mL), which was added in the laboratory under dimmed light to prevent premature oxidation of the DCFH-DA. After a 15 min incubation, hydrogen peroxide (H2O2) (Sigma-Aldrich, St. Louis, MO, USA) was added to a final concentration of 100 µM. The fluorescence intensity of the oxidized DCF product was measured using a Tecan Infinite M200 microplate reader (Tecan AG, Grödig/Salzburg, Austria) with an excitation/emission wavelength of 480/530 nm. All measurements were performed in quadruplicate. The IC50 values were determined from the dose-response curves.

4.6. Interaction Analysis/Synergy Evaluation

The quantification of interaction as a synergism or antagonism was done using the combination index (CI) for n-drug combination at x% according to Chou [48].
( C I ) x n = j = 1 n ( D ) j / ( D x ) j
In Equation (1), n(CI)x represents the sum of the doses of n drugs that together induce x% inhibition in a combination. The denominator (Dx) refers to the dose of drug D “alone” that inhibits the system by x%. If the CI value is equal to, less than, or greater than 1, it indicates an additive, synergistic, or antagonistic effect, respectively. Through the application of the log (CI) grading scale, Chou divides synergism and antagonism into distinct ranges of the CI, as illustrated in Table 7.
The Dose-Reduction Index (DRI) indicates the factor by which the dose of each drug in a combination can be decreased at a specified level of effect, in comparison to the doses of the individual drugs. The DRI values for each drug in an n-drug combination are provided, as shown in Equation (2).
(DRI)1 = (Dx)1/(D1); (DRI)2 = (Dx)2/(D2); …; etc.
The numerator (Dx) refers to the dose of drug D “alone” that inhibits the system by x%. A DRI value greater than 1 signifies a beneficial reduction in dose, with higher DRI values corresponding to greater dose reductions for a given therapeutic effect. However, this does not necessarily imply synergism. Both the CI and DRI, along with the concentration required for 50% inhibition (IC50), were calculated using median-effect analysis via CompuSyn software version 1.0.1. (ComboSyn, Inc., Paramus, NJ, USA).

4.7. Phytochemical Analysis

4.7.1. LC-MS/MS-DAD Analysis

Phytochemical analysis of phenolic compounds in infusions of PM and GT, as well as their quantitative content, was performed using the method described in our previous study [49], carried out using an Agilent 1260 Infinity LC System (Agilent Technologies, Santa Clara, CA, USA), equipped with a binary pump, autosampler, column thermostat, and diode array detector (DAD), coupled to a quadrupole time-of-flight mass spectrometer (6520 Accurate-Mass QTOF) with an orthogonal electrospray ionization (ESI) source (Agilent Technologies, Santa Clara, CA, USA). Separation was performed on a Kromasil C18 column (150 mm × 4.6 mm, 5 µm; Sigma-Aldrich, Munich, Germany). The mobile phase consisted of water with acetic acid at pH 2.5 (solvent A) and acetonitrile (solvent B). The elution gradient was programmed as follows: 0 min, 5% B; 0–20 min, 5–20% B; 20–25 min, held at 20% B; 25–40 min, 20–40% B; 40–60 min, 40–50% B; 60–65 min, 50–65% B; 65–90 min, 65–100% B; held at 100% B from 90–95 min; re-equilibration to 5% B from 95–96 min and held until 115 min. The injection volume was 10 µL. Mass spectrometric detection was performed in negative ion mode. Data were acquired in full scan mode over a mass range of m/z 30–1200 with MS2 fragmentation for compound identification. Quantitative determination was carried out using rosmarinic acid (purity ≥ 95.5%, Sigma-Aldrich, St. Louis, MO, USA) as an external standard. Chromatograms were acquired at λ = 280 nm. The phenolic compounds present in the samples were identified based on their mass spectra and accurate m/z values by comparison with available literature sources, particularly using the PubChem (https://pubchem.ncbi.nlm.nih.gov/ accessed on 3 March 2025) and MassBank databases (https://massbank.eu/MassBank/ accessed on 5 March 2025). Quantitative analysis was carried out using rosmarinic acid as an external standard. The calibration curve was obtained by injection of known concentrations (5–500 ppm). The method was validated for linearity, sensitivity, and precision. The calibration curve exhibited high linearity. The following coefficients of determination (r2) and validation parameters were obtained: rosmarinic acid at 280 nm r2 = 0.9998, regression curve y = 259.44x – 226.01, LOD = 0.50 μg/mL, LOQ = 1.7 μg/mL.

4.7.2. Spectrophotometric Analysis

Quantification of selected secondary metabolites was conducted using spectrophotometric methods in accordance with the European Pharmacopoeia 11th Edition [50]. Total hydroxycinnamic derivatives (THD) were determined by Arnow’s assay at 505 nm and expressed as rosmarinic acid. Total flavonoid content was measured by the aluminum chloride method at 392 nm (luteolin-7-O-glucoside) and 420 nm (quercetin). Total polyphenols and tannins were quantified using the Folin–Ciocalteu reagent at 760 nm, also expressed as rosmarinic acid. All measurements were performed in triplicate using a Genesys 6 spectrophotometer (Thermo Electron Corporation, Waltham, MA, USA), and results were calculated from calibration curves and reported as mean ± SD, relative to the dried extract.

4.8. Statistics

All measurements were performed in quadruplicate. r-value analysis, where the r-value represents the parameter for goodness of fit to the median-effect principle of the mass-action law, was performed using median-effect analysis and sequential deletion analysis (SDA), which involves the iterative removal of one drug dose at a time for repeated CI values calculated via CompuSyn software version 1.0.1. Statistical analysis was performed using one-way ANOVA followed by Bonferroni post hoc test. Results are expressed as mean ± SD (n = 4). Statistical significance was set as follows: p < 0.05 (*), p < 0.01 (**), and p < 0.001 (***).
The standard error (SE) for the IC50 values was calculated according to Equation (6). Effect is modeled using the logistic function (Equation (3)).
E = 1 + I C 50 c p 1
where E is the effect, c is the concentration, and p is parameter. This relationship was then linearized as (Equation (4)).
y = p x + q ,   where   y = l n 1 E 1 ,   x = l n ( c ) ,   q = p l n ( I C 50 )
Thus
I C 50 = e q p
The standard error of IC50 was then calculated from covariance matrix of estimates of p and q, by usual error propagation.
S E I C 50 2 = I C 50 2 S S r e s i d p 2 ( n 2 ) 1 n + y ¯ 2 S S r e g

5. Conclusions

Polyphenols and plant extracts demonstrated strong antioxidant effects, with GT infusion and EGCG standing out as the most effective. When combined, infusions prepared from the leaves of GT and PM, as well as both extracts and pure polyphenols, often showed enhanced activity through synergistic or additive effects. The method of preparation of the mixtures played a crucial role in determining these interactions. Co-maceration followed by lyophilization led to significantly improved antioxidant potential. In particular, the DCF model revealed a shift from antagonism to additivity when the extract was prepared as a single lyophilizate rather than mixed post-lyophilization. This indicates that the bioactivity of mixtures cannot be simply predicted by the effect of individual components alone. The ternary combination of quercetin, rosmarinic acid, and EGCG provided the strongest synergistic action, supporting the idea that mechanistic complementarity enhances scavenging potential. These findings highlight the importance of not only selecting effective antioxidants but also optimizing formulation and extraction methods for maximal biological efficacy.

Author Contributions

E.K. (Elena Kurin): Conceptualization, data curation, formal analysis, investigation, methodology, validation, visualization, writing—original draft, writing—review and editing. M.H.: Data curation, formal analysis, investigation, visualization, writing—original draft. E.K. (Ema Kostovčíková): Data curation, investigation. K.D.: Data curation, investigation. P.M.: Writing—review and editing, supervision. M.N.: Visualization, writing—review and editing, supervision. B.N.: Data curation. S.B.F.: Conceptualization, methodology, investigation, resources, data curation, writing—original draft, visualization, project administration, funding acquisition, writing—review and editing, supervision. All authors have read and agreed to the published version of the manuscript.

Funding

This research was funded by VEGA 1/0170/24 and VEGA 1/0226/22.

Institutional Review Board Statement

Not applicable.

Informed Consent Statement

Not applicable.

Data Availability Statement

The data presented in this study are available upon request from the corresponding author due to privacy.

Acknowledgments

We would like to express our sincere gratitude to Eva Scharnagl for her valuable collaboration and contribution to the experimental work in this study. The NIH/3T3 mouse embryonic fibroblasts used in this study were kindly provided by the Department of Pharmacology and Toxicology, Faculty of Pharmacy, Comenius University, Bratislava, Slovakia.

Conflicts of Interest

The authors declare no conflicts of interest.

Abbreviations

The following abbreviations are used in this manuscript:
ABTS2,2′-azino-bis(3-ethylbenzothiazoline-6-sulfonic acid)
CIcombination index
DCFdichlorofluorescein
DPPH2,2-diphenyl-1-picrylhydrazyl
DRIdose reduction index
EGCG(-)-epigallocatechin gallate
GTgreen tea
lyo; GT:PMlyophilizate prepared from a co-macerated mixture of GT and PM
mix; GT:PMmixture of separately lyophilized extracts GT and PM
NIH/3T3mouse embryo fibroblast cell line clone 3T3
PMpeppermint
Qquercetin
RArosmarinic acid
SDAsequential deletion analysis
TRretention time

References

  1. Kopjar, M.; Tadić, M.; Piližota, V. Phenol Content and Antioxidant Activity of Green, Yellow and Black Tea Leaves. Chem. Biol. Technol. Agric. 2015, 2, 1. [Google Scholar] [CrossRef]
  2. Zeljković, S.Ć.; Šišková, J.; Komzáková, K.; De Diego, N.; Kaffková, K.; Tarkowski, P. Phenolic Compounds and Biological Activity of Selected Mentha Species. Plants 2021, 10, 550. [Google Scholar] [CrossRef]
  3. Forester, S.C.; Lambert, J.D. The Role of Antioxidant versus Pro-Oxidant Effects of Green Tea Polyphenols in Cancer Prevention. Mol. Nutr. Food Res. 2011, 55, 844–854. [Google Scholar] [CrossRef] [PubMed]
  4. Lee, L.S.; Kim, S.H.; Kim, Y.B.; Kim, Y.C. Quantitative Analysis of Major Constituents in Green Tea with Different Plucking Periods and Their Antioxidant Activity. Molecules 2014, 19, 9173–9186. [Google Scholar] [CrossRef] [PubMed]
  5. Ranjbar, M.; Kiani, M.; Nikpey, A. Antioxidant and Scolicidal Activities of Four Iranian Mentha Species (Lamiaceae) in Relation to Phenolic Elements. J. HerbMed Pharmacol. 2020, 9, 200–208. [Google Scholar] [CrossRef]
  6. Bittner Fialová, S.; Kurin, E.; Trajčíková, E.; Jánošová, L.; Šušaníková, I.; Tekeľová, D.; Nagy, M.; Mučaji, P. Mentha Rhizomes as an Alternative Source of Natural Antioxidants. Molecules 2020, 25, 200. [Google Scholar] [CrossRef]
  7. Chen, Q.; Guo, Z.; Zhao, J. Identification of Green Tea’s (Camellia sinensis (L.)) Quality Level According to Measurement of Main Catechins and Caffeine Contents by HPLC and Support Vector Classification Pattern Recognition. J. Pharm. Biomed. Anal. 2008, 48, 1321–1325. [Google Scholar] [CrossRef]
  8. Jakabová, S.; Árvay, J.; Šnirc, M.; Lakatošová, J.; Ondejčíková, A.; Golian, J. HPLC-DAD Method for Simultaneous Determination of Gallic Acid, Catechins, and Methylxanthines and Its Application in Quantitative Analysis and Origin Identification of Green Tea. Heliyon 2024, 10, e35819. [Google Scholar] [CrossRef]
  9. Nain, C.W.; Mignolet, E.; Herent, M.F.; Quetin-Leclercq, J.; Debier, C.; Page, M.M.; Larondelle, Y. The Catechins Profile of Green Tea Extracts Affects the Antioxidant Activity and Degradation of Catechins in DHA-Rich Oil. Antioxidants 2022, 11, 1844. [Google Scholar] [CrossRef]
  10. Lorenzo, J.M.; Munekata, P.E.S. Phenolic Compounds of Green Tea: Health Benefits and Technological Application in Food. Asian Pac. J. Trop. Biomed. 2016, 6, 709–719. [Google Scholar] [CrossRef]
  11. Bittner Fialová, S.; Harris, C.; Ordsmith, V.; Nagy, M.; Jonáš, F.; Mučaji, P. Polar Phenolic Compounds in Peppermint Rhizomes and Leaves. Eur. Pharm. J. 2019, 66, 28–31. [Google Scholar] [CrossRef]
  12. Hudz, N.; Kobylinska, L.; Pokajewicz, K.; Horčinová Sedláčková, V.; Fedin, R.; Voloshyn, M.; Myskiv, I.; Brindza, J.; Wieczorek, P.P.; Lipok, J. Mentha Piperita: Essential Oil and Extracts, Their Biological Activities, and Perspectives on the Development of New Medicinal and Cosmetic Products. Molecules 2023, 28, 7444. [Google Scholar] [CrossRef] [PubMed]
  13. EMA/HMPC/283630/2012; Community Herbal Monograph on Camellia sinensis (L.) Kuntze, Non Fermentatum Folium. European Medicines Agency: Amsterdam, The Netherlands, 2012. Available online: https://www.ema.europa.eu/en/medicines/herbal/camelliae-sinensis-non-fermentatum-folium (accessed on 1 May 2025).
  14. Khan, N.; Mukhtar, H. Tea Polyphenols in Promotion of Human Health. Nutrients 2019, 11, 39. [Google Scholar] [CrossRef]
  15. EMA/HMPC/572705/2014; European Union Herbal Monograph on Mentha x piperita L., folium. European Medicines Agency: Amsterdam, The Netherlands, 2014. Available online: https://www.ema.europa.eu/en/medicines/herbal/menthae-piperitae-folium (accessed on 1 May 2025).
  16. Romeo-Arroyo, E.; Mora, M.; Noguera-Artiaga, L.; Vázquez-Araújo, L. Tea Pairings: Impact of Aromatic Congruence on Acceptance and Sweetness Perception. Curr. Res. Food Sci. 2023, 6, 100432. [Google Scholar] [CrossRef] [PubMed]
  17. Mair, V.H.; Hoh, E. The True History of Tea, 1st ed.; Thames & Hudson, Limited: London, UK, 2009. [Google Scholar]
  18. El Hassani, F.Z. Characterization, Activities, and Ethnobotanical Uses of Mentha Species in Morocco. Heliyon 2020, 6, e05480. [Google Scholar] [CrossRef]
  19. Malongane, F.; McGaw, L.J.; Mudau, F.N. The Synergistic Potential of Various Teas, Herbs and Therapeutic Drugs in Health Improvement: A Review. J. Sci. Food Agric. 2017, 97, 4679–4689. [Google Scholar] [CrossRef] [PubMed]
  20. Petersen, M.; Simmonds, M.S.J. Molecules of Interest Rosmarinic Acid. Phytochemistry 2003, 62, 121–125. [Google Scholar] [CrossRef] [PubMed]
  21. Ma, L.; Tang, L.; Yi, Q. Salvianolic Acids: Potential Source of Natural Drugs for the Treatment of Fibrosis Disease and Cancer. Front. Pharmacol. 2019, 10, 97. [Google Scholar] [CrossRef]
  22. Capasso, L.; De Masi, L.; Sirignano, C.; Maresca, V.; Basile, A.; Nebbioso, A.; Rigano, D.; Bontempo, P. Epigallocatechin Gallate (EGCG): Pharmacological Properties, Biological Activities and Therapeutic Potential. Molecules 2025, 30, 654. [Google Scholar] [CrossRef]
  23. Deng, S.; Zhang, G.; Olayemi Aluko, O.; Mo, Z.; Mao, J.; Zhang, H.; Liu, X.; Ma, M.; Wang, Q.; Liu, H. Bitter and Astringent Substances in Green Tea: Composition, Human Perception Mechanisms, Evaluation Methods and Factors Influencing Their Formation. Food Res. Int. 2022, 157, 111262. [Google Scholar] [CrossRef]
  24. Dimpfel, W.; Kler, A.; Kriesl, E.; Lehnfeld, R. Theogallin and L-Theanine as Active Ingredients in Decaffeinated Green Tea Extract: I. Electrophysiological Characterization in the Rat Hippocampus In-Vitro. J. Pharm. Pharmacol. 2010, 59, 1131–1136. [Google Scholar] [CrossRef] [PubMed]
  25. Kurin, E.; Mučaji, P.; Nagy, M. In Vitro Antioxidant Activities of Three Red Wine Polyphenols and Their Mixtures: An Interaction Study. Molecules 2012, 17, 14336–14348. [Google Scholar] [CrossRef]
  26. Cabrera, C.; Artacho, R.; Giménez, R. Beneficial Effects of Green Tea—A Review. J. Am. Coll. Nutr. 2006, 25, 79–99. [Google Scholar] [CrossRef]
  27. Atoui, A.K.; Mansouri, A.; Boskou, G.; Kefalas, P. Tea and Herbal Infusions: Their Antioxidant Activity and Phenolic Profile. Food Chem. 2005, 89, 27–36. [Google Scholar] [CrossRef]
  28. Frei, B.; Higdon, J.V. Antioxidant Activity of Tea Polyphenols In Vivo: Evidence from Animal Studies. J. Nutr. 2003, 133, 3275S–3284S. [Google Scholar] [CrossRef] [PubMed]
  29. Mckay, D.L.; Blumberg, J.B. A Review of the Bioactivity and Potential Health Benefits of Peppermint Tea (Mentha piperita L.). Phytother. Res. 2006, 20, 619–633. [Google Scholar] [CrossRef]
  30. Oh, J.; Jo, H.; Cho, A.R.; Kim, S.J.; Han, J. Antioxidant and Antimicrobial Activities of Various Leafy Herbal Teas. Food Control 2013, 31, 403–409. [Google Scholar] [CrossRef]
  31. Farooq, S.; Sehgal, A. Synergistic Antioxidant Interactions between Green Tea and Ocimum Gratissimum. Asian Pac. J. Trop. Biomed. 2019, 9, 333–338. [Google Scholar] [CrossRef]
  32. Uduwana, S.; Abeynayake, N.; Wickramasinghe, I. Synergistic, Antagonistic, and Additive Effects on the Resultant Antioxidant Activity in Infusions of Green Tea with Bee Honey and Citrus Limonum Extract as Additives. J. Agric. Food Res. 2023, 12, 100571. [Google Scholar] [CrossRef]
  33. Shevchenko, Y.; Helfert, J.; Hemmerich, I.; Smetanska, I. Influence of Stevia: Additives on Antioxidant Properties of Different Green Teas Influence of Stevia Additives on Antioxidant Properties of Different Green Teas. Agro FOOD Ind. Hi Tech. 2013, 24, 22–26. [Google Scholar]
  34. Salazar-Campos, J.; Salazar-Campos, O.; Gálvez-Ruiz, O.; Gavidia-Chávez, H.; Gavidia-Chávez, M.; Irigoin-Guevara, L.; Obregón-Domínguez, J. Functional Properties and Acceptability of Potentially Medicinal Tea Infusions Based on Equisetum Arvense, Desmodium Molliculum, and Mentha Piperita. Prev. Nutr. Food Sci. 2023, 28, 444–452. [Google Scholar] [CrossRef]
  35. Dorman, H.J.D.; Koşar, M.; Kahlos, K.; Holm, Y.; Hiltunen, R. Antioxidant Properties and Composition of Aqueous Extracts from Mentha Species, Hybrids, Varieties, and Cultivars. J. Agric. Food Chem. 2003, 51, 4563–4569. [Google Scholar] [CrossRef] [PubMed]
  36. DiLabio, G.A.; Johnson, E.R. Lone Pair-π and π-π Interactions Play an Important Role in Proton-Coupled Electron Transfer Reactions. J. Am. Chem. Soc. 2007, 129, 6199–6203. [Google Scholar] [CrossRef] [PubMed]
  37. Kedare, S.B.; Singh, R.P. Genesis and Development of DPPH Method of Antioxidant Assay. J. Food Sci. Technol. 2011, 48, 412–422. [Google Scholar] [CrossRef]
  38. Nenadis, N.; Wang, L.F.; Tsimidou, M.; Zhang, H.Y. Estimation of Scavenging Activity of Phenolic Compounds Using the ABTS•+ Assay. J. Agric. Food Chem. 2004, 52, 4669–4674. [Google Scholar] [CrossRef]
  39. Ilyasov, I.R.; Beloborodov, V.L.; Selivanova, I.A.; Terekhov, R.P. ABTS/PP Decolorization Assay of Antioxidant Capacity Reaction Pathways. Int. J. Mol. Sci. 2020, 21, 1131. [Google Scholar] [CrossRef] [PubMed]
  40. Rüweler, M.; Anker, A.; Gülden, M.; Maser, E.; Seibert, H. Inhibition of Peroxide-Induced Radical Generation by Plant Polyphenols in C6 Astroglioma Cells. Toxicol. Vitr. 2008, 22, 1377–1381. [Google Scholar] [CrossRef]
  41. Razzaghi-Asl, N.; Garrido, J.; Khazraei, H.; Borges, F.; Firuzi, O. Antioxidant Properties of Hydroxycinnamic Acids: A Review of Structure-Activity Relationships. Curr. Med. Chem. 2013, 20, 4436–4450. [Google Scholar] [CrossRef]
  42. Riachi, L.G.; De Maria, C.A.B. Peppermint Antioxidants Revisited. Food Chem. 2015, 176, 72–81. [Google Scholar] [CrossRef]
  43. Biskup, I.; Golonka, I.; Gamian, A.; Sroka, Z. Antioxidant activity of selected phenols estimated by ABTS and FRAP methods. Postep. Hig Med Dosw (Online) 2013, 67, 958–963. [Google Scholar] [CrossRef]
  44. PhBs. Pharmacopoea Bohemoslovaca, IV.; Avicenum: Praha, Czech Republic, 1987. [Google Scholar]
  45. Blois, M.S. Antioxidant Determinations by the Use of a Stable Free Radical. Nature 1958, 181, 1199–1200. [Google Scholar] [CrossRef]
  46. Re, R.; Pellegrini, N.; Proteggente, A.; Pannala, A.; Yang, M.; Rice-Evans, C. Antioxidant Activity Applying an Improved ABTS Radical Cation Decolorization Assay. Free Radic. Biol. Med. 1999, 26, 1231–1237. [Google Scholar] [CrossRef] [PubMed]
  47. Miranda-Rottmann, S.; Aspillaga, A.A.; Pérez, D.D.; Vasquez, L.; Martinez, A.L.F.; Leighton, F. Juice and Phenolic Fractions of the Berry Aristotelia Chilensis Inhibit LDL Oxidation in Vitro and Protect Human Endothelial Cells against Oxidative Stress. J. Agric. Food Chem. 2002, 50, 7542–7547. [Google Scholar] [CrossRef] [PubMed]
  48. Chou, T.C. Theoretical Basis, Experimental Design, and Computerized Simulation of Synergism and Antagonism in Drug Combination Studies. Pharmacol. Rev. 2006, 58, 621–681. [Google Scholar] [CrossRef]
  49. Bittner Fialová, S.; Gančár, M.; Kurin, E.; Dokupilová, S.; Gažová, Z.; Nagy, M. Oregano Polyphenols Reduce Human Insulin Amyloid Aggregation. Biomed. Pharmacother. 2025, 184, 117904. [Google Scholar] [CrossRef]
  50. European Pharmacopoeia 11. Available online: https://pheur.edqm.eu/subhome/11-6 (accessed on 30 January 2025).
Figure 1. IC50 (µg/mL) of antioxidant activity of GT, PM, and their mixtures. Ratios show the absolute contribution (part) of each extract, showing the share of each extract in the total dose producing 50% inhibition, based on their mixing proportions. “Lyo; GT:PM” refers to co-macerated in equal proportions, lyophilized blend. “Mix; GT:PM” refers to post-mixing of individually lyophilized extracts in a 3:2 ratio based on yield. Red dotted line indicates the IC50 value of PM alone, green dotted line indicates the IC50 value of GT alone. Corresponding r-values (goodness of fit to the median-effect model) are reported in Table 1, n = 4.
Ijms 26 06257 g001
Figure 2. Inhibition of intracellular oxidative stress of GT, PM, and their mixtures (DCF assay on NIH-3T3 cells). “Lyo; GT:PM” refers to co-macerated in equal proportions, lyophilized blend. “Mix; GT:PM” refers to post-mixing of individually lyophilized extracts in a 3:2 ratio based on yield. The bars represent the mean ± SD, n = 4; *** = p < 0.001, ** = p < 0.01, * = p < 0.05 for comparisons between the samples (ANOVA/Bonferroni).
Ijms 26 06257 g002
Figure 3. IC50 (µg/mL) of antioxidant activity of epigallocatechin-3-gallate (EGCG), quercetin (Q), rosmarinic acid (RA), and their equimolar mixtures. Ratios show the absolute contribution (part) of each extract, showing the share of each extract in the total dose producing 50% inhibition, based on their mixing proportions. Red dotted line indicates the IC50 value of EGCG alone, green dotted line indicates the IC50 value of Q alone, purple dotted line indicates the IC50 value of RA alone. Corresponding r-values (goodness of fit to the median-effect model) are reported in Table 3, n = 4.
Ijms 26 06257 g003
Table 1. Inhibitory activity of GT and PM extracts and mixtures against oxidative stress.
DPPHABTSDCF
IC50 µg/mLrIC50 µg/mLrIC50 µg/mLr
GT4.81 ± 0.310.922.70 ± 0.230.983.71 ± 0.250.96
PM6.69 ± 0.280.979.18 ± 0.650.983.80 ± 0.240.97
lyo; GT:PM5.53 ± 0.30
(3.32 + 2.21)
0.964.14 ± 0.32
(2.48 + 1.66)
0.983.59 ± 0.25
(2.15 + 1.44)
0.96
mix; GT:PM4.34 ± 0.28
(2.60 + 1.34)
0.954.24 ± 0.36
(2.54 + 1.70)
0.976.83 ± 0.49
(4.10 + 2.73)
0.96
IC50 values were calculated via CompuSyn software version 1.0.1. Numbers in parentheses indicate absolute contribution of each component in mixtures, showing the share of each extract in the total dose producing 50% inhibition, based on their mixing proportions. “Lyo; GT:PM” refers to co-macerated in equal proportions, lyophilized blend. “Mix; GT:PM” refers to post-mixing of individually lyophilized extracts in a 3:2 ratio based on yield. Data are presented as mean ± SE, n = 4.
Table 2. Interaction effect, combination index (CI), SDA, and DRI values of equimolar combinations of polyphenols at IC50 level.
DPPHABTSDCF
CombinationInteraction EffectCISDADRI GT:MPInteraction EffectCISDADRI GT:MPInteraction EffectCISDADRI GT:MP
lyo; GT:PMNearly additive0.99±0.012.42:1.74Nearly additive0.99±0.021.30:4.44Nearly additive0.96±0.021.72:2.65
mix; GT:PMSlight synergism0.80±0.013.85:1.84Nearly additive1.02±0.031.27:4.33Antagonism1.83±0.040.91:1.39
CI values indicate interaction type: CI < 1—synergism, CI ≈ 1—additivity, CI > 1—antagonism. DRI represents the fold dose reduction in mixtures compared to individual use. SDA involved the stepwise removal of one compound to assess its contribution. Values were calculated using CompuSyn software version 1.0.1. “Lyo; GT:PM”: co-macerated and lyophilized together. “Mix; GT:PM”: individual extracts lyophilized separately, then combined in 3:2 ratio based on yields.
Table 3. Radical scavenging activity of polyphenols epigallocatechin gallate (EGCG), quercetin (Q), and rosmarinic acid (RA) and their equimolar mixtures assessed by DPPH and ABTS assays.
DPPHABTS
IC50 µMIC50 µg/mLrIC50 µMIC50 µg/mLr
EGCG5.28 ± 0.312.420.972.68 ± 0.161.230.97
Q16.11 ± 0.274.870.993.36 ± 0.191.020.98
RA17.90 ± 0.346.450.994.44 ± 0.291.600.97
Q + EGCG6.91 ± 0.38
(3.46 + 3.46)
2.58
(1.00 + 1.58)
0.973.09 ± 0.07
(1.55 + 1.55)
1.18
(0.47 + 0.71)
0.99
Q + RA12.02 ± 0.28
(6.01 + 6.01)
3.99
(1.82 + 2.17)
0.993.12 ± 0.16
(1.56 + 1.56)
1.03
(0.47 + 0.56)
0.98
RA + EGCG6.24 ± 0.35
(3.12 + 3.12)
2.55
(1.12 + 1.43)
0.983.28 ± 0.14
(1.64 + 1.64)
1.34
(0.59 + 0.75)
0.98
Q + RA + EGCG6.56 ± 0.36
(2.19 + 2.19 + 2.19)
2.44
(0.66 + 0.78 + 1.00)
0.972.86 ± 0.08
(0.95 + 0.95 + 0.95)
1.07
(0.29 + 0.34 + 0.44)
0.99
IC50 values were calculated via CompuSyn software version 1.0.1. Numbers in parentheses indicate the absolute contribution of each component in the mixtures, showing the share of each extract in the total dose producing 50% inhibition, based on their mixing proportions. Data shown as mean ± SE, n = 4.
Table 4. Interaction effect, combination index (CI), SDA, and DRI values of equimolar mixtures of epigallocatechin-3-gallate (EGCG), quercetin (Q), and rosmarinic acid (RA) at the IC50 level.
DPPHABTS
CombinationsInteraction EffectCISDADRIInteraction EffectCISDADRI
Q + EGCGSlight synergism0.87±0.014.66:1.53Moderate antagonism1.40±0.012.17:1.73
Q + RAModerate synergism0.70±0.0032.68:2.98Moderate synergism0.82±0.012.15:2.85
RA + EGCGModerate synergism0.76±0.015.74:1.69Nearly additive0.98±0.012.71:1.64
Q + RA + EGCGSynergism0.67±0.017.36:8.18:2.41Slight synergism0.86±0.013.58:4.65:2.81
CI values indicate interaction type: CI < 1—synergism, CI ≈ 1—additivity, CI > 1—antagonism. DRI represents the fold dose reduction in mixtures compared to individual use. SDA involved stepwise removal of one compound to assess its contribution. Values were calculated using CompuSyn software version 1.0.1.
Table 5. Polar phenolics in PM and GT extracts: retention times (TR), molecular ions [M-H]¯, and MS2 fragments, and quantitative content (μg/mL).
PeakTR (min)[M-H] (m/z)MS2
(20 eV) (m/z)
Identified CompoundMass Concentration ppm (μg/mL) *
PM
16.693179.149135Caffeic acid22.7
29.507353.0858191Chlorogenic acid20.2
39.873563.0689436/281/237/1934′,7-Dimethoxyflavone35.1
415.807637.1032351/285Luteolin-7-diglucuronide23.6
516.380459.15172975-Hydroxy-4′,7-dimethoxyflavone-5-glucosideLOQ
618.668537.1056493/295Lithospermic acid138.7
720.280595.1680459/287Eriodictyol-7-O-rutinoside (eriocitrin)196.6
820.687593.34285.0407Luteolin-7-O-rutinoside262.4
922.867717.1491519/439/321/295/179/135Salvianolic acid L/B168.5
1024.947577.37269Apigenin-7-O-rutinoside (isorhoifolin)128.6
1125.267359.19197/161/135Rosmarinic acid326.0
1228.318609.33301/325/284Hesperetin-7-O-rutinoside (hesperidin)97.0
1328.457607.36299.0554/284.0334Diosmetin-7-O-rutinoside (diosmin)144.1
1429.846717.1480537/519/493/321/295Salvianolic acid B/L215.0
1536.376715.1307535/293Salvianolic acid C derivative62.8
GT
14.773343.0680191Theogallin152.9
25.513169.0145125/107Gallic acid80.1
38.340153.0191327/125/124/123/109/1082,5-Dihydroxybenzoic acid82.5
48.847305.0677611/167/125Gallocatechin24.6
59.533353.0887191/179/135/161Chlorogenic acid54.7
612.100305.0673611/165/139/137/125Epigallocatechin (EC)97.2
712.320353.0889707/191/1615-O-Caffeoylquinic acid (derivative)77.9
812.927353.0887191/173/135Cryptochlorogenic acid109.7
913.493633.0355463/349/300Monogalloyl-HHDP-glucose75.1
1013.980471.0588427/275/169Epigallocatechin 3-O-(3′-O-methyl)gallate207.6
1115.573337.0933191/163/173/119p-Coumaroylquinic acid95.2
1216.407289.0729245/203/151(+)-Catechin (cinidianol)108.6
1316.860457.0796305/219/193/169Epigallocatechin gallate (EGCG)249.7
1417.827457.0791331/305/169Gallocatechin gallate (GCG)47.1
1519.053479.0847316/271/151Unidentified45.6
1621.947441.0894289/245/169(+)-Catechin gallate (CG)182.8
1722.213609.0904463/301/169Rutin70.4
1824.267593.1519285/257/163Kaempferol-3-rutinoside18.6
1927.067447.0943301/151/145Quercetin rhamnoside14.1
2035.447516.1395301/125UnidentifiedLOD
* Values (μg/mL infusions) are presented as means. External standard: Rosmarinic acid (λ = 280 nm); LOQ–limit of quantification; LOD–limit of detection.
Table 6. Total content * (%) of tannins, hydroxycinnamic derivatives, and flavonoids in PM and GT extracts and their mixtures.
SampleTHD (%)Total PolyphenolsTanninsFlavonoids
λ = 392 nm
Flavonoids
λ = 420 nm
PM18.9 ± 0.223.0 ± 0.316.1 ± 0.32.8 ± 0.10.6 ± 0.02
GT4.7 ± 0.129.8 ± 0.218.8 ± 0.30.5 ± 0.010.5 ± 0.01
lyo; GT:PM12.6 ± 0.226.3 ± 0.318.1 ± 0.11.0 ± 0.010.4 ± 0.01
mix; GT:PM9.5 ± 0.227.0 ± 0.318.6 ± 0.41.1 ± 0.010.5 ± 0.01
* Average value in % (n = 3).
Table 7. Combination index range based on the log (CI) grading scale.
InteractionCI ScaleInterpretation
Synergism<0.1Very strong synergism
0.1–0.3Strong synergism
0.3–0.7Synergism
0.7–0.85Moderate synergism
0.85–0.90Slight synergism
Additivity0.90–1.10Nearly additive
Antagonism1.10–1.20Slight antagonism
1.20–1.45Moderate antagonism
1.45–3.3Antagonism
3.3–10Strong antagonism
>10Very strong antagonism
Disclaimer/Publisher’s Note: The statements, opinions and data contained in all publications are solely those of the individual author(s) and contributor(s) and not of MDPI and/or the editor(s). MDPI and/or the editor(s) disclaim responsibility for any injury to people or property resulting from any ideas, methods, instructions or products referred to in the content.

