Article

Clinical and Transcriptomic Characterization of Metastatic Hormone-Sensitive Prostate Cancer Patients with Low PTEN Expression

by
Marta Garcia de Herreros
1,2,3,4,†,
Natalia Jiménez
1,†,
Joan Padrosa
1,2,4,5,
Caterina Aversa
1,2,3,
Laura Ferrer-Mileo
1,2,3,4,
Samuel García-Esteve
1,4,
Leonardo Rodríguez-Carunchio
3,6,
Isabel Trias
3,6,
Laia Fernández-Mañas
1,2,3,
Mercedes Marín-Aguilera
1,
Mariana Altamirano
2,
Manuel Mazariegos
1,2,3,
Albert Font
7,
Alejo Rodriguez-Vida
8,
Miguel Ángel Climent
9,
Sara Cros
10,
Isabel Chirivella
11,
Mariona Figols
12,
Núria Sala-González
13,
Vicenç Ruiz de Porras
14,
Juan Carlos Pardo
7,
Aleix Prat
1,2,4,
Òscar Reig
1,2,3,4,* and
Begoña Mellado
1,2,3,4,*
add Show full author list remove Hide full author list
1
Translational Genomics and Targeted Therapeutics in Solid Tumors Lab, Fundació de Recerca Clínic Barcelona—Institut d’Investigacions Biomèdiques August Pi i Sunyer (FRCB-IDIBAPS), 08036 Barcelona, Spain
2
Medical Oncology Department, Hospital Clínic, 08036 Barcelona, Spain
3
Uro-Oncology Unit, Hospital Clínic, University of Barcelona, 08036 Barcelona, Spain
4
Department of Medicine, University of Barcelona, 08036 Barcelona, Spain
5
Centro de Investigación Biomédica en Red de Enfermedades Raras (CIBERER), Instituto de Salud Carlos III, 28029 Madrid, Spain
6
Department of Pathology, Hospital Clínic, 08036 Barcelona, Spain
7
Medical Oncology Department, Institut Català d’Oncologia, Hospital Germans Trias i Pujol, 08916 Badalona, Spain
8
Medical Oncology Department, Hospital del Mar, 08003 Barcelona, Spain
9
Medical Oncology Service, Instituto Valenciano de Oncología (IVO), 46009 Valencia, Spain
10
Medical Oncology Department, Hospital General de Granollers, 08402 Barcelona, Spain
11
Department of Medical Oncology, Hospital Clínico Universitario de Valencia, INCLIVA, University of Valencia, 46010 Valencia, Spain
12
Medical Oncology Department, Fundació Althaia, Xarxa Assistencial Universitària de Manresa, 08242 Manresa, Spain
13
Department of Medical Oncology, Institut Català d’Oncologia, 17007 Girona, Spain
14
Badalona Applied Research Group in Oncology (B-ARGO), Institut Català d’Oncologia, 08916 Germans Trias i Pujol Badalona, Spain
*
Authors to whom correspondence should be addressed.
These authors contributed equally to this work.
Int. J. Mol. Sci. 2025, 26(13), 6244; https://doi.org/10.3390/ijms26136244
Submission received: 30 May 2025 / Revised: 25 June 2025 / Accepted: 25 June 2025 / Published: 28 June 2025
(This article belongs to the Special Issue Molecular Research on Prostate Cancer)

Abstract

Alterations in the PTEN tumor suppressor gene are common in prostate cancer. They have been associated with a more aggressive disease and poor outcomes and potential benefit of targeted therapies. The purpose of this work is to study the clinical and transcriptional landscapes associated to low PTEN mRNA expression in metastatic hormone-sensitive prostate cancer (mHSPC) patients. A multicenter biomarker ambispective study was performed in mHSPC patients. PTEN mRNA expression was assessed by nCounter in formalin-fixed paraffin-embedded tumor samples. PTENlow status was defined by a previously validated cut-off and was correlated with castration-resistant prostate cancer (CRPC)-free survival (CRPC-FS) (primary endpoint) and overall survival (OS). RNA-Seq was performed to molecularly characterize PTENlow vs. PTENwt tumors. A total of 380 patients were included, 350 eligible. PTENlow was observed in 28.2% of patients and was independently associated with shorter CRPC-FS (HR 1.6, 95% CI 1.2–2.1, p = 0.002) and OS (HR 1.5, 95% CI 1.1–2, p = 0.014). PTENlow tumors showed overexpression of neuroendocrine, cell cycle, and DNA repair gene signatures, reduced expression of the androgen receptor pathway, and a distinct immune microenvironment. Using microarray data from the CHAARTED trial, we developed a PTEN-low related signature, independently associated with CRPC-FS (HR 1.5, 95% CI 1–2.3, p = 0.036) and OS (HR 1.9, C1 1.2–2.9, p = 0.005), and identified targets for potential therapies in PTEN-altered tumors. We conclude that PTENlow correlates with an aggressive clinical outcome in mHSPC patients and is associated with a unique transcriptional profile. These findings further support the investigation of novel therapeutic strategies for patients with PTEN alterations.

Graphical Abstract

1. Introduction

The survival of patients with metastatic prostate cancer (PC) has significantly improved in recent years due to the introduction of combination therapies, including androgen deprivation therapy (ADT) with docetaxel (D), androgen receptor signaling inhibitors (ARSI), or triplet therapy (ADT + ARSI + D) as first-line treatment for metastatic hormone-sensitive prostate cancer (mHSPC) [1,2,3,4,5,6,7,8].
Despite the lack of biomarkers to effectively guide clinical decisions in mHSPC patients, recent research suggests that alterations in the tumor suppressor genes phosphatase and tensin homolog (PTEN), RB1, and TP53 are associated to an aggressive clinical course [9,10]. This highlights the need for a deeper understanding of the molecular landscape and the development of distinct treatment strategies for this subgroup of patients. Notably, promising results have recently been reported for the combination of abiraterone in PTEN-deficient de novo metastatic mHSPC patients [11]. PTEN is a key tumor suppressor in PC, encoding a dual-specificity phosphatase that negatively regulates the PI3K/AKT signaling pathway [12]. Functioning as a tumor suppressor, PTEN exerts its influence by dephosphorylating phosphatidylinositol (3,4,5)-trisphosphate (PIP3), thereby antagonizing the pro-survival and pro-growth signals mediated by the PI3K pathway that regulate a wide range of cellular processes such as growth, proliferation, survival, motility, and metabolism [12,13]. PTEN loss, observed in 20–40% of PC, encompasses a high variety of alterations, such as genomic deletions of either one or both copies of the PTEN gene, loss of function mutations, epigenetic modulation, and post-translational modifications that lead to reduced PTEN levels [14]. The final consequence is an aberrant activation of the PI3K/AKT pathway enhancing PC proliferation and preventing apoptosis [13]. Several studies indicate that the loss of PTEN along with the aberrant activation of PI3K/AKT pathway could be implicated in ARSI and taxane resistance, particularly within the context of castration-resistant prostate cancer (CRPC) [15,16].
Alterations in PTEN become more frequent as the disease progresses, with rates around 15–20% in localized tumors, 30–40% in mHSPC, and up to 50% in advanced CRPC [9,14,17]. In all three settings PTEN loss has been associated with worse outcomes and decreased survival rate [9,10,14,17,18,19,20]. In our previous work, we showed that low PTEN mRNA expression in tumor samples detected by nCounter correlated with PTEN mutations and protein expression assessed by immunohistochemistry (IHC), as well as with poor clinical outcomes of mHSPC patients [10]. The adverse prognostic value of PTEN mRNA expression was also reported in a large cohort of patients from the STAMPEDE trial, where PTEN loss signatures were prognostic for shorter overall survival (OS) [21] but not predictive of abiraterone benefit. In the present work, we validate the prognostic role of PTEN expression in a larger series of mHSPC patients. Additionally, we performed a transcriptional characterization of PTENlow tumors and developed a PTEN-low related gene signature that also predicts adverse clinical outcomes in mHSPC. We discuss the more relevant transcriptional findings and propose potential therapeutic interventions.

2. Results

2.1. Patients and Samples

A total of 380 patients were included in this study: 355 were eligible and 25 (7%) were excluded because of insufficient tumor sample (n = 11) or lack of RNA availability (n = 14). Most formalin-fixed paraffin-embedded (FFPE) samples were obtained from the primary tumor (95.5%) and the remainder from metastatic sites. Of the included patients, 125 were treated with ADT + D, 137 with ADT + ARSI, and 93 with ADT alone. The group of patients treated with ADT + D presented higher levels of prostate-specific antigen (PSA) at diagnosis (p < 0.001) and higher frequency of de novo stage IV (92.8%, p < 0.001) and high-volume disease (77.6%, p < 0.001) (Table S1). The median follow-up was 41.4 months (2.4–223.5), 241 patients (67.9%) developed CRPC, and 219 died (61.7%). Median CRPC-free survival CRPC-FS and OS were 23.9 (95% CI 20.6–28.9) and 49.1 months (95% CI 43.9–58.1), respectively. Table S2 separately shows the clinical characteristics, median follow-up time, the rate of CRPC, and death per treatment group.

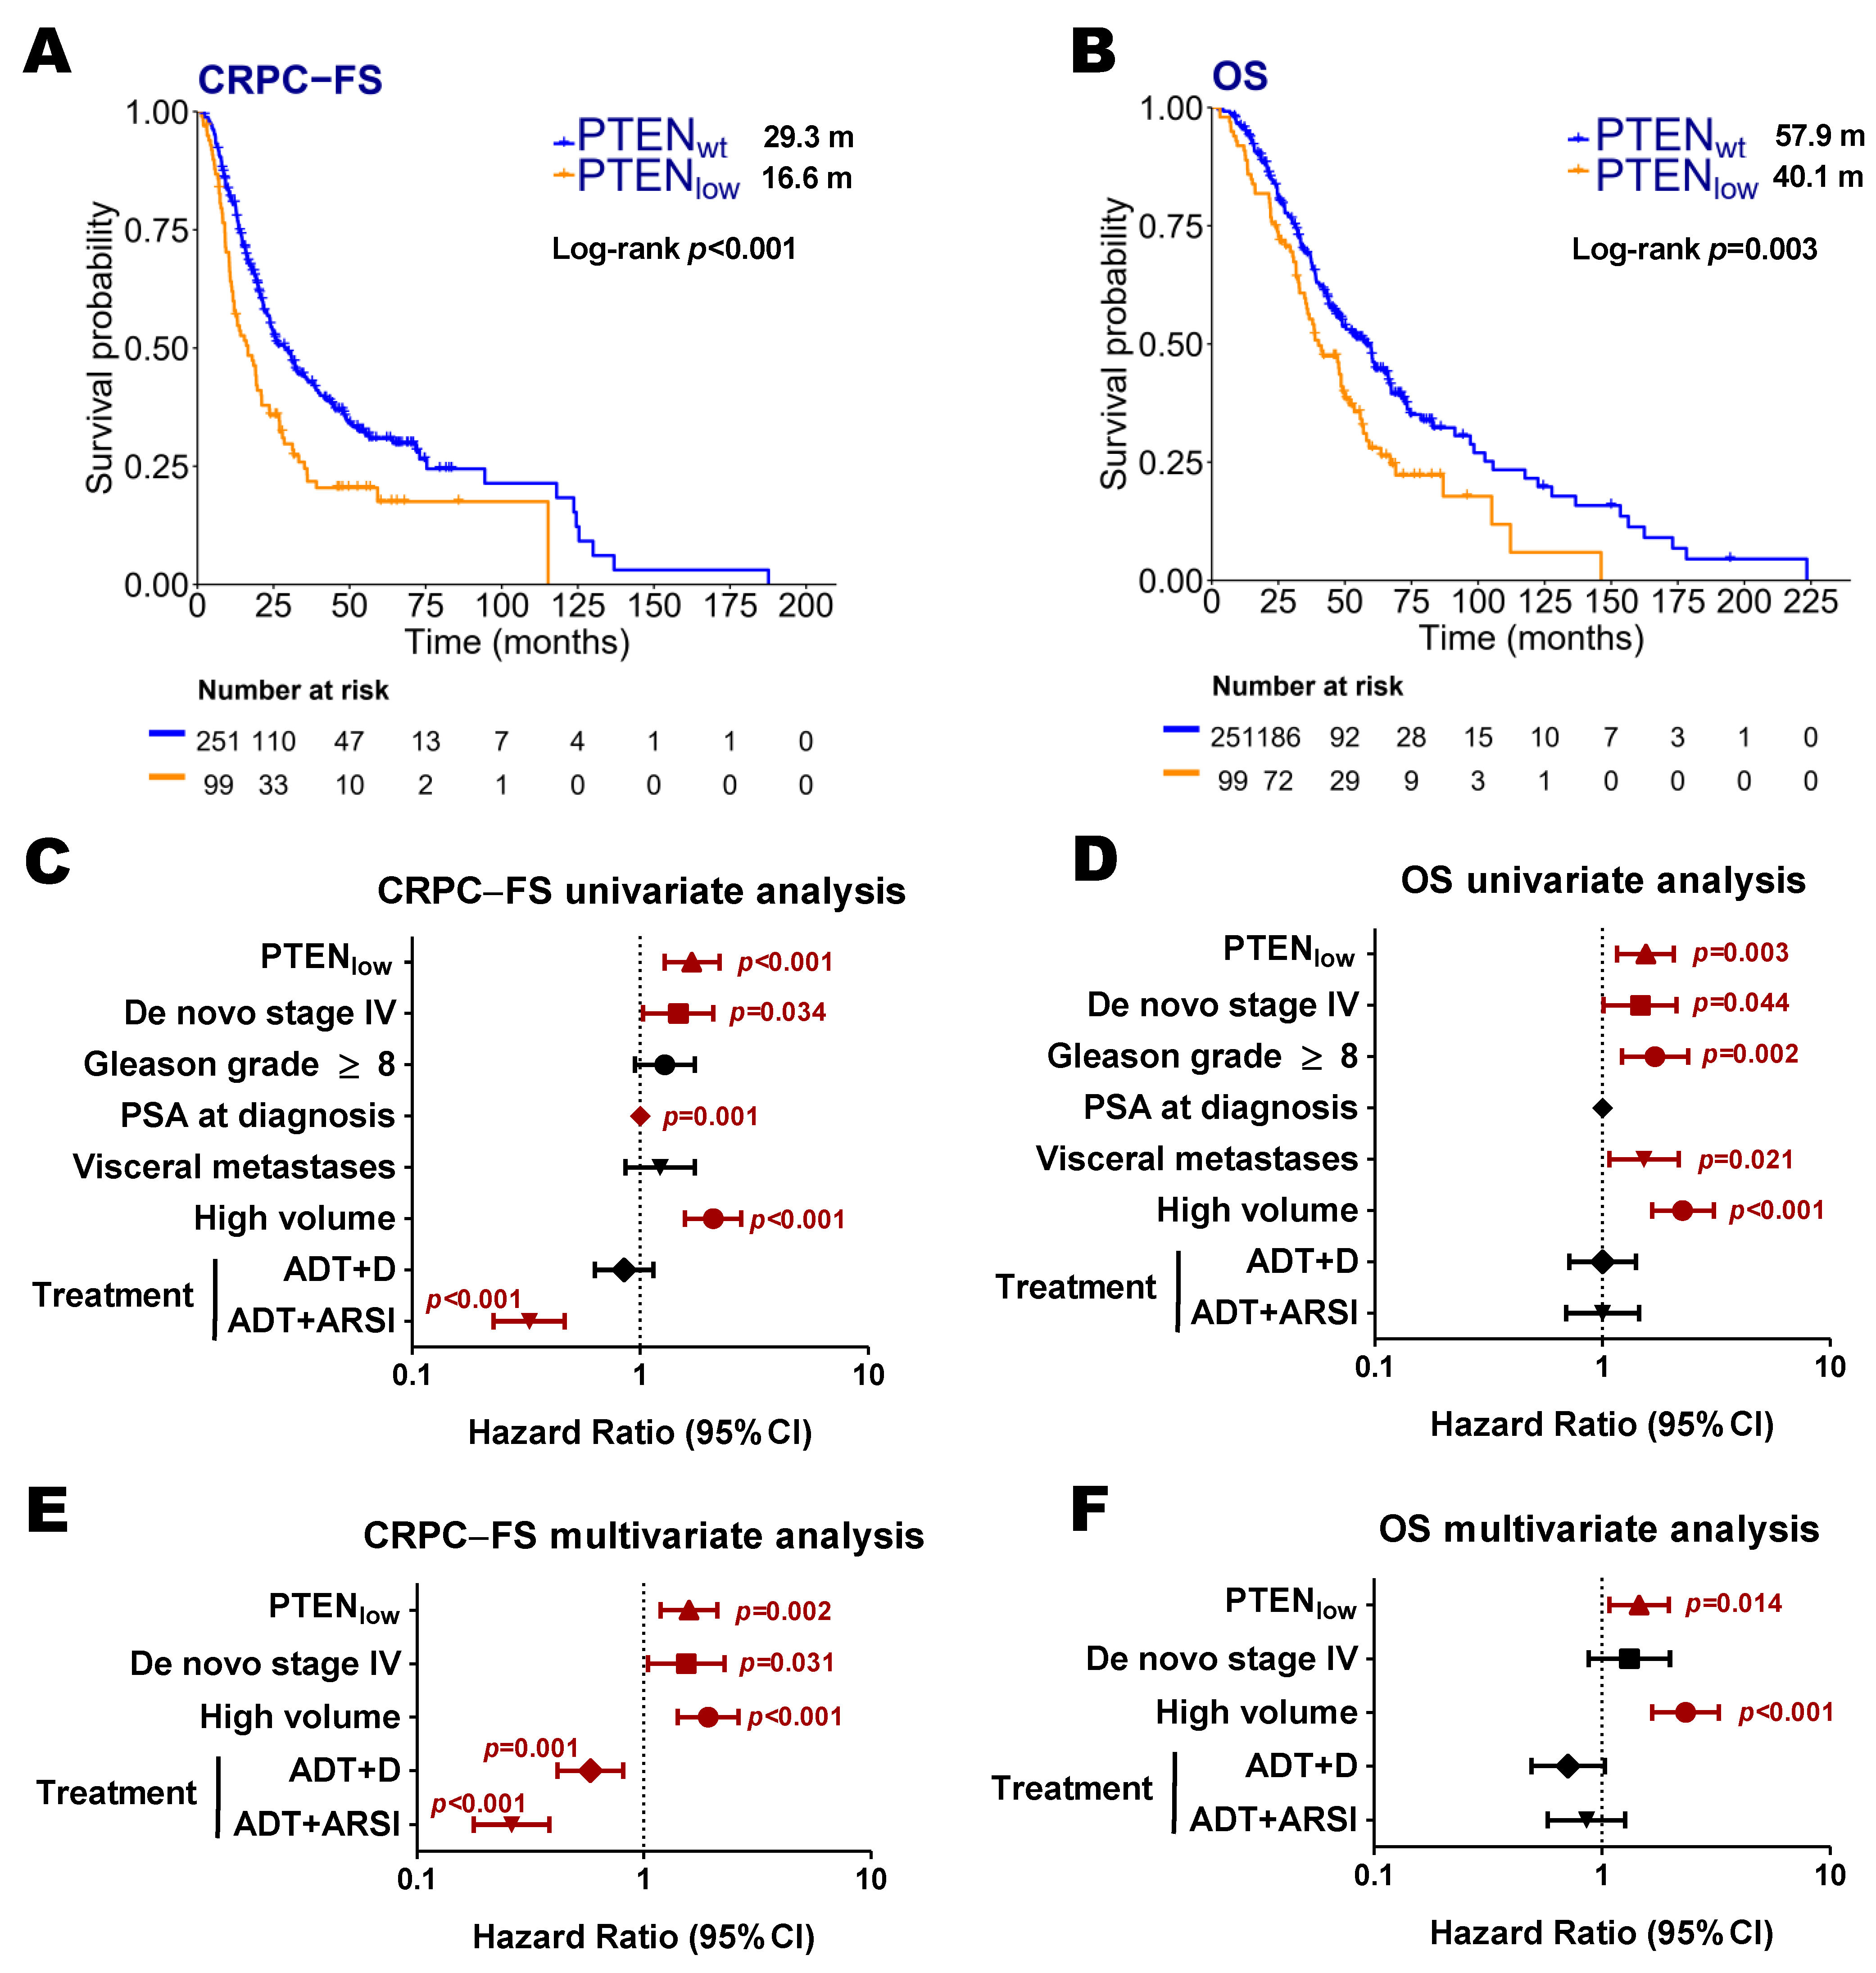
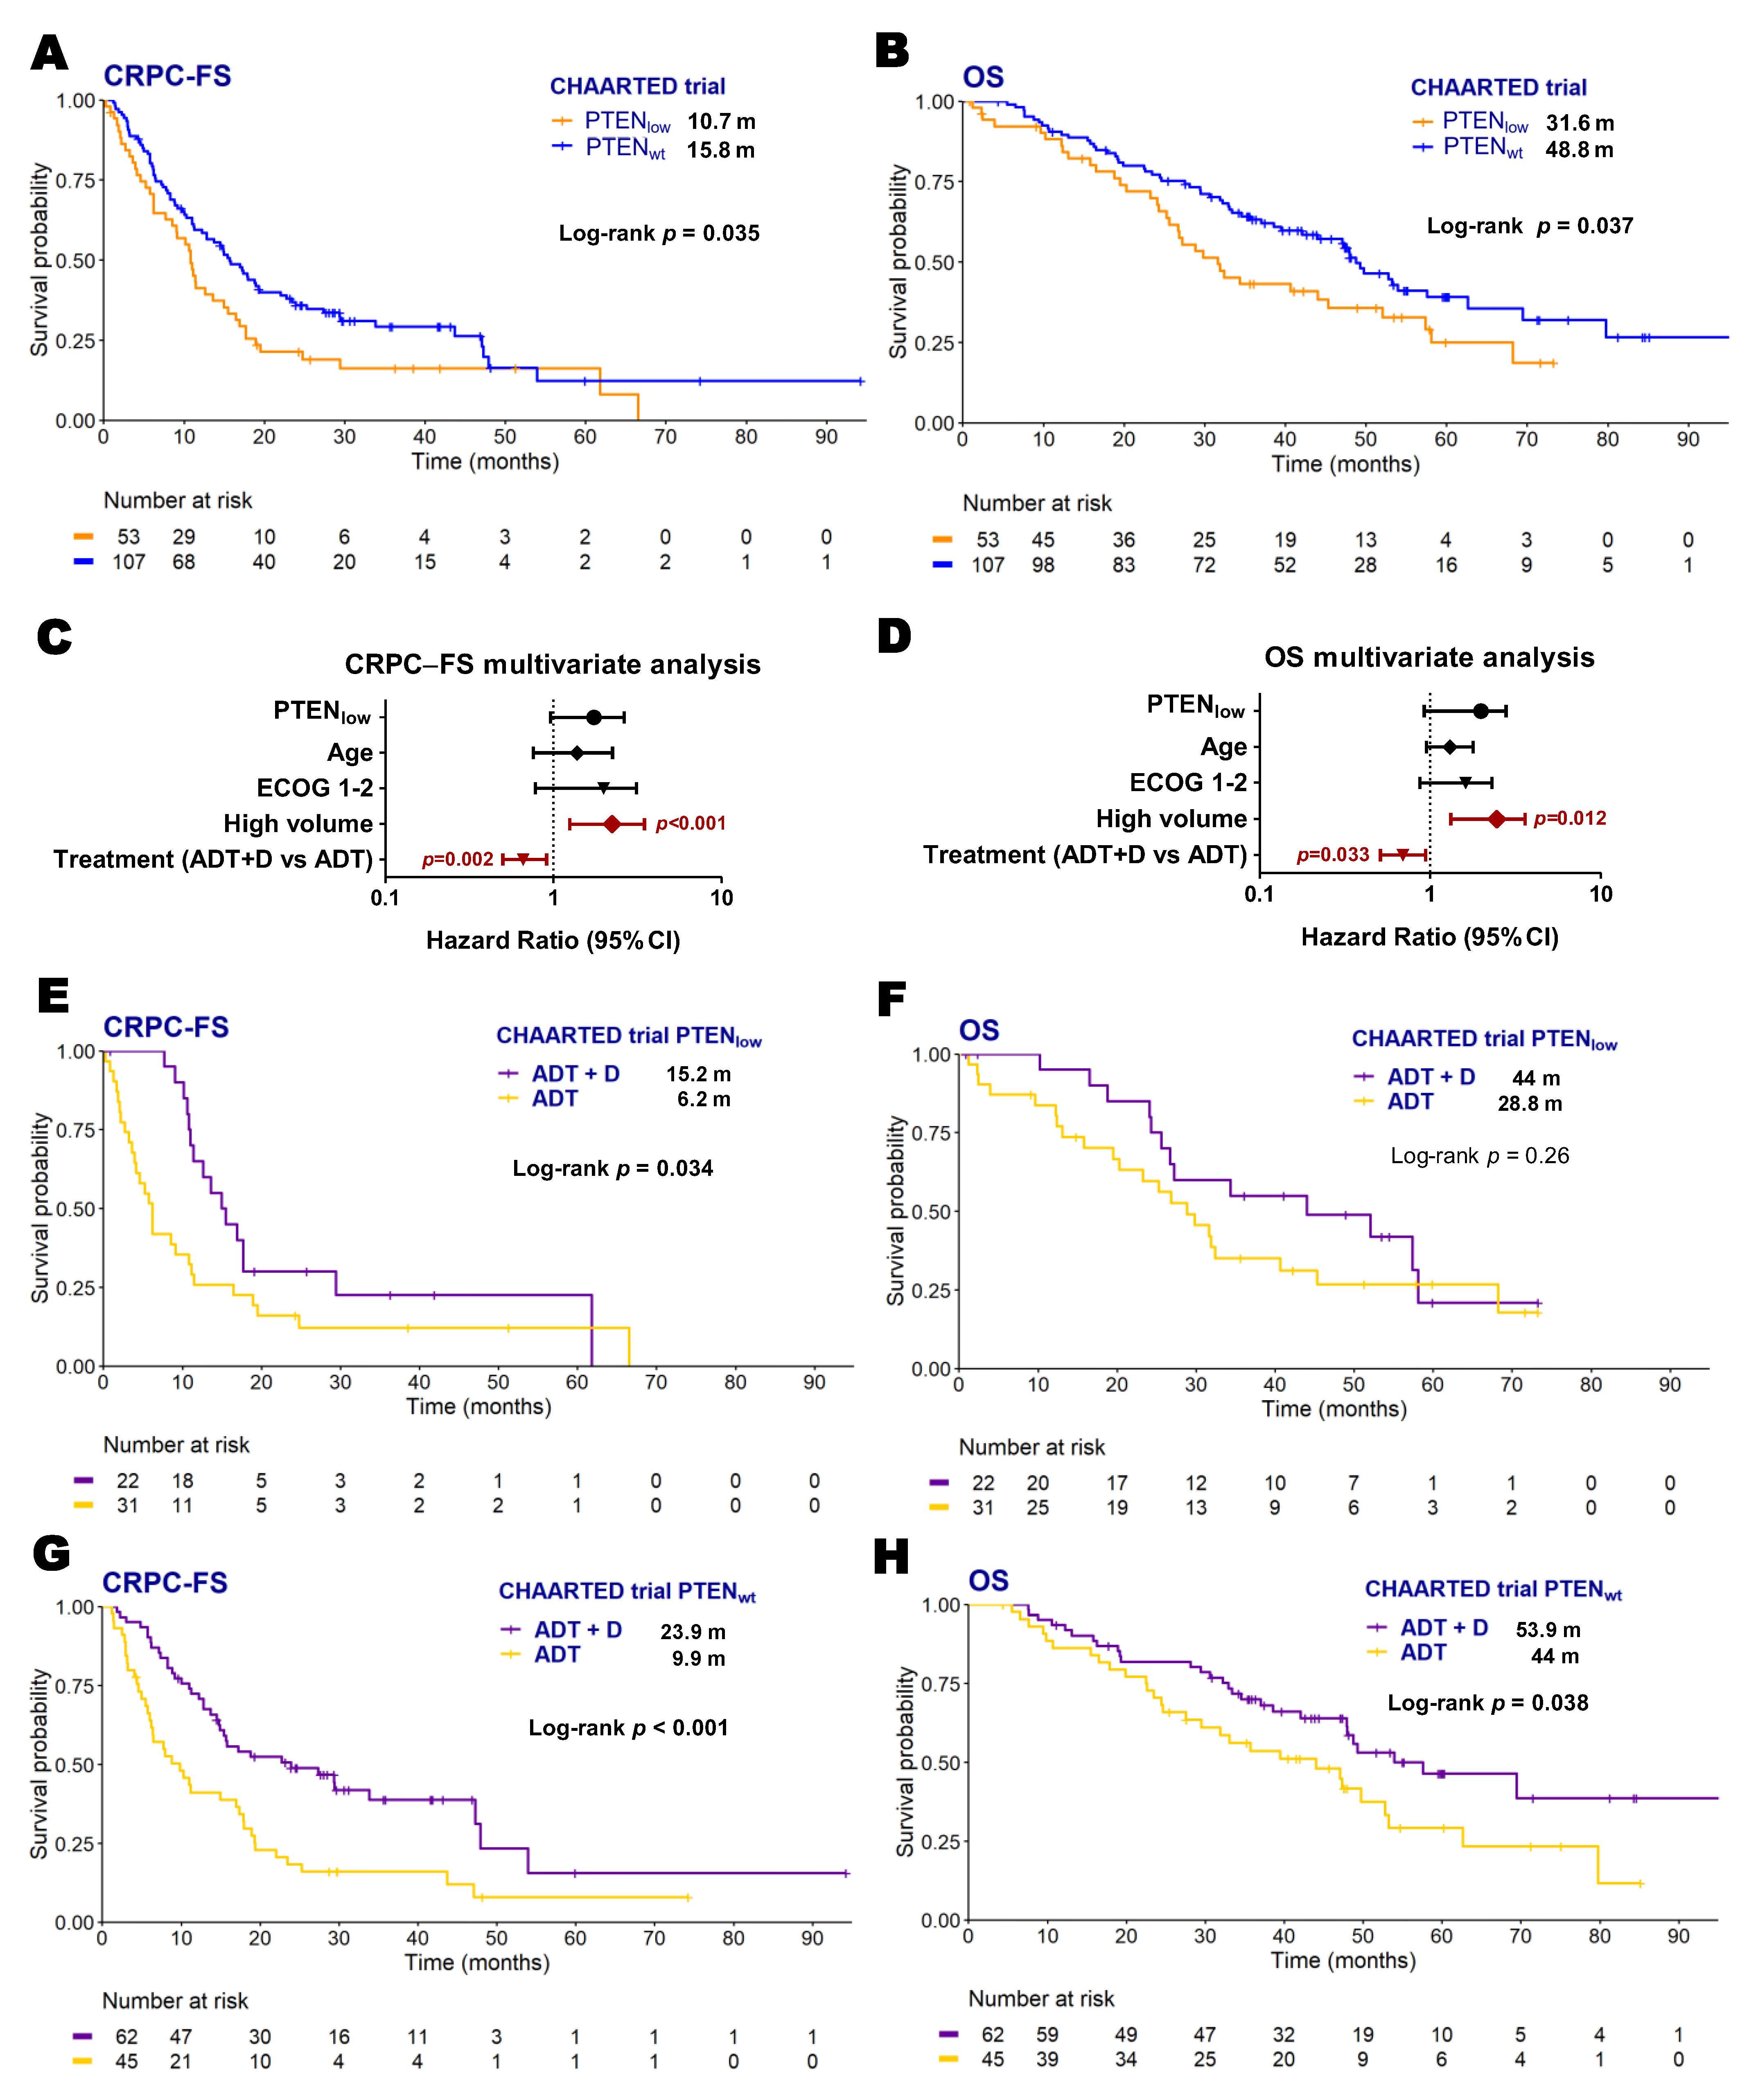
2.2. PTEN Expression and Clinical Evolution

Overall, 100 patients (28.2%) were considered PTENlow using our previously validated expression cut-off (33.3% in ADT, 28% in ADT + D, and 24.8% in ADT + ARSI cohorts). PTENlow patients did not exhibit significant differences in clinical or biological characteristics (Gleason, PSA, or lactate dehydrogenase [LDH] levels) with respect to those with PTENwt. Table 1 and Table S3 summarize clinical characteristics of all patients and each treatment cohort by PTEN status, respectively.
In our series, PTENlow was associated with shorter CRPC-FS (16.6 vs. 29.3 months; Hazard ratio [HR] 1.7, 95% confidence interval [CI] 1.3–2.2, p < 0.001) and OS (40.1 vs. 57.9 months; HR 1.5, 95% CI 1.2–2.1, p = 0.003) (Figure 1A–D). In the multivariate analysis, PTENlow was independently associated with lower CRPC-FS (HR 1.6, 95% CI 1.2–2.1, p = 0.002) and OS (HR 1.5, 95% CI 1.1–2, p = 0.014) (Figure 1E,F).
Regarding each treatment series separately, PTENlow was correlated with shorter CRPC-FS and OS in the ADT cohort (14.6 vs. 18.6 months; HR 1.7, 95% CI 1.1–2.8, p = 0.019; 41.4 vs. 49.1 months; HR 1.6, 95% CI 1–2.6, p = 0.042, respectively) and in the ADT + D cohort (12.1 vs. 21.9 months; HR 1.8, 95% CI 1.2–2.8, p = 0.006; 38.8 vs. 60.1 months; HR 1.7, 95% CI 1–2.7, p = 0.032, respectively). In the ADT and ADT + D cohorts, PTENlow was independently associated with shorter CRPC-FS (HR 1.6, 95% CI 1–2.6, p = 0.047; HR 1.7, 95% CI 1.1–2.8, p = 0.029, respectively) (Figures S1 and S2). The ADT + ARSI cohort, with fewer events, exhibited a trend towards shorter CRPC-FS (Figure S3). The interaction test showed no significant interaction between PTENlow and treatment for CPRC-FS (p = 0.966 and p = 0.631 for ADT + D and ADT + ARSI vs. ADT, respectively) and OS (p = 0.99 and p = 0.61 for ADT + D and ADT + ARSI vs. ADT, respectively).
To validate our results, we analyzed microarray data from 160 patients included in CHAARTED clinical trial as an independent cohort [19] where 53 patients (32.7%) were classified as PTENlow. As observed in our series, in the univariate analysis, PTENlow patients had worse CRPC-FS (10.7 vs. 15.8 months; HR 2.2, 95% CI 1.1–4.3, p = 0.033) and OS (31.6 vs. 48.8 months; HR 2.2, 95% CI 1–4.5, p = 0.039) than PTENwt patients (Figure 2A–D). However, PTEN status was not independently associated to outcome in this series. PTENlow patients treated with ADT + D presented longer CRPC-FS compared to those treated with ADT alone (15.2 vs. 6.2 months; HR 1.9, 95% CI 1.2–3.6, p = 0.034) (Figure 2E,F). However, PTENwt patients treated with ADT + D presented a significant longer CRPC-FS (23.9 vs. 9.9 months; HR 2.2, 95% CI 1.4–3.4, p < 0.001) and OS (53.9 vs. 44 months; HR 1.7, 95% CI 1–2.9, p = 0.038) compared to those treated with ADT alone (Figure 2G,H).

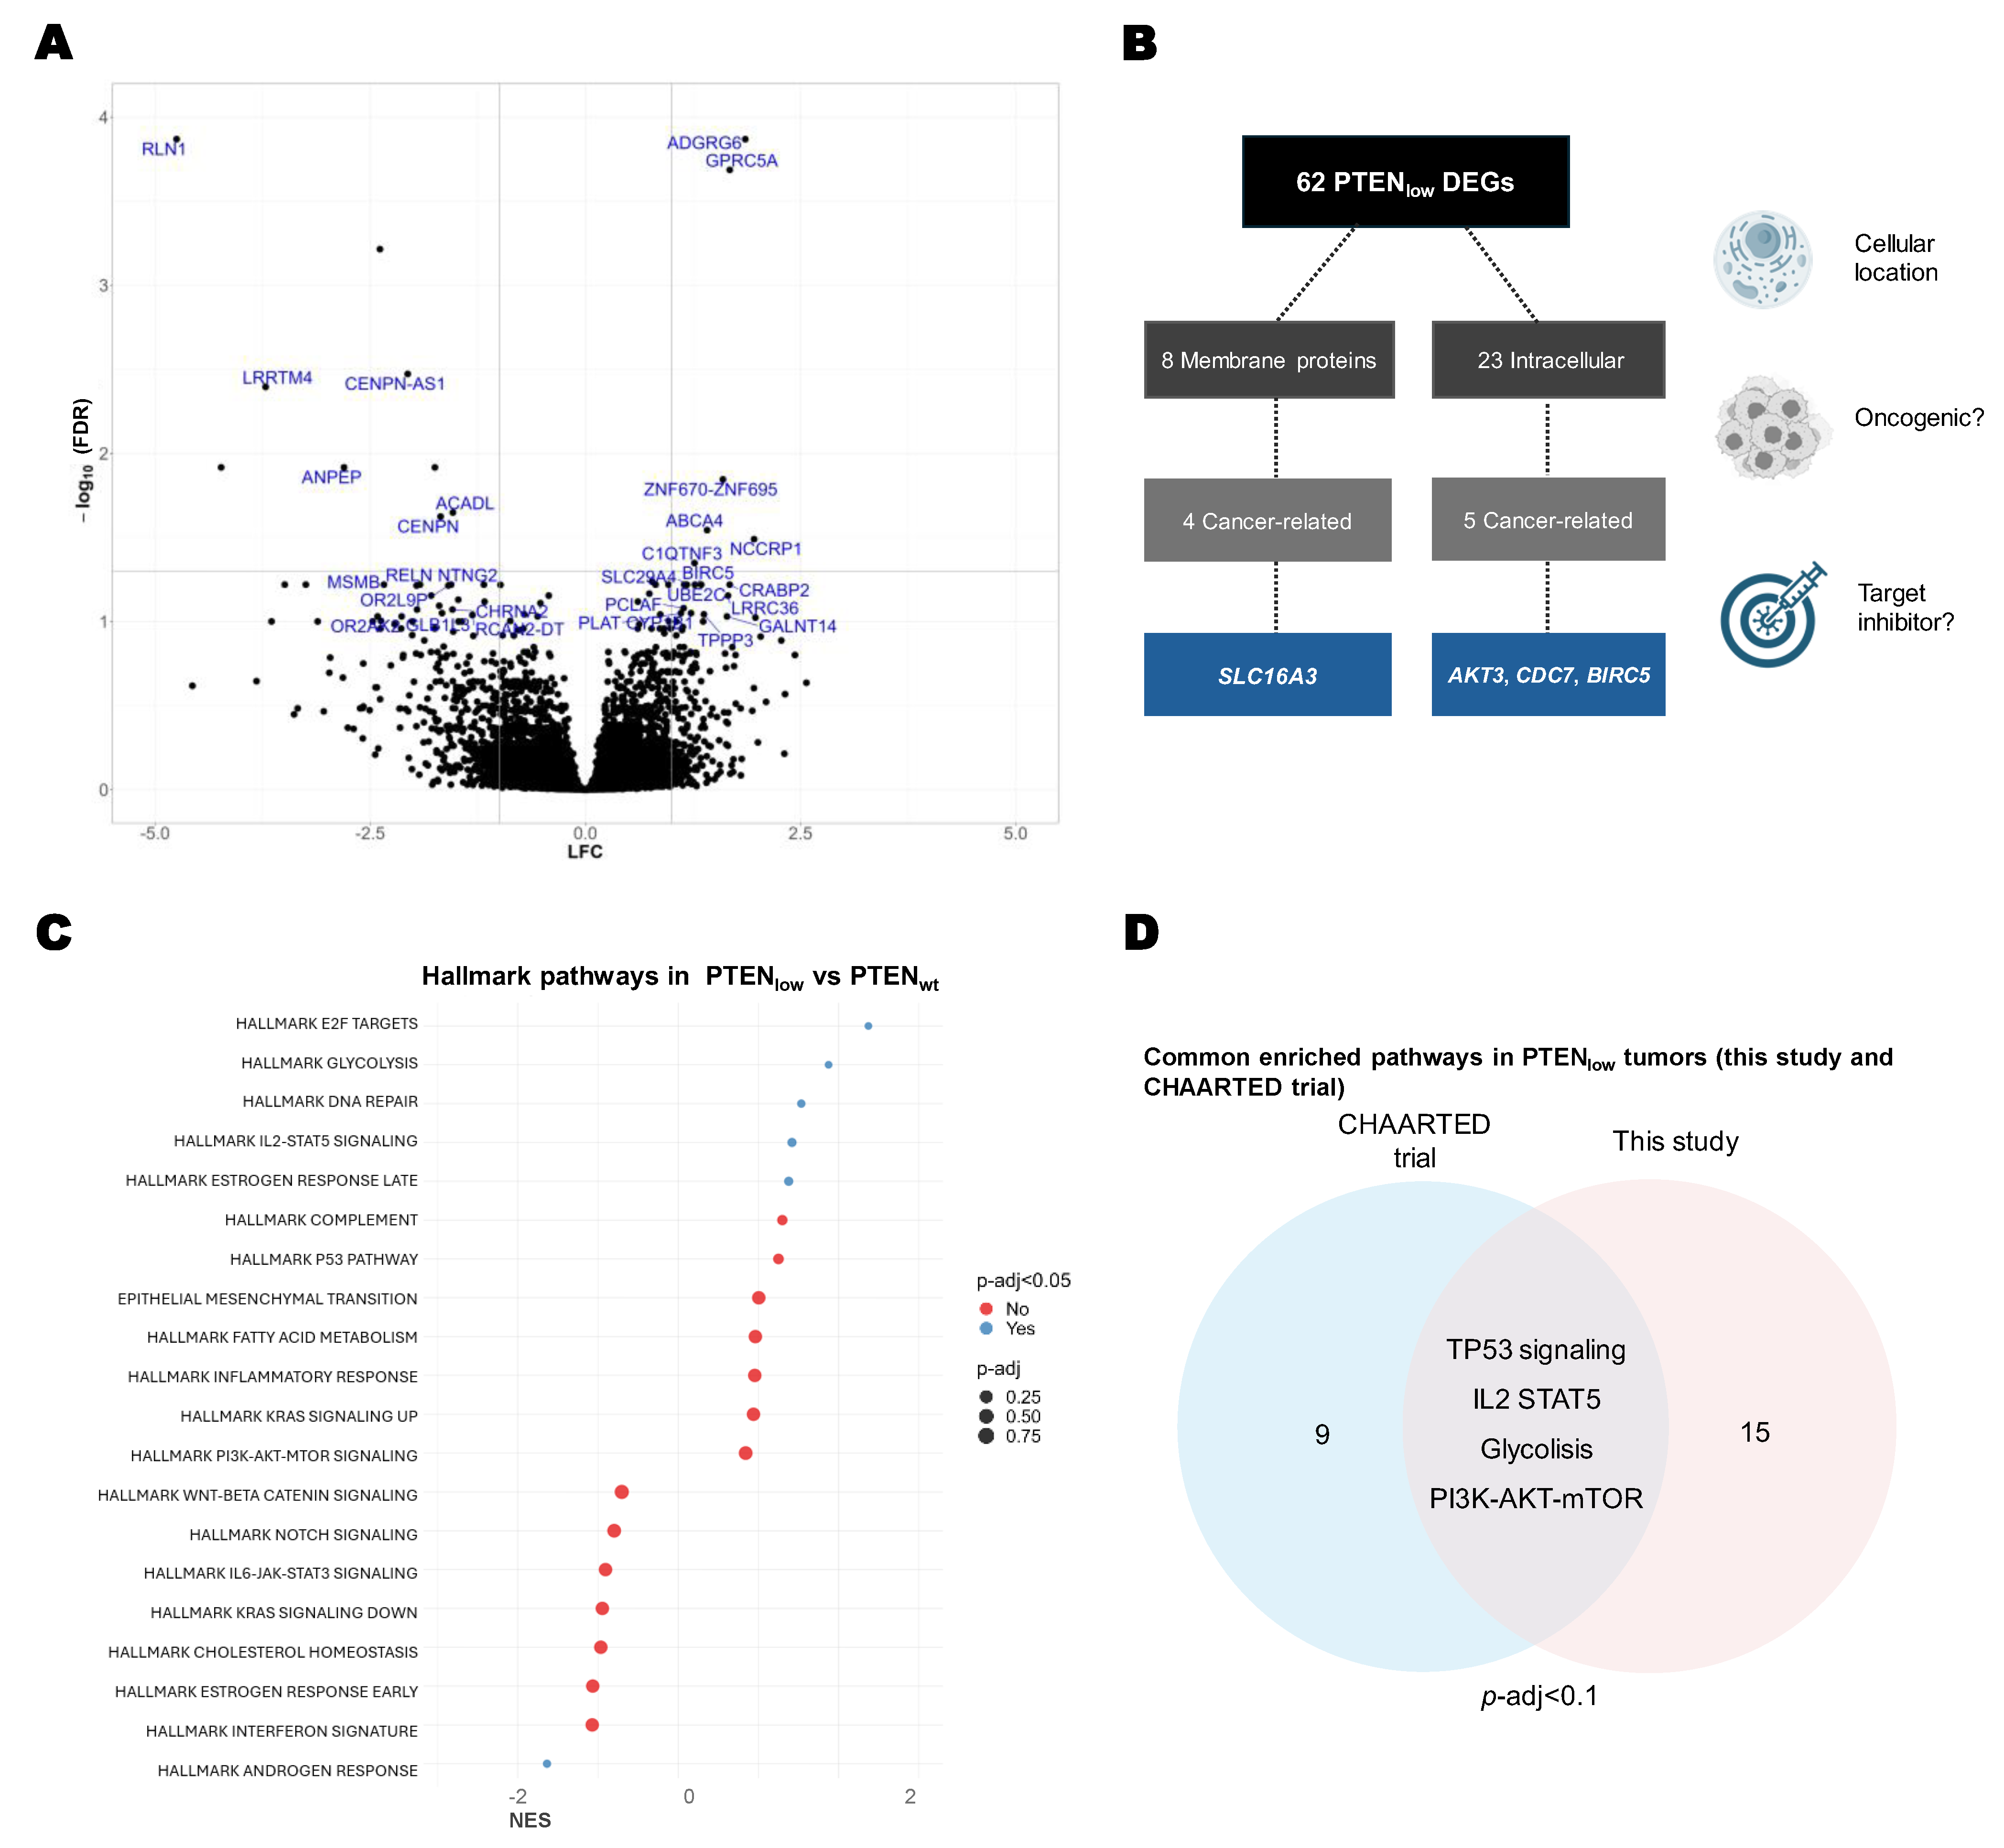
2.3. Transcriptional Characterization of PTENlow Tumors

In order to transcriptionally characterize PTENlow tumors, we performed an RNA-Seq analysis of tumor samples from 60 patients treated with ADT + D [10]. Clinical characteristics of these patients are summarized at Table S4.
PTENlow tumors were characterized by overexpression of genes associated with cell cycle, chromosomal instability, and tumor cell invasion transcripts (Figure 3A and Table S5). Of note, from these DEGs, we identified eight genes that codify membrane proteins, nine known to be cancer-related, and four with available targeted inhibitors (Figure 3B).
In GSEA we identified significantly upregulated pathways in PTENlow tumors, including the estrogen receptor pathway, glycolysis metabolism pathway, E2 F-cell cycle pathway, DNA repair, cell cycle pathways, and IL2-mediated inflammatory response. The only significantly downregulated pathway in PTENlow tumors was the androgen receptor (AR) pathway (p-adj = 0.032) (Figure 3C).
When assessed the overenriched pathways in PTENlow samples from the CHAARTED trial microarray dataset, and when compared to our findings, the GSEA shared differentially expressed pathways in the PTENlow population, including glycolysis, TP53, IL2, and DNA repair pathways, reinforcing the results observed in our patient cohort (Figure 3D).

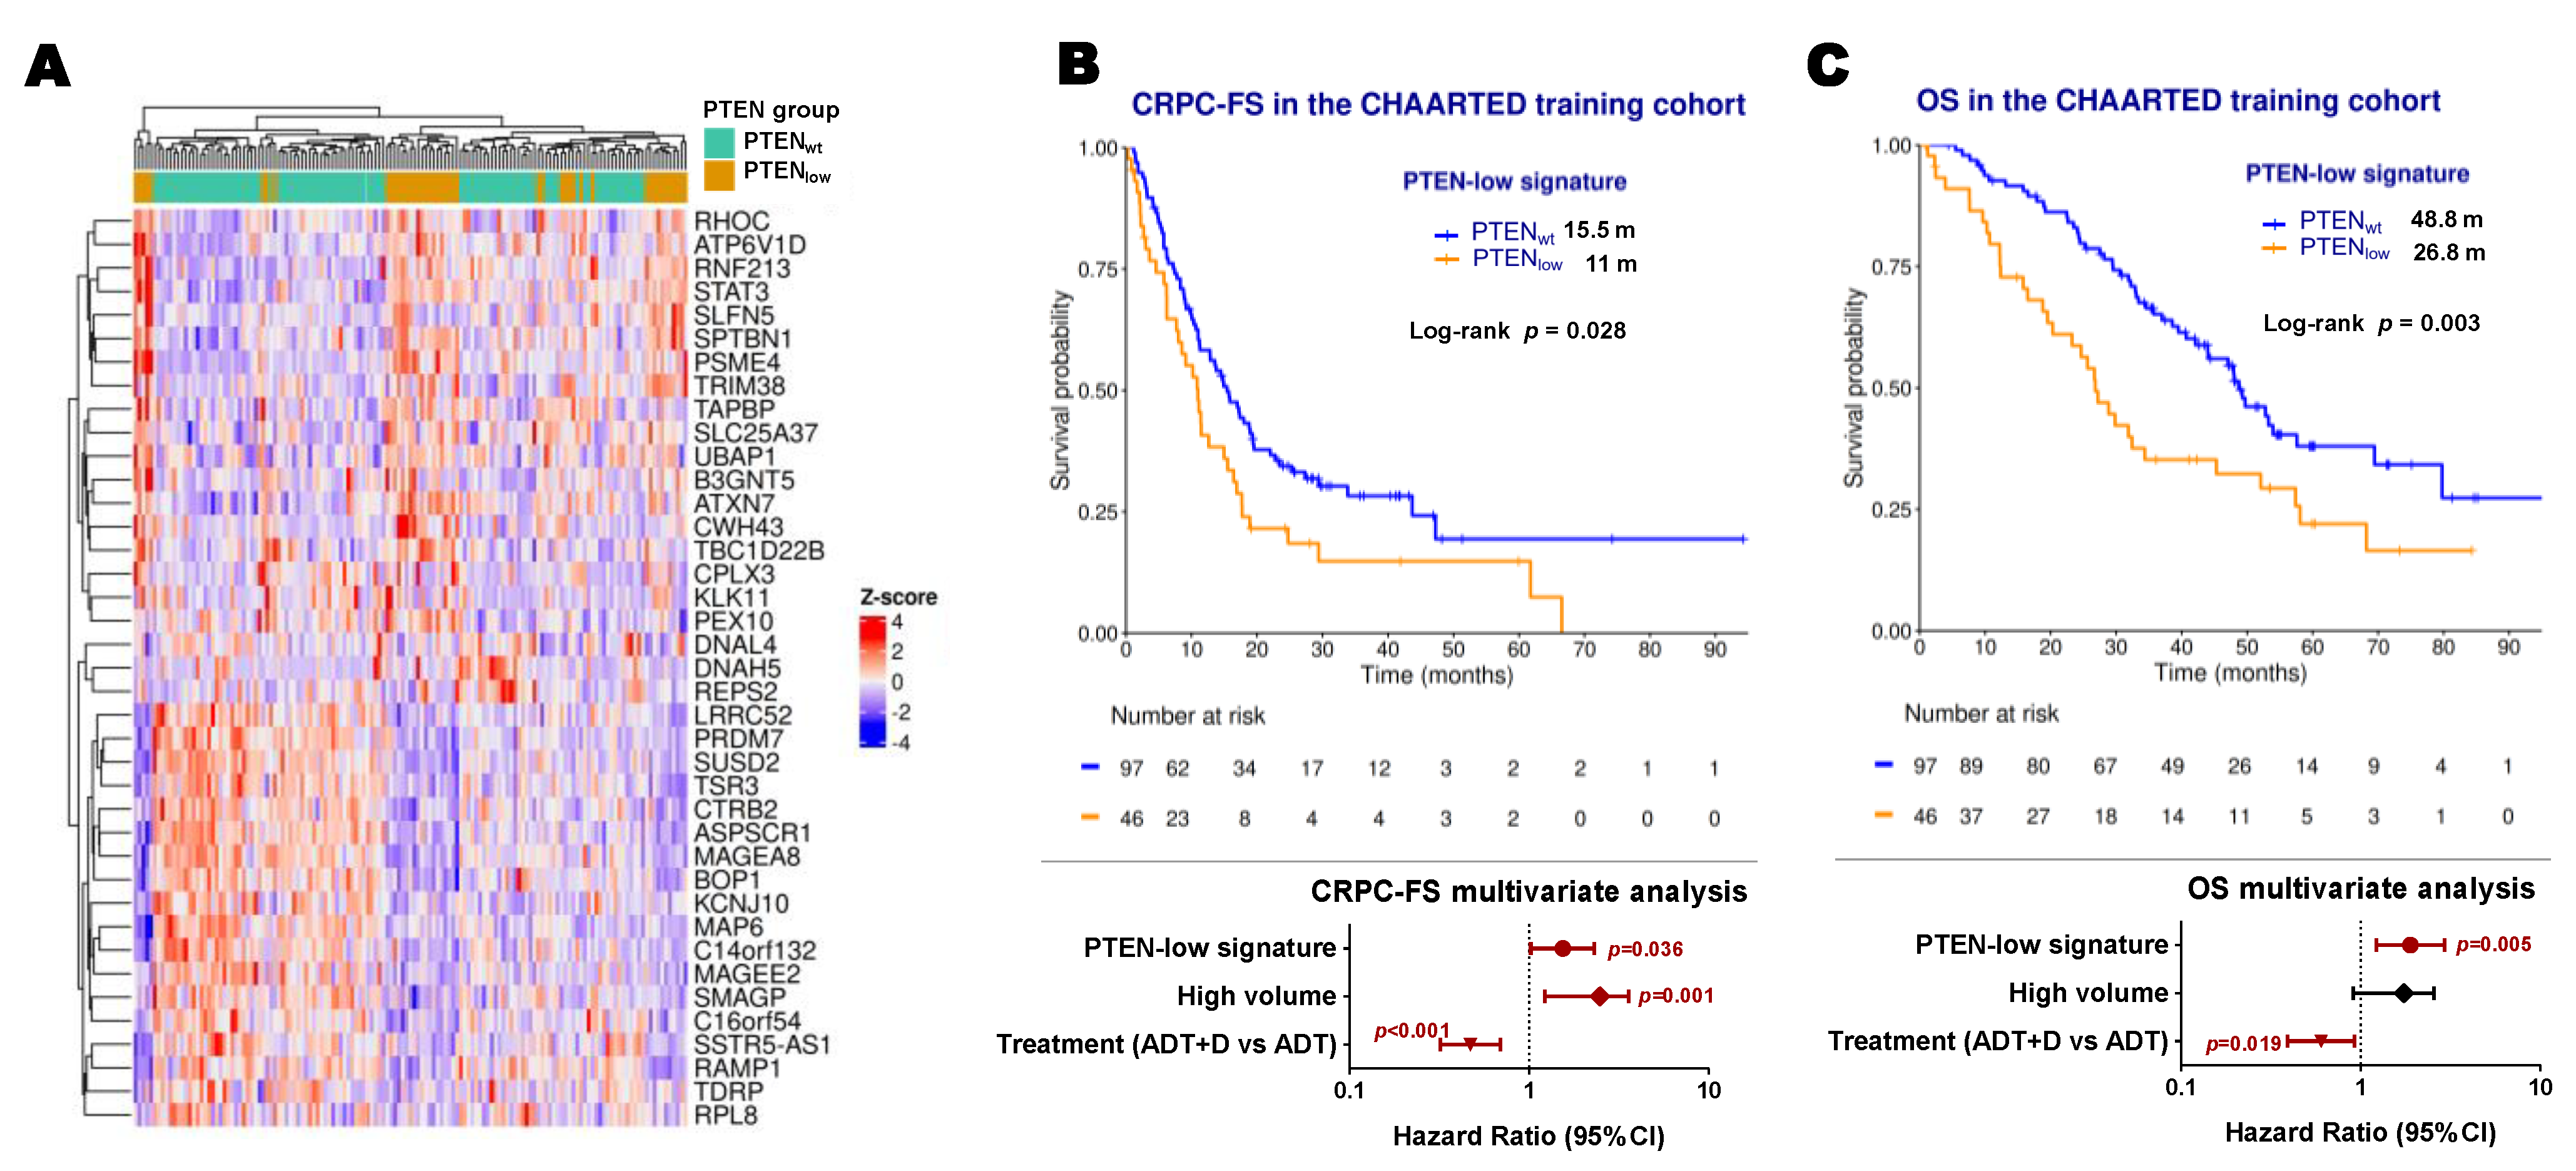
2.4. Development of a PTEN-Low Related Signature

To capture the true “PTEN-low” phenotype, we applied a cross-validation approach using microarray data from the CHAARTED clinical trial [19]. A total of 143 microarrays were deemed of sufficient quality to perform the analysis. An elastic-net model identified a 39-gene signature defining PTENlow status (Figure 4A). This gene signature yielded a mean area under the curve (AUC) of 0.75 and showed a significant correlation with PI3K/AKT/mTOR, IL2, and interferon alpha pathways (FDR < 0.05) (Figure S5A). In this training cohort, PTEN-low signature expression was independently associated with shorter CRPC-FS (HR 1.5, 95% CI 1–2.3, p = 0.036) and OS (HR 1.9, C1 1.2–2.9, p = 0.005) (Figure 4B,C). The 39-gene set was then scored per sample in the RNA-Seq dataset, as a validation cohort (n = 60), with an AUC of 0.59 for classifying PTENlow. No significant association was observed with CRPC-FS or OS. However, the signature correlated with PI3K/AKT/mTOR, interpheron alpha, and IL2-STAT5 patwhays, recapitulating the findings of the training cohort (Figure S5B).

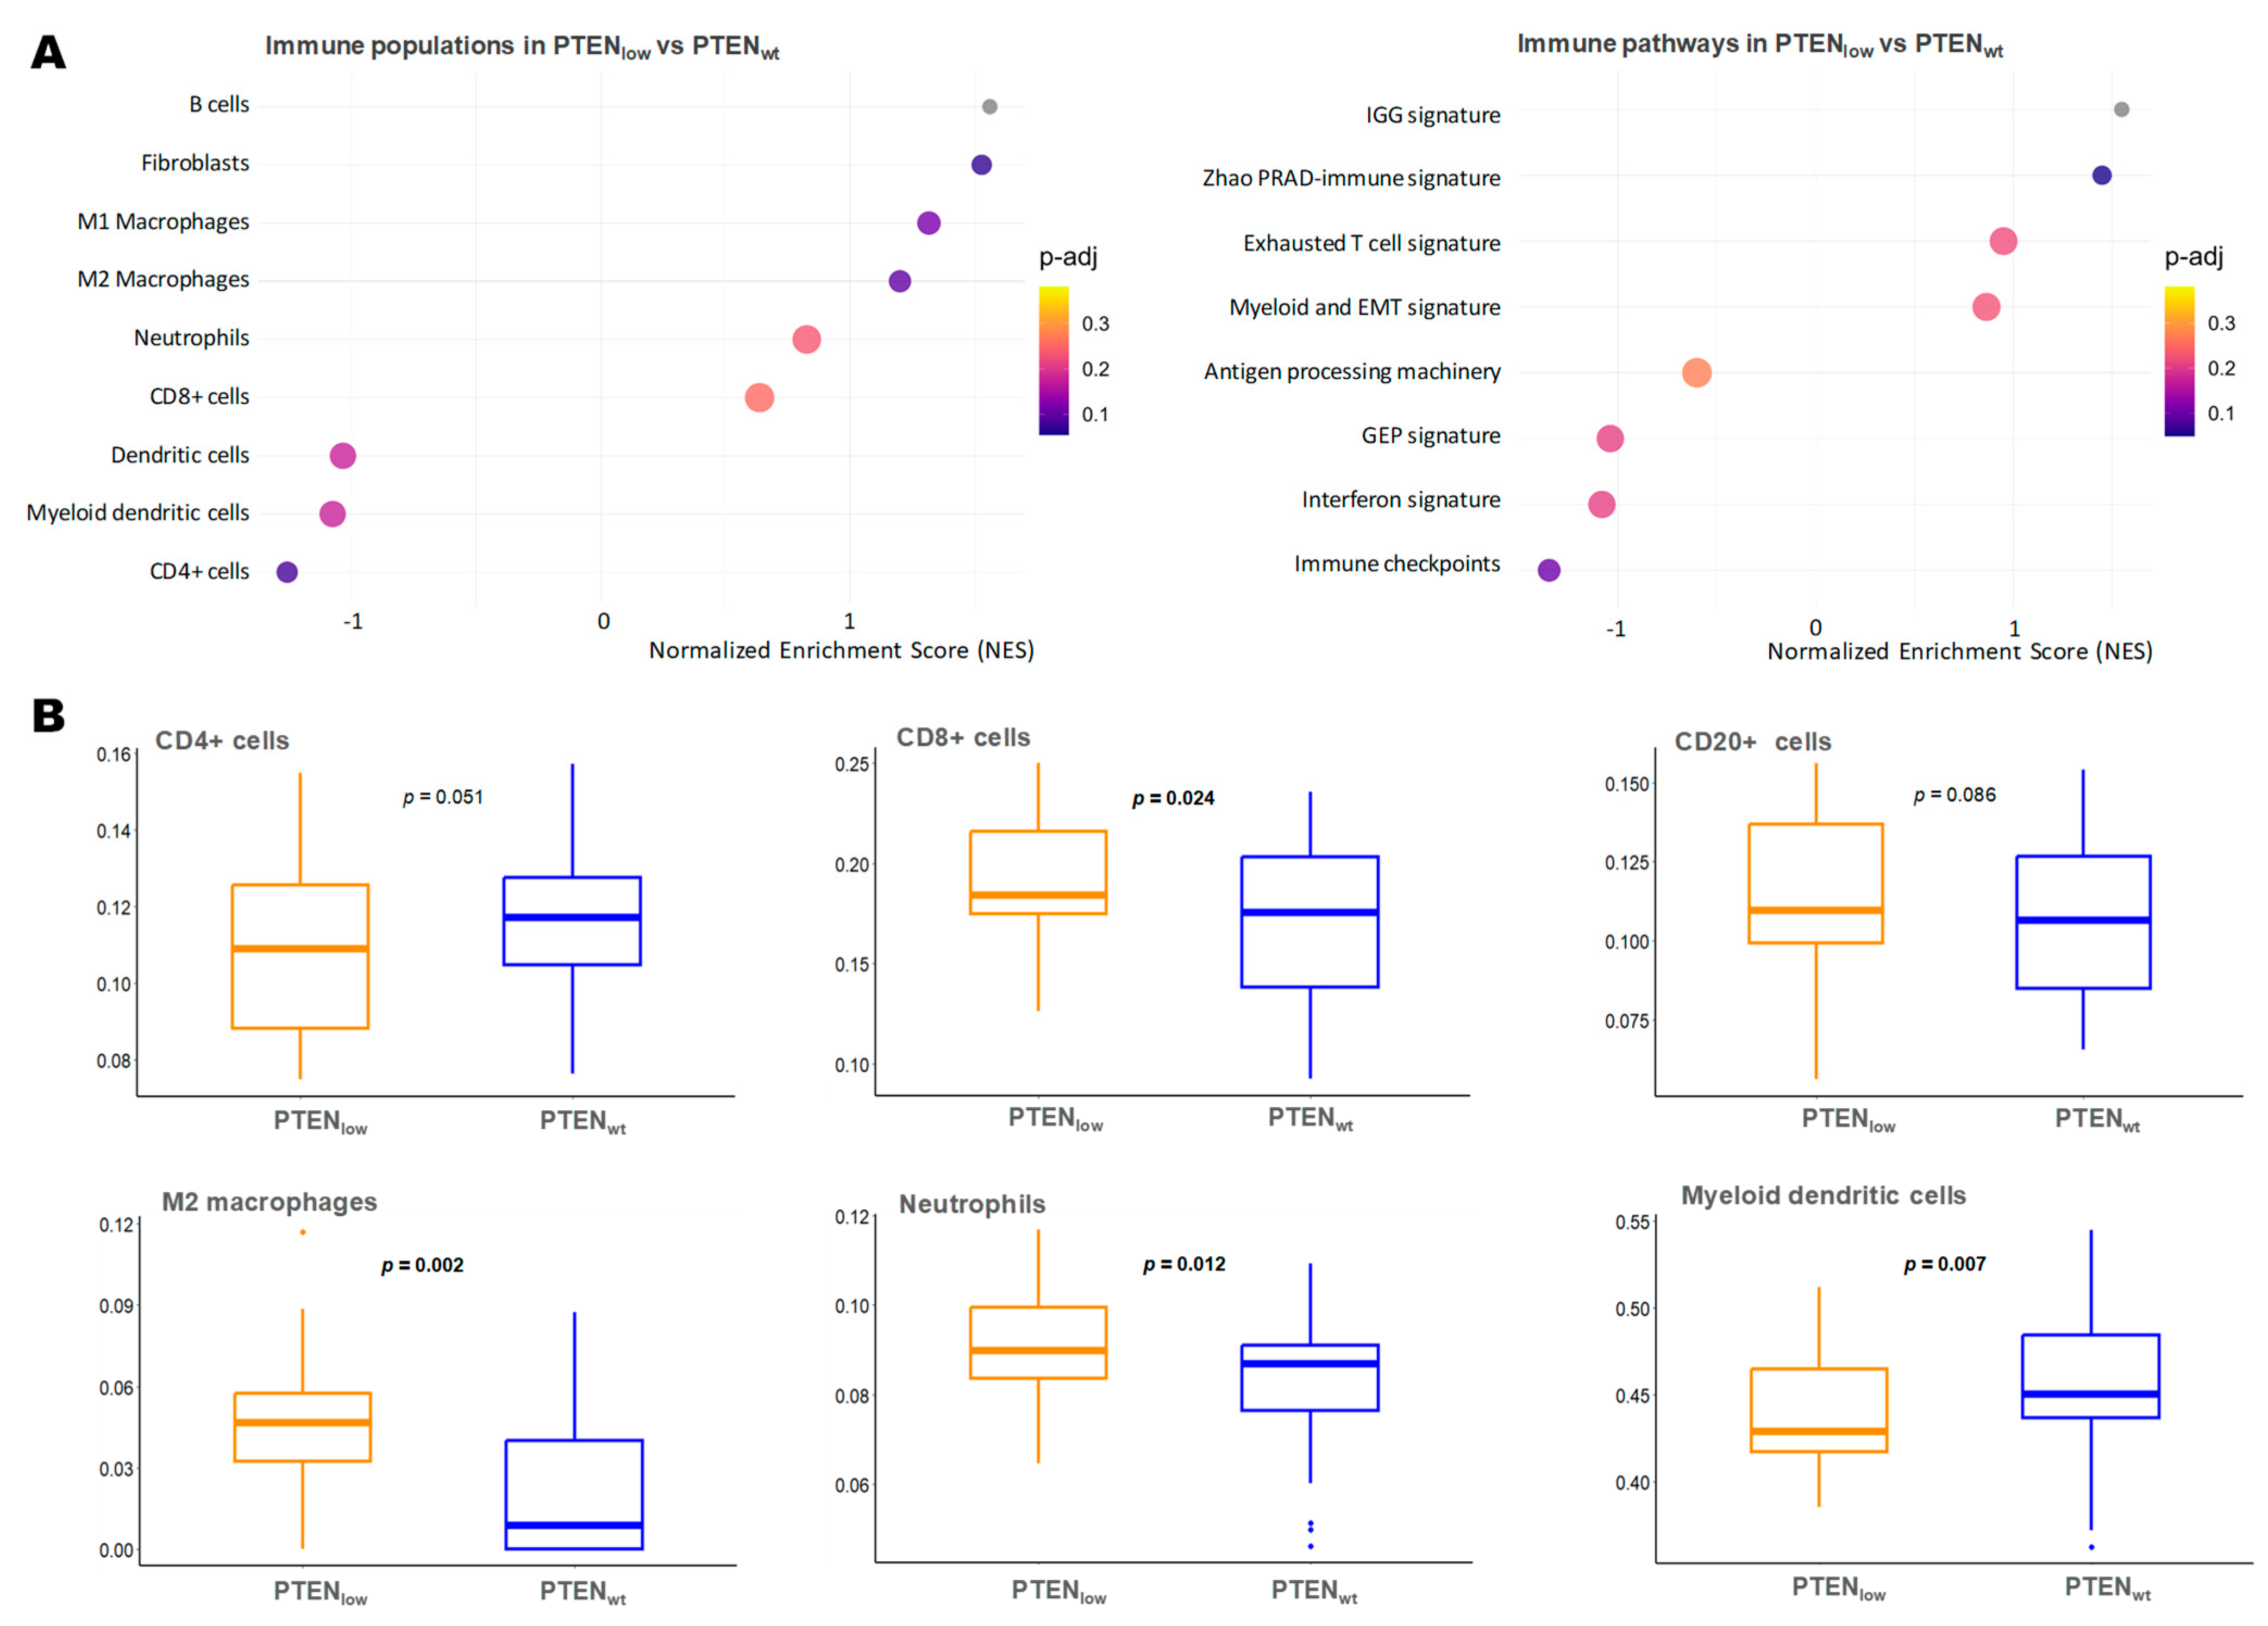
2.5. Immune Microenvironment-Related Gene Expression in PTENlow Tumors

We next focused on PTENlow immune microenvironment gene expression to assess if PTENlow tumors are characterized by an immunosuppressive microenvironment, as previously suggested [22,23]. We found that PTENlow tumors presented an upregulation of inflammatory-response-related genes, both the innate and adaptive immune system (Figure 5A). Regarding the innate immune response, PTENlow tumors exhibited higher levels of neutrophils and M2 macrophages (p = 0.012 and p = 0.002, respectively) but lower myeloid dendritic cells (p = 0.007). Within the adaptive immune system, PTENlow tumors showed a trend toward higher expression of effector CD8+ cells and B lymphocytes, with overexpression of the immunoglobulin gene signature (IGG signature) [24], Zhao’s prostate immune-related signature [25], and exhausted T cell signature. Conversely, PTENlow tumors displayed lower expression of activated CD4+ T cells and the gene expression profile (GEP) signature, associated with T cell inflammation and immune activation (Figure 5A,B).

2.6. Neuroendocrine Gene Expression in PTENlow Tumors

In the GSEA analysis from RNA-Seq data, we observed that PTENlow tumors exhibited upregulation of the neuroendocrine (NE) signature defined by Beltran [26] (p-adj = 0.092). At the individual gene level within the NE signature, we observed a significant negative correlation between Enhancer of zeste homolog 2 (EZH2), PTEN, and other NE-related genes (Figure 6A). Consistently, in the nCounter data, PTENlow tumors demonstrated significantly higher EZH2 mRNA levels (Figure 6B,C). Based on these findings, and given the evidence suggesting that EZH2 functions as a transcriptional repressor of PTEN [27], we further investigated the prognostic role of the co-expression of these two genes (nCounter expression). Patients with PTENlow-EZH2high tumors (9.6%) experienced significantly shorter CRPC-FS (15.4 vs. 25.5 months; HR 1.8, 95% CI 1.2–2.6, p = 0.001) and OS (36 vs. 53.3 months; HR 1.9, 95% CI 1.3–2.8, p < 0.001) compared to patients with wild-type expression of both genes (Figure 6D,E and Figure S4). The multivariate analysis confirmed the correlation of PTENlow-EZH2high with shorter CRPC-FS and OS (Figure 6F). Among the PTENlow tumors, higher EZH2 expression was significantly associated with shorter OS (36 vs. 48.9 months, HR 1.8, 95% CI 1.2–2.9, p = 0.038) (Figure S4).

3. Discussion

In this study, we show that low-PTEN mRNA expression (PTENlow) independently correlates with shorter time to CRPC and reduced OS in patients with mHSPC, irrespective of the up-front treatment received. While patients with PTENlow tumors did not show significant differences in clinical characteristics compared to those with PTENwt, they exhibited a distinct transcriptional landscape. PTENlow tumors were characterized by underexpression of the AR pathway and overexpression of the PI3K/AKT/mTOR, glycolysis, DNA repair, and immune pathways. Moreover, we developed a 39-gene PTEN-low related signature that captured these molecular alterations and correlated to adverse outcomes in the CHAARTED trial patients.
The adverse prognostic significance of PTEN loss has been extensively studied in CRPC, particularly through analyses of PTEN mutations and reduced IHC expression [9,14,18]. However, far fewer studies have investigated the detrimental role of PTEN alterations in mHSPC and only one study has explored a PTEN loss signature in this setting [21], reporting results consistent with those presented here.
Some PTEN transcriptional signatures have been previously characterized by other authors. Imada et al. analyzed public PC datasets and derived a gene expression signature linked to PTEN inactivation [23], while Saal et al. developed a transcriptomic signature reflecting PTEN deficiency in breast cancer tumors [28]. In both signatures, PTEN loss was defined by reduced IHC expression, and each demonstrated hyperactivation of the PI3K/AKT/mTOR and cell cycle pathways, which correlated with adverse clinical outcomes. Liu and colleagues also developed a PTEN transcriptional signature consisting of 45 differentially expressed genes identified in PTEN-deleted PC tumors from public databases [29]. Both Liu and Saal signatures were validated in an exploratory analysis of the STAMPEDE trial, where they were associated with worse survival [21].
In the present study, we developed a 39-gene PTEN-low related transcriptomic signature using microarray data from CHAARTED mHSPC tumors by comparing mRNA expression profiles between PTENlow and PTENwt samples. This classification was based on a previously validated cut-off that correlates with PTEN IHC expression and genomic alterations [10]. However, the use of a single PTEN mRNA expression cut-off may pose a limitation regarding transferability across different platforms and patient cohorts. By developing a multi-gene signature, we aimed to more accurately capture the true “PTEN low” phenotype, potentially offering greater biological and clinical relevance than relying on PTEN mRNA threshold alone. Our PTEN-low related signature effectively recapitulated key downstream biological features of PTEN loss, particularly the activation of the PI3K/AKT/mTOR pathway and immune-related programs such as IFN-α and IL-2/STAT5. Despite being developed without survival data, the signature predicted both CRPC-FS and OS in the training cohort, supporting its biological and potential clinical relevance. However, prognostic value was not replicated in the smaller RNA-Seq validation set, likely due to limited event numbers and low power. Further prospective validation is required to confirm the prognostic and biological value of the PTEN-low related signature in larger and independent patient series. Notably, several genes in our PTEN-low signature have been previously linked to cancer and overlap with those identified in PTEN-related signatures by Liu and Saal [28,29]. These genes are involved in critical processes like cell adhesion, motility, proliferation, and metastasis, which are known to drive poor outcomes across multiple cancer types [30]. Importantly, some of the enriched genes in PTENlow tumors, such as AKT3, CDC7, SLC16A3, and BIRC5, have inhibitors currently under development, highlighting their potential as promising targets for therapeutic intervention in PTENlow tumors [31,32,33,34]. In the GSEA, we found a correlation between low PTEN expression and critical pathways in PC biology, including upregulation of the estrogen receptor pathway, glycolysis, DNA repair, cell cycle, and NE signatures, along with a lower expression of the AR pathway. The elevated DNA repair signature may be attributed to the link between PTEN loss and chromosomal instability, which activates DNA damage repair pathways, such as ATM/ATR [35]. Our findings suggest that this pathway could represent a potential therapeutic target with PARP or ATR inhibitors, as previously explored in PTEN-altered breast cancer or glioblastoma [36,37].
The lower expression of the AR receptor pathway found in PTENlow tumors is consistent with previous evidence [10], where AR transcriptional activity is reduced in PTEN-null tumors and AR inhibition activates AKT signaling through reciprocal cross-talk [16]. This may explain why PTENlow tumors have poorer response to hormonal treatments [18]. Preclinical studies have shown this reciprocal feedback whereby AR inhibition upregulates PI3K/AKT/mTOR pathway signaling and PI3K/AKT/mTOR pathway inhibition activates AR signaling [16]. Simultaneous inhibition of both pathways has shown preclinical antitumor activity, particularly in PTEN-deficient models [16]. The phase III IPATential150 trial demonstrated that AKT inhibitor, ipatasertib, improved radiological progression-free survival when added to abiraterone in mCRPC patients harboring PTEN mutations [38]. In mHSPC, the ongoing phase III CAPItello-281 study (NCT04493853) is evaluating the addition of capivasertib to abiraterone in mHSPC patients with PTEN-deficient tumors. Preliminary data favor the capivasertib regimen, although the results are still immature [39].
Consistent with prior reports, our analysis revealed increased expression of NE-related genes and epigenomic regulators, previously linked to PTEN deficiency [40]. Among them, one of the pivotal players is EZH2, a histone methyltransferase enzyme of the Polycomb repressive complex [41]. EZH2 is a master regulator of NE lineage plasticity in PC and has been associated with the methylation and silencing of PTEN in various tumor types [27]. We found that low PTEN expression and high EZH2 expression were associated with a remarkable poor prognosis, suggesting that this subgroup of tumors (PTENlow—EZH2high), may need a better treatment strategy. Notably, EZH2 has shown promising activity in early trials with CRPC patients [42,43] and it is currently in investigation in mHSPC.
PTEN loss has been shown to affect the immune system in a PI3K/AKT-independent manner, thereby modulating the tumor immune microenvironment [22,44]. Previous reports across different cancer types, have shown that disrupted PTEN expression leads to a decreased immune response and increased immunosuppressive cytokines [45,46]. Vidotto et al. analyzed public cancer datasets and observed that PTEN-deficient tumors frequently exhibited dysregulation of immune-related pathways [44]. In most cancer types, PTEN loss was associated with a higher abundance of CD4+ lymphocytes, M1 macrophages, and FoxP3+ T regulatory cells, along with increased expression of immune checkpoints such as LAG3 and IDO1, indicating an immunosuppressive tumor microenvironment [44]. In contrast, a recent study found that prostate tumors with PTEN loss exhibited strong activation of both innate and adaptive immune systems, with increased interferon-gamma response genes and CD8+ lymphocytes, suggesting they may respond better to immunotherapies [23]. Likewise, in our study, we observed a significant dysregulation of most of these immune cell’s signatures in PTENlow tumors. On one side, there was an overexpression of neutrophils, macrophages and fibroblasts, reinforcing the presence of an immunosuppressive microenvironment that could promote tumor progression and invasion. Interestingly, we also detected elevated CD8 +, B cell, and exhausted T cell signatures, suggesting that, although PTENlow tumors may harbor a higher frequency of CD8+ T cells, these may be functionally exhausted due to the suppressive immune microenvironment. Given that PTENlow tumors display reduced androgen production, which strongly suppresses inflammatory immune cells [47], we hypothesized that this reduction in androgen levels might trigger a more effective immune response. Additionally, the increased genomic instability associated with PTEN loss may enhance tumor antigenicity, thereby promoting immune activation via cGAS–STING signaling [35]. These findings are of particular interest as they open the door to exploring immunotherapy-based approaches in PTEN-altered prostate tumors, a setting traditionally considered less responsive to such treatments.
Our study does face limitations, including its retrospective and non-randomized design, which may be subject to selection bias and missing data, as well as the treatment heterogeneity across the first-line therapy groups, which may introduce residual confounding despite multivariable modeling and the lack of a cohort of patients treated with triple therapy (ADT+D+ARSI). Additionally, although the PTEN-low related signature demonstrated clear biological validity, its prognostic value remains unconfirmed. Larger RNA-Seq cohorts will be necessary to establish its clinical relevance. Finally, further research is warranted to better characterize the immune tumor microenvironment and its relationship with PTEN loss.
In conclusion, this study demonstrates in a large cohort of mHSPC patients that low PTEN expression is an adverse prognostic factor. Through comprehensive characterization of PTENlow tumors and their immune microenvironment, we identified a prognostic PTEN-low related signature and potential targetable genes. Our findings offer new insights into the transcriptional landscape associated with low PTEN expression, which may aid in the identification of targeted therapies and support the development of personalized treatment strategies for patients with PTEN-altered tumors.

4. Materials and Methods

4.1. Design, Patients, and Samples

We present an exploratory multicenter ambispective ongoing biomarker study in patients with mHSPC in different hospitals from Spain. Key inclusion criteria were prostate adenocarcinoma diagnosis with available FFPE biopsy of the primary tumor or a metastatic site in the hormone-sensitive setting and enough material for molecular analysis as assessed by the pathologist. Treatment for mHSPC was ADT alone (i.e., luteinizing hormone-releasing hormone (LHRH) analogs), ADT in combination with D (75 mg/m2 every 21 days for six cycles), or ADT in combination with ARSI (enzalutamide 160 mg/day, apalutamide 240 mg/day, or abiraterone 1000 mg/day in combination with prednisone 5 mg/day). Patients with primary NE tumors were excluded. Clinical variables were collected from patient’s electronic records. The primary endpoint of the study was to correlate PTEN mRNA expression with CRPC-FS. Secondary endpoints were to correlate PTEN mRNA expression with OS, to molecularly characterize PTENlow tumors and the different pathways associated with PTENlow, using a multiplatform approach (RNA-Seq and microarrays), and to develop a PTEN-low related transcriptomic signature to capture the PTEN-low biology. Considering our previous results [10] we estimated a sample size of 300 patients to detect differences in the primary endpoint with power = 0.8 and α = 0.05, two-tailed.

4.2. Gene Expression Panel Design

We have configured a gene expression nCounter panel (Nanostring Technologies, Seattle, WA, USA) of 184 genes representing signatures described to be related with CRPC development and androgen suppression or taxanes resistance [48]. Here, we present the data focused on PTEN and PTEN-related pathway genes.

4.3. RNA Extraction

Sections of FFPE tumor tissues (prepared as previously described [48]) were stained with hematoxylin and eosin to determine the tumor area. At least two 10 μm macrodissected FFPE slides were used to extract total RNA by using AllPrep DNA/RNA FFPE Kit (QIAGEN, Hilden, Germany) according to the manufacturer’s instructions. RNA was quantified by a Nanodrop Spectrophotometer ND-1000 (Thermo Scientific, Wilmington, MA, USA).

4.4. nCounter Gene Expression Analysis

A minimum of ~100 ng of total RNA was used to measure gene expression using the nCounter platform following the manufacturer’s protocol (Nanostring Technologies, Seattle, WA, USA). RNA was hybridized into 192 probe sets for 18 h at 67 °C and processed as previously described [48]. Here we present the data focused on PTEN and EZH2. Raw expression counts (Tables S6–S8) were collected, normalized, and log2 transformed using the nSolver 4.0 software (RRID:SCR_003420) [48].

4.5. RNA Sequencing (RNA-Seq)

Sample quality control, sequencing library preparation, qualification, and pooling, as well as NGS data processing, were performed by the High Content Genomics and Bioinformatics Unit at the Institut Germans Trias i Pujol (IGTP). Pooled library gel purification and quality control and Illumina sequencing procedures were performed by the Genomics Unit at the Center for Genomic Regulation (CRG) [10].

4.6. Bioinformatics and Statistical Analysis

A previously established and validated cut-off by our group [10] was applied to transformed (z-score) PTEN nCounter gene expression data of each cohort (described in the Results section) to define PTENlow tumors. PTENwt was considered for the remaining cases. This cut-off was also applied to transformed (z-score) microarray data from the CHAARTED trial patients [19]. For EZH2, tertiles were applied to transformed (z-score) nCounter gene expression data of all patients and EZH2high was considered for patients with the higher tertile expression.
RNA-Seq data was normalized and a differential gene expression analysis was performed using DESeq2 (RRID:SCR_015687). Genes with false discovery rate (FDR) adjusted p-value (p-adj) < 0.1 and absolute log2 fold change (LFC) ≥ 1 were considered as statistically significant differentially expressed genes (DEGs). GSEA was performed with the fgsea package (RRID:SCR_020938) using as input the full list of genes ranked by transformed p-value (signed p-value = −log(p-value) × sign(LFC)). MSigDB Hallmarks [49], NE signatures [26], and different immune datasets were used to obtain pathways of interest [24,25,50]. Single-sample GSEA (ssGSEA) from the GSVA package (RRID:SCR_021058) was used to compare immune expression profiles between PTENlow and PTENwt.
We reanalyzed microarray data from 160 HSPC biopsies from the CHAARTED trial [19]. Raw Affymetrix HuEx-1_0-ST CEL files were processed using the oligo v1.64 (RRID:SCR_015729). Quality control was performed using arrayQualityMetrics v3.54 (RRID:SCR_001335). Expression data were background-corrected and quantile-normalized with Robust Multiarray Average (RMA), retaining ~22,000 transcript clusters. Probe sets without HGNC symbols were discarded, and batch effects were captured by scanning the chip date and carried downstream. For genes with multiple probe sets, the mean expression was calculated.
The PTEN-low related signature was developed using 10 × 10 repeated cross-validation on the CHAARTED microarray dataset [19], applying an elastic-net logistic regression model (α = 0.2) implemented with caret v6.0–94 (RRID:SCR_021138) and glmnet v4.1 packages (RRID:SCR_015505). Predictors were centered and scaled (mean = 0, SD = 1), and model performance was assessed by AUC. The final λ was selected using the 1-standard error rule to favor model simplicity while retaining predictive power. Model parameters were locked for external application. To overcome the intrinsic scaling difficulty of cross-platform validation (from microarray to RNA-Seq) when assessing the prognostic value of the signature, each sample was scored using GSVA v1.50 (RRID:SCR_021058) and classified based on the median score of the signature. In parallel, scores were also calculated for Hallmark gene sets (MSigDB v7.5), and their correlation with the PTEN-low signature score was assessed using Spearman correlation with FDR correction. For validation, the same methodology was applied to our RNA-Seq samples. ROC analysis was also performed to evaluate the PTEN-GSVA score’s ability to classify RNA-Seq samples as PTENlow.
Clinical variables such as de novo stage IV, Gleason at diagnosis, the presence of visceral metastasis, bone metastasis, volume (as defined in CHAARTED trial [1]), and risk (as defined in LATITUDE trial [3]) at ADT start time were evaluated as dichotomic. PSA at diagnosis and LDH levels at ADT start time were evaluated as continuous variables.
CRPC-FS and OS were calculated from the date of start of ADT to the time of developing CRPC and to the time of death or last follow-up visit, respectively. Survival analyses were performed by the Kaplan–Meier method and compared by log-rank test. CRPC-FS definition, treatment–response criteria, and progressive-disease definitions followed Prostate Cancer Working Group 2 criteria [51]. Univariate and multivariate analysis were performed by Cox regression analysis.
Fisher’s exact test and the Wilcoxon Mann–Whitney test were used to compare the proportions of qualitative and continuous clinical variables between two groups, respectively. Chi-square test and Kruskal Wallis test were used to compare categorical and continuous variables between three groups, respectively.
A test of interaction was performed by entering proportional hazard models’ selected multiplicative interaction terms between two variables: treatment (ADT, ADT + D, or ADT + ARSI) and PTEN expression (PTENlow or PTENwt). The correlation between PTEN and the other relevant genes was assessed using RNA-Seq through Pearson correlation test. Analyses were performed with R software (v.4.3.2).

Supplementary Materials

The following supporting information can be downloaded at: https://www.mdpi.com/article/10.3390/ijms26136244/s1.

Author Contributions

Conceptualization, M.G.d.H., N.J., Ò.R. and B.M.; methodology, M.G.d.H., N.J., J.P., Ò.R. and B.M.; validation, M.G.d.H., N.J., J.P., C.A., L.F.-M. (Laura Ferrer-Mileo), S.G.-E., L.R.-C., I.T., L.F.-M. (Laia Fernández-Mañas), M.M.-A., M.A., M.M., Ò.R. and B.M.; formal analysis, M.G.d.H., N.J., J.P., Ò.R. and B.M.; investigation, M.G.d.H., N.J., J.P., C.A., L.F.-M. (Laura Ferrer-Mileo), S.G.-E., L.R.-C., I.T., L.F.-M. (Laia Fernández-Mañas), M.M.-A., M.A., M.M., A.F., A.R.-V., M.Á.C., S.C., I.C., M.F., N.S.-G., A.P., Ò.R. and B.M.; resources, M.G.d.H., N.J., J.P., C.A., L.F.-M. (Laura Ferrer-Mileo), S.G.-E., L.R.-C., I.T., L.F.-M. (Laia Fernández-Mañas), M.M.-A., M.A., M.M., A.F., A.R.-V., M.Á.C., S.C., I.C., M.F., N.S.-G., V.R.d.P., J.C.P., A.P., Ò.R. and B.M.; data curation, M.G.d.H., N.J., J.P., Ò.R. and B.M.; writing—original draft preparation, M.G.d.H., N.J., Ò.R. and B.M.; writing—review and editing, all authors; visualization, M.G.d.H., N.J., J.P., C.A., L.F.-M. (Laura Ferrer-Mileo), Ò.R. and B.M.; supervision, B.M.; project administration, B.M.; funding acquisition, B.M. All authors have read and agreed to the published version of the manuscript.

Funding

This work was supported by Instituto de Salud Carlos III-Subdirección General de Evaluación y Fomento de la Investigación [PI18/00714 and PI24/00631] and co-funded by the European Union. Institutional funding from CERCA Programme/Generalitat de Catalunya is gratefully acknowledged. This work was funded by a grant from Janssen-Pharmaceuticals [212082PCR4056]. M.G. is supported by Contracte Clínic Recerca “Emili Letang i Josep Font” 2023. Ò.R. is awarded with a ‘‘Ayudas SEOM de Intensificación para Investigadores Jóvenes’’ from the Spanish Society of Medical Oncology (SEOM). This work was developed at the Centro Esther Koplowitz, and CELLEX, Barcelona, Spain.

Institutional Review Board Statement

This study was conducted in accordance with the Declaration of Helsinki and approved by Institutional Ethics Committees of all participating centers.

Informed Consent Statement

Informed consent was obtained from all subjects involved in the study.

Data Availability Statement

The Nanostring nCounter gene expression data presented in this study are available in Table S6–S8. RNA-Seq data presented in this study are available on reasonable request from the corresponding author and subject to authorization by the institution. Microarray expression data from patients included in the CHAARTED clinical trial deposited in the GEO database with the accession number GSE201805 [19] were used for the independent validation analysis.

Acknowledgments

We want to acknowledge Parc de Salut MAR Biobank (MARBiobanc) [RD09/0076/00036, PT17/0015/0011] and IGTP-HUGTP Biobank [PT13/0010/0009, PT17/0015/0045] integrated in the Spanish National Biobanks Network and Tumor Bank Network of Catalonia and the BioBank FIVO [PT17/0015/0051] integrated in the Spanish National Biobanks Network and in the Valencian Biobanking Network for their collaboration in providing samples. The authors are also deeply indebted to all patients that agreed to be involved in the study. The authors acknowledge ECOG-ACRIN Cancer Research Group and NCTN/NCORP for sharing clinical and gene expression data. This manuscript utilized data from Datasets NCT00309985-D3 and NCT00309985-D5 from the NCTN/NCORP Data Archive of the National Cancer Institute’s (NCI’s) National Clinical Trials Network (NCTN). Data were originally collected from clinical trial NCT00309985 (E3805 study) entitled “Androgen Ablation Therapy With or Without Chemotherapy in Treating Patients With Metastatic Prostate Cancer (CHAARTED)”. We want to also thank the E3805 investigators Christopher J. Sweeney (Dana Farber/Harvard Cancer Center), Robert S. DiPaola (University of Kentucky College of Medicine), and Yu-Hui Chen (Dana-Farber Cancer Institute/ECOG-ACRIN Biostatistics Center) for sharing the data (financial grants U10CA180820, U10CA180794, and UG1CA233180). All analyses and conclusions in this manuscript are the sole responsibility of the authors and do not necessarily reflect the opinions or official views of the National Institutes of Health, clinical trial investigators, the NCTN, the NCORP or the NCI.

Conflicts of Interest

The authors have provided the following conflicts to disclose (which may not be related to the subject matter of this manuscript): M.G.d.H.: speaker honoraria from Ipsen and travel and accommodation expenses from Novartis, Pfizer, and Bayer. C.A.: speaker honoraria from AstraZeneca, Pfizer, BMS, and Ipsen; travel accommodation from Pfizer, Ipsen, and Janssen. L.F.-M. (Laura Ferrer-Mileo): speaker honoraria from Pfizer, BMS, Ipsen, and Janssen; travel accommodation expenses from Pfizer and Janssen; research funding from Roche; advisory role from Pfizer. L.F.-M. (Laia Fernández-Mañas): speaker’s Bureau from Ipsen; financial relationships with commercial interests from Janssen, Ipsen, MSD, and Merck. A.F.: research funding from AstraZeneca; consulting or advisory role for Janssen, Astellas, and Bayer; travel and accommodation expenses from Janssen. A.R.-V.: research funding from Takeda, MSD, and Pfizer; consulting or advisory role for Astellas, Bayer, BMS, MSD, Janssen, Roche, Pfizer, and Clovis; honoraria or travel expenses from Pfizer, MSD, Astellas, BMS, Janssen, AstraZeneca, Roche, Bayer, and Sanofi Aventis. M.Á.C.: consulting or advisory role for BMS, MSD, Bayer, EUNSA, Pfizer, Roche, Janssen, Pierre Fabre, and Ipsen; travel and accommodation expenses from Janssen, Astellas, Roche, Ipsen, and MSD. S.C.: research funding from Pfizer and Janssen; consulting or advisory role for GSK; and speaker’s bureau for GSK, BMS, and Merck. I.C.: advisory boards for Pfizer, EISAI, and BMS. MF: speaker’s bureau for Pfizer, Ipsen, and Astellas; travel and accommodation expenses from Merck. NSG: advisory board for Pfizer, Bristol Myers Squibb, and Roche; speaker’s bureau for Ipsen and Astellas Pharma. A.P.: advisory and consulting fees from Roche, Pfizer, Novartis, Amgen, BMS, Puma, Oncolytics Biotech, MSD, Guardant Health, Peptomyc, and Lilly; lecture fees from Roche, Pfizer, Novartis, Amgen, BMS, Daiichi Sankyo, and Nanostring technologies; institutional financial interests from Boehringer, Novartis, Roche, Nanostring technologies, Sysmex Europe GmbH, Medica Scientia Innovation Research, SL, Celgene, Astellas, and Pfizer; leadership role in Reveal Genomics, SL; a patent PCT/EP2016/080056. Ò.R.: consulting or advisory role for BMS, EISAI, and Ipsen; travel and accommodation expenses from Ipsen and Pfizer. B.M.: research funding from Janssen, Roche, Bayer, and Pfizer; speaker’s bureau for Roche, Sanofi, Janssen, Astellas, Pfizer, Novartis, and Bristol-Myers Squibb; and travel and accommodation expenses from Janssen and Pfizer. The remaining authors declare that the research was conducted in the absence of any commercial or financial relationships that could be construed as a potential conflict of interest.

Abbreviations

The following abbreviations are used in this manuscript:
ADTAndrogen deprivation therapy
ARAndrogen receptor
ARSIAndrogen receptor signaling inhibitors
AUCArea under the curve
CIConfidence interval
CRPCCastration-resistance prostate cancer
CRPC-FSCRPC-free survival
DDocetaxel
DEGsDifferentially expressed genes
ECOGEastern Cooperative Oncology Group
EMTEpithelial-mesenchymal transition
FDRFalse discovery rate
GEPT-cell inflamed gene expression profile
IGGImmunoglobulin signature
FFPEFormalin-fixed paraffin-embedded
GSEAGene Set Enrichment Analysis
HRHazard ratio
IHCImmunohistochemistry
LDHLactate dehydrogenase
LFCLog2 fold change
LHRHLuteinizing hormone-releasing hormone
mHSPCMetastatic hormone-sensitive prostate cancer
NENeuroendocrine
OSOverall survival
PCProstate cancer
PRADProstate adenocarcinoma
PSAProstate-specific antigen
ssGSEASingle-sample GSEA

References

  1. Sweeney, C.J.; Chen, Y.-H.; Carducci, M.; Liu, G.; Jarrard, D.F.; Eisenberger, M.; Wong, Y.-N.; Hahn, N.; Kohli, M.; Cooney, M.M.; et al. Chemohormonal Therapy in Metastatic Hormone-Sensitive Prostate Cancer. N. Engl. J. Med. 2015, 373, 737–746. [Google Scholar] [CrossRef] [PubMed]
  2. James, N.D.; Sydes, M.R.; Clarke, N.W.; Mason, M.D.; Dearnaley, D.P.; Spears, M.R.; Ritchie, A.W.S.; Parker, C.C.; Russell, J.M.; Attard, G.; et al. Addition of Docetaxel, Zoledronic Acid, or Both to First-Line Long-Term Hormone Therapy in Prostate Cancer (STAMPEDE): Survival Results from an Adaptive, Multiarm, Multistage, Platform Randomised Controlled Trial. Lancet 2016, 387, 1163–1177. [Google Scholar] [CrossRef] [PubMed]
  3. Fizazi, K.; Tran, N.; Fein, L.; Matsubara, N.; Rodriguez-Antolin, A.; Alekseev, B.Y.; Özgüroğlu, M.; Ye, D.; Feyerabend, S.; Protheroe, A.; et al. Abiraterone plus Prednisone in Metastatic, Castration-Sensitive Prostate Cancer. N. Engl. J. Med. 2017, 377, 352–360. [Google Scholar] [CrossRef] [PubMed]
  4. James, N.D.; De Bono, J.S.; Spears, M.R.; Clarke, N.W.; Mason, M.D.; Dearnaley, D.P.; Ritchie, A.W.S.; Amos, C.L.; Gilson, C.; Jones, R.J.; et al. Abiraterone for Prostate Cancer Not Previously Treated with Hormone Therapy. N. Engl. J. Med. 2017, 377, 338–351. [Google Scholar] [CrossRef]
  5. Davis, I.D.; Martin, A.J.; Stockler, M.R.; Begbie, S.; Chi, K.N.; Chowdhury, S.; Coskinas, X.; Frydenberg, M.; Hague, W.E.; Horvath, L.G.; et al. Enzalutamide with Standard First-Line Therapy in Metastatic Prostate Cancer. N. Engl. J. Med. 2019, 381, 121–131. [Google Scholar] [CrossRef]
  6. Chi, K.N.; Agarwal, N.; Bjartell, A.; Chung, B.H.; Pereira de Santana Gomes, A.J.; Given, R.; Juárez Soto, Á.; Merseburger, A.S.; Özgüroğlu, M.; Uemura, H.; et al. Apalutamide for Metastatic, Castration-Sensitive Prostate Cancer. N. Engl. J. Med. 2019, 381, 13–24. [Google Scholar] [CrossRef]
  7. Fizazi, K.; Foulon, S.; Carles, J.; Roubaud, G.; McDermott, R.; Fléchon, A.; Tombal, B.; Supiot, S.; Berthold, D.; Ronchin, P.; et al. Abiraterone plus Prednisone Added to Androgen Deprivation Therapy and Docetaxel in de Novo Metastatic Castration-Sensitive Prostate Cancer (PEACE-1): A Multicentre, Open-Label, Randomised, Phase 3 Study with a 2 × 2 Factorial Design. Lancet 2022, 399, 1695–1707. [Google Scholar] [CrossRef]
  8. Smith, M.R.; Hussain, M.; Saad, F.; Fizazi, K.; Sternberg, C.N.; Crawford, E.D.; Kopyltsov, E.; Park, C.H.; Alekseev, B.; Montesa-Pino, Á.; et al. Darolutamide and Survival in Metastatic, Hormone-Sensitive Prostate Cancer. N. Engl. J. Med. 2022, 386, 1132–1142. [Google Scholar] [CrossRef]
  9. Aparicio, A.M.; Shen, L.; Tapia, E.L.N.; Lu, J.-F.; Chen, H.-C.; Zhang, J.; Wu, G.; Wang, X.; Troncoso, P.; Corn, P.; et al. Combined Tumor Suppressor Defects Characterize Clinically Defined Aggressive Variant Prostate Cancers. Clin. Cancer Res. 2016, 22, 1520–1530. [Google Scholar] [CrossRef]
  10. Jiménez, N.; Garcia De Herreros, M.; Reig, Ò.; Marín-Aguilera, M.; Aversa, C.; Ferrer-Mileo, L.; García-Esteve, S.; Rodríguez-Carunchio, L.; Trias, I.; Font, A.; et al. Development and Independent Validation of a Prognostic Gene Expression Signature Based on RB1, PTEN, and TP53 in Metastatic Hormone-Sensitive Prostate Cancer Patients. Eur. Urol. Oncol. 2024, S2588931124000257. [Google Scholar] [CrossRef]
  11. Truqap Combination in PTEN-Deficient Metastatic Hormone-Sensitive Prostate Cancer Demonstrated Statistically Significant and Clinically Meaningful Improvement in Radiographic Progression-Free Survival in CAPItello-281 Phase III Trial; News Release; AstraZeneca: Cambridge, UK, 2024.
  12. Chalhoub, N.; Baker, S.J. PTEN and the PI3-Kinase Pathway in Cancer. Annu. Rev. Pathol. Mech. Dis. 2009, 4, 127–150. [Google Scholar] [CrossRef] [PubMed]
  13. Lee, Y.-R.; Chen, M.; Pandolfi, P.P. The Functions and Regulation of the PTEN Tumour Suppressor: New Modes and Prospects. Nat. Rev. Mol. Cell Biol. 2018, 19, 547–562. [Google Scholar] [CrossRef] [PubMed]
  14. Jamaspishvili, T.; Berman, D.M.; Ross, A.E.; Scher, H.I.; De Marzo, A.M.; Squire, J.A.; Lotan, T.L. Clinical Implications of PTEN Loss in Prostate Cancer. Nat. Rev. Urol. 2018, 15, 222–234. [Google Scholar] [CrossRef]
  15. Tortorella, E.; Giantulli, S.; Sciarra, A.; Silvestri, I. AR and PI3K/AKT in Prostate Cancer: A Tale of Two Interconnected Pathways. Int. J. Mol. Sci. 2023, 24, 2046. [Google Scholar] [CrossRef]
  16. Carver, B.S.; Chapinski, C.; Wongvipat, J.; Hieronymus, H.; Chen, Y.; Chandarlapaty, S.; Arora, V.K.; Le, C.; Koutcher, J.; Scher, H.; et al. Reciprocal Feedback Regulation of PI3K and Androgen Receptor Signaling in PTEN-Deficient Prostate Cancer. Cancer Cell 2011, 19, 575–586. [Google Scholar] [CrossRef]
  17. Velez, M.G.; Kosiorek, H.E.; Egan, J.B.; McNatty, A.L.; Riaz, I.B.; Hwang, S.R.; Stewart, G.A.; Ho, T.H.; Moore, C.N.; Singh, P.; et al. Differential Impact of Tumor Suppressor Gene (TP53, PTEN, RB1) Alterations and Treatment Outcomes in Metastatic, Hormone-Sensitive Prostate Cancer. Prostate Cancer Prostatic Dis. 2022, 25, 479–483. [Google Scholar] [CrossRef] [PubMed]
  18. Ferraldeschi, R.; Nava Rodrigues, D.; Riisnaes, R.; Miranda, S.; Figueiredo, I.; Rescigno, P.; Ravi, P.; Pezaro, C.; Omlin, A.; Lorente, D.; et al. PTEN Protein Loss and Clinical Outcome from Castration-Resistant Prostate Cancer Treated with Abiraterone Acetate. Eur. Urol. 2015, 67, 795–802. [Google Scholar] [CrossRef]
  19. Hamid, A.A.; Huang, H.-C.; Wang, V.; Chen, Y.-H.; Feng, F.; Den, R.; Attard, G.; Van Allen, E.M.; Tran, P.T.; Spratt, D.E.; et al. Transcriptional Profiling of Primary Prostate Tumor in Metastatic Hormone-Sensitive Prostate Cancer and Association with Clinical Outcomes: Correlative Analysis of the E3805 CHAARTED Trial. Ann. Oncol. 2021, 32, 1157–1166. [Google Scholar] [CrossRef]
  20. Soundararajan, R.; Viscuse, P.; Pilie, P.; Liu, J.; Logotheti, S.; Laberiano Fernández, C.; Lorenzini, D.; Hoang, A.; Lu, W.; Soto, L.M.S.; et al. Genotype-to-Phenotype Associations in the Aggressive Variant Prostate Cancer Molecular Profile (AVPC-m) Components. Cancers 2022, 14, 3233. [Google Scholar] [CrossRef]
  21. Parry, M.A.; Grist, E.; Mendes, L.; Dutey-Magni, P.; Sachdeva, A.; Brawley, C.; Murphy, L.; Proudfoot, J.; Lall, S.; Liu, Y.; et al. Clinical Testing of Transcriptome-Wide Expression Profiles in High-Risk Localized and Metastatic Prostate Cancer Starting Androgen Deprivation Therapy: An Ancillary Study of the STAMPEDE Abiraterone Phase 3 Trial. Res. Sq. 2023. [Google Scholar] [CrossRef]
  22. Cetintas, V.B.; Batada, N.N. Is There a Causal Link between PTEN Deficient Tumors and Immunosuppressive Tumor Microenvironment? J. Transl. Med. 2020, 18, 45. [Google Scholar] [CrossRef] [PubMed]
  23. Imada, E.L.; Sanchez, D.F.; Dinalankara, W.; Vidotto, T.; Ebot, E.M.; Tyekucheva, S.; Franco, G.R.; Mucci, L.A.; Loda, M.; Schaeffer, E.M.; et al. Transcriptional Landscape of PTEN Loss in Primary Prostate Cancer. BMC Cancer 2021, 21, 856. [Google Scholar] [CrossRef] [PubMed]
  24. Fan, C.; Prat, A.; Parker, J.S.; Liu, Y.; Carey, L.A.; Troester, M.A.; Perou, C.M. Building Prognostic Models for Breast Cancer Patients Using Clinical Variables and Hundreds of Gene Expression Signatures. BMC Med. Genom. 2011, 4, 3. [Google Scholar] [CrossRef] [PubMed]
  25. Zhao, H.; Zeng, Y.; Han, Z.; Zhuo, Y.; Liang, Y.; Hon, C.T.; Wan, S.; Wu, S.; Dahl, D.; Zhong, W.; et al. Novel Immune-Related Signature for Risk Stratification and Prognosis in Prostatic Adenocarcinoma. Cancer Sci. 2021, 112, 4365–4376. [Google Scholar] [CrossRef]
  26. Beltran, H.; Prandi, D.; Mosquera, J.M.; Benelli, M.; Puca, L.; Cyrta, J.; Marotz, C.; Giannopoulou, E.; Chakravarthi, B.V.S.K.; Varambally, S.; et al. Divergent Clonal Evolution of Castration-Resistant Neuroendocrine Prostate Cancer. Nat. Med. 2016, 22, 298–305. [Google Scholar] [CrossRef]
  27. Yang, R.; Wang, M.; Zhang, G.; Bao, Y.; Wu, Y.; Li, X.; Yang, W.; Cui, H. E2F7−EZH2 Axis Regulates PTEN/AKT/mTOR Signalling and Glioblastoma Progression. Br. J. Cancer 2020, 123, 1445–1455. [Google Scholar] [CrossRef]
  28. Saal, L.H.; Johansson, P.; Holm, K.; Gruvberger-Saal, S.K.; She, Q.-B.; Maurer, M.; Koujak, S.; Ferrando, A.A.; Malmström, P.; Memeo, L.; et al. Poor Prognosis in Carcinoma Is Associated with a Gene Expression Signature of Aberrant PTEN Tumor Suppressor Pathway Activity. Proc. Natl. Acad. Sci. USA 2007, 104, 7564–7569. [Google Scholar] [CrossRef]
  29. Liu, D.; Augello, M.A.; Grbesa, I.; Prandi, D.; Liu, Y.; Shoag, J.E.; Karnes, R.J.; Trock, B.J.; Klein, E.A.; Den, R.B.; et al. Tumor Subtype Defines Distinct Pathways of Molecular and Clinical Progression in Primary Prostate Cancer. J. Clin. Investig. 2021, 131, e147878. [Google Scholar] [CrossRef]
  30. Liao, C.-H.; Wang, Y.-H.; Chang, W.-W.; Yang, B.-C.; Wu, T.-J.; Liu, W.-L.; Yu, A.L.; Yu, J. Leucine-Rich Repeat Neuronal Protein 1 Regulates Differentiation of Embryonic Stem Cells by Post-Translational Modifications of Pluripotency Factors. Stem Cells 2018, 36, 1514–1524. [Google Scholar] [CrossRef]
  31. Quintanal-Villalonga, A.; Kawasaki, K.; Redin, E.; Uddin, F.; Rakhade, S.; Durani, V.; Sabet, A.; Shafer, M.; Karthaus, W.R.; Zaidi, S.; et al. CDC7 Inhibition Impairs Neuroendocrine Transformation in Lung and Prostate Tumors through MYC Degradation. Signal Transduct. Target. Ther. 2024, 9, 1–14. [Google Scholar] [CrossRef]
  32. Frazzi, R. BIRC3 and BIRC5: Multi-faceted Inhibitors in Cancer. Cell Biosci. 2021, 11, 8. [Google Scholar] [CrossRef]
  33. Yu, T.; Liu, Z.; Tao, Q.; Xu, X.; Li, X.; Li, Y.; Chen, M.; Liu, R.; Chen, D.; Wu, M.; et al. Targeting Tumor-Intrinsic SLC16A3 to Enhance Anti-PD-1 Efficacy via Tumor Immune Microenvironment Reprogramming. Cancer Lett. 2024, 589, 216824. [Google Scholar] [CrossRef] [PubMed]
  34. Coleman, N.; Moyers, J.T.; Harbery, A.; Vivanco, I.; Yap, T.A. Clinical Development of AKT Inhibitors and Associated Predictive Biomarkers to Guide Patient Treatment in Cancer Medicine. Pharmacogenom. Pers. Med. 2021, 14, 1517–1535. [Google Scholar] [CrossRef]
  35. Carceles-Cordon, M.; Orme, J.J.; Domingo-Domenech, J.; Rodriguez-Bravo, V. The Yin and Yang of Chromosomal Instability in Prostate Cancer. Nat. Rev. Urol. 2024, 1–16. [Google Scholar] [CrossRef] [PubMed]
  36. Al-Subhi, N.; Ali, R.; Abdel-Fatah, T.; Moseley, P.M.; Chan, S.Y.T.; Green, A.R.; Ellis, I.O.; Rakha, E.A.; Madhusudan, S. Targeting Ataxia Telangiectasia-Mutated- and Rad3-Related Kinase (ATR) in PTEN-Deficient Breast Cancers for Personalized Therapy. Breast Cancer Res. Treat. 2018, 169, 277–286. [Google Scholar] [CrossRef]
  37. Kim, O.; Butler, M.; Sergi, Z.; Robey, R.W.; Zhang, M.; Chari, R.; Pang, Y.; Yu, G.; Zhang, W.; Song, H.; et al. Combined Inhibition of Topoisomerase I and Poly(ADP-Ribose) Polymerase: A Synergistic Therapeutic Strategy for Glioblastoma with Phosphatase and Tensin Homolog Deficiency. Neurooncol. Adv. 2023, 5, vdad102. [Google Scholar] [CrossRef] [PubMed]
  38. Sweeney, C.; Bracarda, S.; Sternberg, C.N.; Chi, K.N.; Olmos, D.; Sandhu, S.; Massard, C.; Matsubara, N.; Alekseev, B.; Parnis, F.; et al. Ipatasertib plus Abiraterone and Prednisolone in Metastatic Castration-Resistant Prostate Cancer (IPATential150): A Multicentre, Randomised, Double-Blind, Phase 3 Trial. Lancet 2021, 398, 131–142. [Google Scholar] [CrossRef]
  39. Fizazi, K.; George, D.J.; De Santis, M.; Clarke, N.; Fay, A.P.; Uemura, H.; Grinsted, L.; Rooney, C.; Verheijen, R.B.; Anjum, R.; et al. A Phase III Trial of Capivasertib and Abiraterone versus Placebo and Abiraterone in Patients with de Novo Metastatic Hormone-Sensitive Prostate Cancer Characterized by PTEN Deficiency (CAPItello-281). J. Clin. Oncol. 2021, 39, TPS178. [Google Scholar] [CrossRef]
  40. Chen, J.; Shi, M.; Chuen Choi, S.Y.; Wang, Y.; Lin, D.; Zeng, H.; Wang, Y. Genomic Alterations in Neuroendocrine Prostate Cancer: A Systematic Review and Meta-analysis. BJUI Compass 2023, 4, 256–265. [Google Scholar] [CrossRef]
  41. Duan, R.; Du, W.; Guo, W. EZH2: A Novel Target for Cancer Treatment. J. Hematol. Oncol. 2020, 13, 104. [Google Scholar] [CrossRef]
  42. Calvo, M.; Penkov, K.; Spira, A.I.; Moreno Candilejo, I.; Shore, N.D.; Zhang, T.; Mellado-Gonzalez, B.; Alonso Gordoa, T.; Paz-Ares Rodriguez, L.; Tarantolo, S.R.; et al. A Multi-Center, Open-Label, Randomized Dose Expansion Study of PF-06821497, a Potent and Selective Inhibitor of Enhancer of Zeste Homolog 2 (EZH2), in Patients with Metastatic Castration-Resistant Prostate Cancer (mCRPC). J. Clin. Oncol. 2023, 41, TPS282. [Google Scholar] [CrossRef]
  43. Schweizer, M.T.; Penkov, K.; Choudhury, A.D.; Calvo, E.; Frank, R.C.; Liu, L.; Mittapalli, R.K.; Tougias, J.; Andreu-Vieyra, C.; Bowler, T.G.; et al. Phase 1 Trial of Mevrometostat (PF-06821497), a Potent and Selective Inhibitor of Enhancer of Zeste Homolog 2 (EZH2), in Castration-Resistant Prostate Cancer (CRPC). J. Clin. Oncol. 2024, 42, 5061. [Google Scholar] [CrossRef]
  44. Vidotto, T.; Melo, C.M.; Lautert-Dutra, W.; Chaves, L.P.; Reis, R.B.; Squire, J.A. Pan-Cancer Genomic Analysis Shows Hemizygous PTEN Loss Tumors Are Associated with Immune Evasion and Poor Outcome. Sci. Rep. 2023, 13, 5049. [Google Scholar] [CrossRef]
  45. Peng, W.; Chen, J.Q.; Liu, C.; Malu, S.; Creasy, C.; Tetzlaff, M.T.; Xu, C.; McKenzie, J.A.; Zhang, C.; Liang, X.; et al. Loss of PTEN Promotes Resistance to T Cell–Mediated Immunotherapy. Cancer Discov. 2016, 6, 202–216. [Google Scholar] [CrossRef]
  46. Li, S.; Zhu, M.; Pan, R.; Fang, T.; Cao, Y.-Y.; Chen, S.; Zhao, X.; Lei, C.-Q.; Guo, L.; Chen, Y.; et al. The Tumor Suppressor PTEN Has a Critical Role in Antiviral Innate Immunity. Nat. Immunol. 2016, 17, 241–249. [Google Scholar] [CrossRef] [PubMed]
  47. Trigunaite, A.; Dimo, J.; Jørgensen, T.N. Suppressive Effects of Androgens on the Immune System. Cell. Immunol. 2015, 294, 87–94. [Google Scholar] [CrossRef] [PubMed]
  48. Jiménez, N.; Reig, Ò.; Marín-Aguilera, M.; Aversa, C.; Ferrer-Mileo, L.; Font, A.; Rodriguez-Vida, A.; Climent, M.Á.; Cros, S.; Chirivella, I.; et al. Transcriptional Profile Associated with Clinical Outcomes in Metastatic Hormone-Sensitive Prostate Cancer Treated with Androgen Deprivation and Docetaxel. Cancers 2022, 14, 4757. [Google Scholar] [CrossRef]
  49. Liberzon, A.; Birger, C.; Thorvaldsdóttir, H.; Ghandi, M.; Mesirov, J.P.; Tamayo, P. The Molecular Signatures Database Hallmark Gene Set Collection. Cell Syst. 2015, 1, 417–425. [Google Scholar] [CrossRef]
  50. Larionova, I.; Tashireva, L. Immune Gene Signatures as Prognostic Criteria for Cancer Patients. Ther. Adv. Med. Oncol. 2023, 15, 17588359231189436. [Google Scholar] [CrossRef]
  51. Scher, H.I.; Halabi, S.; Tannock, I.; Morris, M.; Sternberg, C.N.; Carducci, M.A.; Eisenberger, M.A.; Higano, C.; Bubley, G.J.; Dreicer, R.; et al. Design and End Points of Clinical Trials for Patients with Progressive Prostate Cancer and Castrate Levels of Testosterone: Recommendations of the Prostate Cancer Clinical Trials Working Group. J. Clin. Oncol. 2008, 26, 1148–1159. [Google Scholar] [CrossRef]
Figure 1. Clinical outcomes according to PTEN expression status. Kaplan–Meier curves representing CRPC-free survival (CRPC-FS) (A) and overall survival (OS) (B) according to PTEN expression (nCounter) in all patients; forest plots representing the univariate (C,D) and multivariate (E,F) analysis for CRPC-FS and OS in all patients. ADT: androgen deprivation therapy; ARSI: androgen receptor signaling inhibitors; CI: confidence interval; D: docetaxel; m: median months. Significant p values (p < 0.05) are indicated in bold.
Ijms 26 06244 g001
Figure 2. Clinical outcomes according to PTEN expression status in the CHAARTED trial patients. Kaplan–Meier curves representing CRPC-free survival (CRPC-FS) (A) and overall survival (OS) (B) according to PTEN expression of microarray data from the CHAARTED trial; forest plots representing the multivariate analysis for CRPC-FS (C) and OS (D) in the CHAARTED trial patients; Kaplan–Meier curves representing CRPC-FS (E,G) and OS (F,H) for patients from the CHAARTED trial according to PTEN expression segregated by treatment arm. ADT: androgen deprivation therapy; CI: confidence interval; D: docetaxel; ECOG: Eastern Cooperative Oncology Group; m: median months; significant p values (p < 0.05) are indicated in bold.
Ijms 26 06244 g002
Figure 3. Transcriptional characterization of PTENlow tumors. (A) Volcano plot of differential expressed genes (DEGs) in PTENlow tumors vs. PTENwt (FDR < 0.1); gene names in blue indicate DEGs with a significant FDR < 0.05; (B) flowchart diagram of DEGs in PTENlow tumors, according to cellular localization and available inhibitors; (C) gene set enrichment analysis (GSEA) of hallmark MSigDB pathways in the PTENlow tumors vs. PTENwt (RNA-Seq, n = 60); (D) Venn diagram of the overexpressed pathways found in this study and the CHAARTED trial microarrays (p-adj < 0.1) from GSEA of hallmark MSigDB pathways in the PTENlow tumors vs. PTENwt.
Ijms 26 06244 g003
Figure 4. PTEN-low related signature. (A) Expression heatmap of the PTEN-low related signature genes in microarray data from the CHAARTED trial; Kaplan–Meier representing CRPC-free survival (CRPC-FS) (B) and overall survival (OS) (C) and forest plots representing the multivariate analysis according to classification by the PTEN-low signature in the training cohort of CHAARTED trial patients. ADT: androgen deprivation therapy; CI: confidence interval; D: docetaxel; m: median months; significant p values (p < 0.05) are indicated in bold.
Ijms 26 06244 g004
Figure 5. Immune microenvironment characterization of tumors according to PTEN expression status. (A) Gene set enrichment analysis (GSEA) of immune microenvironment populations and signatures in the PTENlow tumors vs. PTENwt (RNA-Seq); (B) boxplots of the most relevant immune cell signatures expression (ssGSEA score) in PTENlow tumors vs. PTENwt (Wilcoxon-test p-value); EMT: epithelial–mesenchymal transition; GEP: T-cell inflamed gene expression profile; IGG: 14-gene immunoglobuline signature; M2 Macrophages: macrophages with M2 differentiation over M1; PRAD: prostate adenocarcinoma.
Ijms 26 06244 g005
Figure 6. Neuroendocrine genes and clinical outcomes according to PTEN and EZH2 expression status. (A) Correlation matrix between PTEN and neuroendocrine genes from RNA-Seq expression values (correlation coefficient (r) and colored dots if p < 0.05); (B) boxplot of EZH2 expression according to PTEN status (nCounter) (Wilcoxon test p-value); (C) spine plot representing the proportion of patients according to PTEN and EZH2 expression status (nCounter) (Fisher’s exact test p-value); Kaplan–Meier curves representing CRPC-free survival (CRPC-FS) (D) and overall survival (OS) (E) of all patients according to PTENlow-EZH2high expression (nCounter); (F) forest plots representing the multivariate analysis for CRPC-FS and OS in all patients. ADT: androgen deprivation therapy; ARSI: androgen receptor signaling inhibitors; CI: confidence interval; m: median months; pts: patients. Significant p values (p < 0.05) are indicated in bold.
Ijms 26 06244 g006
Table 1. Characteristics of all patients (ADT, ADT + D, and ADT + ARSI cohorts) and all patients segregated according to PTEN expression.
All PatientsPTENlowPTENwtp-Value
Patients, n (%)355100 (28.2)255 (71.8) *
Age (years)
Median (range)68.1 (46.3–92.8)69.7 (47.7–86.5)67.8 (46.3–92.8)0.456
PSA at diagnosis (ng/mL)
Median (range)40.3 (0.02–7448)32.5 (1.8–4860)42 (0.02–7448)0.452
ECOG performance status score, n (%)
0135 (38)35 (35)100 (39.2)0.542
1 or 2196 (55.2)61 (61)135 (52.9)
NA24 (6.8)4 (4)20 (7.8)
Stage at diagnosis, n (%)
<IV70 (19.7)16 (16)54 (21.2)0.3
IV271 (76.3)80 (80)191 (74.9)
NA14 (3.9)4 (4)10 (3.9)
Gleason sum at diagnosis, n (%)
≤784 (23.7)20 (20)64 (25.1)0.402
≥8261 (73.5)76 (76)185 (72.5)
NA10 (2.8)4 (4)6 (2.4)
Presence of visceral metastases, n (%)
Yes55 (15.5)20 (20)35 (13.7)0.142
No296 (83.4)78 (78)218 (85.5)
NA4 (1.1)2 (2)2 (0.8)
Disease volume, n (%)
High221 (62.3)64 (64)157 (61.6)0.537
Low129 (36.6)33 (33)96 (37.6)
NA5 (1.4)3 (3)2 (0.8)
ADT: androgen deprivation therapy; ARSI: androgen receptor signaling inhibitor; D: docetaxel; ECOG: Eastern Cooperative Oncology Group; n: number of cases; NA: not available; PSA: prostate-specific antigen. p-value is based on Fisher exact test and Wilcoxon Mann–Whitney test for categorical and continuous variables, respectively. * Five patients were excluded from survival analysis due to lack of complete follow-up data.
Disclaimer/Publisher’s Note: The statements, opinions and data contained in all publications are solely those of the individual author(s) and contributor(s) and not of MDPI and/or the editor(s). MDPI and/or the editor(s) disclaim responsibility for any injury to people or property resulting from any ideas, methods, instructions or products referred to in the content.

