1. Introduction
Prion diseases, also referred to as transmissible spongiform encephalopathies (TSEs), occupy a unique position among neurodegenerative conditions due to their infectious nature and the central role played by misfolded scrapie prion protein (PrP
Sc) [
1,
2]. According to the widely accepted “protein-only” hypothesis, prion pathogenesis arises when the normally soluble cellular prion protein (PrP
C) adopts a pathogenic β-sheet-rich conformation (PrP
Sc) capable of templating the misfolding of additional PrP
C molecules [
1]. This self-propagating mechanism has profoundly influenced how researchers conceptualize other protein misfolding disorders, including Alzheimer’s disease, Parkinson’s disease, and bovine spongiform encephalopathy, which all exhibit common features such as aberrant protein conformers and progressive neuronal degeneration [
3,
4]. Despite these advances, critical gaps remain in understanding how prion-like mechanisms intersect with inflammatory processes—especially those involving bacterial components—during the onset and progression of neurodegeneration.
Emerging evidence suggests that bacterial lipopolysaccharide (LPS), a major outer membrane component of Gram-negative bacteria, may contribute to or exacerbate prion-like processes. In vitro experiments have shown that LPS can induce the formation of protease-resistant recombinant prion protein (moPrP
Res) [
5,
6], suggesting intriguing possibilities about the role of bacterial factors in modulating pathological protein folding in vivo. Furthermore, chronic peripheral LPS exposure has been shown to aggravate the pathophysiology of other neurodegenerative proteinopathies, including Alzheimer’s and Parkinson’s diseases [
7,
8,
9,
10,
11]. In these models, LPS activates the innate immune system [
12,
13], leading to microglial overactivation and persistent neuroinflammation within the central nervous system (CNS), key processes that accelerate neuronal damage [
14,
15,
16]. Indeed, sustained peripheral LPS exposure can impair blood–brain barrier integrity, disrupt cytokine networks, and promote protein misfolding, thereby driving or amplifying neurodegenerative pathology [
15,
16,
17,
18,
19,
20].
Traditionally, experimental scrapie models employ intracerebral inoculation due to its relatively short incubation period. However, to better reflect natural prion transmission, peripheral routes such as subcutaneous injection have also been utilized, although they require longer incubation times [
12,
21]. Notably, subcutaneous administration has proven comparably effective in transmitting disease in various animal models and offers a more physiologically relevant approximation of how prions might disseminate from peripheral sites to the CNS [
12,
21].
Whether LPS alone—or in conjunction with a prion-like substrate—can trigger or hasten prion-like neurodegeneration in healthy animals remains uncertain. Addressing this question is vital for determining whether misfolded prion protein isoforms require inflammatory co-factors such as LPS to manifest full pathogenic potential in vivo, or whether they are intrinsically capable of initiating neurodegeneration. A clearer understanding of this interplay is especially relevant given the increasing recognition that many neurodegenerative disorders likely exist along a continuum of protein misfolding and inflammatory processes, rather than as wholly distinct disease entities.
In this study, we aimed to determine whether LPS-converted recombinant prion protein (moPrPRes), generated entirely in vitro by incubation with Escherichia coli O111:B4 LPS without traditional amplification methods like seeding or serial protein misfolding cyclic amplification (sPMCA), could independently induce prion-like neurodegeneration in wild-type mice following subcutaneous administration. In addition, we assessed whether chronic peripheral exposure to bacterial LPS alone—without classical prion agents—might trigger spongiform brain pathology and neurodegenerative changes. Finally, we explored the synergistic impact of co-administering LPS with a classical scrapie strain (Rocky Mountain Laboratory strain, RML) and moPrPRes on disease progression, neuropathological severity, and prion protein deposition. By investigating these interactions, our study seeks to demonstrate whether bacterial inflammatory stimuli may contribute to early-stage prion and other protein-misfolding neurodegenerative disorders.
2. Results
2.1. Chronic LPS Exposure Increases Body Weight While RML and PrPRes Treatments Suppress Growth in Mice
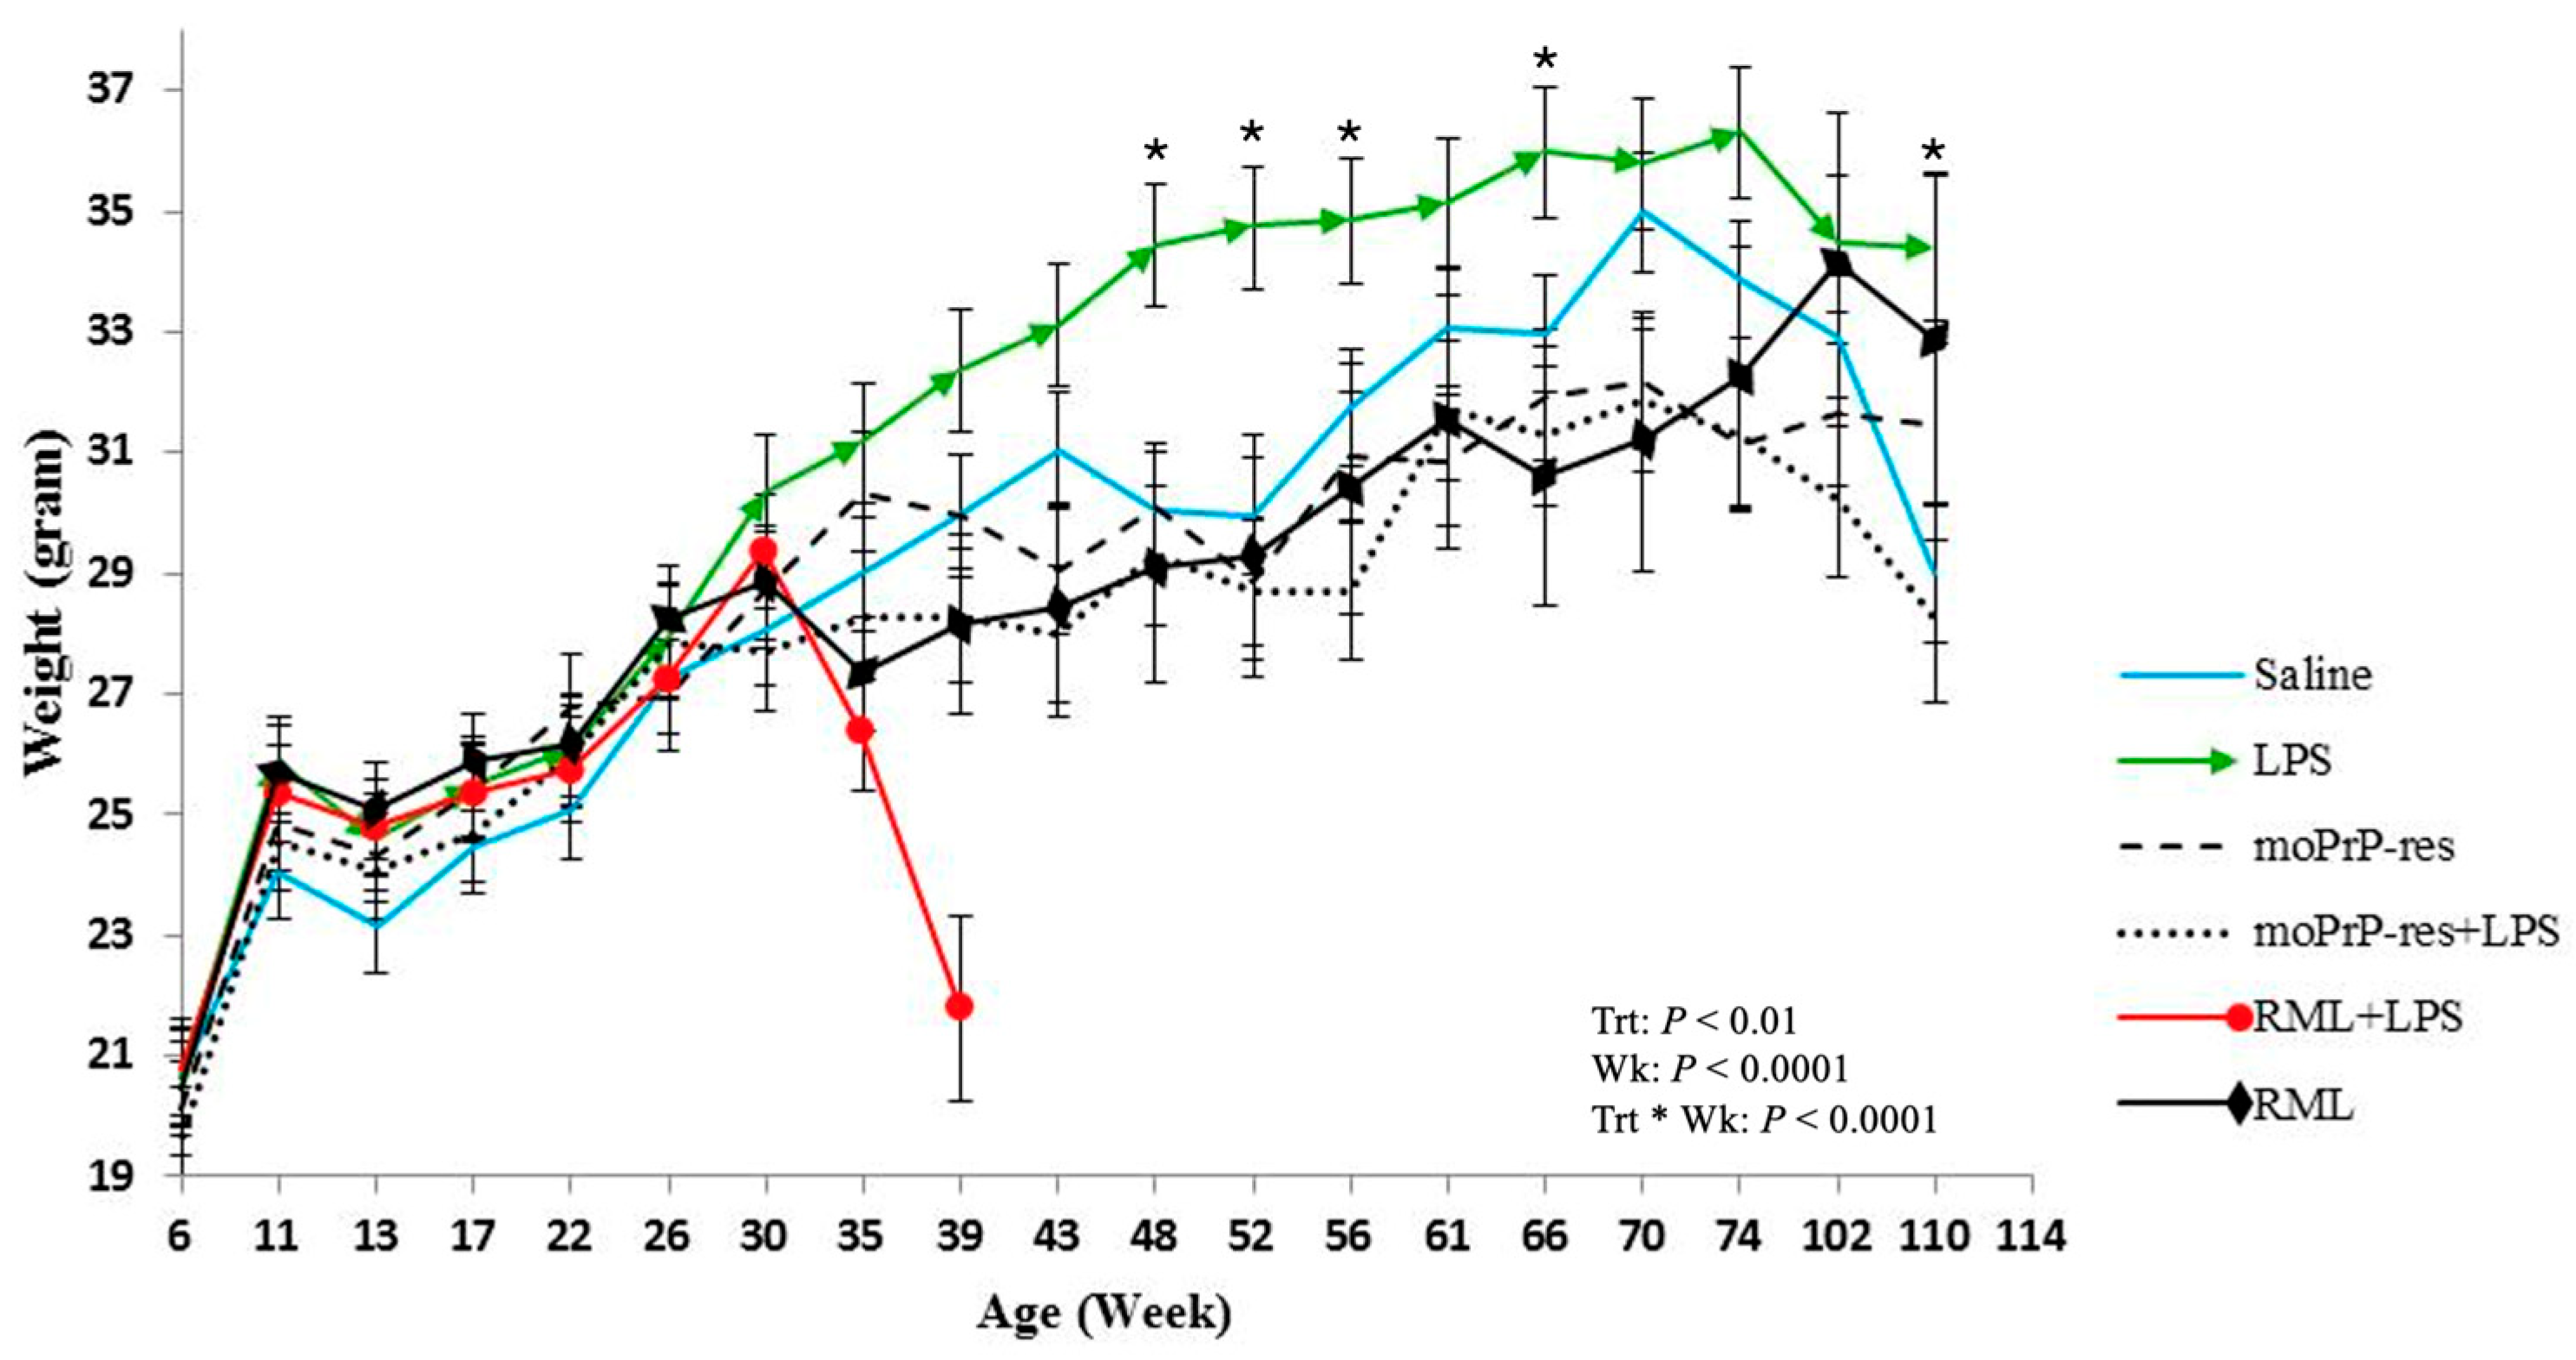
Body weight was recorded monthly across all experimental groups starting at 6 weeks of age and continuing through to the endpoint of each cohort (74, 102, or 110 weeks). Treatment-specific differences in body weight emerged over time (
Figure 1).
Mice treated with LPS exhibited a sustained increase in body weight, which became apparent around 30 weeks of age. Statistically significant differences (p < 0.05) in body weight were recorded at multiple time points when comparing LPS-treated animals to other groups: LPS versus RML at 35, 39, 43, 48, 52, and 66 weeks; LPS versus saline at 48, 52, 56, 66, and 110 weeks; LPS versus RML + LPS at 35 and 39 weeks; LPS versus moPrPRes at 43, 48, 52, 56, 61, 66, 70, and 74 weeks; and LPS versus moPrPRes + LPS at 39, 43, 48, 52, 56, 61, 66, 70, 74, 102, and 110 weeks.
The RML + LPS group showed a marked decline in body weight beginning around 30 weeks, with the lowest values observed between 35 and 39 weeks. This coincided with the earliest recorded clinical decline and mortality in this group.
moPrPRes-treated mice had higher mean body weights than the RML and RML + LPS groups at 35 and 39 weeks but remained consistently lower than LPS-treated mice from 43 to 74 weeks (p < 0.05). RML and moPrPRes groups showed reduced body weights relative to saline controls beginning at 30 weeks and continuing to study end.
These data document treatment-related differences in body weight profiles across the lifespan of mice subjected to various prion and inflammatory stimuli.
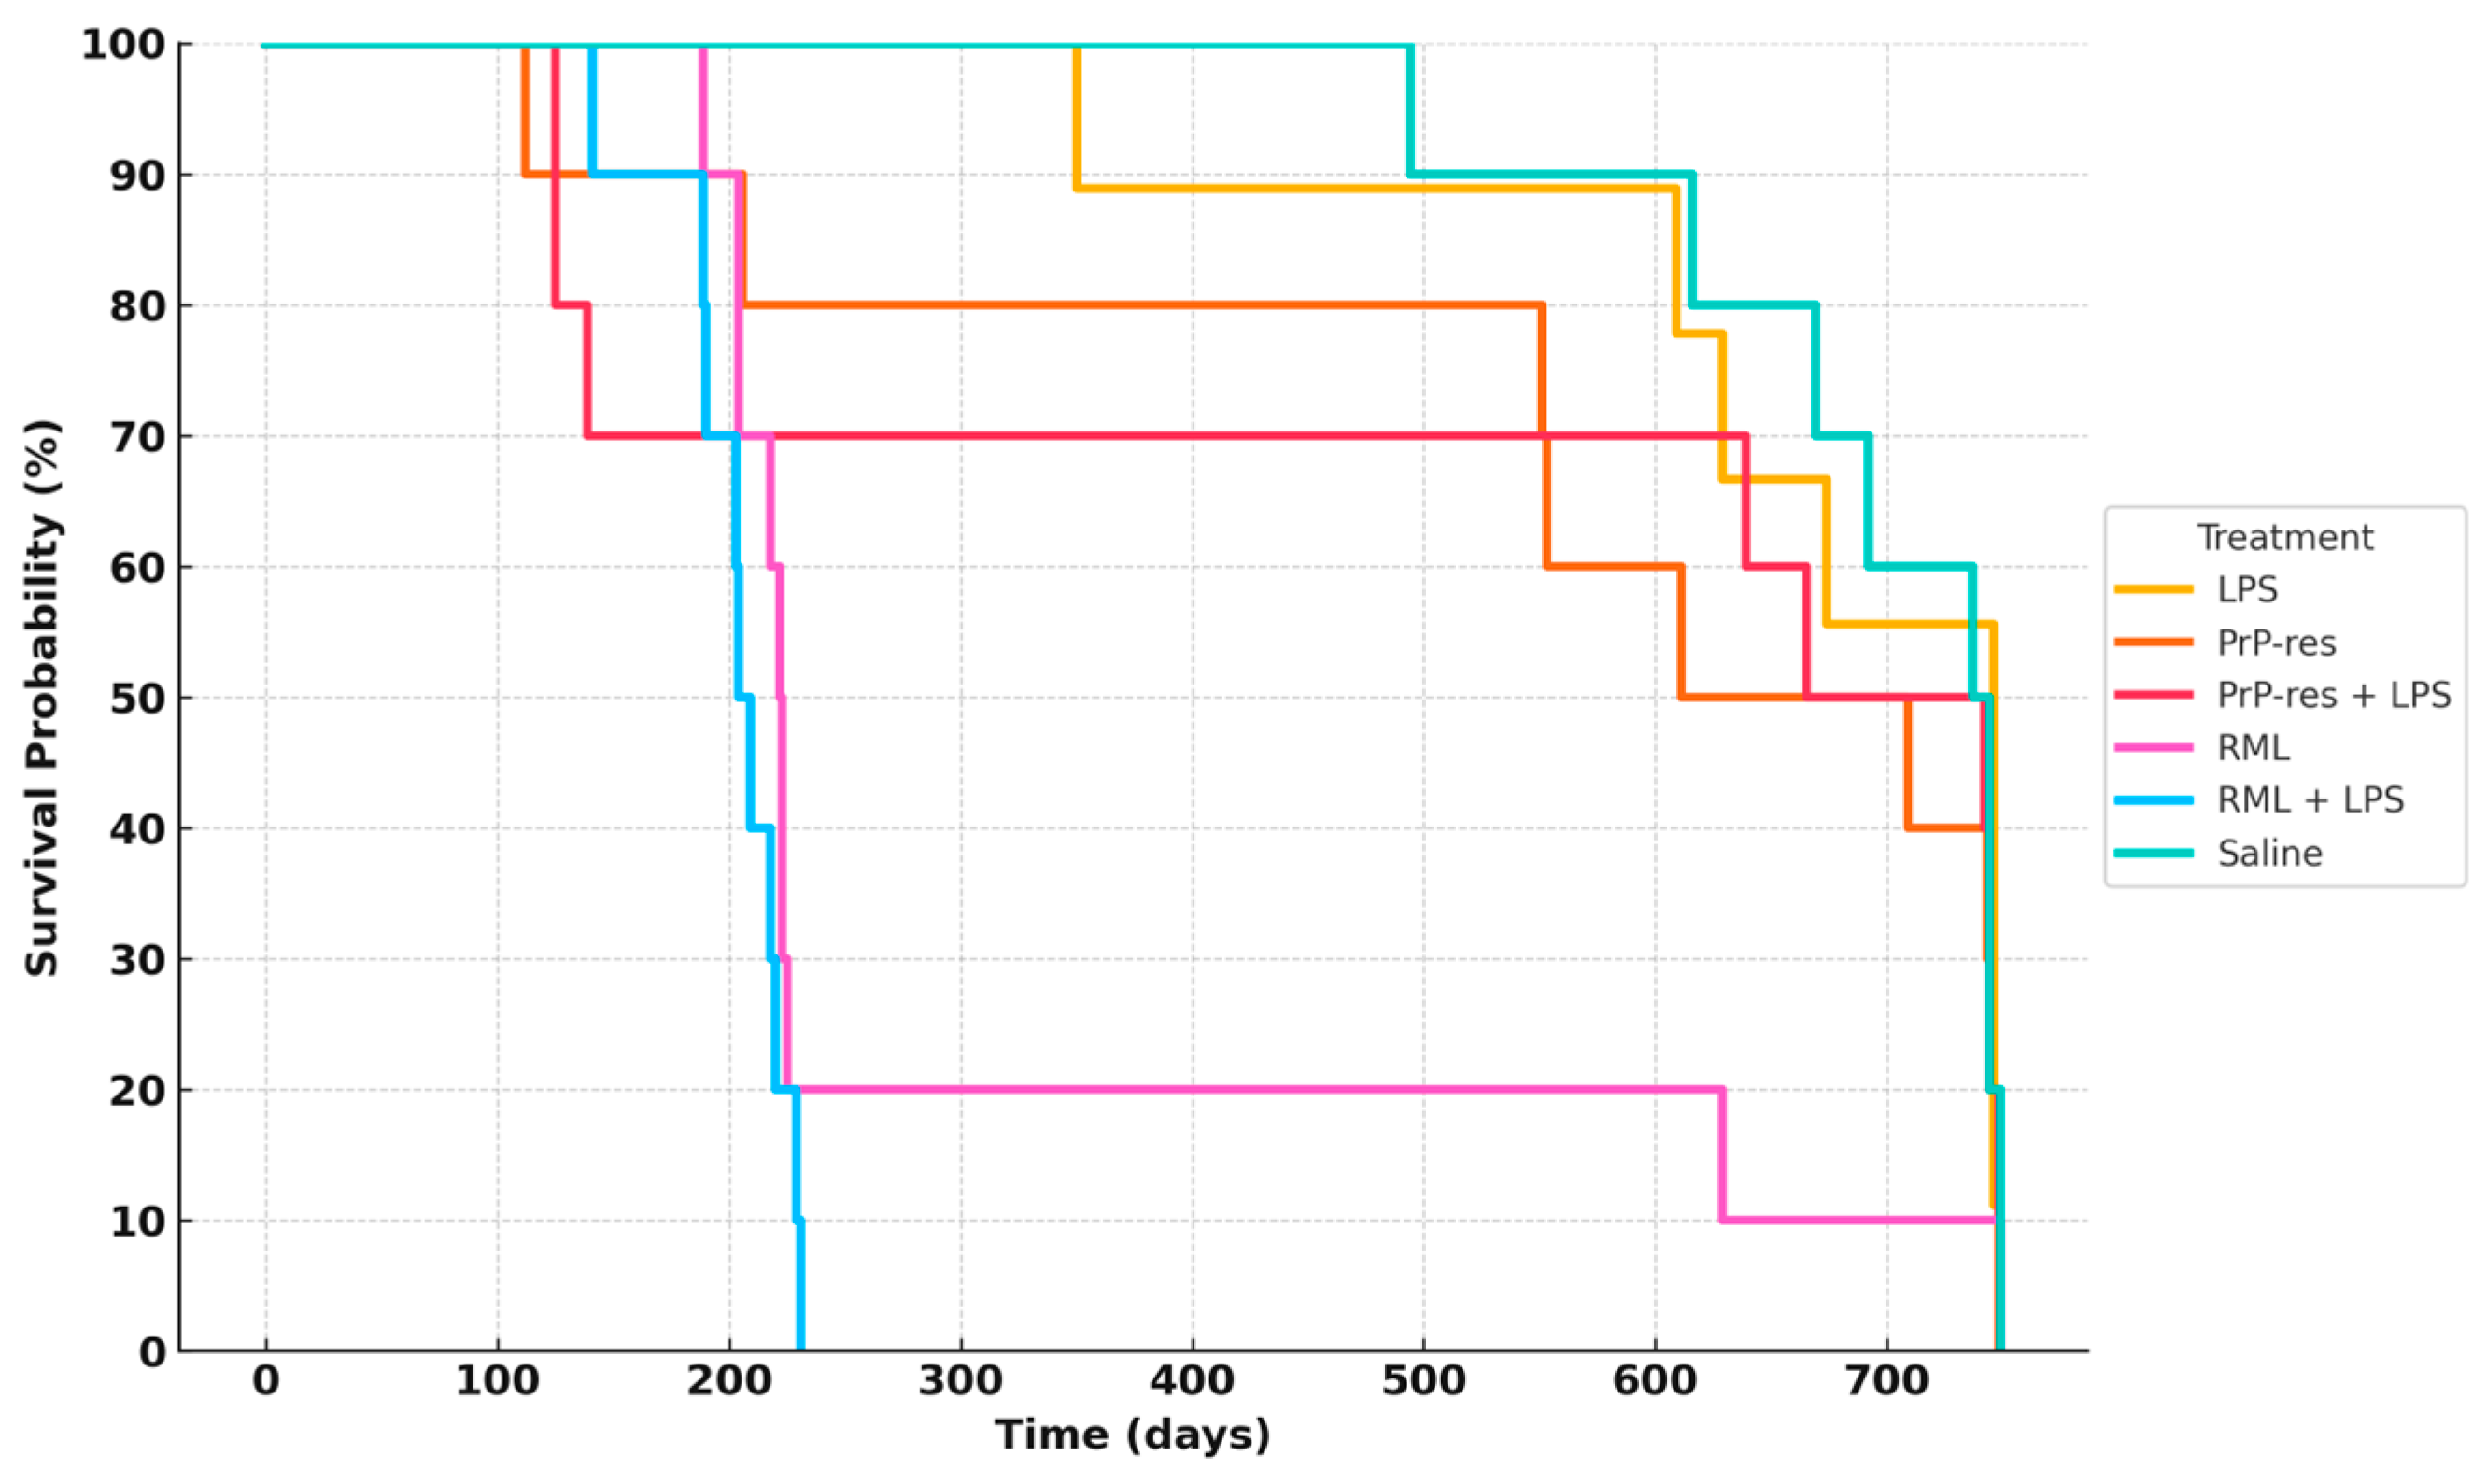
2.2. Survival Outcomes and Clinical Progression in Mice Treated with LPS, moPrPRes, and RML
Five mice from each treatment group were euthanized at 11 weeks post-infection (wpi) for early pathological assessment. At this stage, all animals were clinically normal, with no visible behavioral or neurological abnormalities. The remaining ten mice per group were monitored for survival and development of clinical signs.
Clinical signs observed across groups included kyphosis, ataxia, tremors, head tilt, tail rigidity, bradykinesia, proprioceptive deficits, stupor, and sustained weight loss (>72 h). These criteria were used to determine humane endpoints.
Figure 2 summarizes survival trajectories across all six groups.
In the RML-infected group, 80% of mice died by 200 days post-inoculation (dpi), while 10% survived up to approximately 700 dpi. In the RML + LPS group, 30% mortality occurred by 100 dpi, with complete mortality (100%) by 200 dpi. LPS-treated mice exhibited delayed mortality, with 10% death by 350 dpi and 40% cumulative mortality by 650 dpi; the remaining 60% survived to study termination at 110 weeks.
The moPrPRes group exhibited a 20% mortality rate by 200 dpi, increasing to 60% by study end (750 dpi). The moPrPRes + LPS group reached 30% mortality by 200 dpi and stabilized at 50% survival at endpoint.
2.3. Histopathological and Immunohistochemical Profiling of Neurodegeneration Across Treatment Groups
To complement the histopathological evaluation of neurodegeneration, all mice were monitored daily for clinical and behavioral abnormalities indicative of central nervous system dysfunction. Behavioral signs included kyphosis, ataxia, dysmetria, tremors, head tilt, tail rigidity, circling behavior, bradykinesia, proprioceptive deficits, stupor, loss of deep pain sensation, marked body weight loss, and diminished grooming—consistent with progressive neurodegeneration. Additional observations included reduced locomotor activity, hunched posture, impaired balance, and abnormal gait, all of which were particularly pronounced in terminally sick animals from the RML, RML + LPS, and moPrPRes + LPS groups. These behavioral abnormalities correlated closely with the highest vacuole counts and most extensive astrogliosis observed histologically. Although formal behavioral scoring was not performed, video documentation was collected to confirm the presence of consistent disease-associated phenotypes. These behavioral changes serve as functional correlates to the neuropathological findings and further support the conclusion that prion- and LPS-related treatments induced clinically relevant neurodegeneration in this experimental model.
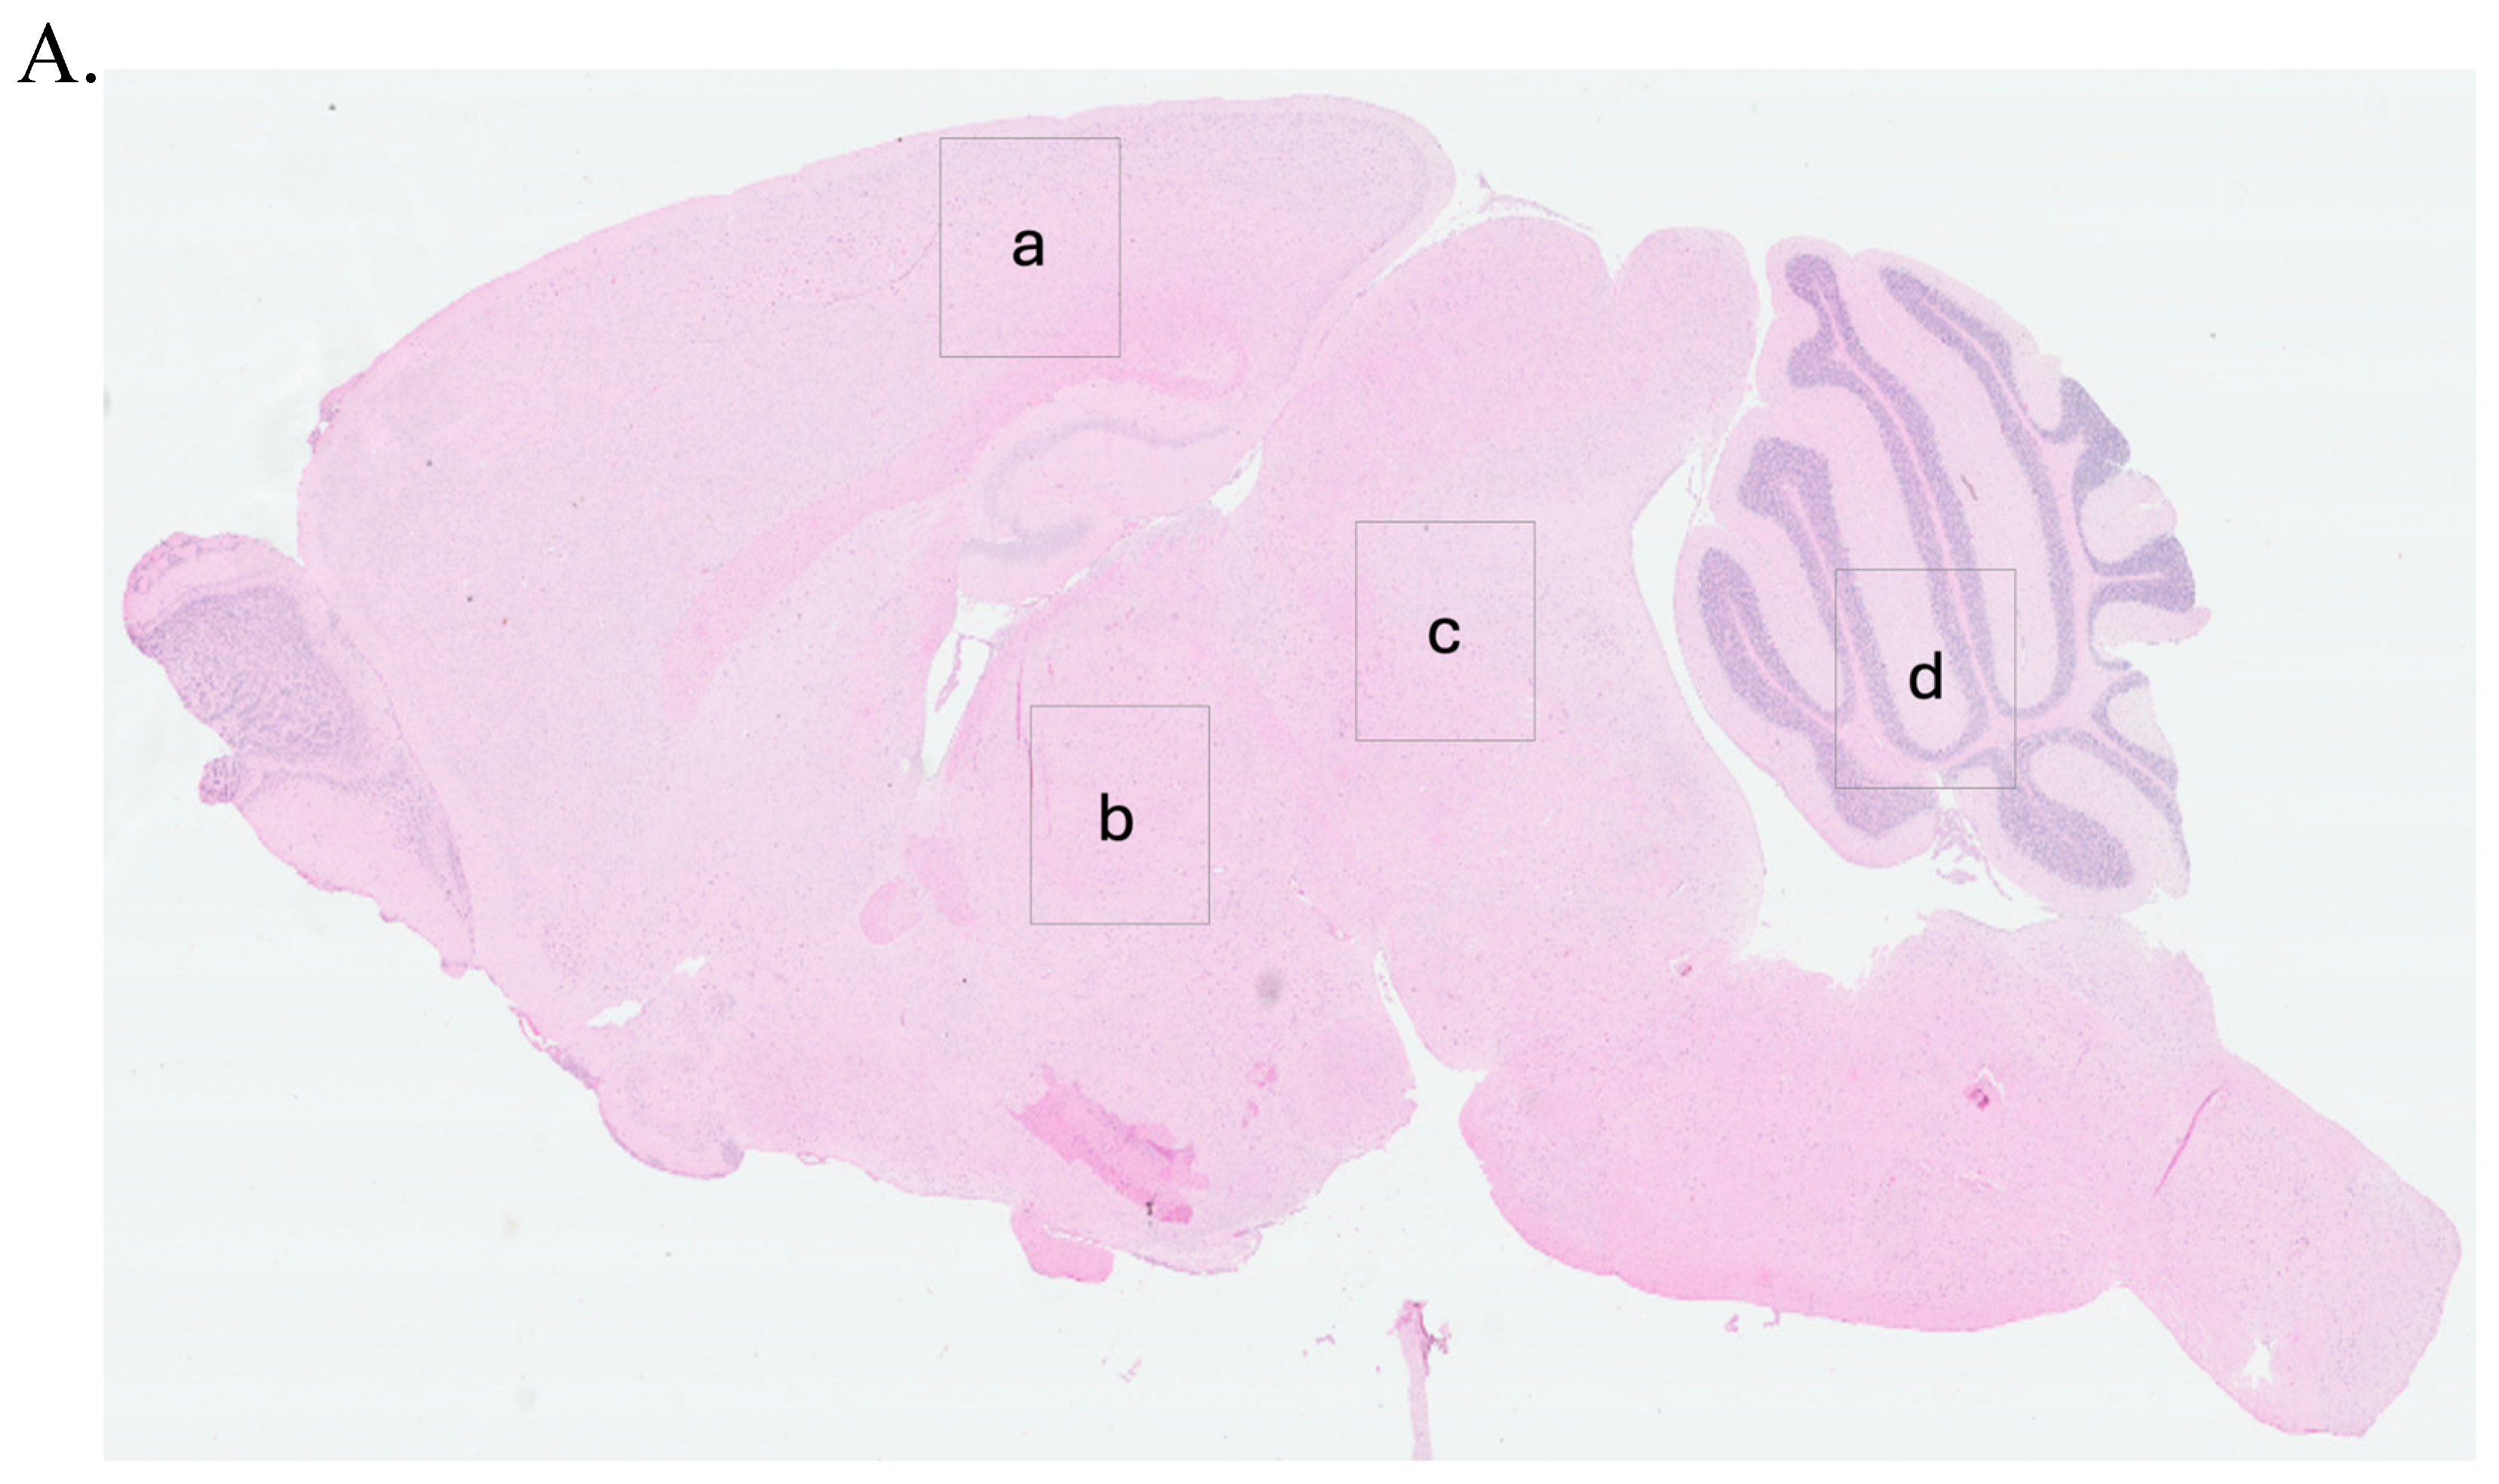
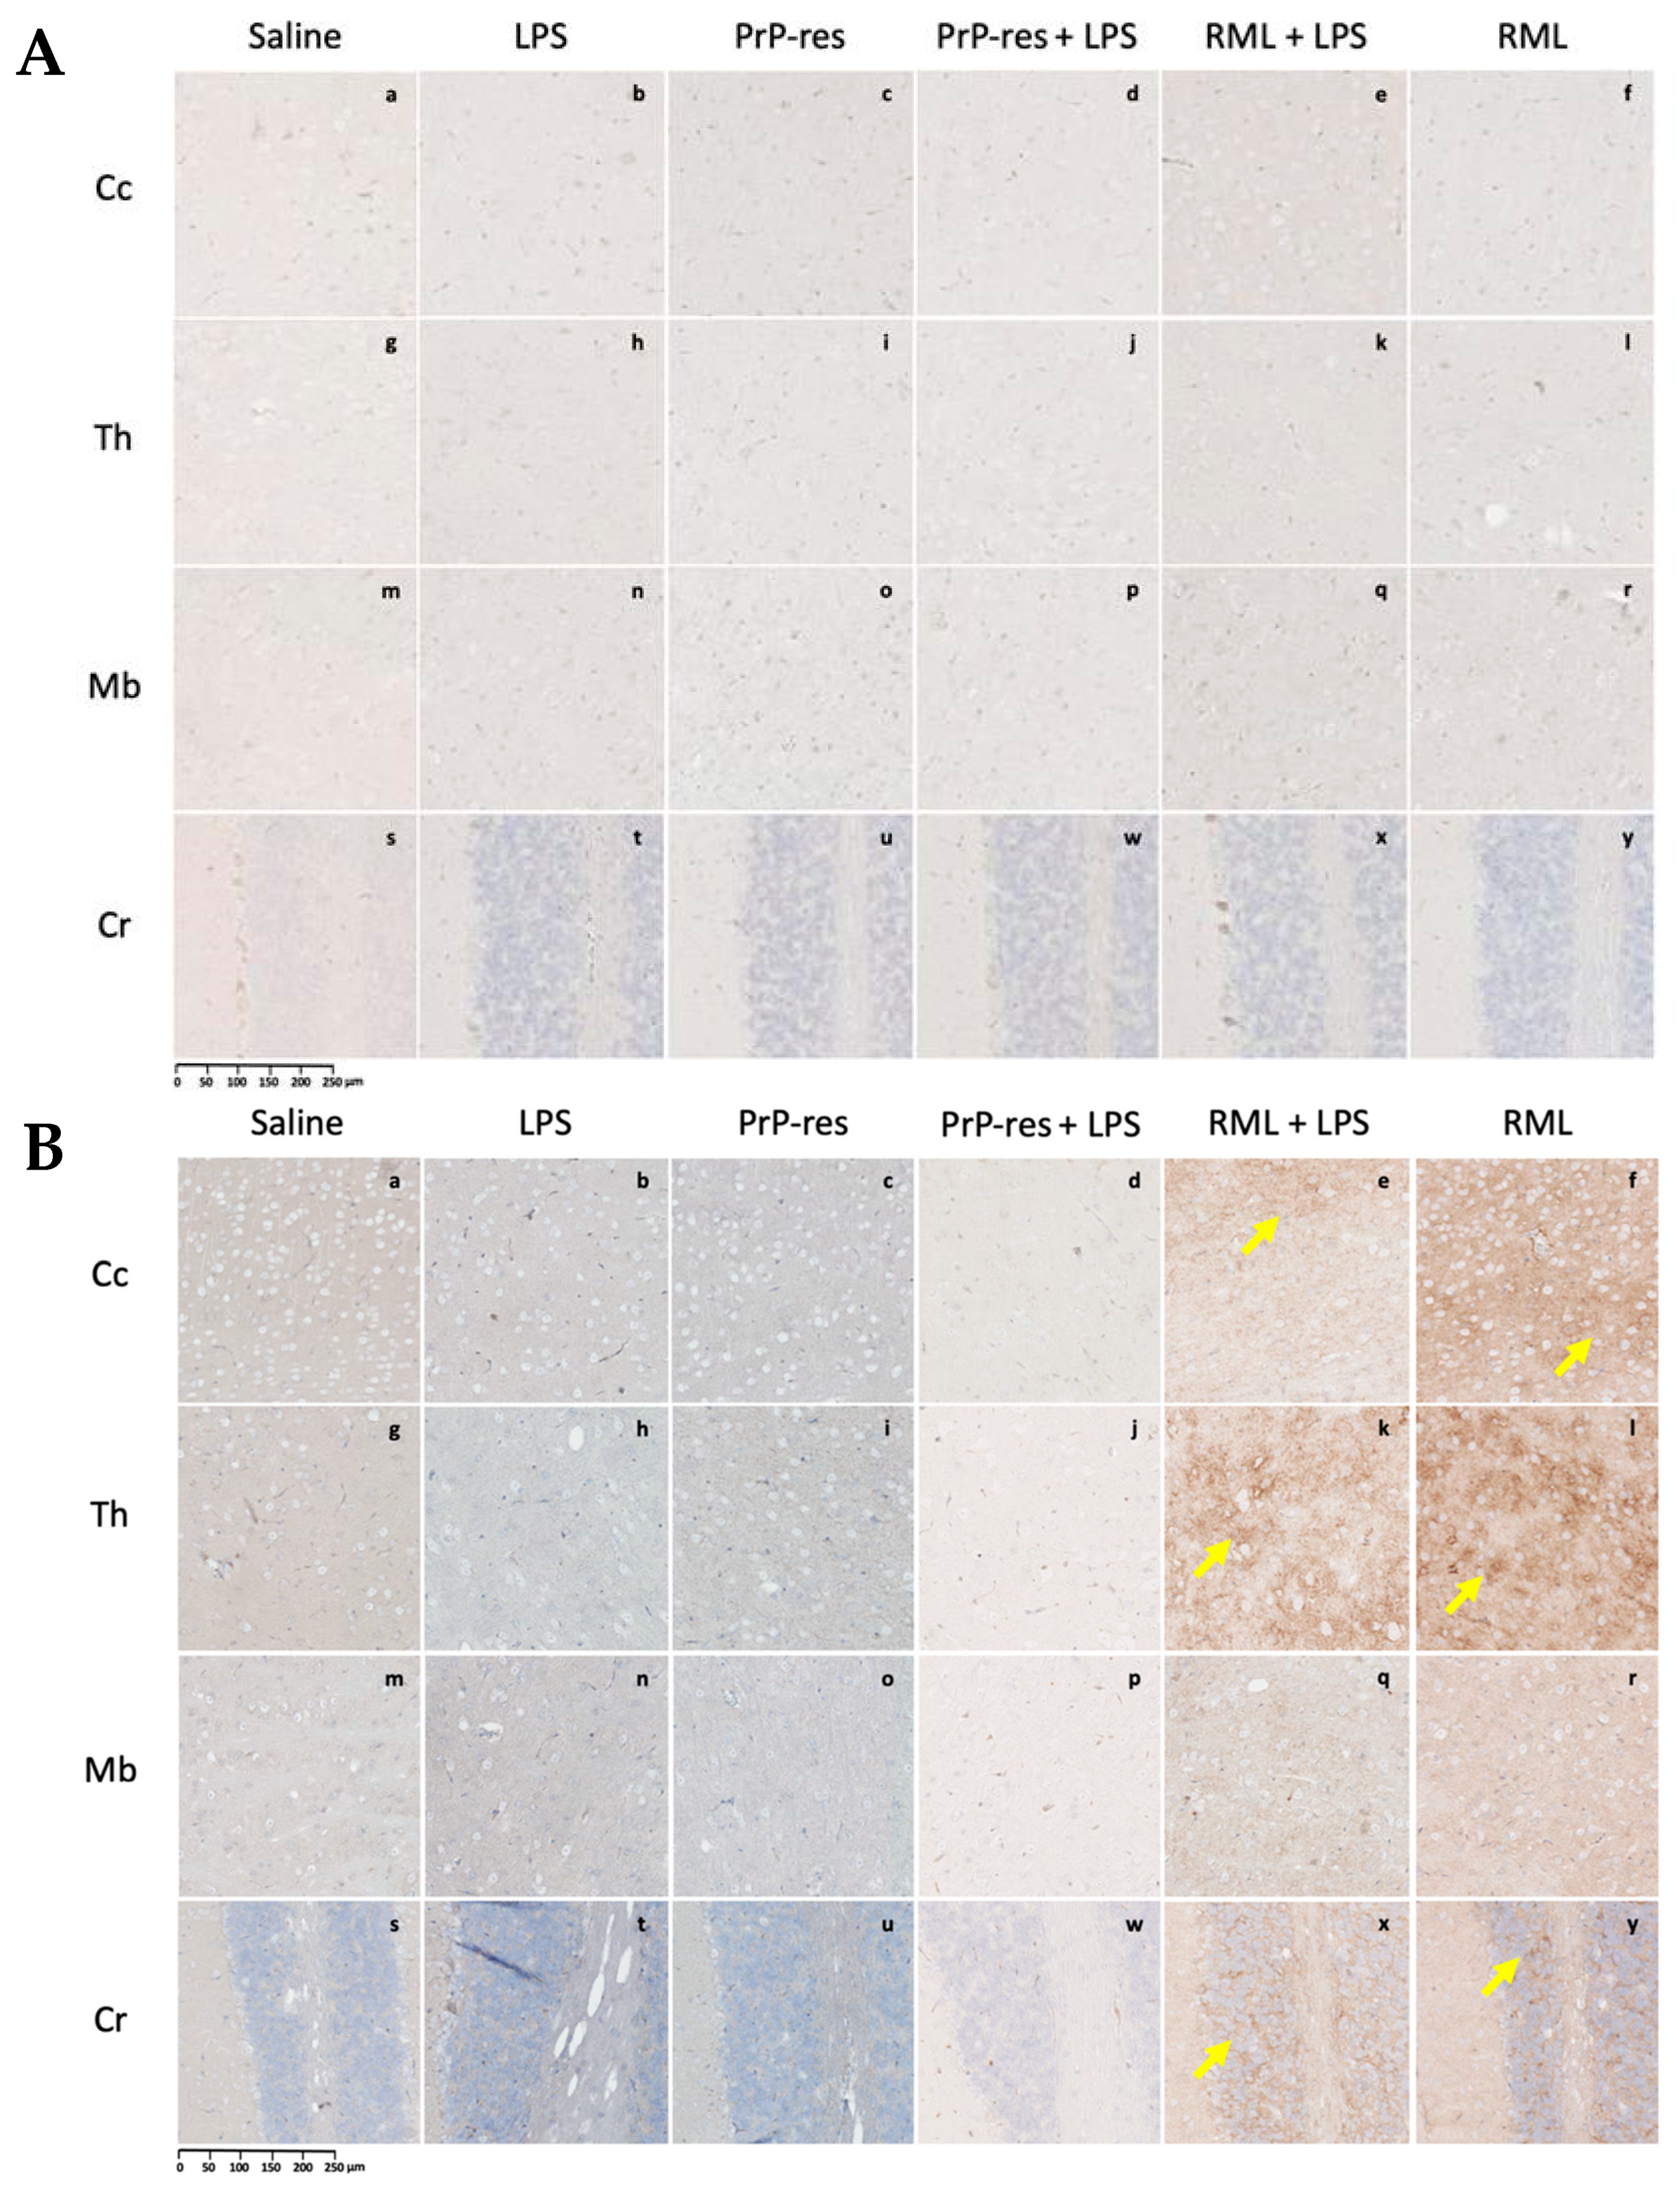
To guide the interpretation of region-specific pathology,
Figure 3A provides a schematic illustration of the four major brain regions analyzed in this study: cerebral cortex (Cc)
, thalamus (Th)
, midbrain (Mb)
, and cerebellum (Cr). These regions were selected based on their relevance to prion-related and inflammation-induced neurodegeneration. This anatomical reference supports the localization of vacuolar changes and immunohistochemical signals described in subsequent subfigures (
Figure 3B, panels a–x) and throughout
Figure 4,
Figure 5,
Figure 6,
Figure 7 and
Figure 8.
Histological and immunohistochemical assessments were conducted to characterize neuropathological changes across all experimental groups, including saline controls, LPS-treated, moPrPRes-, RML-, and co-treated mice. Analyses focused on four principal pathological features: (1) spongiform vacuolation, (2) PrPSc accumulation, (3) astrogliosis as measured by GFAP immunoreactivity, and (4) amyloid-beta (Aβ) plaque deposition.
Representative images from H&E staining, PrP
Sc immunohistochemistry, GFAP staining, and Aβ plaque detection are provided in
Figure 3,
Figure 4,
Figure 5 and
Figure 6. Quantitative assessment of vacuole counts across four brain regions—Cc, Th, Mb, and Cr—was performed at three key time points: 11 wpi (euthanization stage), terminal disease stage (sick animals), and study endpoint (termination stage).
Data reveal group- and region-specific differences in the severity and anatomical distribution of neuropathology, supporting further comparisons across disease models induced by prion infection, recombinant PrPRes administration, and chronic systemic LPS exposure.
2.3.1. LPS-Induced Cerebellar Degeneration Without PrPSc Accumulation
Histopathological evaluation of brain sections from LPS-treated mice revealed progressive vacuolar degeneration, particularly affecting the Cr. At 11 wpi, euthanized animals in this group showed mild spongiform changes in all four examined brain regions—Cc, Th, Mb, and Cr (
Figure 3B, panels e–h). Vacuole counts at this stage were modest and comparable to those observed in saline-treated controls (Further details are provided in
Section 2.4).
In contrast, terminally ill LPS-treated mice exhibited increased vacuolation, with the most prominent changes observed in the Cr and Mb (
Figure 3C, panels e–h). Quantitative vacuole analysis confirmed elevated counts in these regions relative to both the 11 wpi LPS group and the saline controls, while overall vacuole numbers remained lower than those recorded in RML-infected mice.
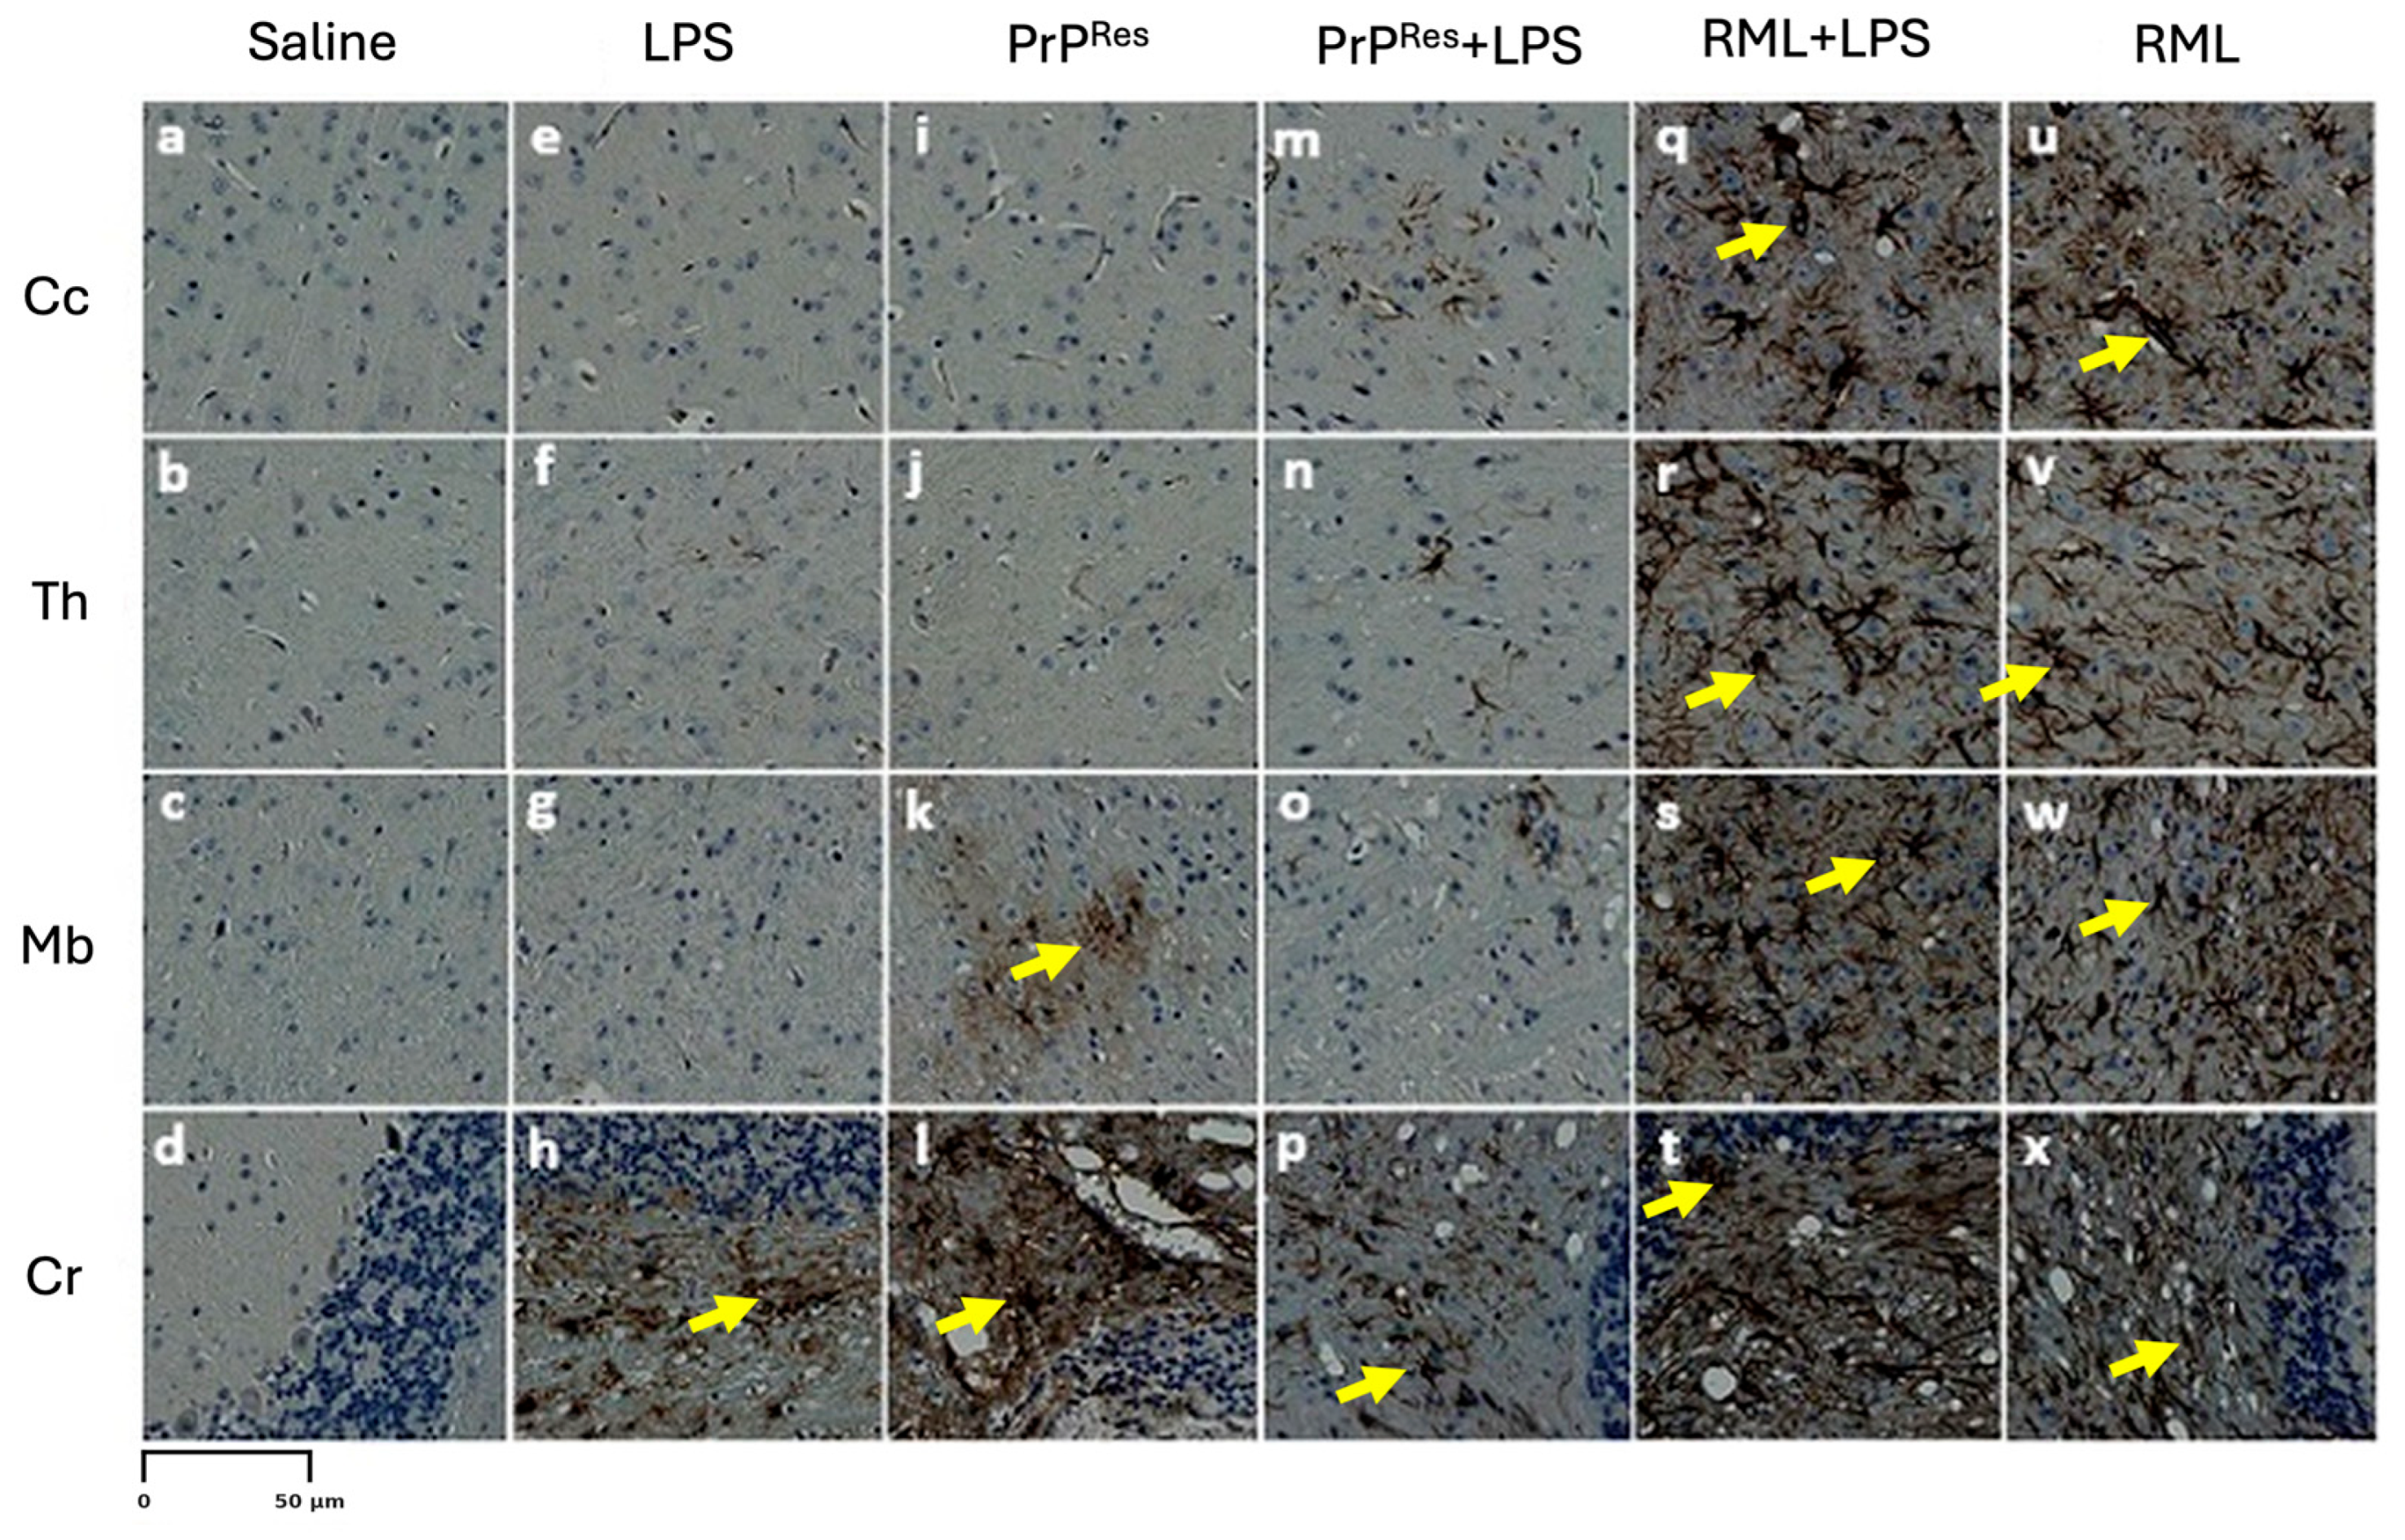
Immunohistochemical staining for PrP
Sc in LPS-treated animals showed no detectable signals at either 11 wpi or terminal disease stages (
Figure 5 and
Figure 6, panels e–h). GFAP immunostaining indicated localized astrogliosis confined to the cerebellum in terminal LPS-treated mice (
Figure 5, panel h), with minimal astrocytic activation observed in the Cc, Th, or Mb regions (
Figure 5, panels e–g).
Amyloid-beta (Aβ) immunostaining revealed plaque deposition exclusively in the cerebellum of terminally ill LPS-treated animals (
Figure 8, panel h). No Aβ-positive staining was detected in other brain regions or in any saline, RML-, or moPrP
Res-treated mice (
Figure 6, panels d, l, p, x).
2.3.2. Recombinant moPrPRes Induces Vacuolar Neurodegeneration Without PrPSc or Amyloid Plaque Deposition
Histological analysis of moPrP
Res-treated mice euthanized at 11 wpi revealed low-grade spongiform vacuolation in the Cc, Th, Mb, and Cr (
Figure 3B, panels i–l). No vacuoles were observed in the saline-treated control animals (
Figure 3B, panels a–d). Quantitative vacuole counts (see
Section 2.4 for more details) confirmed modest elevations across all regions in the moPrP
Res group, with the Cr exhibiting the highest susceptibility.
Terminally sick moPrP
Res-treated mice displayed substantially increased vacuole formation in all four brain regions, as shown in H&E-stained sections (
Figure 3C, panels i–l). The spatial distribution of vacuoles was similar to that observed in RML-infected animals; however, total vacuole counts remained lower, and vacuoles appeared larger in some regions.
Immunohistochemistry for disease-associated prion protein (PrP
Sc) yielded no detectable signal in moPrP
Res-treated mice at either 11 wpi or terminal stages (
Figure 6, panels i–l), consistent with the absence of signal in saline-treated controls (
Figure 6, panels a–d). GFAP immunostaining revealed mild to moderate astrocytic activation, particularly in the Cr (
Figure 5, panel l) and Mb (
Figure 5, panel k), with minimal glial reactivity in the Cc and Th (
Figure 5, panels i–j).
Amyloid-β immunostaining was negative in all examined brain regions of moPrP
Res-treated and moPrP
Res + LPS mice (
Figure 6, panels i–l and m-p, respectively), indicating no evidence of amyloid plaque deposition. In contrast, LPS-treated mice displayed Aβ accumulation exclusively in the Cr (
Figure 6, panel h), while RML-treated mice showed Aβ accumulation restricted to the Mb (
Figure 6, panel w) in late-stage disease. Notably, the RML + LPS co-treated group did not exhibit detectable Aβ staining in any brain region (
Figure 6, panels q–t).
2.3.3. Combined moPrPRes and LPS Treatment Induces Neurodegeneration Without PrPSc Accumulation and Minimal Amyloid Deposition
Mice receiving combined moPrP
Res + LPS treatment exhibited no clinical signs of disease at 11 wpi. Histopathological evaluation revealed mild vacuolation in the Cc, Th, Mb, and Cr, comparable to those observed in the LPS-only and moPrP
Res-only groups and absent in saline controls (
Figure 3B, panels m–p). Immunohistochemical staining for PrP
Sc showed no detectable deposition in any brain region at this stage (
Figure 4A, panels m–p), mirroring the PrP
Sc-negative profiles of the saline, LPS, and moPrP
Res groups.
At terminal stages, moPrP
Res + LPS-treated animals developed prominent vacuolation across all four brain regions (
Figure 3C, panels m–p). Quantitative vacuole analysis revealed that although the total vacuole counts were lower than in RML-inoculated animals, the vacuoles were consistently larger in size. This pattern replicated the morphological features seen in the moPrP
Res-only group and suggests that systemic LPS exposure augmented the neurodegenerative phenotype without increasing classical lesion burden.
Immunostaining for PrP
Sc remained negative in all terminal moPrP
Res + LPS-treated mice (
Figure 6, panels m–p), confirming the absence of prion propagation and reinforcing the non-infectious nature of moPrP
Res, even under pro-inflammatory conditions. Moderate astrogliosis was evident in the Cr and Th, with increased GFAP immunoreactivity compared to controls (
Figure 5, panels m–p), but the intensity remained less than that observed in RML and RML + LPS-treated mice.
Amyloid-β staining revealed sparse plaque deposition limited to the Th and Mb (
Figure 8, panels n and o), with no Aβ detected in the Cc or Cr (
Figure 8, panels m, o, p). These results indicate that while chronic inflammation may facilitate limited Aβ accumulation, co-treatment with moPrP
Res does not markedly enhance amyloidogenic processes.
Collectively, these data demonstrate that the combined administration of moPrPRes and LPS induces a widespread but atypical form of neurodegeneration characterized by large vacuoles, moderate gliosis, and minimal amyloid deposition, occurring in the absence of PrPSc accumulation.
2.3.4. LPS Enhances PrPSc Accumulation and Neurodegeneration in RML-Infected Mice Without Inducing Amyloid Plaques
At 11 wpi, mice co-treated with RML and LPS, though still asymptomatic, showed early neurodegenerative changes characterized by mild vacuolation in the Cc, Th, Mb, and Cr (
Figure 3B, panels q–t). Immunohistochemical analysis revealed more extensive PrP
Sc deposition in these regions compared to mice treated with RML alone at the same time point (
Figure 4A, panels q–t vs. u–x), suggesting that systemic LPS exposure accelerates prion propagation during the preclinical phase.
In terminally ill RML + LPS mice, vacuolation was widespread and severe across all examined brain regions, with the Cr and Th most prominently affected (
Figure 3C, panels q–t). While the overall lesion severity visually matched or exceeded that in the RML-only group, quantitative analysis indicated a slightly lower total vacuole count in the co-treated animals. Nonetheless, PrP
Sc deposition was markedly elevated in the Cc, Th, and Cr of RML + LPS mice at terminal stages (
Figure 4B, panels q–t), reinforcing the role of systemic inflammation in enhancing prion replication and neuroinvasion.
Astrogliosis was similarly intensified, as evidenced by strong GFAP immunoreactivity throughout all brain regions (
Figure 5, panels q–t). The astrocytic response in the RML + LPS group was notably more robust than in the RML-only group (
Figure 5, panels u–x), indicating that co-stimulation with LPS amplifies neuroinflammatory processes associated with prion disease.
Despite the advanced neurodegeneration and extensive PrP
Sc pathology, no amyloid-β (Aβ) plaques were detected in any brain region of the RML + LPS group (
Figure 6, panels q–t), in contrast to the midbrain-specific Aβ accumulation observed in RML-only treated animals (
Figure 6, panels u–x). These results indicate that although systemic LPS exposure intensifies prion-associated pathology, it does not promote Aβ plaque formation under these experimental conditions.
2.3.5. LPS Enhances RML-Induced Neurodegeneration and PrPSc Accumulation Without Promoting Amyloid-β Deposition
At 11 wpi, hematoxylin and eosin (H&E) staining revealed minimal vacuolation in most brain regions in both the RML-only and RML + LPS treatment groups, consistent with the preclinical stage. Similar vacuolation patterns were observed in moPrP
Res and moPrP
Res + LPS-treated mice (
Figure 3B, i–p), although all these groups exhibited more vacuolation than the negative saline controls (
Figure 3B, a–d).
In terminally sick animals, H&E staining showed widespread vacuolation in the Cc, Th, Mb, and Cr in the RML + LPS-treated group (
Figure 3C, q–t). In contrast, the RML-only group showed less extensive and less intense vacuolation in the same brain regions (
Figure 3C, u–x).
Immunohistochemical analysis showed higher levels of PrP
Sc deposition in the RML + LPS-treated group, particularly in the Cc, Th, and Cr, compared to the RML-only group (
Figure 4B, q–x). While the overall spatial distribution of PrP
Sc deposition was similar between RML and RML + LPS groups, the staining intensity appeared subjectively higher in the RML + LPS group, suggesting enhanced accumulation without major shifts in regional tropism. No PrP
Sc deposits were observed in saline, LPS, moPrP
Res, or moPrP
Res + LPS-treated mice at either 11 wpi or at terminal stages (
Figure 4B, a–p).
Glial fibrillary acidic protein (GFAP) immunostaining revealed strong astrogliosis across all analyzed brain regions in the RML + LPS-treated mice (
Figure 5, q–t), while RML-only mice exhibited moderate GFAP staining (
Figure 7, u–x). Mild to moderate astrogliosis, primarily localized to the Cr, was also observed in the LPS, moPrP
Res, and moPrP
Res + LPS groups (
Figure 5, e–p).
Amyloid-β (Aβ) staining identified plaques in the Mb and Cr of the RML + LPS and LPS-only treatment groups (
Figure 8, panels h and t). No Aβ plaques were detected in brain sections from RML-only, moPrP
Res, moPrP
Res + LPS, or saline-treated mice (
Figure 6, panels a–g, i–p, u–x).
2.3.6. PrPSc Detected Only in RML- and RML + LPS-Treated Mice: Absence in LPS and moPrPRes Groups
Western blot analysis was performed on proteinase K (PK)-treated brain and spleen homogenates collected from FVB/N female mice at both 11 wpi and at terminal disease stages (
Figure 7).
No PK-resistant PrP bands were detected in brain or spleen homogenates from saline-treated control animals (
Figure 7, lanes 1 and 11). Similarly, mice treated with LPS, moPrP
Res, or moPrP
Res + LPS showed no detectable PrP
Sc in either brain or spleen homogenates at any time point (
Figure 7, lanes 2–7 and 12–16).
In RML-treated mice, PrP
Sc was not detected in brain homogenates at 11 wpi (
Figure 7A, lane 9), but was present in spleen homogenates from the same time point (
Figure 7B, lane 19). In terminally sick RML-treated mice, PK-resistant PrP was observed in both brain and spleen homogenates (
Figure 7A, lane 9;
Figure 7B, lane 20).
In the RML + LPS group, PrP
Sc was detectable in brain homogenates of terminally sick mice (
Figure 7A, lane 10), as well as in spleen homogenates at both 11 wpi and terminal stages (
Figure 7B, lanes 17 and 18).
2.3.7. Cell-Based Assay Confirms Infectivity Only in RML and RML + LPS Brain Homogenates
A cell-based infectivity assay was performed using the L929 mouse fibroblast line exposed to brain homogenates from terminally sick mice across all treatment groups. Following culture on ELISPOT plates, cells were subjected to proteinase K (PK) digestion and immunodetection to assess the presence of PK-resistant PrPSc.
In contrast, strong PrP
Sc-positive signals were observed in cells treated with brain homogenates from RML-infected mice and from the RML + LPS co-treatment group (
Figure 8). These results indicate the presence of infectious, PK-resistant prion protein in these groups.
2.4. Quantitative Analysis of Spongiform Vacuolation Across Brain Regions
Spongiform vacuolation was quantified in four brain regions—the Cc, Th, Mb, and Cr—at three experimental stages: 11 wpi (Euthanization), terminal clinical illness (Sick), and study endpoint (Termination).
2.4.1. Euthanization Stage (11 wpi)
At 11 wpi, vacuole counts were generally low across all treatment groups (n = 5), consistent with the absence of clinical disease. The RML-infected group exhibited the highest early-stage vacuolation, particularly in the Cc (11,853 ± 412, p < 0.0001), Mb (5871 ± 305, p < 0.0001), and Cr (5450 ± 846, p < 0.0001), all significantly elevated compared to saline controls (349.4 ± 2.1, 88.4 ± 2.1, and 139.6 ± 2.9, respectively). These data suggest that RML induces early subclinical neuropathology prior to the onset of clinical symptoms.
The LPS-only group showed mild vacuolation, notably in the cerebellum (1152 ± 120, p = 0.002) and midbrain (287 ± 42, p = 0.025), while vacuole counts in the cerebral cortex (233 ± 76, p = 0.128) and thalamus (212 ± 50, p = 0.048) were not consistently elevated or statistically significant relative to saline.
Mice treated with moPrPRes and moPrPRes + LPS exhibited uniformly low vacuole counts across all regions (typically 45–150 vacuoles), with no significant differences from saline controls, indicating minimal neurodegeneration at this stage.
Strikingly, the RML + LPS group displayed markedly reduced vacuolation compared to the RML-only group across all regions examined: cortex (60 ± 1, p < 0.0001), midbrain (48 ± 2, p < 0.0001), cerebellum (54 ± 3, p < 0.0001), and thalamus (37 ± 1, p < 0.0001). These findings suggest that co-administration of LPS may suppress or delay the onset of prion-induced vacuolar pathology during the early, asymptomatic phase of disease progression.
2.4.2. Termination Stage (110 wpi)
At the end of the experiment (110 wpi), among animals that remained clinically asymptomatic, vacuole counts across all groups were low and showed no substantial variation. The saline group (n = 4) exhibited consistent vacuole intensities across brain regions, with mean ± SEM values as follows: Cr (197.6 ± 1.7), Cc (209.4 ± 1.8), midbrain (209.0 ± 3.1), and Th (208.4 ± 2.9).
In contrast, most treatment groups at this stage had only two surviving animal per treatment, precluding reliable statistical comparisons. The LPS-treated mouse (n = 2) exhibited vacuole intensities of 200.9 (Cr), 217.2 (Cc), 215.6 (Mb), and 215.1 (Th), slightly elevated compared to saline means but not substantially different. Similarly, the moPrPRes + LPS group (n = 2) showed values close to those of the saline group—for example, 195.2 in the cerebellum and 209.2 in the cortex—suggesting no clear trend toward increased or decreased vacuolation.
The RML group (n = 2) also displayed vacuole intensities similar to saline in all assessed regions, such as 202.6 in the Cr and 209.5 in the cortex, indicating an absence of significant spongiform change in animals that survived to this time point. Notably, all RML + LPS-treated animals succumbed at 200 dpi, and thus data for this group are not available for this stage.
In summary, vacuolation remained minimal in all groups surviving to the termination stage, and the small number of animals in most treated groups limited the statistical power of comparisons. These observations support the interpretation that substantial spongiform pathology had not developed in clinically asymptomatic animals at this time point.
2.4.3. Sick Animals (Terminal Clinical Stage)
In terminally sick animals, all prion- and LPS-related treatment groups exhibited extensive vacuolar pathology across multiple brain regions. RML-infected mice (n = 3) showed the highest vacuole counts overall, with particularly elevated values in the Cr (1623.7 ± 305.5) and Th (1491.3 ± 345.9), consistent with advanced neurodegeneration.
However, the RML + LPS-treated group (n = 4) exhibited similarly high vacuolation, including 1603.0 ± 258.5 in the Cc and 1902.0 ± 325.1 in the Th, in some cases exceeding the values observed in the RML-only group. These differences were not statistically significant (Cc: p = 0.10; Th: p = 0.15), suggesting that LPS co-treatment did not appreciably alter the severity of vacuolation in animals that progressed to clinical disease.
The moPrPRes + LPS group (n = 2) also demonstrated pronounced vacuolation across regions, with 1643.0 ± 382.0 in the cerebellum, 942.5 ± 113.5 in the cortex, and 841.0 ± 198.0 in the thalamus. Statistical comparisons revealed no significant differences in vacuole counts between moPrPRes + LPS and RML groups in the Cc (p = 0.17) or Th (p = 0.44), nor between moPrPRes + LPS and RML + LPS in the same regions (p = 0.63 and p = 0.43, respectively).
These results indicate that co-administration of LPS with either RML or moPrPRes results in vacuolar pathology comparable to that of classical prion infection alone. At the terminal clinical stage, LPS neither exacerbated nor mitigated spongiform degeneration, suggesting that its modulatory effects are more relevant during earlier phases of disease progression.
Quantitative comparison of vacuolation severity between the moPrPRes-only group (n = 3) and the RML-infected group (n = 3) revealed region-specific differences. In the thalamus, vacuole counts were significantly higher in RML-treated animals (1089.0 ± 45.7) compared to moPrPRes-treated mice (908.8 ± 31.4, p = 0.037), indicating more pronounced neurodegeneration in this region. In contrast, vacuole counts in the cerebral cortex (Cc: 910.5 ± 40.0 vs. 813.8 ± 37.5, p = 0.15) and midbrain (Mb: 1002.0 ± 117.4 vs. 771.7 ± 35.1, p = 0.182) showed a trend toward higher values in the RML group, but these differences did not reach statistical significance. Notably, the cerebellum exhibited nearly identical vacuole burdens across both groups (Cr: 825.9 ± 37.0 vs. 829.4 ± 92.7, p = 0.97), suggesting a shared vulnerability to neurodegeneration in this region. These findings support the conclusion that moPrPRes alone can induce substantial spongiform pathology, with severity overlapping that of classical prion infection in several brain regions.
2.4.4. Comparative Summary and Statistical Outcomes
Comparative analysis of vacuole formation across all three stages—euthanization (11 wpi), termination (110 wpi), and clinical sickness—revealed a clear progression of neuropathology over time, with statistically robust differences becoming most apparent at the terminal stage. At 11 wpi, vacuole counts were significantly elevated in the RML group across all brain regions compared to other groups (p < 0.001), yet these changes remained subclinical, and sample sizes were sufficient (n = 5) for reliable statistical testing. Notably, co-treatment with LPS (RML + LPS and moPrPRes + LPS) paradoxically suppressed vacuole accumulation below levels seen in the respective prion-only groups, suggesting an early-stage modulatory effect of systemic inflammation.
In contrast, at the termination stage (110 wpi), vacuole counts remained low across all groups, and most animals were clinically asymptomatic. However, this stage was limited by small sample sizes—particularly for the LPS (n = 1), moPrPRes + LPS (n = 2), and RML (n = 2) groups—precluding definitive statistical conclusions despite descriptive trends. For example, the RML group displayed modestly higher vacuole intensities than saline controls, especially in the cerebellum and thalamus, but these differences were not statistically significant. The moPrPRes + LPS group showed values nearly identical to saline mice, reinforcing the notion that combined LPS exposure may dampen prion-induced pathology under some conditions.
Statistically significant intergroup differences were observed only at the sick stage, where vacuolation was extensive and distinct. These findings emphasize that spongiform degeneration in this model is a time-dependent process, with early LPS-associated neuroinflammation detectable but not amplifying prion toxicity, and late-stage pathology requiring sufficient disease burden and group size to draw robust conclusions.
6. Materials and Methods
6.1. Ethical Approval
This study was conducted in accordance with institutional and national ethical standards. Approval was obtained from the University of Alberta Animal Care and Use Committee for Health Sciences Laboratory Animal Services. All procedures adhered to the guidelines of the Canadian Council on Animal Care [
38], and every aspect of animal handling conformed to the University of Alberta’s policies on animal welfare. The well-being of the experimental animals was prioritized throughout the course of the study.
6.2. Experimental Design and Animals
A total of 90 wild-type female FVB/N mice (5 weeks old) were obtained from Charles River Laboratories (Wilmington, MA, USA). Mice were randomly assigned to six treatment groups (n = 15 per group): saline (negative control), lipopolysaccharide (LPS) from Escherichia coli O111:B4, moPrPRes (amino acids 29–232) incubated with E. coli O111:B4 LPS (Sigma-Aldrich, St. Louis, MO, USA), moPrPRes + LPS, RML + LPS, and RML alone (positive control).
Bacterial LPS and saline were delivered continuously via subcutaneously implanted ALZET
® osmotic mini-pumps (Cupertino, CA, USA), with a flow rate of 0.11 µL/h over six weeks. The LPS dosage was standardized at 0.1 µg per gram of body weight. Simultaneously, a single subcutaneous injection of either moPrP
Res (45 µg per mouse) or the RML prion strain (containing 10
7 ID
50 units of scrapie prions) was administered at the time of pump implantation. The moPrP
Res (amino acids 29–232) was kindly provided by Dr. David Wishart’s laboratory (University of Alberta) and injected in a total volume of 200 µL per mouse. For further experimental design details, refer to Hailemariam et al. [
6].
6.3. Weight Measurement
To monitor health status and physiological development, body weights were recorded for each mouse beginning at six weeks of age, coinciding with the start of treatment. Measurements were performed monthly. As the study progressed and mortality increased, surviving mice were additionally weighed at 102 and 110 weeks of age to assess the long-term effects of treatment.
6.4. Mouse Recombinant Prion Protein
Lyophilized LPS from Escherichia coli O111:B4 (Sigma-Aldrich, St. Louis, MO, USA) was reconstituted in Milli-Q double-distilled water (ddH2O) to a working concentration of 5 mg/mL. This LPS stock solution was then used to dissolve lyophilized mouse recombinant prion protein (moPrP, residues 29–232) to a final concentration of approximately 0.5 mg/mL, yielding a 1:1 weight ratio of moPrP:LPS. Given that the average molecular weight of LPS is ~10 kDa—approximately half that of moPrP (∼20–22 kDa)—this weight ratio corresponds to a molar ratio of approximately 2:1. Due to the undefined and heterogeneous molecular structure of LPS, all experimental ratios were maintained on a mass (mg) basis for consistency and comparability.
Structural conversion of moPrP was monitored by circular dichroism (CD) spectroscopy in the far-UV range (190–260 nm) using an Olis DSM 17 spectropolarimeter (Bogart, GA, USA). Spectra were acquired at 25 °C in a 0.02 cm path-length quartz cuvette, with five consecutive scans averaged per sample. Protein concentrations were standardized at 0.5 mg/mL (approximately 25 µM). Baseline spectra (reference buffer only) were subtracted from the sample spectra before calculating molar ellipticity. An average amino acid molecular weight of 113.64 g/mol was used for calculations. Secondary structural content was determined using the CDPro software (v 4.31) suite with the CONTINLL algorithm and the SP22X reference set. Conversion endpoints were defined as follows: a β-sheet content >25% with helical content <15% indicated β-sheet conversion, while a β-sheet content >30% with helical content <10% indicated fibrillar aggregation.
Following conversion, residual LPS was removed using polymyxin B agarose resin (Sigma-Aldrich). Briefly, 500 µL of resin was added to a 1.5 mL microcentrifuge tube and equilibrated with three washes of 500 µL of ammonium bicarbonate buffer (100 mM, pH 8.0). Subsequently, 250 µL of the moPrP/LPS solution was added and incubated at room temperature for 60 min to allow LPS binding. The resin was pelleted by centrifugation at 850× g for 5 min, and the supernatant—containing the LPS-depleted moPrPRes—was collected. This LPS-removal step was repeated three additional times with fresh equilibrated resin. The final supernatant was assessed for residual endotoxin using the Pyrochrome Limulus Amebocyte Lysate (LAL) assay (Associates of Cape Cod Inc., East Falmouth, MA, USA), and structural confirmation of moPrPRes was re-evaluated by CD spectroscopy.
6.5. Euthanasia
Euthanasia was performed at two key time points: (1) 11 weeks post-infection (wpi), and (2) the terminal stage of disease. At 11 wpi, five mice from each treatment group were euthanized. These animals exhibited normal body weight and showed no clinical signs of prion disease or other abnormalities. The remaining ten mice per group were monitored until the terminal stage, which was defined by the appearance of progressive neurological signs including kyphosis, ataxia, dysmetria, tremors, head tilt, tail rigidity, circling behavior, bradykinesia, proprioceptive deficits, stupor, loss of deep pain sensation, diminished grooming, and marked body weight loss.
6.6. Tissue Preparation
Prior to euthanasia, mice were anesthetized with isoflurane gas, and the absence of reflexes was confirmed to ensure complete analgesia. Euthanasia was performed by cardiac puncture, during which total blood volume was collected. Immediately thereafter, brains were harvested and bisected sagittally. One hemibrain was fixed in 10% neutral buffered formalin phosphate (Sigma-Aldrich, St. Louis, MO, USA) using a volume ten times that of the tissue and incubated for at least 48 h at room temperature. Following fixation, tissues were rinsed under tap water for 20 min and transferred to 15 mL tubes containing 70% ethanol (Commercial Alcohol, Winnipeg, MB, Canada) for storage at 4 °C until further processing.
Brain tissues were processed for immunohistochemical (IHC) analysis to evaluate the regional distribution and intensity of disease-associated prion protein (PrPSc), amyloid-beta (Aβ) plaque deposition, astrogliosis (via GFAP staining), and spongiform vacuolation.
6.7. Hematoxylin and Eosin Staining
Brain tissues were processed for hematoxylin and eosin (H&E) staining according to the protocol described by Chishti et al. [
39]. Formalin-fixed tissues were embedded in paraffin (Formula “R” paraffin, Surgipath
®, Leica Biosystems, Nussloch, Germany) and sectioned coronally. Sections were mounted on adhesive-coated glass slides and dried overnight at 37 °C. Deparaffinization was performed using xylene followed by rehydration through a graded ethanol series and deionized water. Slides were stained with filtered Mayer’s hematoxylin (Fisher Scientific, Waltham, MA, USA), counterstained with eosin Y, and dehydrated. Digital images of stained sections were captured using the NanoZoomer XR digital slide scanner (Hamamatsu Photonics, Shizuoka, Japan).
6.8. Vacuole Quantification
Spongiform vacuoles were assessed in H&E-stained coronal brain sections scanned at 40× magnification using the Hamamatsu NanoZoomer S360 Digital Slide Scanner, Hamamatsu Photonics, Bridgewater, New Jersey, USA. Whole-slide images were analyzed using NDP.view2 software (version U12388-01; Hamamatsu Photonics, Bridgewater, New Jersey, USA). Regions of interest—including the cerebral cortex (Cr), thalamus (Th), midbrain (Mb), and cerebellum (Cr)—were digitally magnified to an effective magnification of 5.5×. Built-in contrast and clarity enhancement tools were applied to optimize visualization of vacuoles without introducing artificial artifacts.
Vacuoles were defined as discrete, round or oval optically clear structures measuring ≥5 µm in diameter, and were carefully distinguished from perivascular spaces, fixation artifacts, and tissue tears. For each mouse, three non-overlapping high-power fields (HPFs) were selected per brain region. Manual vacuole counts were performed using NDP.view2 software (version U12388-01; Hamamatsu Photonics, Bridgewater, NJ, USA) by two independent observers blinded to treatment groups. The mean number of vacuoles per HPF was calculated for each region per animal. Group means ± standard error of the mean (SEM) were computed and used for statistical analyses. Inter-observer agreement exceeded 95%, and any discrepancies were resolved through consensus-based review.
6.9. PrPSc Immunohistochemical Staining
Detection of disease-associated prion protein (PrP
Sc) was performed following the protocol described by Bell et al. [
40], optimized to achieve maximal clearance of native cellular prion protein (PrP
C). Brain sections were sequentially treated with 98% formic acid, 4 M guanidine thiocyanate, and 3% hydrogen peroxide (H
2O
2) to denature PrP
C and expose disease-specific epitopes. Immunostaining was carried out using a mouse monoclonal SAF83 antibody (1:500 dilution; Cayman Chemical, Ann Arbor, MI, USA), followed by incubation with a streptavidin-conjugated peroxidase. The immunoreaction was visualized using a diaminobenzidine (DAB) substrate (Vector Laboratories, Burlingame, CA, USA), and slides were counterstained with Mayer’s hematoxylin (Fisher Scientific, Waltham, MA, USA) for nuclear contrast.
6.10. Amyloid Plaque Staining
Amyloid-beta (Aβ) plaque detection was performed using thioflavine S staining as described by Chishti et al. [
39]. Formalin-fixed, paraffin-embedded brain sections were incubated in a 1% aqueous solution of thioflavine S (Sigma-Aldrich, St. Louis, MO, USA), a fluorescent dye with high specificity for beta-sheet-rich amyloid fibrils. After incubation, slides were differentiated and dehydrated through a graded ethanol series. Slides were then dried in the dark and examined for amyloid plaque (Aβ) deposition using a Nikon Eclipse 90i fluorescence microscope (Nikon Instruments Inc., Melville, NY, USA).
6.11. Immunohistochemical Detection of Astrogliosis
Astrogliosis was assessed by immunohistochemical staining for glial fibrillary acidic protein (GFAP), following the methodology of Chishti et al. [
39]. After deparaffinization and rehydration, brain sections were incubated with an anti-GFAP primary antibody (Sigma-Aldrich, St. Louis, MO, USA; BD Pharmingen, Mississauga, ON, Canada). This was followed by incubation with streptavidin-peroxidase (Invitrogen, Carlsbad, CA, USA) for 16 min. Detection was achieved using DAB (i.e., 3,3′-Diaminobenzidine) chromogen (BD Pharmingen, Mississauga, ON, Canada), developed for up to 20 min to yield a brown precipitate marking GFAP-positive astrocytes. Slides were counterstained with Mayer’s hematoxylin (Thermo Fisher Scientific, Waltham, MA, USA), cleared with xylene (Sigma-Aldrich, Sigma-Aldrich, St. Louis, MO, USA), and mounted with Cytoseal 60 (Thermo Fisher Scientific, Waltham, MA, USA). Slides were then left to dry at room temperature for 48 h before imaging.
6.12. Western Blot Assay
Brain and spleen tissues were processed into 10% (w/v) homogenates in 1× phosphate-buffered saline (PBS; Bio-Rad, Hercules, CA, USA) under sterile conditions. Total protein concentration was determined using the bicinchoninic acid (BCA) protein assay kit (Thermo Fisher Scientific, Waltham, MA, USA). For downstream analysis, 250 µg of total protein from brain samples and 400 µg from spleen samples were used.
Each homogenate was diluted in 250 µL of radioimmunoprecipitation assay (RIPA) buffer (Sigma-Aldrich, St. Louis, MO, USA). Proteinase K (PK; 50 µg/mL final concentration) was added to each sample to digest non-resistant PrPC isoforms. To aid visualization, 2 µL of 0.02% bromophenol blue (Bio-Rad, Hercules, CA, USA) was added to each sample. Samples were briefly vortexed and incubated at 37 °C for 1 h. Proteolysis was halted by the addition of 25 µL phenylmethylsulfonyl fluoride (PMSF; Sigma-Aldrich, St. Louis, MO, USA) to a final concentration of 5 mM. Samples were then incubated at room temperature for 5 min and centrifuged at 20,000× g for 60 min at 4 °C. The supernatant was discarded, and the resulting pellet was resuspended in 15 µL of 2× sample buffer (SB) and boiled for 10 min to denature proteins.
Protein samples (20–25 µL) were loaded into wells of NuPAGE® Bis-Tris 4–12% gradient mini gels (Invitrogen, Carlsbad, CA, USA) and separated via SDS-PAGE at 200 V for 50 min. Precision Plus Protein™ WesternC chemiluminescent molecular weight markers (Bio-Rad, Hercules, CA, USA) were included in each gel.
Proteins were transferred onto PVDF (i.e., polyvinylidene difluoride) membranes overnight using a wet transfer system (Bio-Rad, Hercules, CA, USA) at 20 V. Following transfer, membranes were briefly rinsed with 1× TBS-T (0.5% Tween-20; Sigma-Aldrich) and incubated overnight at 4 °C with the monoclonal anti-prion protein antibody Sha31 (1:30,000; Bertin Pharma, Montigny-le-Bretonneux, France) diluted in 1× TBS-T (0.5%).
The following day, membranes were washed and incubated for 1 h at room temperature with goat anti-mouse horseradish peroxidase (HRP)-conjugated secondary antibody (1:10,000; Bio-Rad, Hercules, CA, USA) in 1× TBS-T (0.1%) supplemented with 5% non-fat dry milk (Carnation, Smucker Foods of Canada, Markham, ON, Canada). After final washes, signal detection was performed using Pierce® ECL Plus Western blotting Substrate (Thermo Fisher Scientific, Waltham, MA, USA), and bands were visualized with the ImageQuant LAS 4000 digital imaging system (GE Healthcare Life Sciences, Quebec, QC, Canada).
6.13. Scrapie Cell Assay
The scrapie cell assay was performed based on the standard protocol described by Mahal et al. [
25], with minor adaptations. L929 mouse fibroblast cells (ATCC, Manassas, VA, USA) were used as the permissive cell line for prion infection. Brain homogenates (10%
w/
v in 1× PBS) were prepared from various treatment groups, including saline (negative control),
Escherichia coli O111:B4 LPS, moPrP
Res, moPrP
Res + LPS, RML + LPS, and RML (positive control). Thirty microliters of each homogenate were aliquoted into wells of a 96-well tissue culture plate (Corning Costar, Tewksbury, MA, USA) and serially diluted (0.1% to 0.0001%) in six replicates.
A suspension of L929 cells (~5000 cells in 20 µL) was added to each well. Plates were incubated for 3–5 min at 37 °C before the addition of 150 µL Dulbecco’s Modified Eagle Medium (DMEM) supplemented with 10% horse serum (Sigma-Aldrich, St. Louis, MO, USA). The plates were then incubated at 37 °C in a humidified atmosphere with 5% CO2 for five days. Cells were passaged twice (1:4 and 1:7 dilutions), with a five-day incubation period between each passage to allow prion propagation.
For prion detection, an ELISPOT-based assay was performed. Ninety-six-well ELISPOT plates (Millipore, Billerica, MA, USA) were pre-activated by adding 60 µL of 70% ethanol per well for 3 min, followed by three washes with 1× TBS (Sigma-Aldrich, St. Louis, MO, USA). To maintain hydration of the nitrocellulose membranes, 30 µL of 1× TBS was left in each well before seeding. Subsequently, 20,000 L929 cells were added to each well and allowed to adhere. The plates were subjected to vacuum filtration and dried at 50 °C for one hour.
Cell lysis was achieved by adding 60 µL of Radioimmunoprecipitation assay (RIPA) buffer containing 5 µg/mL proteinase K (PK; Invitrogen, Carlsbad, CA, USA) to each well, followed by a 90 min incubation at 37 °C. After lysis, the wells were washed three times with 1× TBS. To stop PK activity, 100 µL of 2 mM phenylmethylsulfonyl fluoride (PMSF; Sigma-Aldrich, St. Louis, MO, USA) in TBS was added to each well and incubated on a 3D rotator (Model 4631, Thermo Scientific, Waltham, MA, USA) for 10 min at room temperature. The PMSF solution was then removed, and the wells were washed three times with TBS.
Next, 100 µL of 3 M guanidine thiocyanate (GdnSCN; Fisher Scientific, Waltham, MA, USA) was added to each well, followed by another 10 min incubation on the rotator at room temperature. After removing the GdnSCN, wells were washed four times with 1× TBS. Blocking was performed by adding 100 µL of 5% skim milk (prepared in TBS; Carnation®, Smucker Foods of Canada, Markham, ON, Canada) to each well, with incubation at room temperature for 1 h.
Following blocking, 100 µL of SAF83 monoclonal anti-PrP antibody (1:1000 dilution in TBS; Cayman Chemical, Ann Arbor, MI, USA) was added and incubated for 2 h at room temperature on the rotator. After antibody removal and three washes with TBS, 100 µL of goat anti-mouse alkaline phosphatase-conjugated secondary antibody (1:5000; Bio-Rad, Hercules, CA, USA) was added and incubated for 90 min at room temperature with rocking.
After washing three times with TBS, 60 µL of alkaline phosphatase buffer (100 mM Tris-HCl, 100 mM NaCl, 5 mM MgCl2·6H2O; Sigma-Aldrich) was added to each well and incubated for 10 min. This was followed by the addition of 60 µL of BCIP/NBT substrate solution (Promega, Madison, WI, USA) and a 20 min incubation for color development. The wells were then washed four times with distilled water, and the plates were allowed to dry overnight in the dark.
6.14. Statistics
Body weight trends were analyzed using the MIXED procedure in SAS version 9.3 (SAS Institute Inc., Cary, NC, USA). The following linear mixed model was applied:
where
Yijkl = observed dependent variable (body weight),
μ = overall population mean,
ti = fixed effect of treatment group,
pj = fixed effect of time (period, i.e., age in weeks),
(tp)ij = fixed interaction effect between treatment and period,
εijkl = residual error, assumed to be normally distributed with mean zero and constant variance.
Degrees of freedom were estimated using the Kenward–Roger adjustment. Least squares means (LS-means) were compared using the PDIFF option in SAS, and statistical significance was declared at p < 0.05.
In addition, survival analysis was conducted using GraphPad Prism (version X; GraphPad Software Inc., San Diego, CA, USA). Survival curves were generated using the Kaplan–Meier method, and differences between treatment groups were evaluated using the log-rank (Mantel–Cox) test.
Statistical Analysis of Vacuole Counts
Spongiform vacuolation was quantified in hematoxylin and eosin (H&E)-stained sagittal brain sections scanned using a Hamamatsu NanoZoomer whole-slide scanner. Digital files were opened and visualized using Hamamatsu NDP.view2 software (version U12388-01; Hamamatsu Photonics, Bridgewater, New Jersey, USA), where images were magnified to 5.5× for analysis. Four anatomically defined brain regions were evaluated: the Cc, Th, Mb, and Cr.
For each animal, one representative brain section was selected. Vacuole counts were performed within a fixed analysis area of approximately 1.0 mm2 per region, centered on neuroanatomical landmarks to ensure consistency across animals and treatment groups. Regions were manually delineated and adjusted to avoid artifacts or damaged tissue.
Image preprocessing was conducted using ImageJ (ver. 1.51; Fiji distribution, The Eliceiri/LOCI lab, WI, USA) to improve visual clarity and counting accuracy. A standardized filtering sequence was applied: (1) conversion to 8-bit grayscale, (2) background subtraction with a rolling ball radius of 50 pixels, (3) Gaussian blur (σ = 1.0), and (4) manual thresholding. Only vacuoles with a diameter greater than 5 μm were considered for counting. Annotation and quantification were performed manually by a single observer blinded to treatment groups.
Data are reported as mean vacuole count ± standard error of the mean (SEM) for each brain region and experimental group. One-way analysis of variance (ANOVA) followed by Tukey’s post hoc test was used to assess statistical differences between groups within each brain region. A threshold of
p < 0.05 was considered statistically significant. Results are presented in the main text, with quantitative data summarized descriptively within the
Section 2.


 ,
, 

