
A Module-Level Polygenic Risk Score-Based NetWAS Framework for Identifying AD Genetic Modules Mediated by Amygdala: An ADNI Study

 , and
, and
Abstract
1. Introduction
2. Results
2.1. GWAS and GSA of Amygdala QTs
2.2. Network Propagation Identified Amygdala Modules
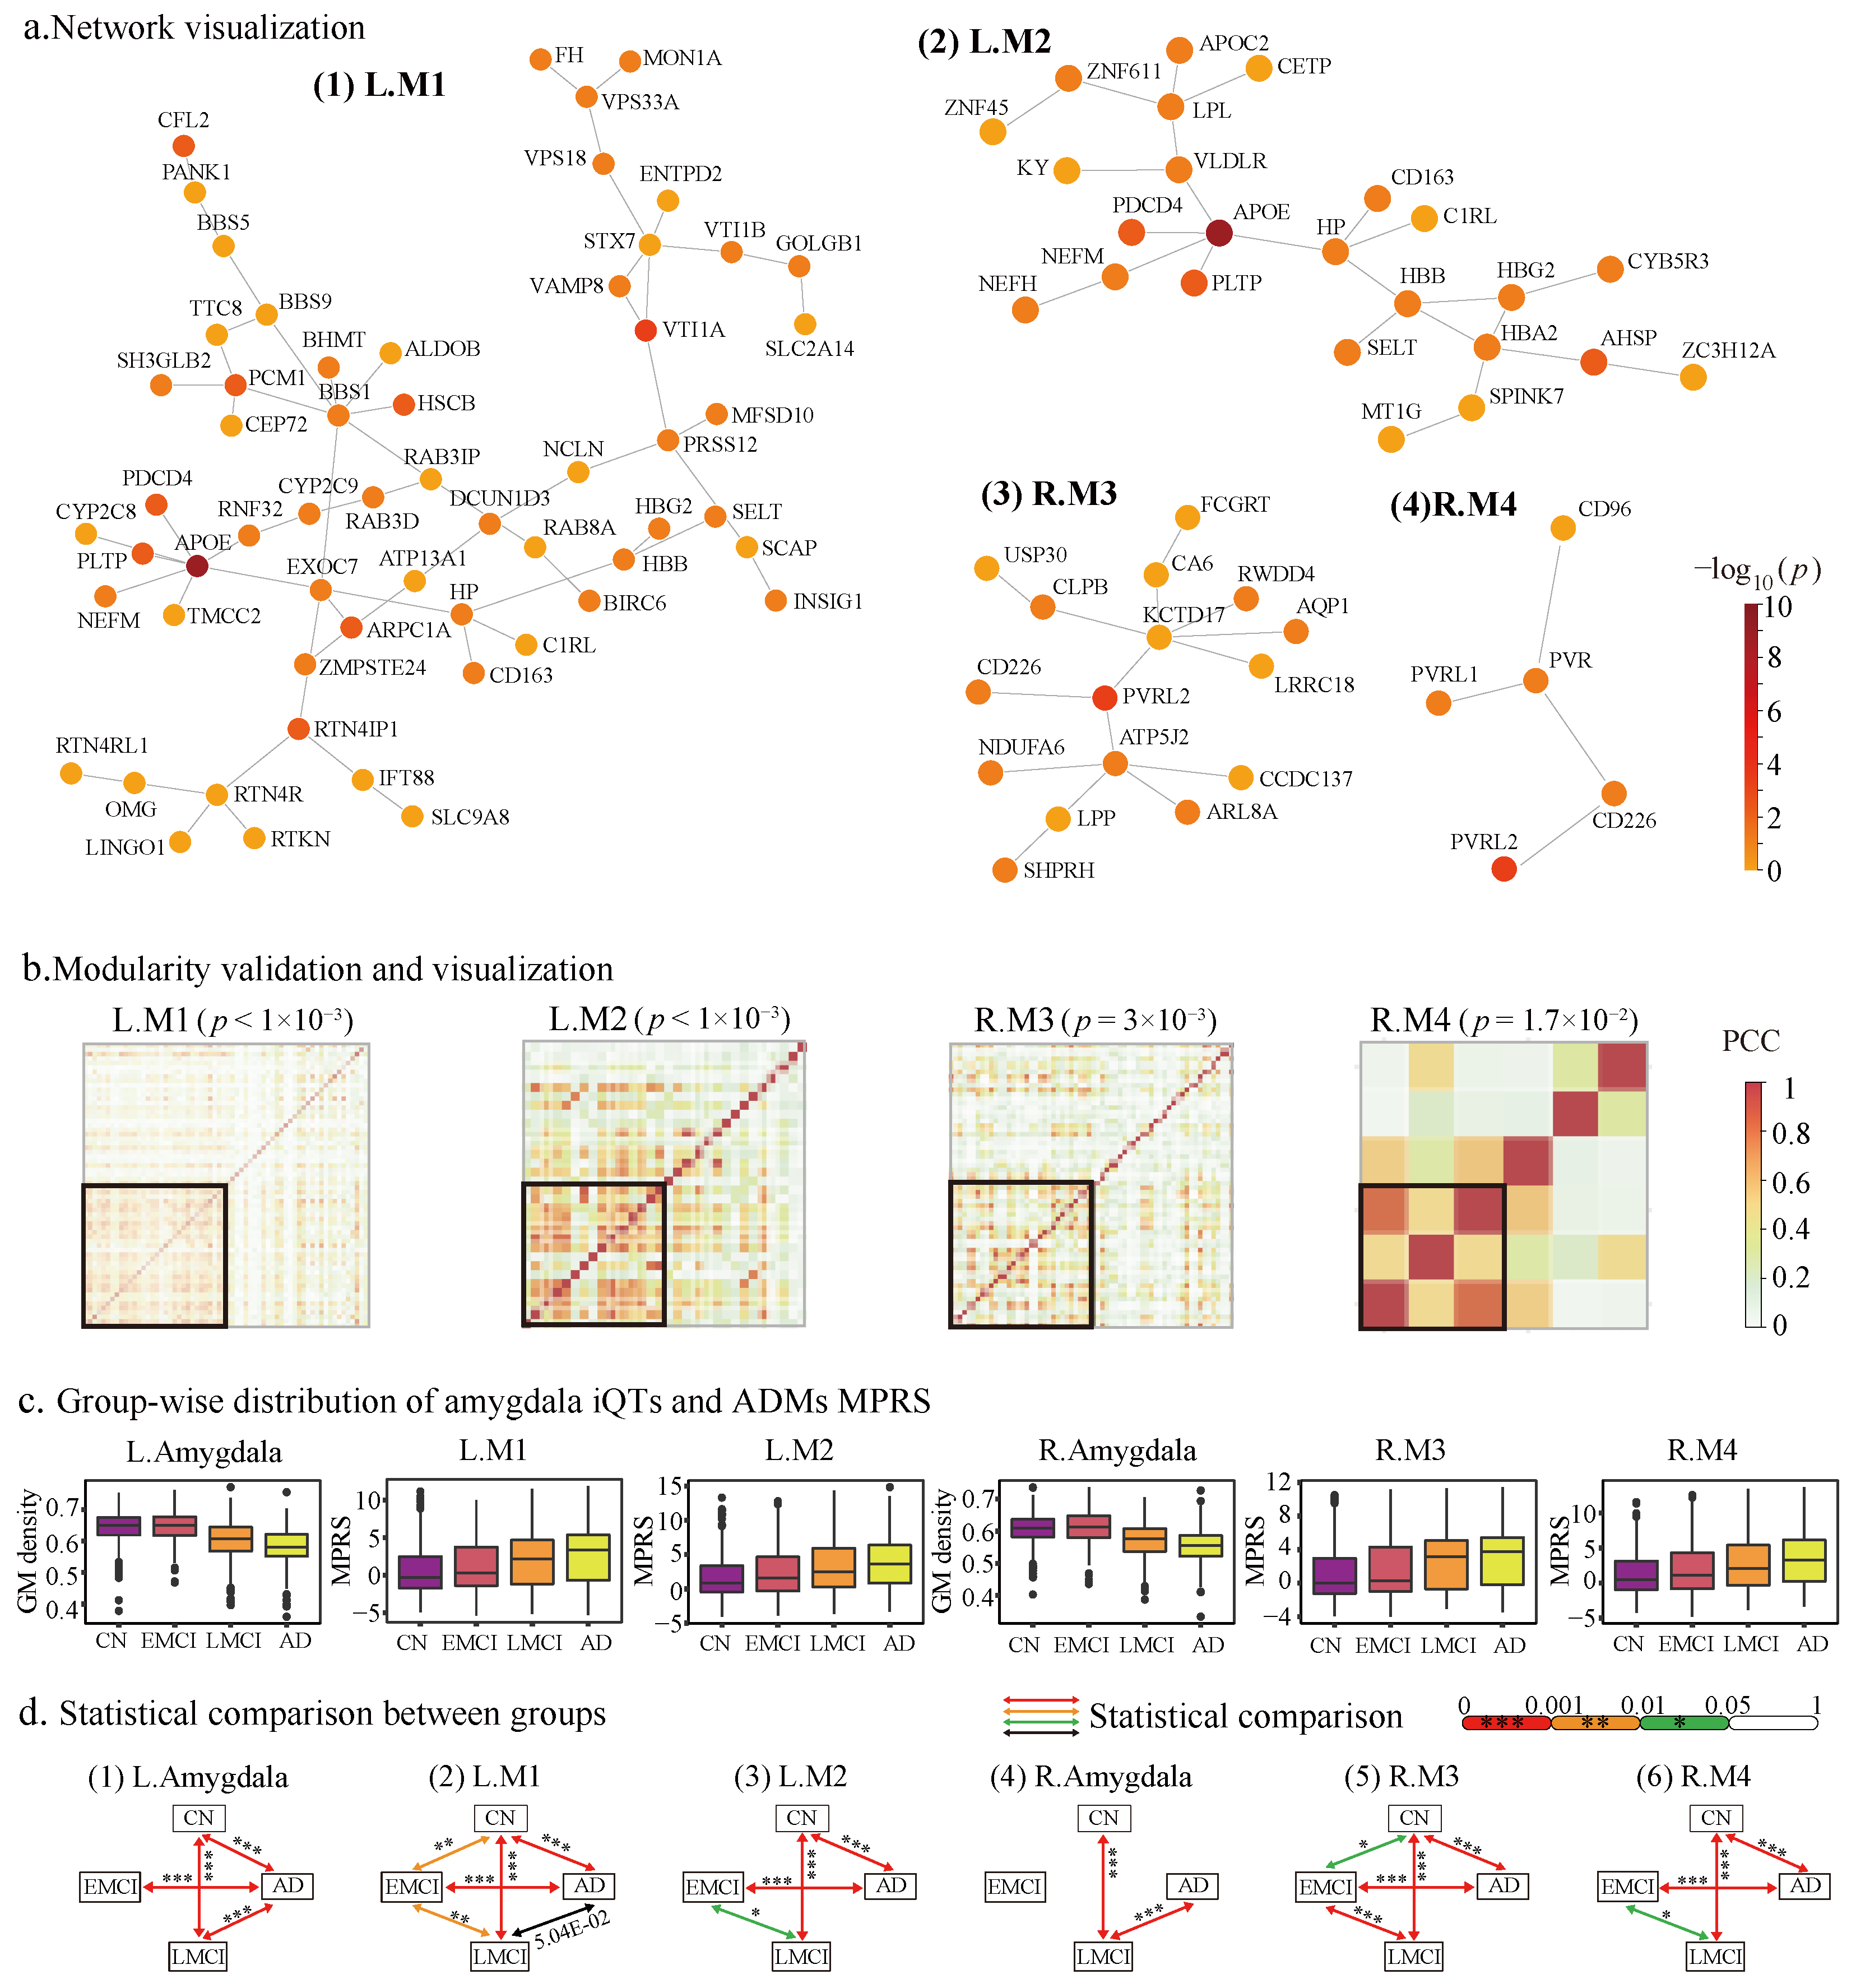
2.2.1. The Identified Amygdala Modules
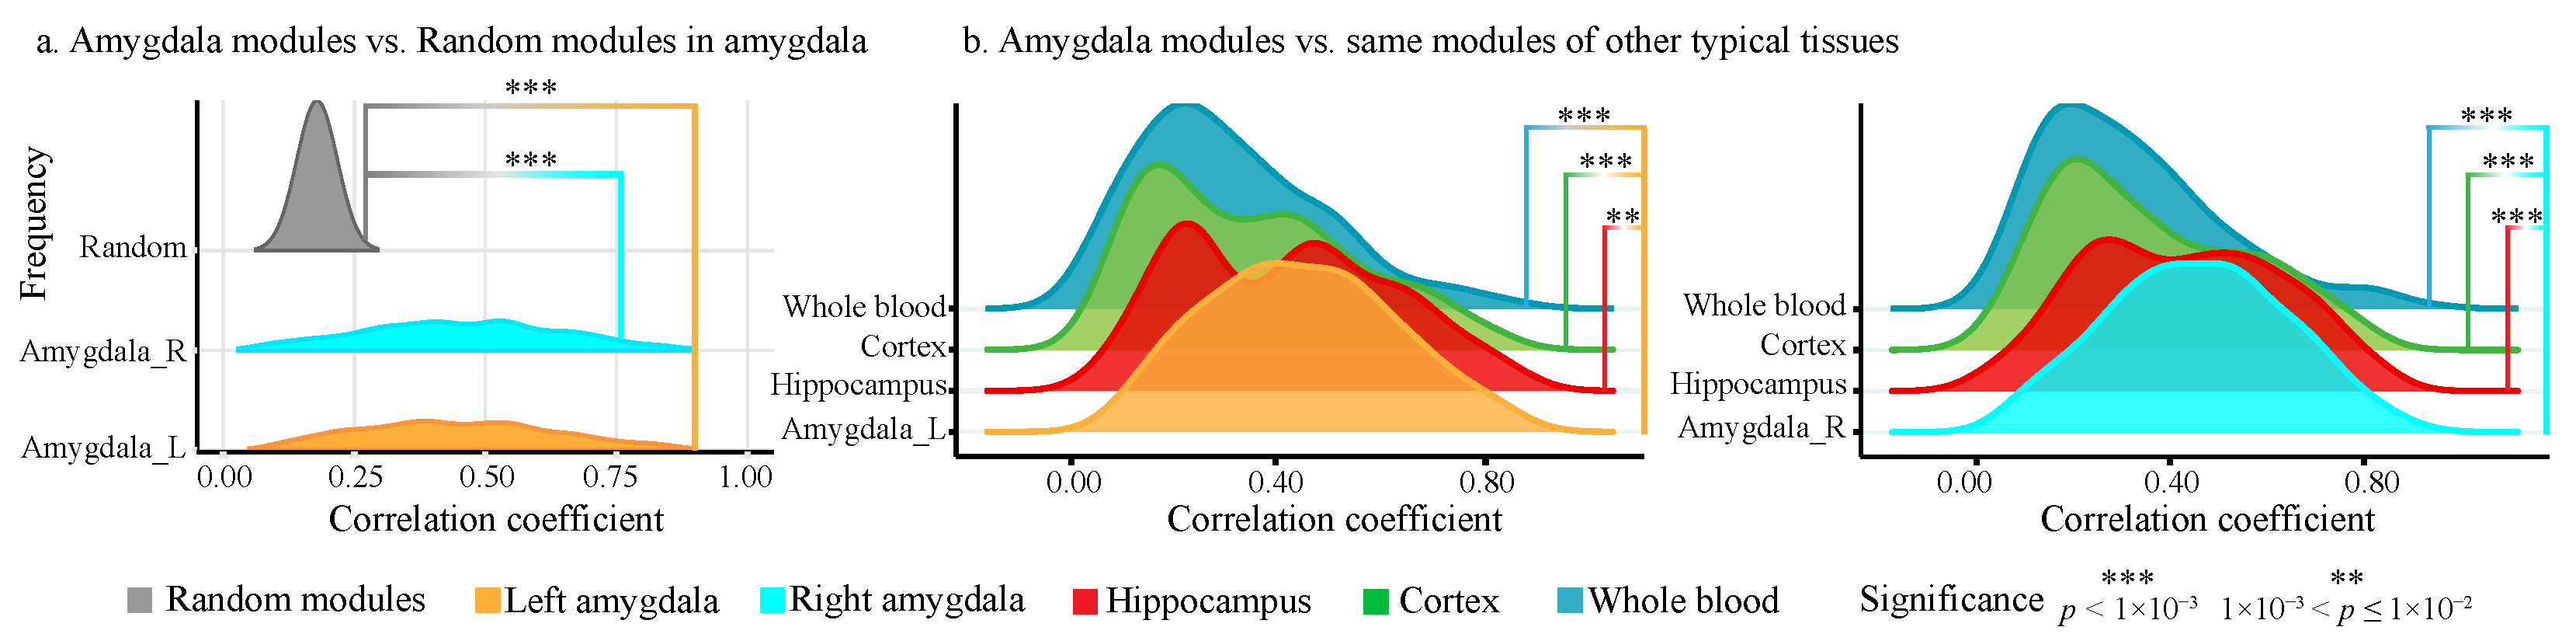
2.2.2. Modularity and Tissue Specificity of Amygdala Modules
2.3. MPRS Identified ADMs from Amygdala Modules
2.4. ADMs Evaluation and Annotation
2.4.1. ADMs Show Significant Modularity than Random Modules
2.4.2. ADMs Are Sensitivity to AD Progression
2.4.3. Amygdala Mediates ADMs to AD
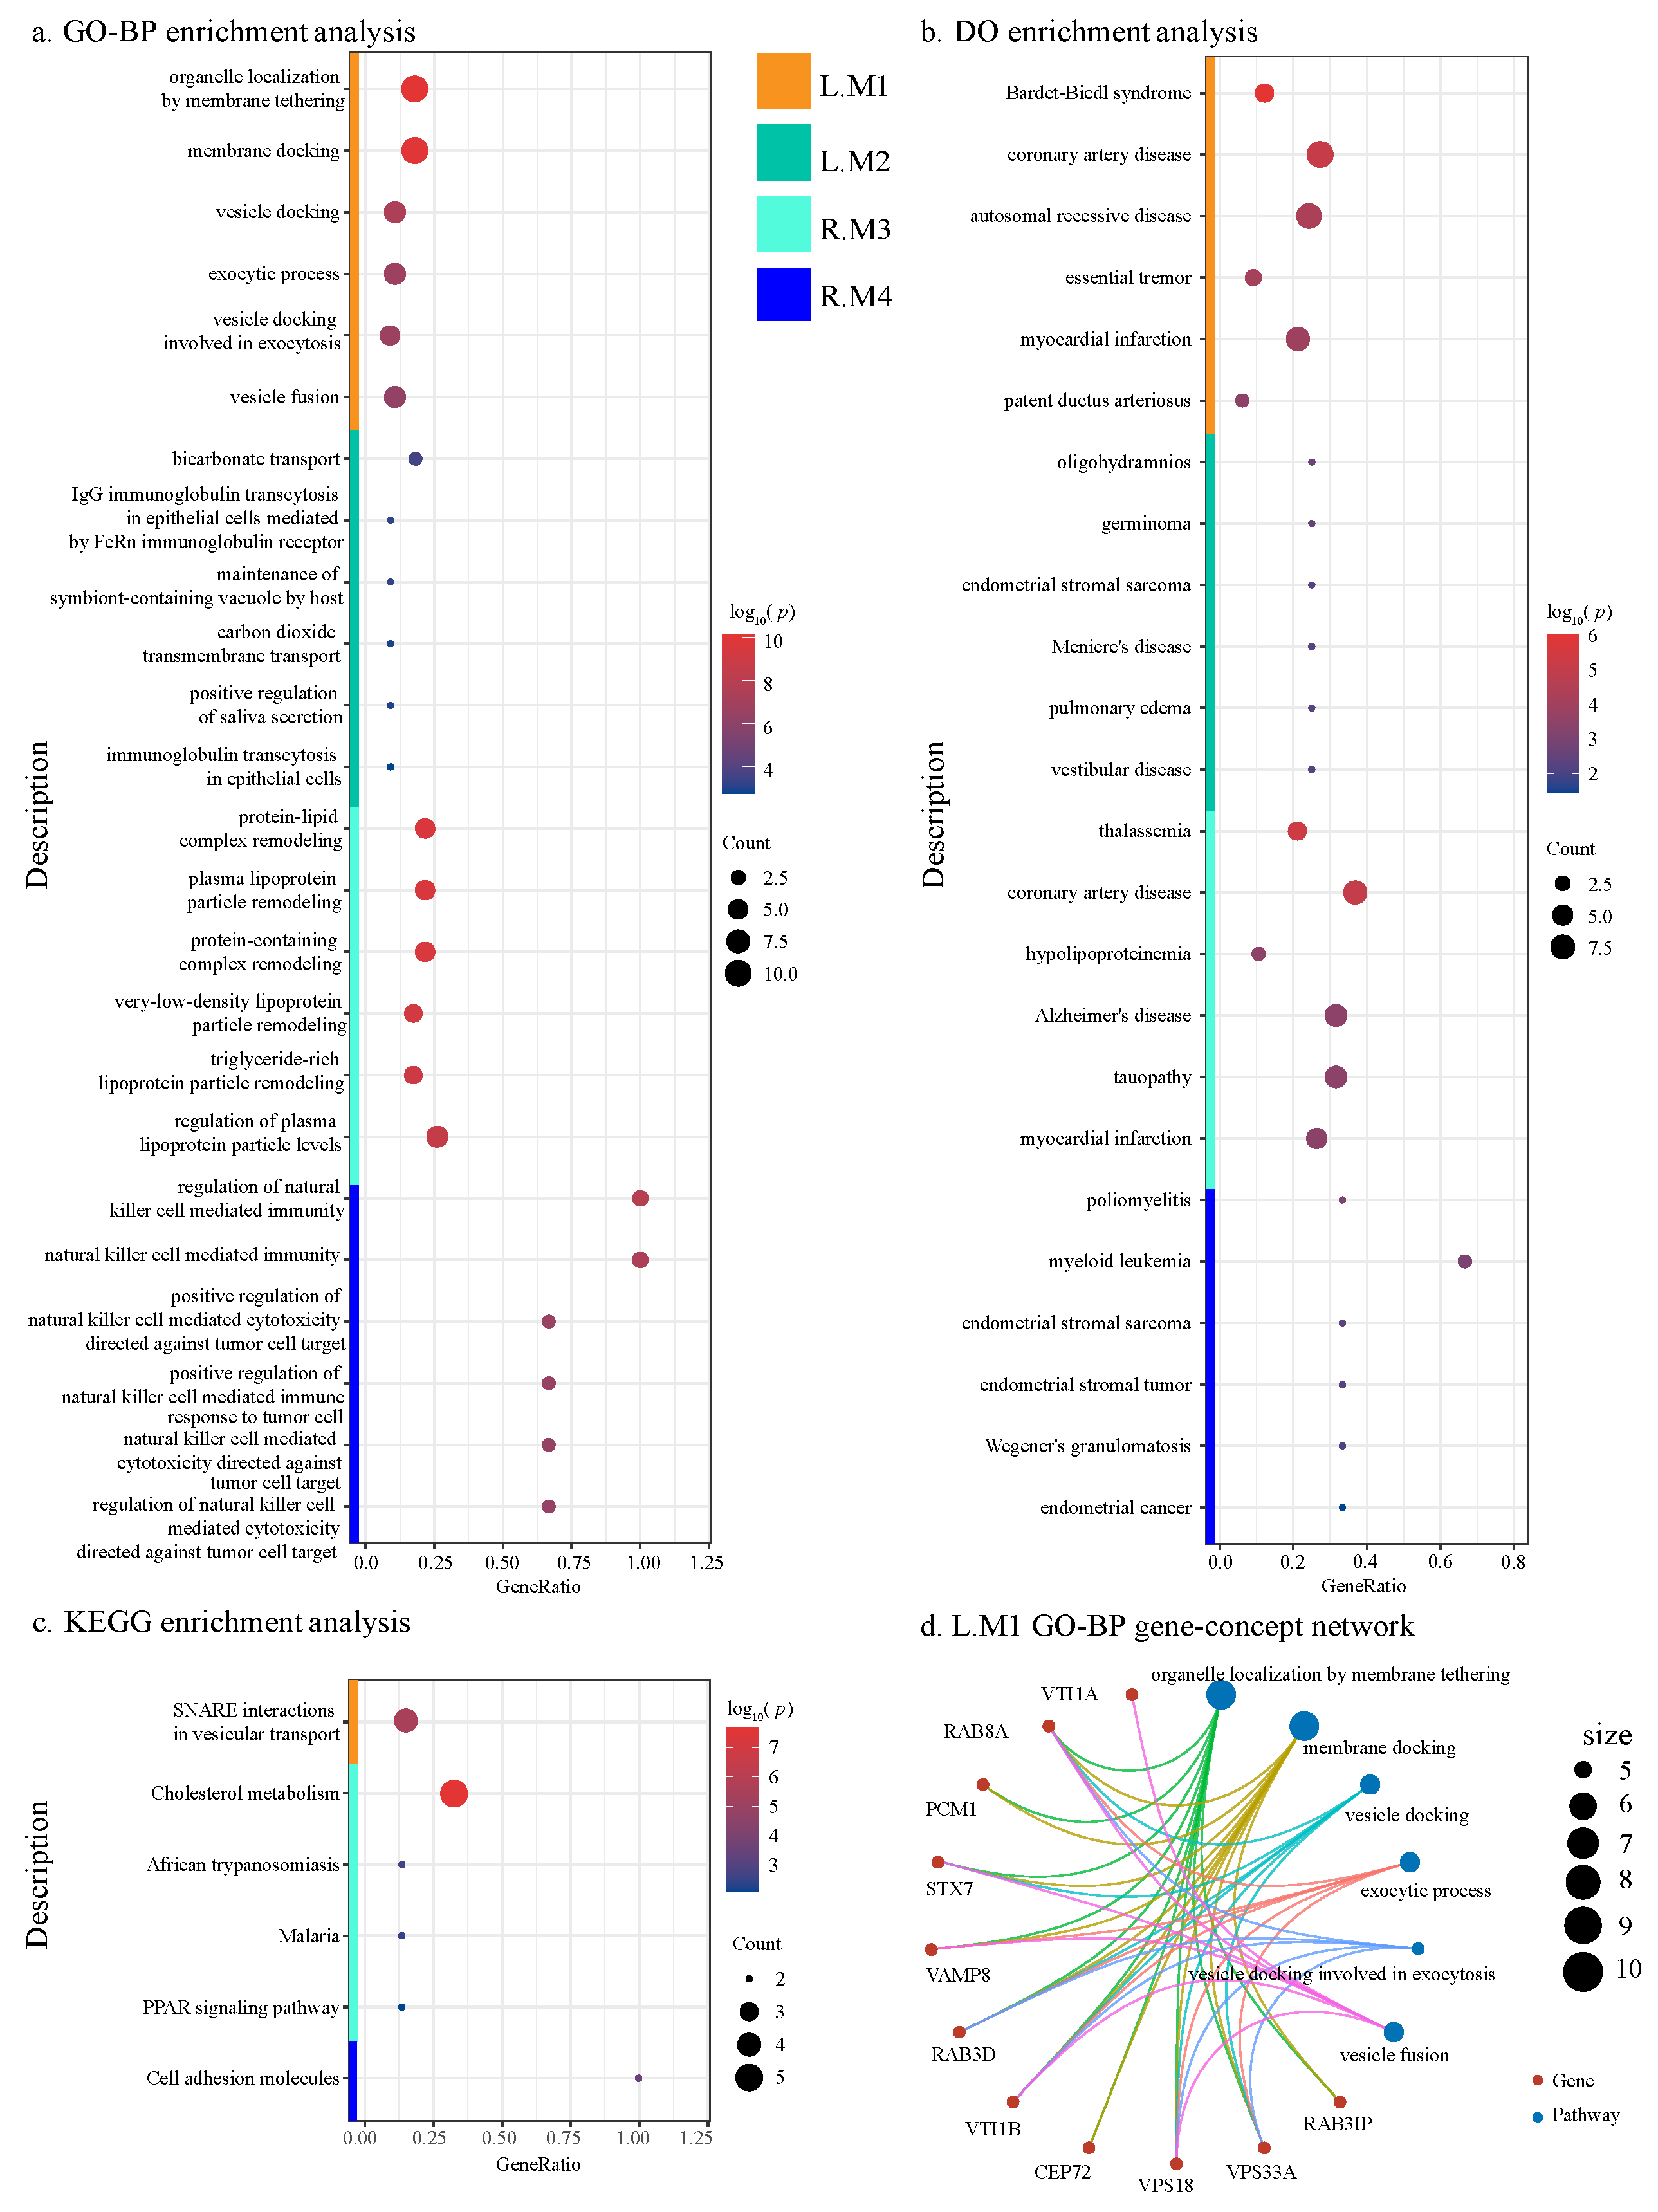
2.4.4. Functional Annotation of ADMs
3. Discussion
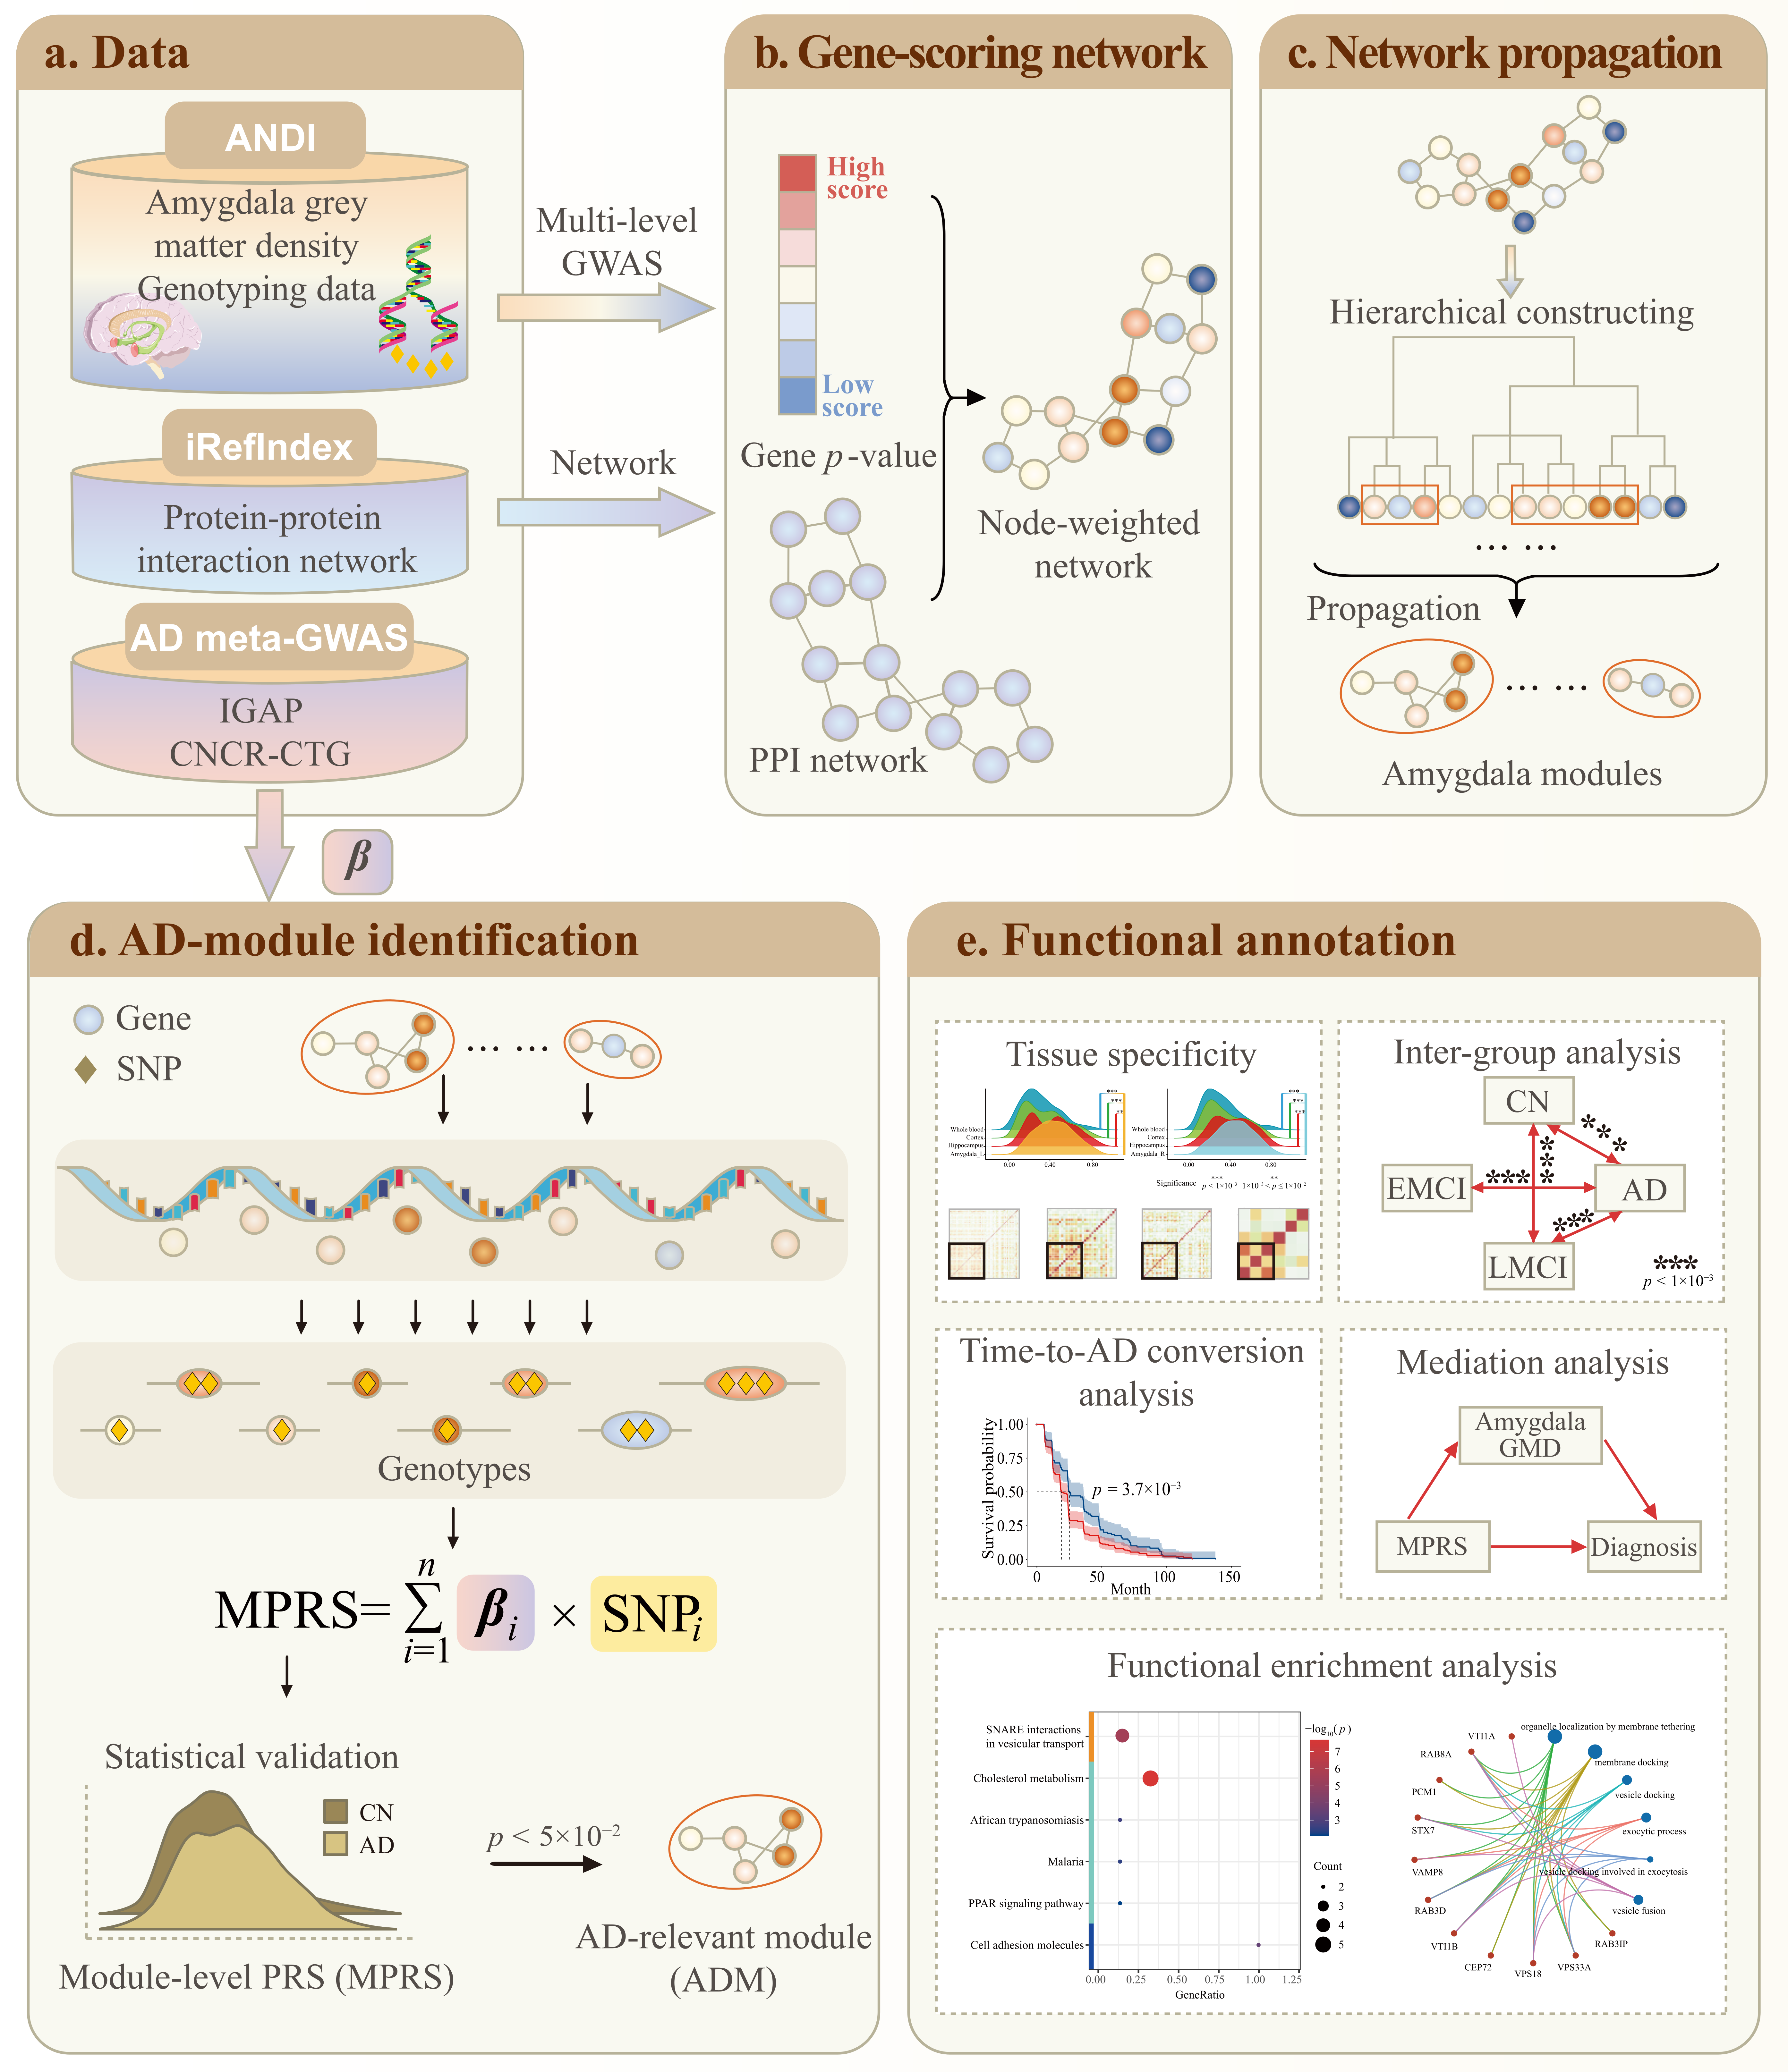
4. Methods
4.1. Amygdala-Specific Module Identification
4.1.1. Amygdala-Specific GWAS and Gene-Set Analysis
4.1.2. Amygdala-Specific Functional Network Construction
4.1.3. Network Propagation to Identify Amygdala Modules
4.2. MPRS-Based ADMs Identification
4.2.1. Module-Level Polygenic Risk Score
4.2.2. ADMs Identification
4.3. ADMs Evaluation and Annotation
4.3.1. Modularity and Tissue Specificity
4.3.2. Sensitivity to AD Progression
4.3.3. Mediation Analysis
4.3.4. Functional Annotation
5. Conclusions
Supplementary Materials
Author Contributions
Funding
Institutional Review Board Statement
Informed Consent Statement
Data Availability Statement
Acknowledgments
Conflicts of Interest
References
- Bao, J.; Wen, J.; Wen, Z.; Yang, S.; Cui, Y.; Yang, Z.; Erus, G.; Saykin, A.J.; Long, Q.; Davatzikos, C.; et al. Brain-wide genome-wide colocalization study for integrating genetics, transcriptomics and brain morphometry in Alzheimer’s disease. NeuroImage 2023, 280, 120346. [Google Scholar] [CrossRef] [PubMed]
- Yingxuan, E.; Yao, X.; Liu, K.; Risacher, S.L.; Saykin, A.J.; Long, Q.; Zhao, Y.; Shen, L. Polygenic mediation analysis of Alzheimer’s disease implicated intermediate amyloid imaging phenotypes. In Proceedings of the AMIA Annual Symposium Proceedings; American Medical Informatics Association: Sydney, Australia, 2020; Volume 2020, p. 422. [Google Scholar]
- Cong, S.; Yao, X.; Xie, L.; Yan, J.; Shen, L.; Initiative, A.D.N. Genetic Influence Underlying Brain Connectivity Phenotype: A Study on Two Age-Specific Cohorts. Front. Genet. 2022, 12, 782953. [Google Scholar] [CrossRef] [PubMed]
- Yu, M.; Sporns, O.; Saykin, A.J. The human connectome in Alzheimer disease—relationship to biomarkers and genetics. Nat. Rev. Neurol. 2021, 17, 545–563. [Google Scholar] [CrossRef]
- Perovnik, M.; Rus, T.; Schindlbeck, K.A.; Eidelberg, D. Functional brain networks in the evaluation of patients with neurodegenerative disorders. Nat. Rev. Neurol. 2023, 19, 73–90. [Google Scholar] [CrossRef]
- Yao, X.; Yan, J.; Liu, K.; Kim, S.; Nho, K.; Risacher, S.L.; Greene, C.S.; Moore, J.H.; Saykin, A.J.; Shen, L.; et al. Tissue-specific network-based genome wide study of amygdala imaging phenotypes to identify functional interaction modules. Bioinformatics 2017, 33, 3250–3257. [Google Scholar] [CrossRef]
- Meng, X.; Li, J.; Zhang, Q.; Chen, F.; Bian, C.; Yao, X.; Yan, J.; Xu, Z.; Risacher, S.L.; Saykin, A.J.; et al. Multivariate genome wide association and network analysis of subcortical imaging phenotypes in Alzheimer’s disease. BMC Genom. 2020, 21, 896. [Google Scholar] [CrossRef] [PubMed]
- Wang, L.; Mousavi, P.; Baranzini, S.E. iPINBPA: An integrative network-based functional module discovery tool for genome-wide association studies. In Proceedings of the Pacific Symposium on Biocomputing Co-Chairs, Kohala Coast, HI, USA, 3–7 January 2014; World Scientific: Singapore, 2014; pp. 255–266. [Google Scholar]
- Wang, M.; Shao, W.; Huang, S.; Zhang, D. Hypergraph-regularized multimodal learning by graph diffusion for imaging genetics based alzheimer’s disease diagnosis. Med. Image Anal. 2023, 89, 102883. [Google Scholar] [CrossRef]
- Wu, R.; Bao, J.; Kim, M.; Saykin, A.J.; Moore, J.H.; Shen, L.; ADNI. Mining High-Level Imaging Genetic Associations via Clustering AD Candidate Variants with Similar Brain Association Patterns. Genes 2022, 13, 1520. [Google Scholar] [CrossRef]
- Tang, X.; Holland, D.; Dale, A.M.; Miller, M.I.; ADNI. APOE affects the volume and shape of the amygdala and the hippocampus in mild cognitive impairment and Alzheimer’s disease: Age matters. J. Alzheimer’s Dis. 2015, 47, 645–660. [Google Scholar] [CrossRef]
- Kulminski, A.M.; Shu, L.; Loika, Y.; He, L.; Nazarian, A.; Arbeev, K.; Ukraintseva, S.; Yashin, A.; Culminskaya, I. Genetic and regulatory architecture of Alzheimer’s disease in the APOE region. Alzheimer’s Dementia Diagn. Assess. Dis. Monit. 2020, 12, e12008. [Google Scholar] [CrossRef]
- Cervantes, S.; Samaranch, L.; Vidal-Taboada, J.M.; Lamet, I.; Bullido, M.J.; Frank-García, A.; Coria, F.; Lleó, A.; Clarimón, J.; Lorenzo, E.; et al. Genetic variation in APOE cluster region and Alzheimer’s disease risk. Neurobiol. Aging 2011, 32, 2107-e7. [Google Scholar] [CrossRef] [PubMed]
- Beeri, M.; Rapp, M.; Silverman, J.; Schmeidler, J.; Grossman, H.; Fallon, J.; Purohit, D.; Perl, D.; Siddiqui, A.; Lesser, G.; et al. Coronary artery disease is associated with Alzheimer disease neuropathology in APOE4 carriers. Neurology 2006, 66, 1399–1404. [Google Scholar] [CrossRef]
- Liu, C.; Chyr, J.; Zhao, W.; Xu, Y.; Ji, Z.; Tan, H.; Soto, C.; Zhou, X.; ADNI. Genome-wide association and mechanistic studies indicate that immune response contributes to Alzheimer’s disease development. Front. Genet. 2018, 9, 410. [Google Scholar] [CrossRef]
- Ortega-Rojas, J.; Morales, L.; Guerrero, E.; Arboleda-Bustos, C.E.; Mejia, A.; Forero, D.; Lopez, L.; Pardo, R.; Arboleda, G.; Yunis, J.; et al. Association analysis of polymorphisms in TOMM40, CR1, PVRL2, SORL1, PICALM, and 14q32. 13 regions in Colombian Alzheimer disease patients. Alzheimer Dis. Assoc. Disord. 2016, 30, 305–309. [Google Scholar] [CrossRef]
- Liang, X.; Liu, C.; Liu, K.; Cong, L.; Wang, Y.; Liu, R.; Fa, W.; Tian, N.; Cheng, Y.; Wang, N.; et al. Association and interaction of TOMM40 and PVRL2 with plasma amyloid-β and Alzheimer’s disease among Chinese older adults: A population-based study. Neurobiol. Aging 2022, 113, 143–151. [Google Scholar] [CrossRef]
- Yang, H.; Liu, D.; Zhao, C.; Feng, B.; Lu, W.; Yang, X.; Xu, M.; Zhou, W.; Jing, H.; Yang, J. Mendelian randomization integrating GWAS and eQTL data revealed genes pleiotropically associated with major depressive disorder. Transl. Psychiatry 2021, 11, 1–9. [Google Scholar] [CrossRef] [PubMed]
- Zhang, Y.; Yao, L.; Liu, W.; Li, W.; Tian, C.; Wang, Z.Y.; Liu, D. Bioinformatics analysis raises candidate genes in blood for early screening of Parkinson’s disease. Biomed. Environ. Sci. 2014, 27, 462–465. [Google Scholar] [PubMed]
- Climer, L.K.; Dobretsov, M.; Lupashin, V. Defects in the COG complex and COG-related trafficking regulators affect neuronal Golgi function. Front. Neurosci. 2015, 9, 405. [Google Scholar] [CrossRef]
- Mielke, M.; Rosenberg, P.; Tschanz, J.; Cook, L.; Corcoran, C.; Hayden, K.; Norton, M.; Rabins, P.; Green, R.; Welsh-Bohmer, K.; et al. Vascular factors predict rate of progression in Alzheimer disease. Neurology 2007, 69, 1850–1858. [Google Scholar] [CrossRef]
- Licastro, F.; Chiappelli, M.; Caldarera, C.M.; Porcellini, E.; Carbone, I.; Caruso, C.; Lio, D.; Corder, E.H. Sharing pathogenetic mechanisms between acute myocardial infarction and Alzheimer’s disease as shown by partially overlapping of gene variant profiles. J. Alzheimer’s Dis. 2011, 23, 421–431. [Google Scholar] [CrossRef]
- Wei, E.X.; Oh, E.S.; Harun, A.; Ehrenburg, M.; Agrawal, Y. Vestibular loss predicts poorer spatial cognition in patients with Alzheimer’s disease. J. Alzheimer’s Dis. 2018, 61, 995–1003. [Google Scholar] [CrossRef] [PubMed]
- Helbecque, N.; Amouyel, P. Very low density lipoprotein receptor in Alzheimer disease. Microsc. Res. Tech. 2000, 50, 273–277. [Google Scholar] [CrossRef] [PubMed]
- Kunkle, B.W.; Grenier-Boley, B.; Sims, R.; Bis, J.C.; Damotte, V.; Naj, A.C.; Boland, A.; Vronskaya, M.; Van Der Lee, S.J.; Amlie-Wolf, A.; et al. Genetic meta-analysis of diagnosed Alzheimer’s disease identifies new risk loci and implicates Aβ, tau, immunity and lipid processing. Nat. Genet. 2019, 51, 414–430. [Google Scholar] [CrossRef]
- Martins, I.J.; Berger, T.; Sharman, M.J.; Verdile, G.; Fuller, S.J.; Martins, R.N. Cholesterol metabolism and transport in the pathogenesis of Alzheimer’s disease. J. Neurochem. 2009, 111, 1275–1308. [Google Scholar] [CrossRef] [PubMed]
- Prolo, P.; Chiappelli, F.; Angeli, A.; Dovio, A.; Perotti, P.; Pautasso, M.; Sartori, M.L.; Saba, L.; Mussino, S.; Fraccalini, T.; et al. Physiologic modulation of natural killer cell activity as an index of Alzheimer’s disease progression. Bioinformation 2007, 1, 363. [Google Scholar] [CrossRef]
- O’Dushlaine, C.; Kenny, E.; Heron, E.; Donohoe, G.; Gill, M.; Morris, D.; Corvin, A. Molecular pathways involved in neuronal cell adhesion and membrane scaffolding contribute to schizophrenia and bipolar disorder susceptibility. Mol. Psychiatry 2011, 16, 286–292. [Google Scholar] [CrossRef]
- Malm, T.; Koistinaho, M.; Muona, A.; Magga, J.; Koistinaho, J. The role and therapeutic potential of monocytic cells in Alzheimer’s disease. Glia 2010, 58, 889–900. [Google Scholar] [CrossRef] [PubMed]
- Jin, K.; Peel, A.L.; Mao, X.O.; Xie, L.; Cottrell, B.A.; Henshall, D.C.; Greenberg, D.A. Increased hippocampal neurogenesis in Alzheimer’s disease. Proc. Natl. Acad. Sci. USA 2004, 101, 343–347. [Google Scholar] [CrossRef]
- Strittmatter, W.J.; Weisgraber, K.H.; Huang, D.Y.; Dong, L.M.; Salvesen, G.S.; Pericak-Vance, M.; Schmechel, D.; Saunders, A.M.; Goldgaber, D.; Roses, A.D. Binding of human apolipoprotein E to synthetic amyloid beta peptide: Isoform-specific effects and implications for late-onset Alzheimer disease. Proc. Natl. Acad. Sci. USA 1993, 90, 8098–8102. [Google Scholar] [CrossRef]
- An, N.; Fu, Y.; Shi, J.; Guo, H.N.; Yang, Z.W.; Li, Y.C.; Li, S.; Wang, Y.; Yao, Z.J.; Hu, B.; et al. Synergistic effects of APOE and CLU may increase the risk of Alzheimer’s disease: Acceleration of atrophy in the volumes and shapes of the hippocampus and amygdala. J. Alzheimer’s Dis. 2021, 80, 1311–1327. [Google Scholar] [CrossRef]
- Markowitsch, H.J.; Staniloiu, A. Amygdala in action: Relaying biological and social significance to autobiographical memory. Neuropsychologia 2011, 49, 718–733. [Google Scholar] [CrossRef] [PubMed]
- den Heijer, T.; Geerlings, M.I.; Hoebeek, F.E.; Hofman, A.; Koudstaal, P.J.; Breteler, M.M. Use of hippocampal and amygdalar volumes on magnetic resonance imaging to predict dementia in cognitively intact elderly people. Arch. Gen. Psychiatry 2006, 63, 57–62. [Google Scholar] [CrossRef] [PubMed]
- Belbin, O.; Dunn, J.L.; Ling, Y.; Morgan, L.; Chappell, S.; Beaumont, H.; Warden, D.; Smith, D.A.; Kalsheker, N.; Morgan, K. Regulatory region single nucleotide polymorphisms of the apolipoprotein E gene and the rate of cognitive decline in Alzheimer’s disease. Hum. Mol. Genet. 2007, 16, 2199–2208. [Google Scholar] [CrossRef]
- Soler-López, M.; Zanzoni, A.; Lluís, R.; Stelzl, U.; Aloy, P. Interactome mapping suggests new mechanistic details underlying Alzheimer’s disease. Genome Res. 2011, 21, 364–376. [Google Scholar] [CrossRef]
- Yang, H.S.; Jansen, A.P.; Komar, A.A.; Zheng, X.; Merrick, W.C.; Costes, S.; Lockett, S.J.; Sonenberg, N.; Colburn, N.H. The transformation suppressor Pdcd4 is a novel eukaryotic translation initiation factor 4A binding protein that inhibits translation. Mol. Cell. Biol. 2003, 23, 26–37. [Google Scholar] [CrossRef] [PubMed]
- Feng, M.G.; Liu, C.F.; Chen, L.; Feng, W.B.; Liu, M.; Hai, H.; Lu, J.M. MiR-21 attenuates apoptosis-triggered by amyloid-β via modulating PDCD4/PI3K/AKT/GSK-3β pathway in SH-SY5Y cells. Biomed. Pharmacother. 2018, 101, 1003–1007. [Google Scholar] [CrossRef]
- Davis, B.N.; Hilyard, A.C.; Lagna, G.; Hata, A. SMAD proteins control DROSHA-mediated microRNA maturation. Nature 2008, 454, 56–61. [Google Scholar] [CrossRef]
- Davis, B.N.; Hilyard, A.C.; Nguyen, P.H.; Lagna, G.; Hata, A. Smad proteins bind a conserved RNA sequence to promote microRNA maturation by Drosha. Mol. Cell 2010, 39, 373–384. [Google Scholar] [CrossRef]
- Aronica, E.; Van Vliet, E.A.; Mayboroda, O.A.; Troost, D.; Da Silva, F.H.L.; Gorter, J.A. Upregulation of metabotropic glutamate receptor subtype mGluR3 and mGluR5 in reactive astrocytes in a rat model of mesial temporal lobe epilepsy. Eur. J. Neurosci. 2000, 12, 2333–2344. [Google Scholar] [CrossRef]
- Plata-Salamán, C.R.; Ilyin, S.E.; Turrin, N.P.; Gayle, D.; Flynn, M.C.; Romanovitch, A.E.; Kelly, M.E.; Bureau, Y.; Anisman, H.; McIntyre, D.C. Kindling modulates the IL-1β system, TNF-α, TGF-β1, and neuropeptide mRNAs in specific brain regions. Mol. Brain Res. 2000, 75, 248–258. [Google Scholar] [CrossRef]
- Matsuyama, S.S.; Cripe, A.T.; Joseph, J. Haptoglobin phenotypes in dementia of the Alzheimer type. Hum. Hered. 1986, 36, 93–96. [Google Scholar] [CrossRef]
- Bai, H.; Naj, A.C.; Benchek, P.; Dumitrescu, L.; Hohman, T.; Hamilton-Nelson, K.; Kallianpur, A.R.; Griswold, A.J.; Vardarajan, B.; Martin, E.R.; et al. A haptoglobin (HP) structural variant alters the effect of APOE alleles on Alzheimer’s disease. Alzheimer’s Dement. 2023, 19, 4886–4895. [Google Scholar] [CrossRef]
- Napolioni, V.; Giannì, P.; Carpi, F.M.; Predazzi, I.M.; Lucarini, N. APOE haplotypes are associated with human longevity in a Central Italy population: Evidence for epistasis with HP 1/2 polymorphism. Clin. Chim. Acta 2011, 412, 1821–1824. [Google Scholar] [CrossRef]
- Tindale, L.C.; Leach, S.; Spinelli, J.J.; Brooks-Wilson, A.R. Lipid and Alzheimer’s disease genes associated with healthy aging and longevity in healthy oldest-old. Oncotarget 2017, 8, 20612. [Google Scholar] [CrossRef]
- Spagnuolo, M.S.; Maresca, B.; La Marca, V.; Carrizzo, A.; Veronesi, C.; Cupidi, C.; Piccoli, T.; Maletta, R.G.; Bruni, A.C.; Abrescia, P.; et al. Haptoglobin interacts with apolipoprotein E and beta-amyloid and influences their crosstalk. ACS Chem. Neurosci. 2014, 5, 837–847. [Google Scholar] [CrossRef]
- Shi, L.; Baird, A.L.; Westwood, S.; Hye, A.; Dobson, R.; Thambisetty, M.; Lovestone, S. A decade of blood biomarkers for Alzheimer’s disease research: An evolving field, improving study designs, and the challenge of replication. J. Alzheimer’s Dis. 2018, 62, 1181–1198. [Google Scholar] [CrossRef]
- Esiri, M.; Chance, S.; Joachim, C.; Warden, D.; Smallwood, A.; Sloan, C.; Christie, S.; Wilcock, G.; Smith, A.D. Cerebral amyloid angiopathy, subcortical white matter disease and dementia: Literature review and study in OPTIMA. Brain Pathol. 2015, 25, 51–62. [Google Scholar] [CrossRef]
- Teng, X.; Aouacheria, A.; Lionnard, L.; Metz, K.A.; Soane, L.; Kamiya, A.; Hardwick, J.M. KCTD: A new gene family involved in neurodevelopmental and neuropsychiatric disorders. CNS Neurosci. Ther. 2019, 25, 887–902. [Google Scholar] [CrossRef]
- Mencacci, N.E.; Rubio-Agusti, I.; Zdebik, A.; Asmus, F.; Ludtmann, M.H.; Ryten, M.; Plagnol, V.; Hauser, A.K.; Bandres-Ciga, S.; Bettencourt, C.; et al. A missense mutation in KCTD17 causes autosomal dominant myoclonus-dystonia. Am. J. Hum. Genet. 2015, 96, 938–947. [Google Scholar] [CrossRef]
- Reymond, N.; Imbert, A.M.; Devilard, E.; Fabre, S.; Chabannon, C.; Xerri, L.; Farnarier, C.; Cantoni, C.; Bottino, C.; Moretta, A.; et al. DNAM-1 and PVR regulate monocyte migration through endothelial junctions. J. Exp. Med. 2004, 199, 1331–1341. [Google Scholar] [CrossRef]
- Harwood, J.C.; Leonenko, G.; Sims, R.; Escott-Price, V.; Williams, J.; Holmans, P. Defining functional variants associated with Alzheimer’s disease in the induced immune response. Brain Commun. 2021, 3, fcab083. [Google Scholar] [CrossRef]
- Marioni, R.E.; Harris, S.E.; Zhang, Q.; McRae, A.F.; Hagenaars, S.P.; Hill, W.D.; Davies, G.; Ritchie, C.W.; Gale, C.R.; Starr, J.M.; et al. GWAS on family history of Alzheimer’s disease. Transl. Psychiatry 2018, 8, 1–7. [Google Scholar] [CrossRef]
- Liu, N.; Xu, J.; Liu, H.; Zhang, S.; Li, M.; Zhou, Y.; Qin, W.; Li, M.J.; Yu, C.; Alzheimer’s disease Neuroimaging Initiative. Hippocampal transcriptome-wide association study and neurobiological pathway analysis for Alzheimer’s disease. PLoS Genet. 2021, 17, e1009363. [Google Scholar] [CrossRef]
- Shen, L.; Kim, S.; Risacher, S.L.; Nho, K.; Swaminathan, S.; West, J.D.; Foroud, T.; Pankratz, N.; Moore, J.H.; Sloan, C.D.; et al. Whole genome association study of brain-wide imaging phenotypes for identifying quantitative trait loci in MCI and AD: A study of the ADNI cohort. Neuroimage 2010, 53, 1051–1063. [Google Scholar] [CrossRef]
- Golovynska, I.; Golovynskyi, S.; Stepanov, Y.V.; Qu, J.; Zhang, R.; Qu, J. Near-infrared light therapy normalizes amyloid load, neuronal lipid membrane order, rafts and cholesterol level in Alzheimer’s disease. J. Photochem. Photobiol. B Biol. 2024, 262, 113086. [Google Scholar] [CrossRef]
- Suzuki, R.; Ferris, H.A.; Chee, M.J.; Maratos-Flier, E.; Kahn, C.R. Reduction of the cholesterol sensor SCAP in the brains of mice causes impaired synaptic transmission and altered cognitive function. PLoS Biol. 2013, 11, e1001532. [Google Scholar] [CrossRef]
- Soto, M.; Cai, W.; Konishi, M.; Kahn, C.R. Insulin signaling in the hippocampus and amygdala regulates metabolism and neurobehavior. Proc. Natl. Acad. Sci. USA 2019, 116, 6379–6384. [Google Scholar] [CrossRef]
- Poulin, S.P.; Dautoff, R.; Morris, J.C.; Barrett, L.F.; Dickerson, B.C.; ADNI. Amygdala atrophy is prominent in early Alzheimer’s disease and relates to symptom severity. Psychiatry Res. Neuroimaging 2011, 194, 7–13. [Google Scholar] [CrossRef]
- Šimić, G.; Tkalčić, M.; Vukić, V.; Mulc, D.; Španić, E.; Šagud, M.; Olucha-Bordonau, F.E.; Vukšić, M.; Hof, P.R. Understanding emotions: Origins and roles of the amygdala. Biomolecules 2021, 11, 823. [Google Scholar] [CrossRef]
- Andrewes, D.G.; Jenkins, L.M. The role of the amygdala and the ventromedial prefrontal cortex in emotional regulation: Implications for post-traumatic stress disorder. Neuropsychol. Rev. 2019, 29, 220–243. [Google Scholar] [CrossRef]
- Yao, X.; Cong, S.; Yan, J.; Risacher, S.L.; Saykin, A.J.; Moore, J.H. Regional imaging genetic enrichment analysis. Bioinformatics 2020, 36, 2554–2560. [Google Scholar] [CrossRef]
- Purcell, S.; Neale, B.; Todd-Brown, K.; Thomas, L.; Ferreira, M.A.; Bender, D.; Maller, J.; Sklar, P.; De Bakker, P.I.; Daly, M.J.; et al. PLINK: A tool set for whole-genome association and population-based linkage analyses. Am. J. Hum. Genet. 2007, 81, 559–575. [Google Scholar] [CrossRef]
- de Leeuw, C.A.; Mooij, J.M.; Heskes, T.; Posthuma, D. MAGMA: Generalized gene-set analysis of GWAS data. PLoS Comput. Biol. 2015, 11, e1004219. [Google Scholar] [CrossRef]
- Razick, S.; Magklaras, G.; Donaldson, I.M. iRefIndex: A consolidated protein interaction database with provenance. BMC Bioinform. 2008, 9, 405. [Google Scholar] [CrossRef]
- Reyna, M.A.; Leiserson, M.D.; Raphael, B.J. Hierarchical HotNet: Identifying hierarchies of altered subnetworks. Bioinformatics 2018, 34, i972–i980. [Google Scholar] [CrossRef]
- Hubert, L. Min and max hierarchical clustering using asymmetric similarity measures. Psychometrika 1973, 38, 63–72. [Google Scholar] [CrossRef]
- Jansen, I.E.; Savage, J.E.; Watanabe, K.; Bryois, J.; Williams, D.M.; Steinberg, S.; Sealock, J.; Karlsson, I.K.; Hägg, S.; Athanasiu, L.; et al. Genome-wide meta-analysis identifies new loci and functional pathways influencing Alzheimer’s disease risk. Nat. Genet. 2019, 51, 404–413. [Google Scholar] [CrossRef]
- Imai, K.; Keele, L.; Tingley, D. A general approach to causal mediation analysis. Psychol. Methods 2010, 15, 309. [Google Scholar] [CrossRef]
- Yu, G.; Wang, L.G.; Han, Y.; He, Q.Y. clusterProfiler: An R package for comparing biological themes among gene clusters. Omics A J. Integr. Biol. 2012, 16, 284–287. [Google Scholar] [CrossRef]
- Kim, S.; Swaminathan, S.; Inlow, M.; Risacher, S.L.; Nho, K.; Shen, L.; Foroud, T.M.; Petersen, R.C.; Aisen, P.S.; Soares, H.; et al. Influence of genetic variation on plasma protein levels in older adults using a multi-analyte panel. PLoS ONE 2013, 8, e70269. [Google Scholar] [CrossRef]
- Saykin, A.J.; Shen, L.; Foroud, T.M.; Potkin, S.G.; Swaminathan, S.; Kim, S.; Risacher, S.L.; Nho, K.; Huentelman, M.J.; Craig, D.W.; et al. Alzheimer’s disease neuroimaging initiative biomarkers as quantitative phenotypes: Genetics core aims, progress, and plans. Alzheimers Dement. 2010, 6, 265–273. [Google Scholar] [CrossRef]
- Ramanan, V.K.; Risacher, S.L.; Nho, K.; Kim, S.; Shen, L.; McDonald, B.C.; Yoder, K.K.; Hutchins, G.D.; West, J.D.; Tallman, E.F.; et al. GWAS of longitudinal amyloid accumulation on 18F-florbetapir PET in Alzheimer’s disease implicates microglial activation gene IL1RAP. Brain 2015, 138, 3076–3088. [Google Scholar] [CrossRef]
- Jack, M.A., Jr.; Bernstein, M.A.; Fox, N.C.; Thompson, P.; Alexander, G.; Harvey, D.; Borowski, B.; Britson, P.J.; Whitwell, J.L.; Ward, C.; et al. The Alzheimer’s Disease Neuroimaging Initiative (ADNI): MRI methods. J. Magn. Reson. Imaging 2008, 27, 685–691. [Google Scholar] [CrossRef]
- Risacher, S.L.; Saykin, A.J.; Wes, J.D.; Shen, L.; Firpi, H.A.; McDonald, B.C. Baseline MRI predictors of conversion from MCI to probable AD in the ADNI cohort. Curr. Alzheimer Res. 2009, 6, 347–361. [Google Scholar] [CrossRef]
- Tzourio-Mazoyer, N.; Landeau, B.; Papathanassiou, D.; Crivello, F.; Etard, O.; Delcroix, N.; Mazoyer, B.; Joliot, M. Automated anatomical labeling of activations in SPM using a macroscopic anatomical parcellation of the MNI MRI single-subject brain. Neuroimage 2002, 15, 273–289. [Google Scholar] [CrossRef]
- Lonsdale, J.; Thomas, J.; Salvatore, M.; Phillips, R.; Lo, E.; Shad, S.; Hasz, R.; Walters, G.; Garcia, F.; Young, N.; et al. The Genotype-Tissue Expression (GTEx) project. Nat. Genet. 2013, 45, 580–585. [Google Scholar] [CrossRef]
- Gao, L.; Cui, Z.; Shen, L.; Ji, H.-F. Shared genetic etiology between type 2 diabetes and Alzheimer’s disease identified by bioinformatics analysis. J. Alzheimers Dis. 2016, 50, 13–17. [Google Scholar] [CrossRef]
- Yashin, A.I.; Fang, F.; Kovtun, M.; Wu, D.; Duan, M.; Arbeev, K.; Akushevich, I.; Kulminski, A.; Culminskaya, I.; Zhbannikov, I.; et al. Hidden heterogeneity in Alzheimer’s disease: Insights from genetic association studies and other analyses. Exp. Gerontol. 2018, 107, 148–160. [Google Scholar] [CrossRef]


| Diagnosis | CN (N = 353) | SMC (N = 89) | EMCI (N = 272) | LMCI (N = 508) | AD (N = 293) | p-Value |
|---|---|---|---|---|---|---|
| Age | 75.14 ± 5.47 | 72.18 ± 5.73 | 71.27 ± 7.15 | 74.06 ± 7.53 | 75.17 ± 7.90 | |
| Gender (M/F) | 187/166 | 36/53 | 152/120 | 312/196 | 164/129 | |
| Education | 16.34 ± 2.64 | 16.76 ± 2.62 | 16.07 ± 2.64 | 15.97 ± 2.89 | 15.18 ± 2.99 | |
| Left amygdala GMD | 0.64 ± 0.05 | 0.66 ± 0.04 | 0.64 ± 0.05 | 0.60 ± 0.06 | 0.58 ± 0.06 | |
| Right amygdala GMD | 0.60 ± 0.05 | 0.63 ± 0.04 | 0.61 ± 0.05 | 0.57 ± 0.05 | 0.55 ± 0.05 |
Disclaimer/Publisher’s Note: The statements, opinions and data contained in all publications are solely those of the individual author(s) and contributor(s) and not of MDPI and/or the editor(s). MDPI and/or the editor(s) disclaim responsibility for any injury to people or property resulting from any ideas, methods, instructions or products referred to in the content. |
© 2025 by the authors. Licensee MDPI, Basel, Switzerland. This article is an open access article distributed under the terms and conditions of the Creative Commons Attribution (CC BY) license (https://creativecommons.org/licenses/by/4.0/).
Share and Cite
Luo, H.; Fan, S.; Liu, H.; Li, W.; Fan, Z.; Zhu, X.; Zhang, C.J.; Liang, H.; Cong, S.; Yao, X. A Module-Level Polygenic Risk Score-Based NetWAS Framework for Identifying AD Genetic Modules Mediated by Amygdala: An ADNI Study. Int. J. Mol. Sci. 2025, 26, 6060. https://doi.org/10.3390/ijms26136060
Luo H, Fan S, Liu H, Li W, Fan Z, Zhu X, Zhang CJ, Liang H, Cong S, Yao X. A Module-Level Polygenic Risk Score-Based NetWAS Framework for Identifying AD Genetic Modules Mediated by Amygdala: An ADNI Study. International Journal of Molecular Sciences. 2025; 26(13):6060. https://doi.org/10.3390/ijms26136060
Chicago/Turabian StyleLuo, Haoran, Shaoheng Fan, Hongwei Liu, Wei Li, Zhoujie Fan, Xuancheng Zhu, Chen Jason Zhang, Hong Liang, Shan Cong, and Xiaohui Yao. 2025. "A Module-Level Polygenic Risk Score-Based NetWAS Framework for Identifying AD Genetic Modules Mediated by Amygdala: An ADNI Study" International Journal of Molecular Sciences 26, no. 13: 6060. https://doi.org/10.3390/ijms26136060
APA StyleLuo, H., Fan, S., Liu, H., Li, W., Fan, Z., Zhu, X., Zhang, C. J., Liang, H., Cong, S., & Yao, X. (2025). A Module-Level Polygenic Risk Score-Based NetWAS Framework for Identifying AD Genetic Modules Mediated by Amygdala: An ADNI Study. International Journal of Molecular Sciences, 26(13), 6060. https://doi.org/10.3390/ijms26136060