
Selective Inhibition of the ABCG2 Transporter by Primaquine Derivatives Reverses the Multidrug Resistance of Tumor Cells

 , , , ,
  and
and
Abstract

1. Introduction
2. Results
2.1. Effect of Primaquine Derivatives on ABCG2 Transporter’s Activity
2.1.1. Primaquine Derivatives Show Low Cytotoxicity Against Parental and ABCG2 Transporter-Overexpressing Model Cell Lines
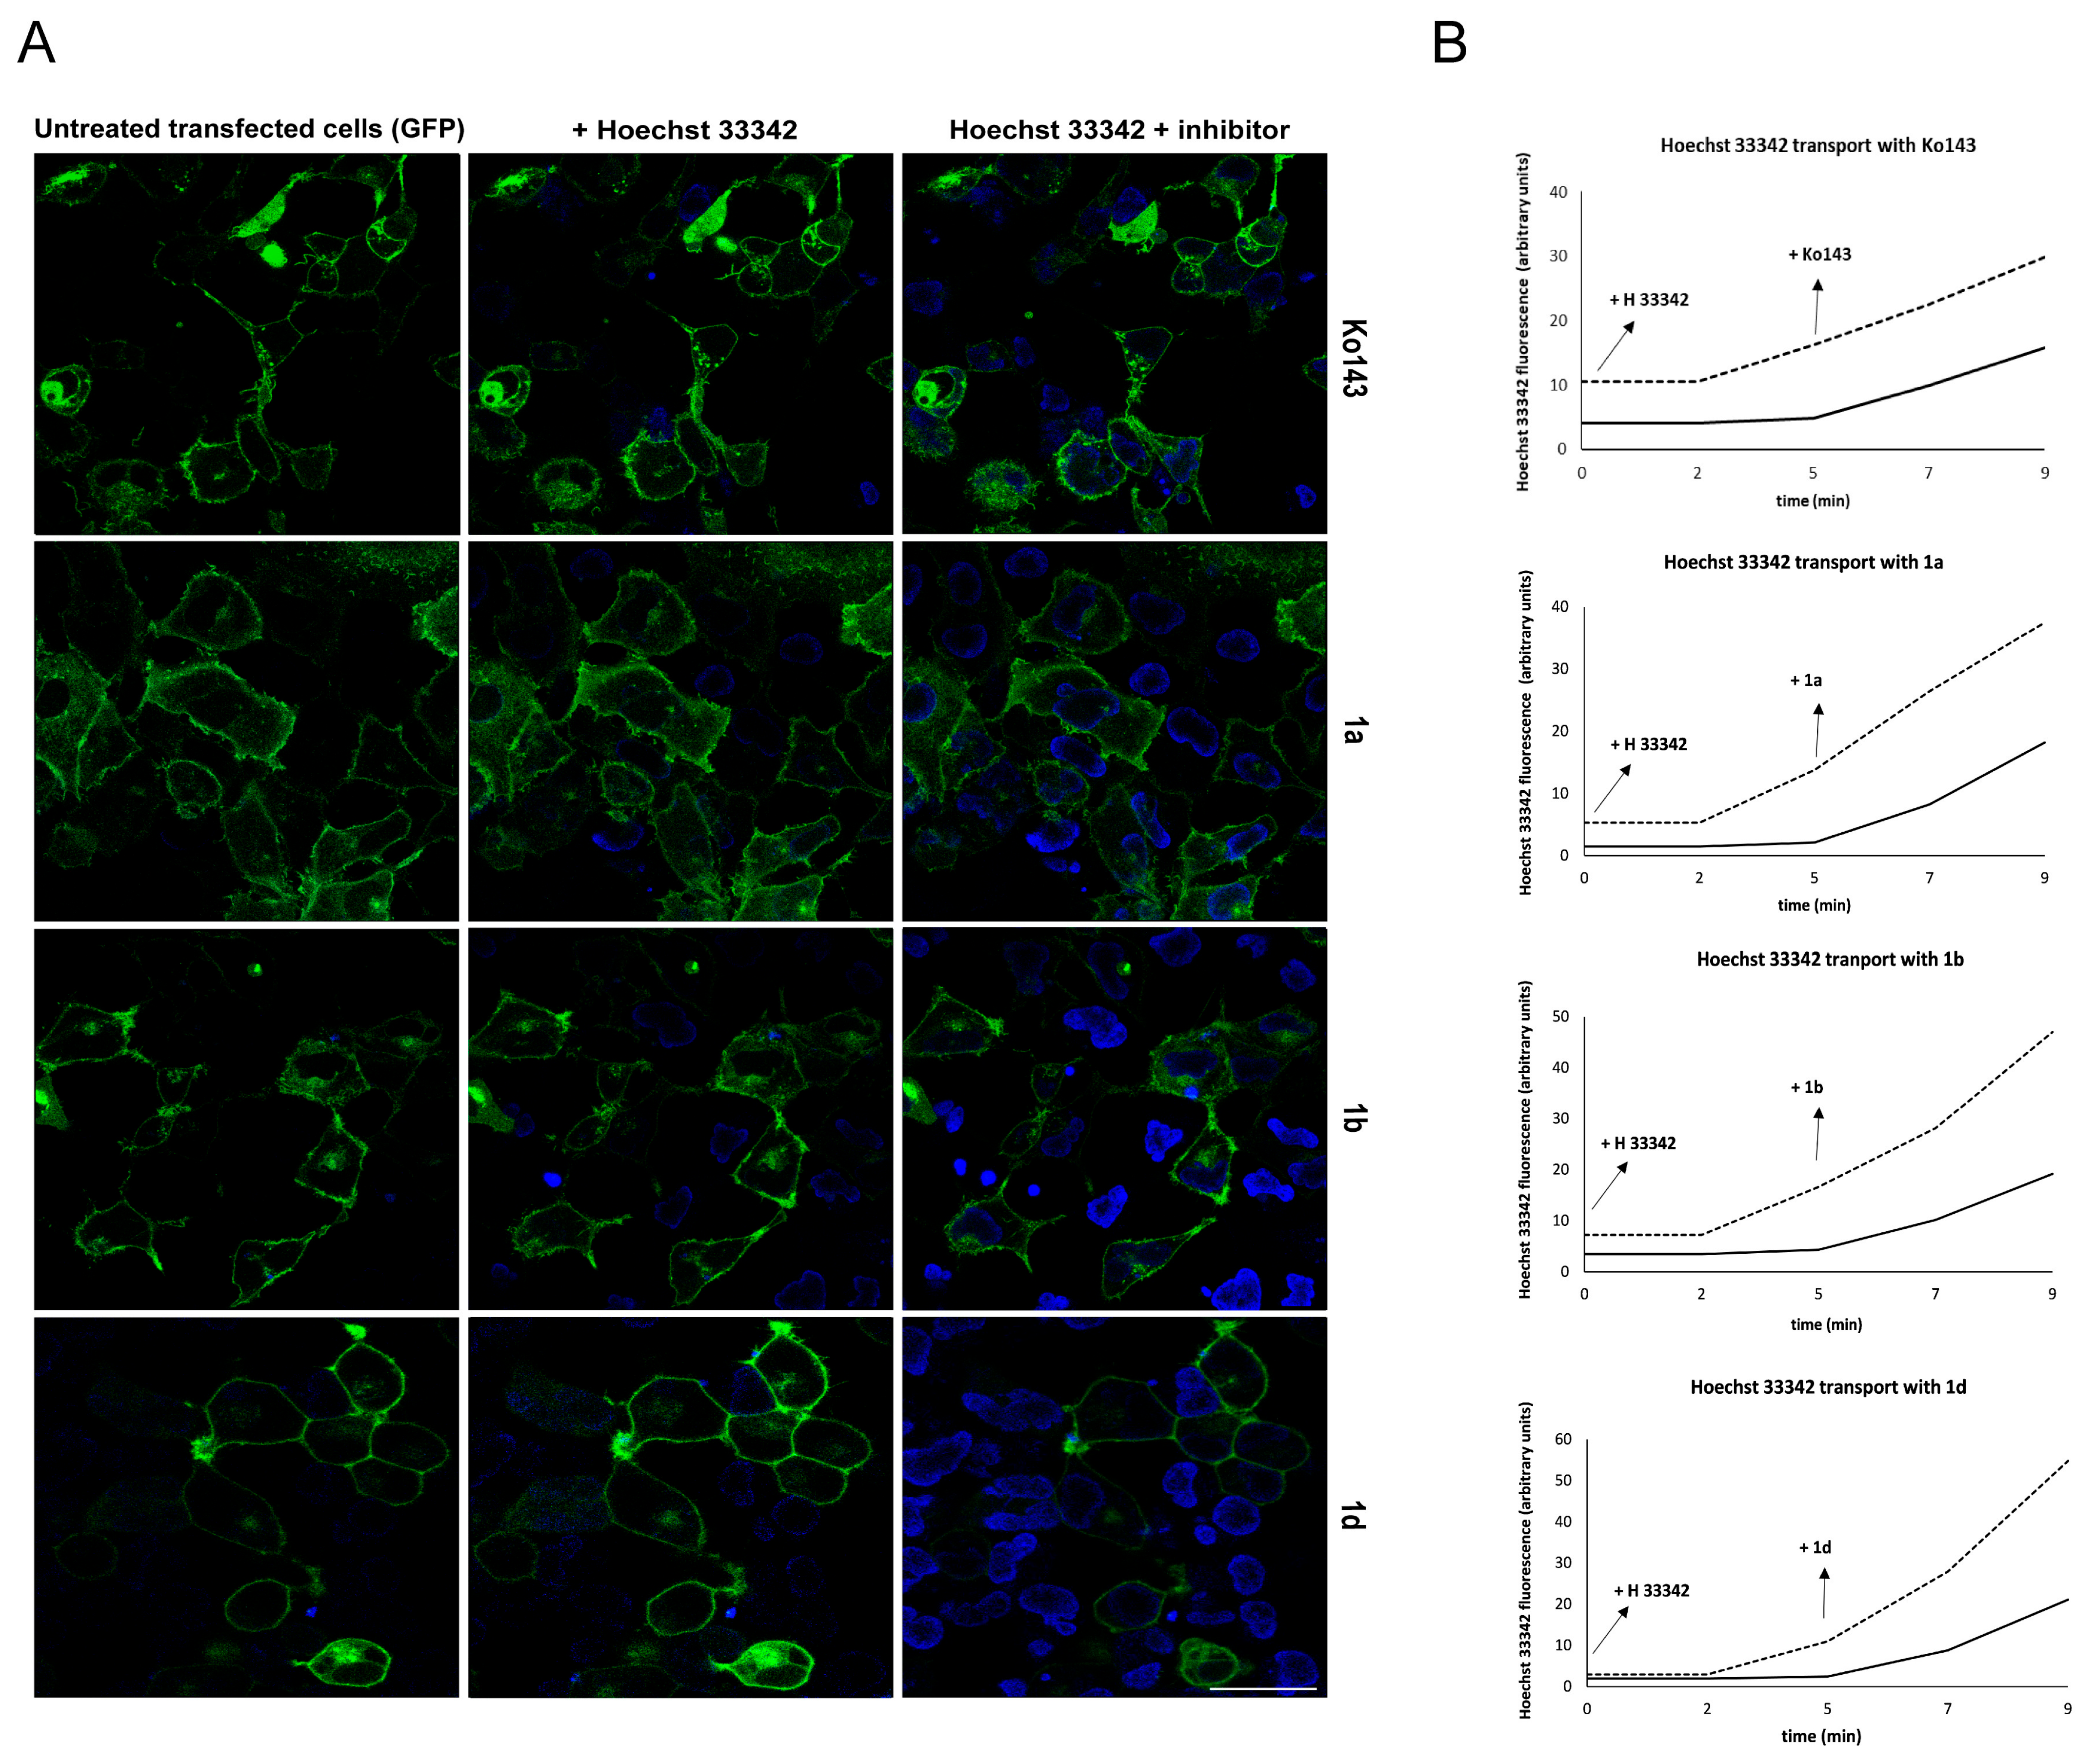
2.1.2. Primaquine Derivatives Inhibit Hoechst 33342 Efflux in Model Cell Lines
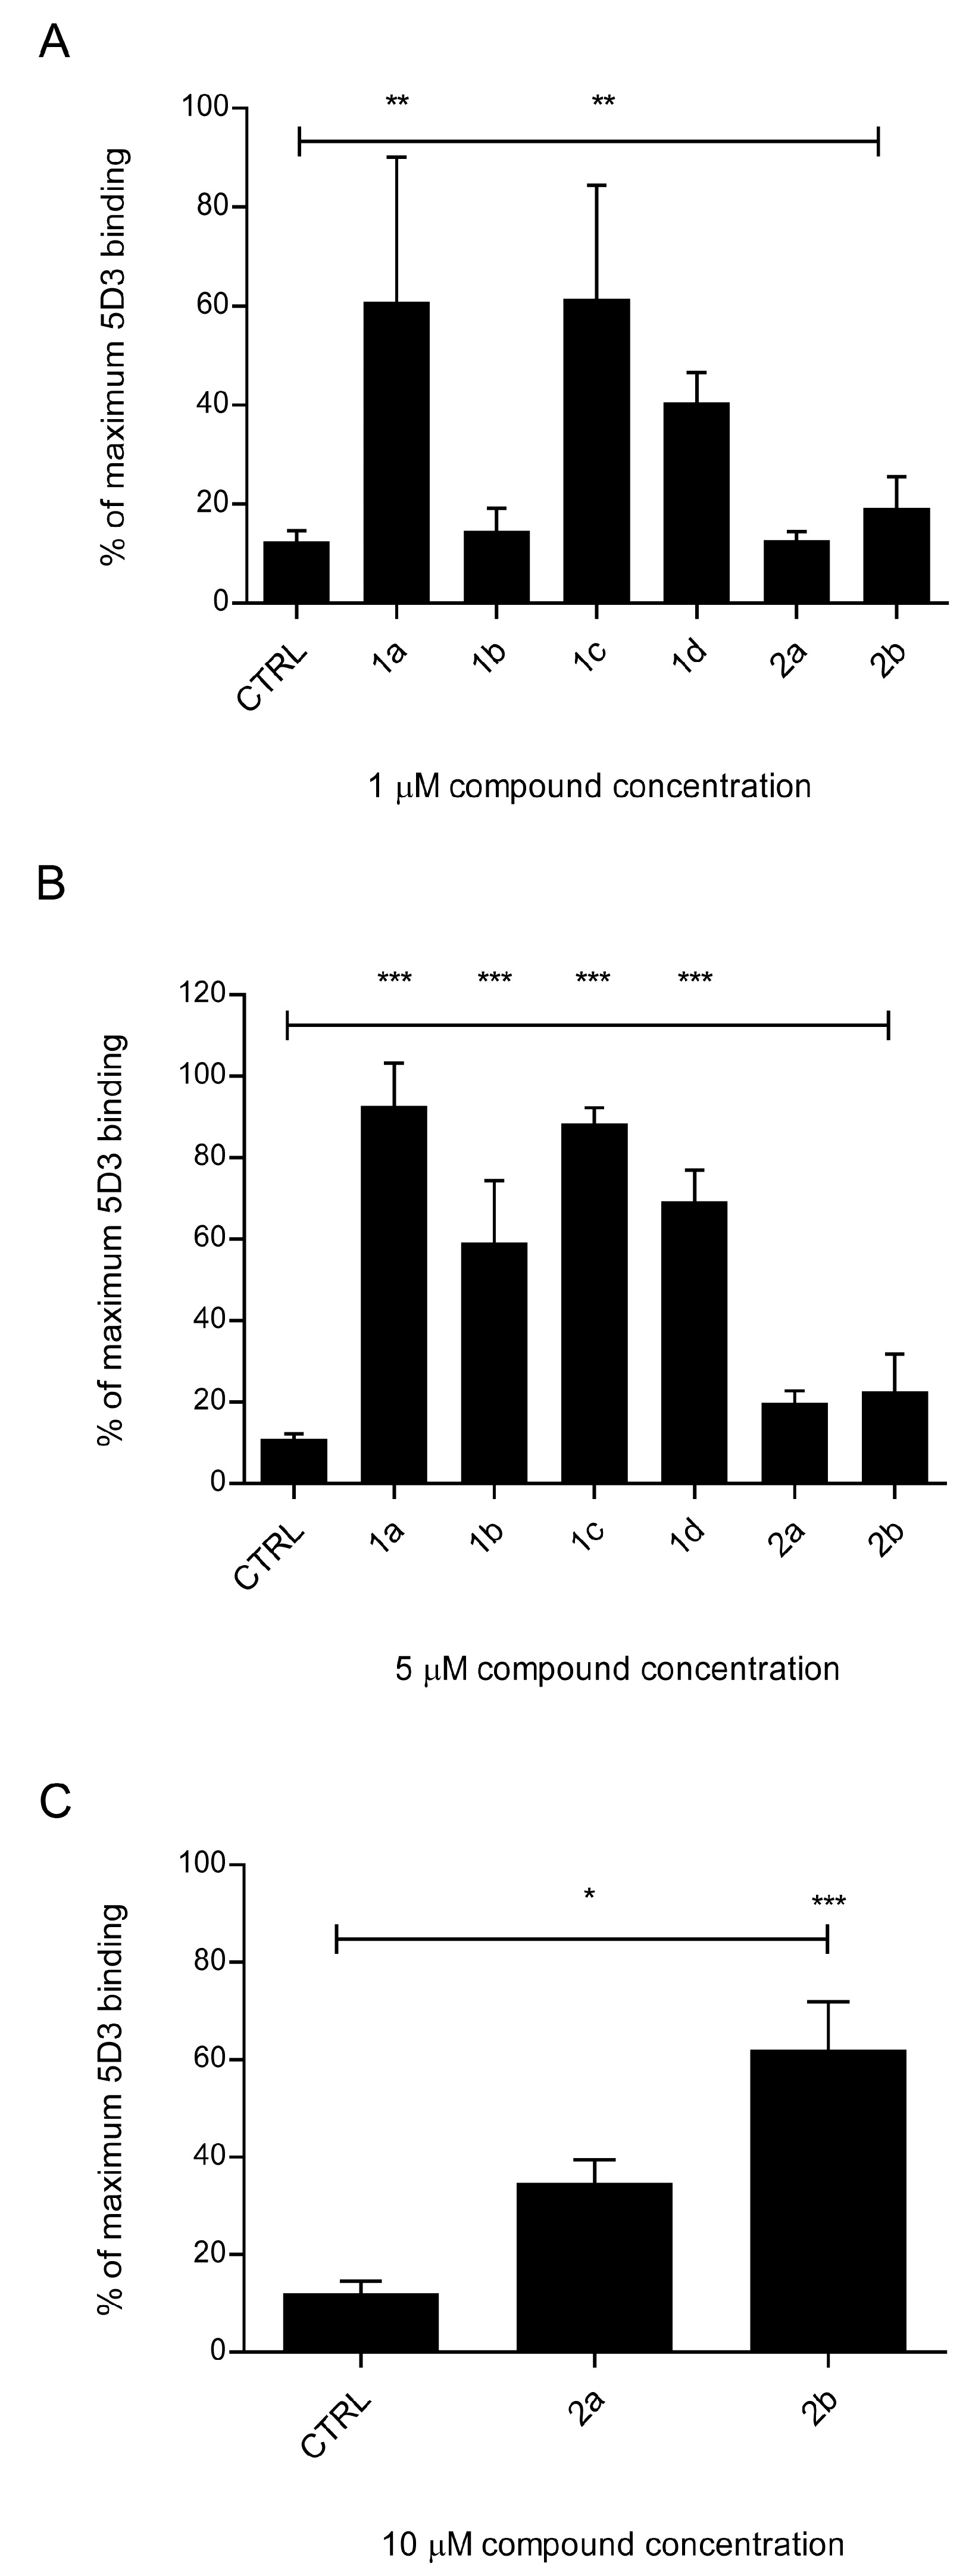
2.1.3. Primaquine Fumardiamides Show Best Inhibitory Potential
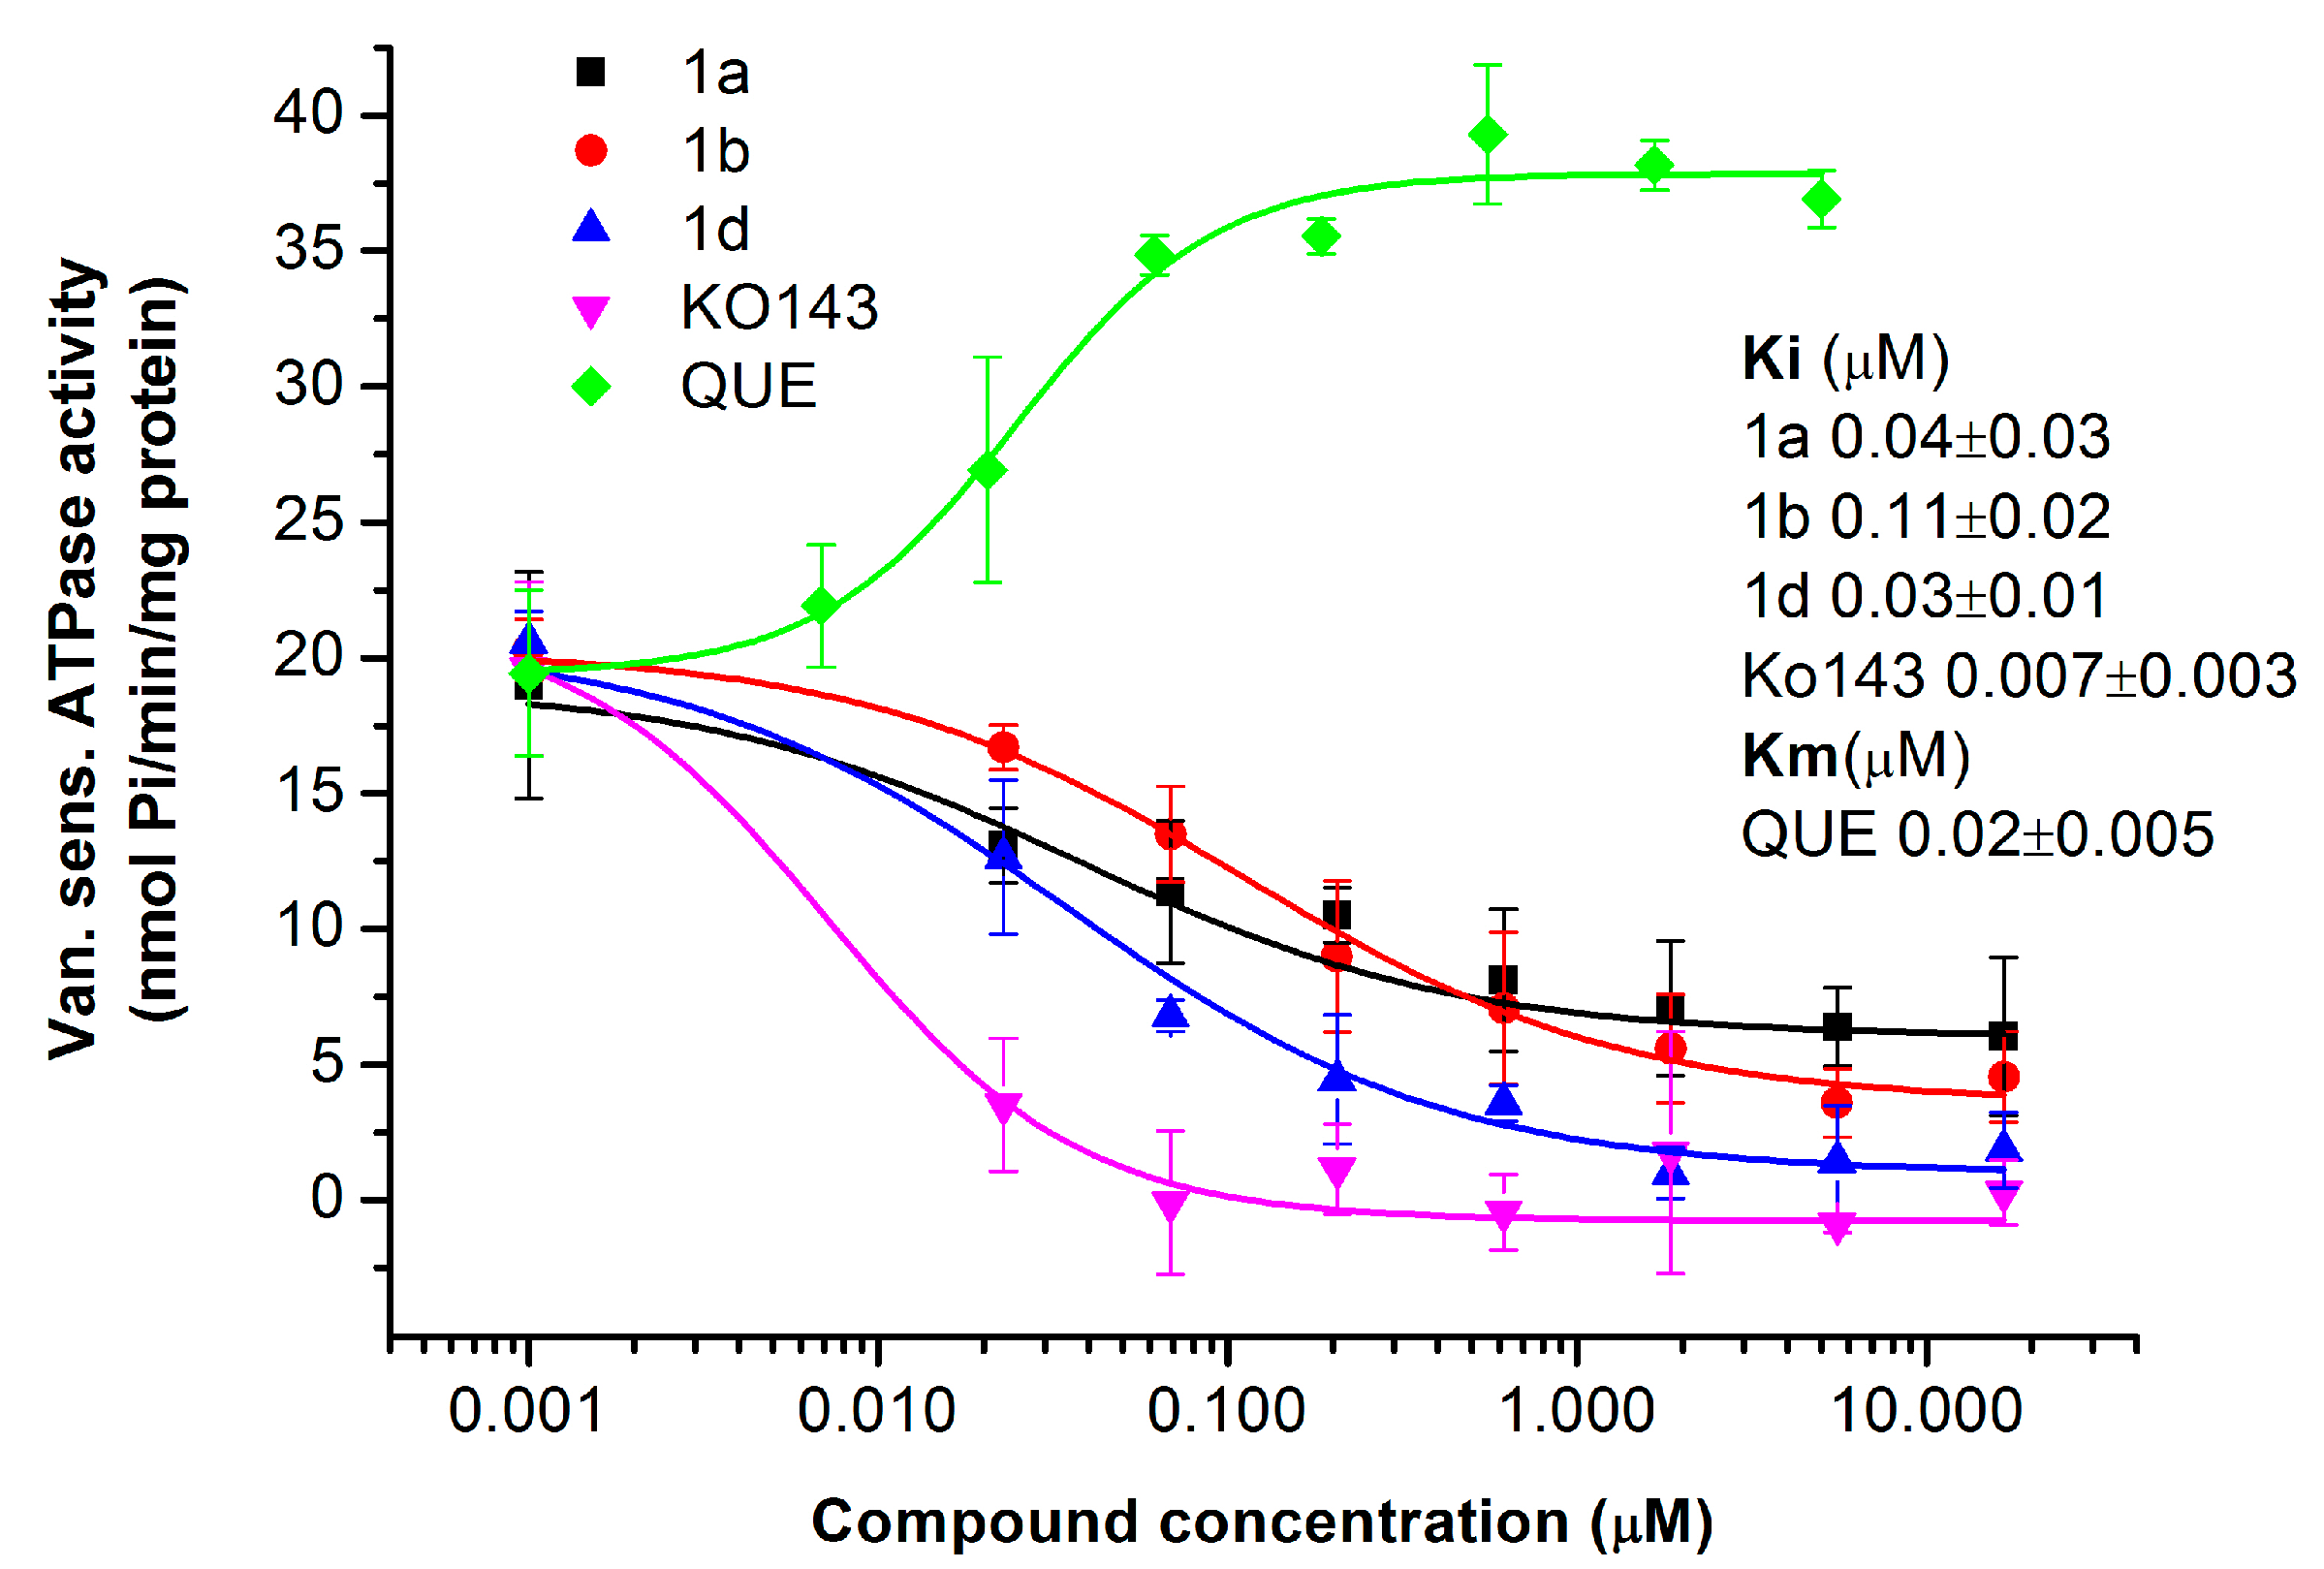
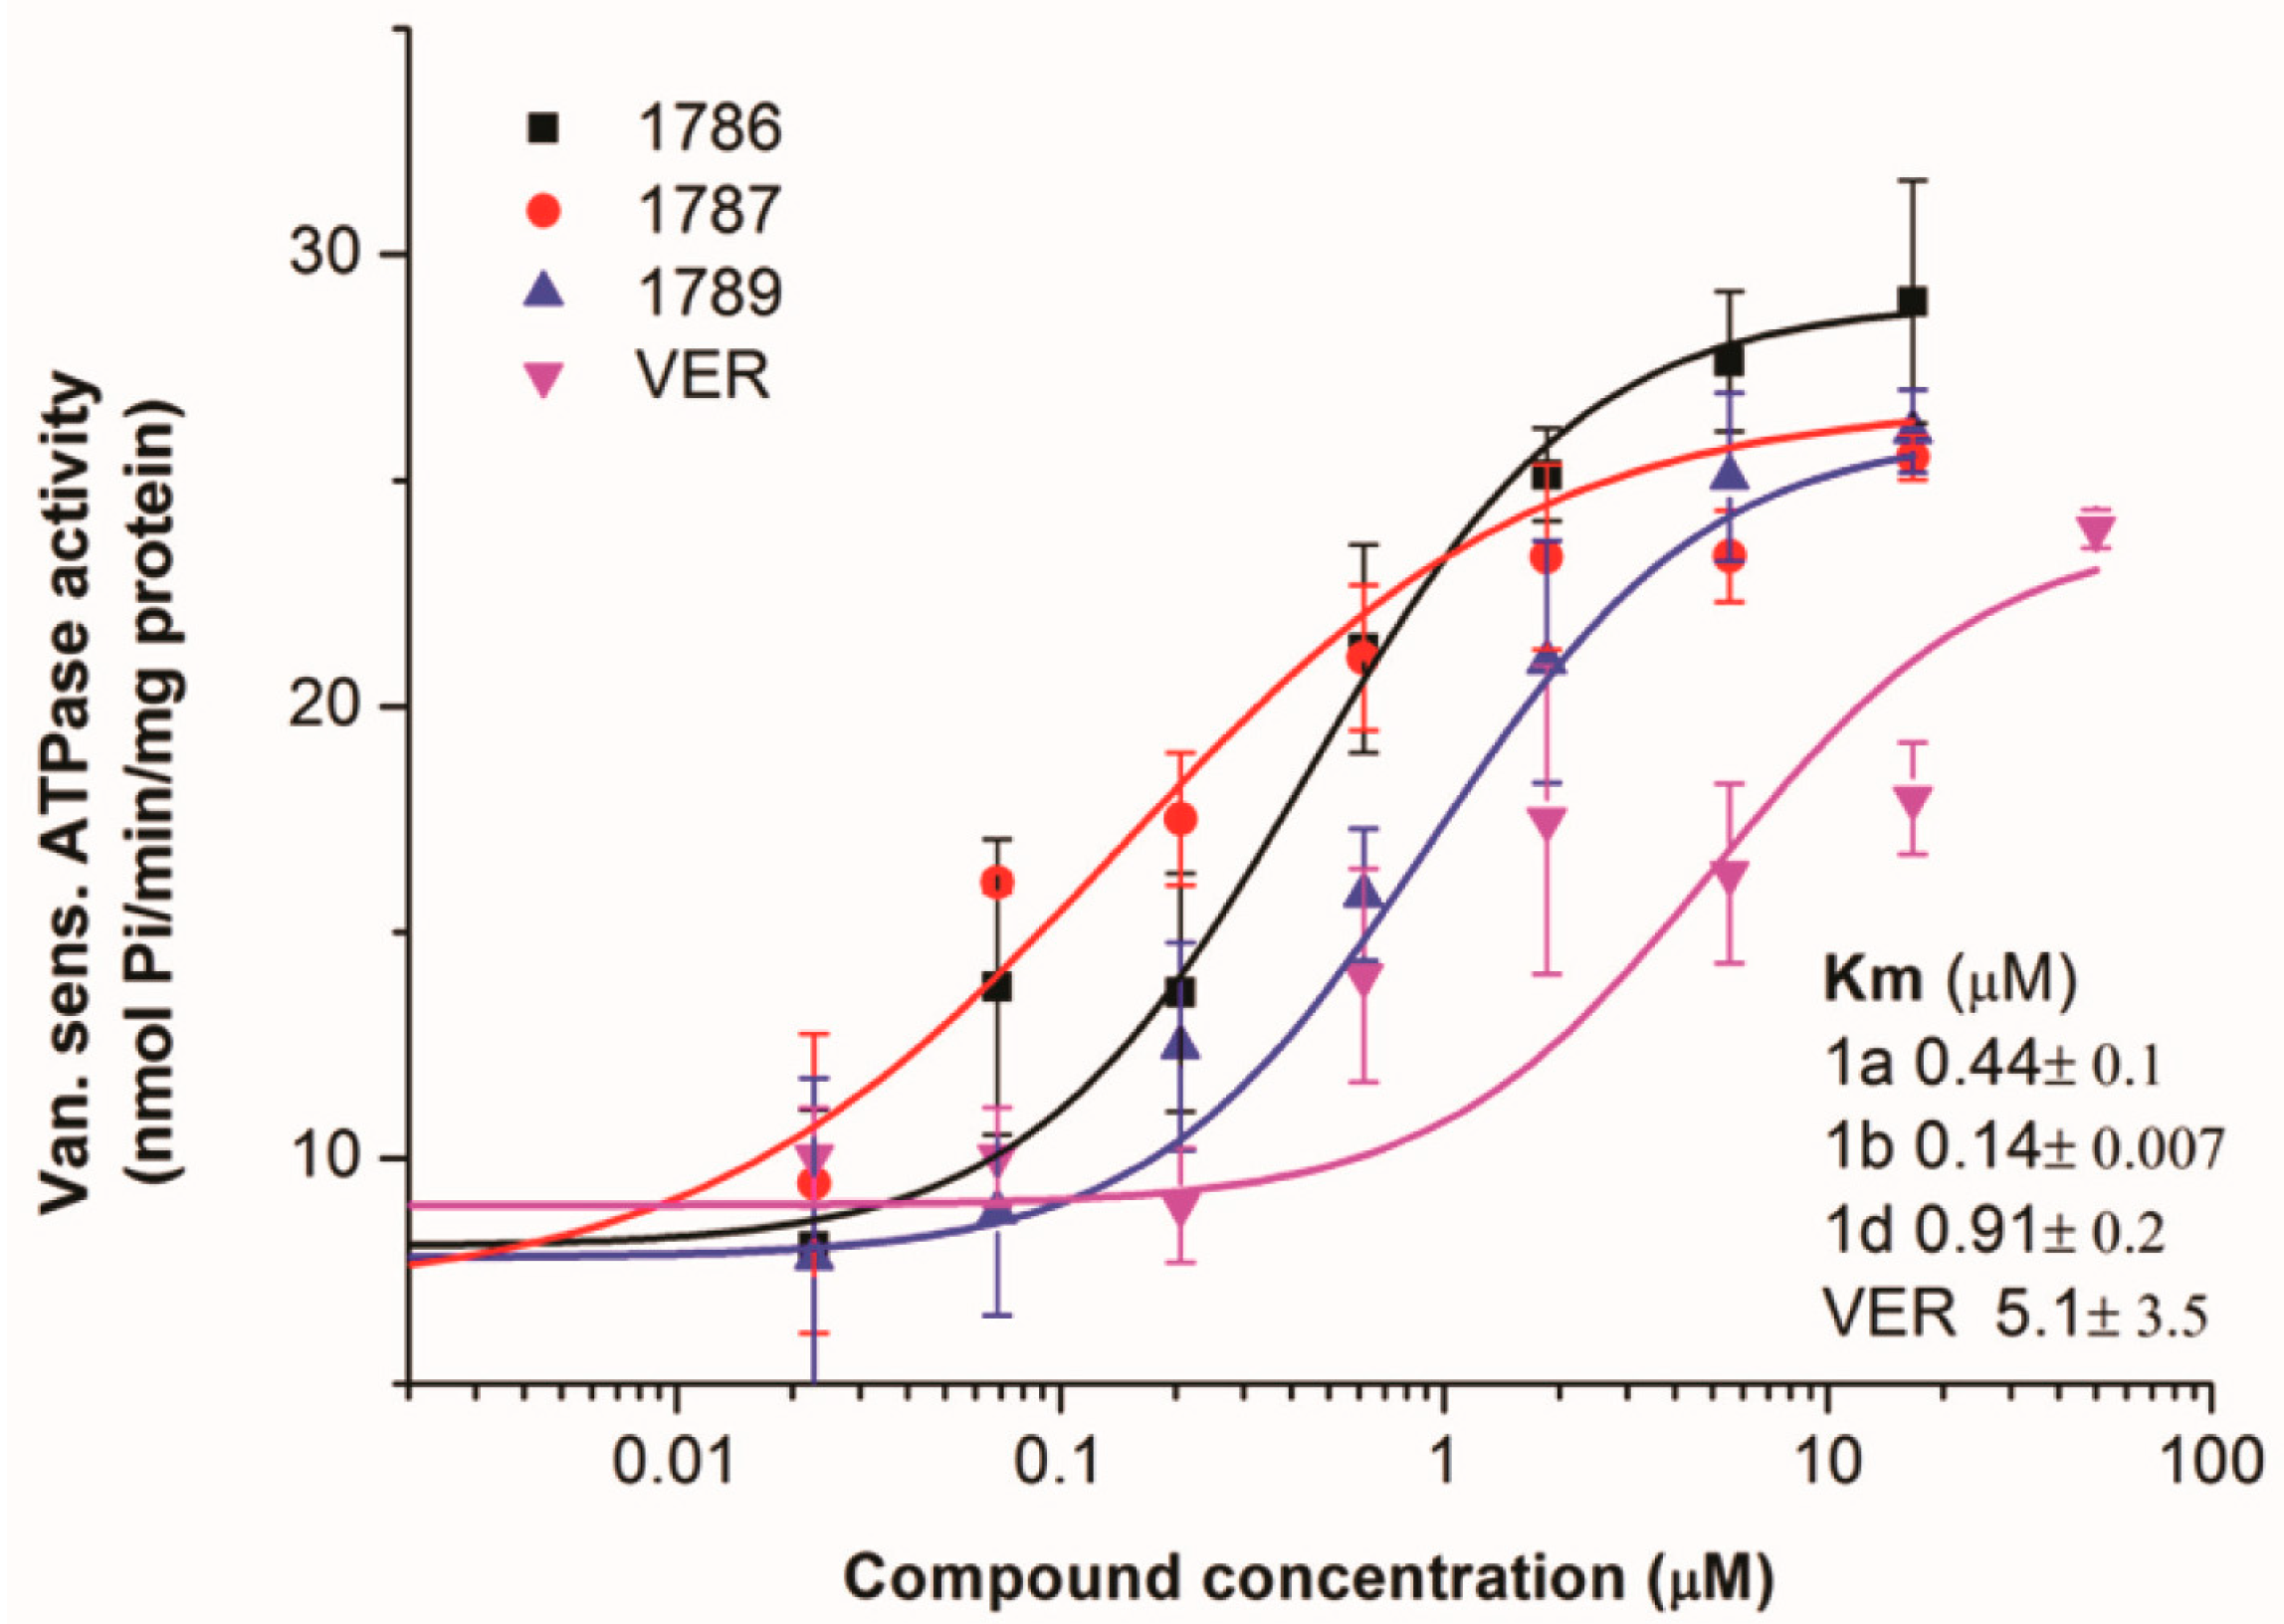
2.1.4. Primaquine Derivatives Inhibit the ATPase Activity of the ABCG2 Transporter
2.1.5. Drug-Resistant Model Cell Line Expressing ABCG2 Is Sensitized to the Chemotherapeutic Agent Mitoxantrone with the Primaquine Derivatives 1a, 1b, and 1d
2.1.6. Primaquine Derivatives Have No Effect on the Expression or Localization of the ABCG2 Transporter
2.2. Effect of Primaquine Derivatives on the Activity of the P-gp Transporter
2.2.1. The P-gp Transporter-Overexpressing Cell Line Is More Resistant to Primaquine Fumardiamides 1a, 1b, and 1d Compared to the Parental Cell Line
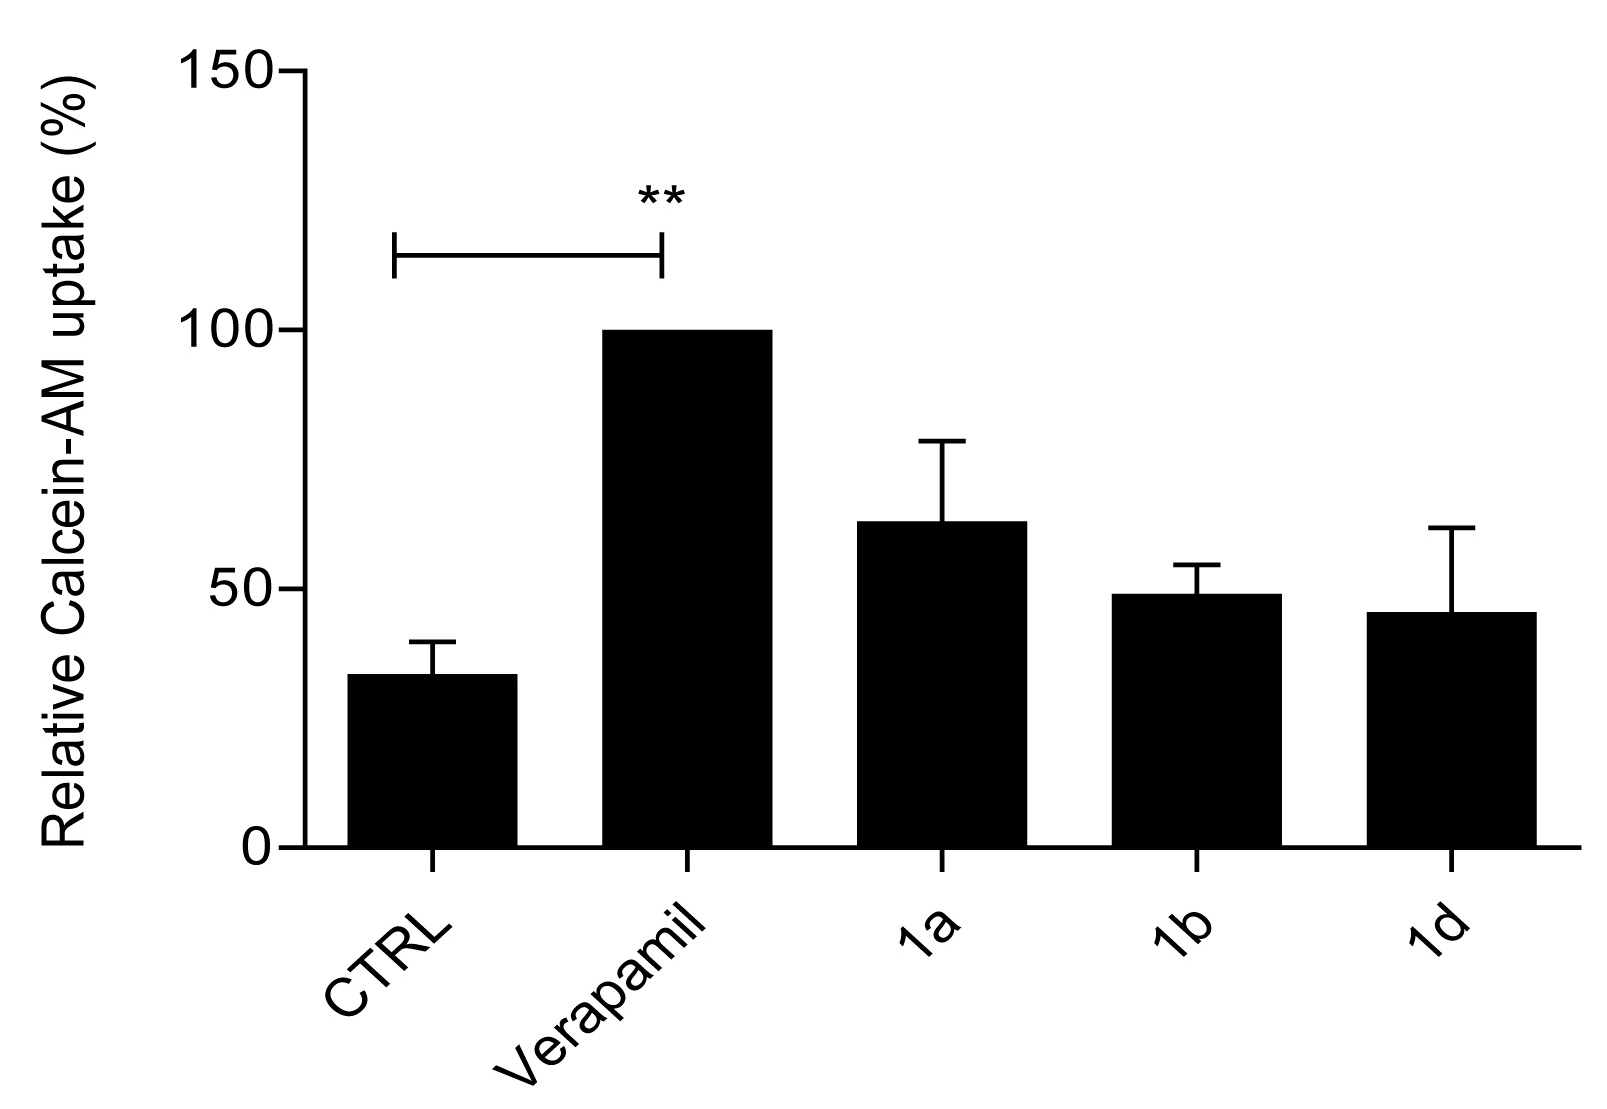
2.2.2. Primaquine Derivatives 1a, 1b, and 1d Have No Effect on Substrate Extrusion Mediated via the P-gp Transporter
2.2.3. The Primaquine Derivatives 1a, 1b, and 1d Stimulate the Activity of the P-gp Transporter
3. Discussion
4. Materials and Methods
4.1. Materials
4.2. Cell Lines
4.3. Cell Proliferation Assay
4.4. Calcein–AM Accumulation Assay
4.5. Hoechst 33342 Uptake Assay
4.6. Membrane Preparations
4.7. Protein Expression Analysis (Western Blot)
4.8. The 5D3 Antibody-Binding Shift Assay
4.9. ATPase Assay
4.10. Immunofluorescence
4.11. Real-Time Hoechst 33342 Uptake Study
4.12. Statistics
Author Contributions
Funding
Institutional Review Board Statement
Informed Consent Statement
Data Availability Statement
Acknowledgments
Conflicts of Interest
Abbreviations
| ABC | ATP-binding cassette |
| BCRP | breast cancer resistance protein |
| BSA | bovine serum albumin |
| CSCs | cancer stem cells |
| DMEM | Dulbecco’s Modified Eagle Medium |
| FBS | fetal bovine serum |
| MDR | multidrug resistance |
| MTT | 3-(4,5-dimethylthiazol-2-yl)-2,5-diphenyl-2H-tetrazolium bromide |
| MX | mitoxantrone |
| P-gp | P-glycoprotein |
| SDS-PAGE | sodium dodecyl sulfate polyacrylamide gel electrophoresis |
| pEGFP-G2 | vector containing the EGFP-tagged ABCG2 |
| VER | verapamil |
References
- Catalano, A.; Iacopetta, D.; Ceramella, J.; Scumaci, D.; Giuzio, F.; Saturnino, C.; Aquaro, S.; Rosano, C.; Sinicropi, M.S. Multidrug Resistance (MDR): A Widespread Phenomenon in Pharmacological Therapies. Molecules 2022, 27, 616. [Google Scholar] [CrossRef] [PubMed]
- Xiao, H.; Zheng, Y.; Ma, L.; Tian, L.; Sun, Q. Clinically-Relevant ABC Transporter for Anti-Cancer Drug Resistance. Front. Pharmacol. 2021, 12, 648407. [Google Scholar] [CrossRef] [PubMed]
- Amiri-Kordestani, L.; Basseville, A.; Kurdziel, K.; Fojo, A.T.; Bates, S.E. Targeting MDR in Breast and Lung Cancer: Discriminating Its Potential Importance from the Failure of Drug Resistance Reversal Studies. Drug Resist. Updat. 2012, 15, 50–61. [Google Scholar] [CrossRef]
- Sajid, A.; Rahman, H.; Ambudkar, S.V. Advances in the Structure, Mechanism and Targeting of Chemoresistance-Linked ABC Transporters. Nat. Rev. Cancer 2023, 23, 762–779. [Google Scholar] [CrossRef]
- Horsey, A.J.; Cox, M.H.; Sarwat, S.; Kerr, I.D. The Multidrug Transporter ABCG2: Still More Questions than Answers. Biochem. Soc. Trans. 2016, 44, 824. [Google Scholar] [CrossRef] [PubMed]
- Schulz, J.A.; Hartz, A.M.S.; Bauer, B. ABCB1 and ABCG2 Regulation at the Blood-Brain Barrier: Potential New Targets to Improve Brain Drug Delivery. Pharmacol. Rev. 2023, 75, 815–853. [Google Scholar] [CrossRef]
- Robey, R.W.; Pluchino, K.M.; Hall, M.D.; Fojo, A.T.; Bates, S.E.; Gottesman, M.M. Revisiting the Role of ABC Transporters in Multidrug-Resistant Cancer. Nat. Rev. Cancer 2018, 18, 452–464. [Google Scholar] [CrossRef]
- Doyle, L.A.; Ross, D.D. Multidrug Resistance Mediated by the Breast Cancer Resistance Protein BCRP (ABCG2). Oncogene 2003, 22, 7340–7358. [Google Scholar] [CrossRef]
- Loebinger, M.R.; Giangreco, A.; Groot, K.R.; Prichard, L.; Allen, K.; Simpson, C.; Bazley, L.; Navani, N.; Tibrewal, S.; Davies, D.; et al. Squamous Cell Cancers Contain a Side Population of Stem-like Cells That Are Made Chemosensitive by ABC Transporter Blockade. Br. J. Cancer 2008, 98, 380–387. [Google Scholar] [CrossRef]
- Passegué, E.; Jamieson, C.H.M.; Ailles, L.E.; Weissman, I.L. Normal and Leukemic Hematopoiesis: Are Leukemias a Stem Cell Disorder or a Reacquisition of Stem Cell Characteristics? Proc. Natl. Acad. Sci. USA 2003, 100, 11842–11849. [Google Scholar] [CrossRef]
- Hirschmann-Jax, C.; Foster, A.E.; Wulf, G.G.; Nuchtern, J.G.; Jax, T.W.; Gobel, U.; Goodell, M.A.; Brenner, M.K. A Distinct “Side Population” of Cells with High Drug Efflux Capacity in Human Tumor Cells. Proc. Natl. Acad. Sci. USA 2004, 101, 14228–14233. [Google Scholar] [CrossRef] [PubMed]
- Ding, X.W.; Wu, J.H.; Jiang, C.P. ABCG2: A Potential Marker of Stem Cells and Novel Target in Stem Cell and Cancer Therapy. Life Sci. 2010, 86, 631–637. [Google Scholar] [CrossRef]
- Bunting, K.D. ABC Transporters as Phenotypic Markers and Functional Regulators of Stem Cells. Stem Cells 2002, 20, 11–20. [Google Scholar] [CrossRef]
- Begicevic, R.R.; Falasca, M. ABC Transporters in Cancer Stem Cells: Beyond Chemoresistance. Int. J. Mol. Sci. 2017, 18, 2362. [Google Scholar] [CrossRef] [PubMed]
- Zhang, H.; Xu, H.; Ashby, C.R.; Assaraf, Y.G.; Chen, Z.S.; Liu, H.M. Chemical Molecular-Based Approach to Overcome Multidrug Resistance in Cancer by Targeting P-Glycoprotein (P-Gp). Med. Res. Rev. 2021, 41, 525–555. [Google Scholar] [CrossRef]
- Lei, L.; Ling, Z.-N.; Chen, X.-L.; Hong, L.-L.; Ling, Z.-Q. Characterization of the Golgi Scaffold Protein PAQR3, and Its Role in Tumor Suppression and Metabolic Pathway Compartmentalization. Cancer Manag. Res. 2020, 12, 353–362. [Google Scholar] [CrossRef]
- Peña-Solórzano, D.; Stark, S.A.; König, B.; Sierra, C.A.; Ochoa-Puentes, C. ABCG2/BCRP: Specific AndNonspecific Modulators. Med. Res. Rev. 2017, 37, 987–1050. [Google Scholar] [CrossRef]
- Wu, C.P.; Hsiao, S.H.; Huang, Y.H.; Hung, L.C.; Yu, Y.J.; Chang, Y.T.; Hung, T.H.; Wu, Y.S. Sitravatinib Sensitizes ABCB1-and ABCG2-Overexpressing Multidrug-Resistant Cancer Cells to Chemotherapeutic Drugs. Cancers 2020, 12, 195. [Google Scholar] [CrossRef] [PubMed]
- Marques, S.M.; Šupolíková, L.; Molčanová, L.; Šmejkal, K.; Bednar, D.; Slaninová, I. Screening of Natural Compounds as P-Glycoprotein Inhibitors against Multidrug Resistance. Biomedicines 2021, 9, 357. [Google Scholar] [CrossRef]
- Moinul, M.; Amin, S.A.; Jha, T.; Gayen, S. Updated Chemical Scaffolds of ABCG2 Inhibitors and Their Structure-Inhibition Relationships for Future Development. Eur. J. Med. Chem. 2022, 241, 114628. [Google Scholar] [CrossRef]
- Goebel, J.; Chmielewski, J.; Hrycyna, C.A. The Roles of the Human ATP-Binding Cassette Transporters P-Glycoprotein and ABCG2 in Multidrug Resistance in Cancer and at Endogenous Sites: Future Opportunities for Structure-Based Drug Design of Inhibitors. Cancer Drug Resist. 2021, 4, 784–804. [Google Scholar] [CrossRef]
- Zattoni, I.F.; Delabio, L.C.; Dutra, J.d.P.; Kita, D.H.; Scheiffer, G.; Hembecker, M.; Pereira, G.d.S.; Moure, V.R.; Valdameri, G. Targeting Breast Cancer Resistance Protein (BCRP/ABCG2): Functional Inhibitors and Expression Modulators. Eur. J. Med. Chem. 2022, 237, 114346. [Google Scholar] [CrossRef] [PubMed]
- Ma, Z.; Woon, C.Y.N.; Liu, C.G.; Cheng, J.T.; You, M.; Sethi, G.; Wong, A.L.A.; Ho, P.C.L.; Zhang, D.; Ong, P.; et al. Repurposing Artemisinin and Its Derivatives as Anticancer Drugs: A Chance or Challenge? Front. Pharmacol. 2021, 12, 828856. [Google Scholar] [CrossRef] [PubMed]
- Verbaanderd, C.; Maes, H.; Schaaf, M.B.; Sukhatme, V.P.; Pantziarka, P.; Sukhatme, V.; Agostinis, P.; Bouche, G. Repurposing Drugs in Oncology (ReDO)—Chloroquine and Hydroxychloroquine as Anti-Cancer Agents. Ecancermedicalscience 2017, 11, 781. [Google Scholar] [CrossRef]
- Wong, Y.K.; He, Y.; Wang, J.; Xu, C.; Kalesh, K.A.; Shen, H.; Lin, Q.; Wong, W.S.F. Artemisinin as an Anticancer Drug: Recent Advances in Target Profiling and Mechanisms of Action. Med. Res. Rev. 2017, 37, 1492–1517. [Google Scholar] [CrossRef]
- Duarte, D.; Vale, N. New Trends for Antimalarial Drugs: Synergism between Antineoplastics and Antimalarials on Breast Cancer Cells. Biomolecules 2020, 10, 1623. [Google Scholar] [CrossRef]
- Peter, S.; Jama, S.; Alven, S.; Aderibigbe, B.A. Artemisinin and Derivatives-Based Hybrid Compounds: Promising Therapeutics for the Treatment of Cancer and Malaria. Molecules 2021, 26, 7521. [Google Scholar] [CrossRef]
- Zhou, W.; Wang, H.; Yang, Y.; Chen, Z.S.; Zou, C.; Zhang, J. Chloroquine against Malaria, Cancers and Viral Diseases. Drug Discov. Today 2020, 25, 2012–2022. [Google Scholar] [CrossRef] [PubMed]
- Liu, L.; Fu Zuo, L.; Wen Guo, J. Reversal of Multidrug Resistance by the Anti-Malaria Drug Artesunate in the Esophageal Cancer Eca109/ABCG2 Cell Line. Oncol. Lett. 2013, 6, 1475–1481. [Google Scholar] [CrossRef]
- Rijpma, S.R.; Van Den Heuvel, J.J.M.W.; Van Der Velden, M.; Sauerwein, R.W.; Russel, F.G.M.; Koenderink, J.B. Atovaquone and Quinine Anti-Malarials Inhibit ATP Binding Cassette Transporter Activity. Malar. J. 2014, 13, 1–8. [Google Scholar] [CrossRef]
- Kim, J.H.; Choi, A.R.; Kim, Y.K.; Yoon, S. Co-Treatment with the Anti-Malarial Drugs Mefloquine and Primaquine Highly Sensitizes Drug-Resistant Cancer Cells by Increasing P-Gp Inhibition. Biochem. Biophys. Res. Commun. 2013, 441, 655–660. [Google Scholar] [CrossRef] [PubMed]
- Zorc, B.; Perković, I.; Pavić, K.; Rajić, Z.; Beus, M. Primaquine Derivatives: Modifications of the Terminal Amino Group. Eur. J. Med. Chem. 2019, 182, 111640. [Google Scholar] [CrossRef] [PubMed]
- Choi, A.R.; Kim, J.H.; Woo, Y.H.; Kim, H.S.; Yoon, S. Anti-Malarial Drugs Primaquine and Chloroquine Have Different Sensitization Effects with Anti-Mitotic Drugs in Resistant Cancer Cells. Anticancer Res. 2016, 36, 1641–1648. [Google Scholar] [CrossRef]
- Rajić, Z.; Beus, M.; Michnová, H.; Vlainić, J.; Persoons, L.; Kosalec, I.; Jampílek, J.; Schols, D.; Keser, T.; Zorc, B. Asymmetric Primaquine and Halogenaniline Fumardiamides as Novel Biologically Active Michael Acceptors. Molecules 2018, 23, 1724. [Google Scholar] [CrossRef]
- Perković, I.; Antunović, M.; Marijanović, I.; Pavić, K.; Ester, K.; Kralj, M.; Vlainić, J.; Kosalec, I.; Schols, D.; Hadjipavlou-Litina, D.; et al. Novel Urea and Bis-Urea Primaquine Derivatives with Hydroxyphenyl or Halogenphenyl Substituents: Synthesis and Biological Evaluation. Eur. J. Med. Chem. 2016, 124, 622–636. [Google Scholar] [CrossRef] [PubMed]
- Orbán, T.I.; Seres, L.; Özvegy-Laczka, C.; Elkind, N.B.; Sarkadi, B.; Homolya, L. Combined Localization and Real-Time Functional Studies Using a GFP-Tagged ABCG2 Multidrug Transporter. Biochem. Biophys. Res. Commun. 2008, 367, 667–673. [Google Scholar] [CrossRef]
- Ujhelly, O.; Özvegy, C.; Várady, G.; Cervenak, J.; Homolya, L.; Grez, M.; Scheffer, G.; Roos, D.; Bates, S.E.; Váradi, A.; et al. Application of a Human Multidrug Transporter (ABCG2) Variant as Selectable Marker in Gene Transfer to Progenitor Cells. Hum. Gene Ther. 2003, 14, 403–412. [Google Scholar] [CrossRef]
- Özvegy-Laczka, C.; Várady, G.; Köblös, G.; Ujhelly, O.; Cervenak, J.; Schuetz, J.D.; Sorrentino, B.P.; Koomen, G.J.; Váradi, A.; Német, K.; et al. Function-Dependent Conformational Changes of the ABCG2 Multidrug Transporter Modify Its Interaction with a Monoclonal Antibody on the Cell Surface. J. Biol. Chem. 2005, 280, 4219–4227. [Google Scholar] [CrossRef]
- Telbisz, Á.; Hegedüs, C.; Özvegy-Laczka, C.; Goda, K.; Várady, G.; Takáts, Z.; Szabó, E.; Sorrentino, B.P.; Váradi, A.; Sarkadi, B. Antibody Binding Shift Assay for Rapid Screening of Drug Interactions with the Human ABCG2 Multidrug Transporter. Eur. J. Pharm. Sci. 2012, 45, 101–109. [Google Scholar] [CrossRef]
- Telbisz, Á.; Müller, M.; Özvegy-Laczka, C.; Homolya, L.; Szente, L.; Váradi, A.; Sarkadi, B. Membrane Cholesterol Selectively Modulates the Activity of the Human ABCG2 Multidrug Transporter. Biochim. Biophys. Acta-Biomembr. 2007, 1768, 2698–2713. [Google Scholar] [CrossRef]
- Orlando, B.J.; Liao, M. ABCG2 Transports Anticancer Drugs via a Closed-to-Open Switch. Nat. Commun. 2020, 11, 1–11. [Google Scholar] [CrossRef]
- Ledwitch, K.V.; Gibbs, M.E.; Barnes, R.W.; Roberts, A.G. Cooperativity between Verapamil and ATP Bound to the Efflux Transporter P-Glycoprotein. Biochem. Pharmacol. 2016, 118, 96–108. [Google Scholar] [CrossRef] [PubMed]
- Shukla, S.; Wu, C.P.; Ambudkar, S.V. Development of Inhibitors of ATP-Binding Cassette Drug Transporters–Present Status and Challenges. Expert Opin. Drug Metab. Toxicol. 2008, 4, 205–223. [Google Scholar] [CrossRef] [PubMed]
- Noguchi, K.; Katayama, K.; Sugimoto, Y. Human ABC Transporter ABCG2/BCRP Expression in Chemoresistance: Basic and Clinical Perspectives for Molecular Cancer Therapeutics. Pharmgenomics. Pers. Med. 2014, 7, 53–64. [Google Scholar] [CrossRef]
- Zhang, I.; Beus, M.; Stochaj, U.; Le, P.U.; Zorc, B.; Rajić, Z.; Petrecca, K.; Maysinger, D. Inhibition of Glioblastoma Cell Proliferation, Invasion, and Mechanism of Action of a Novel Hydroxamic Acid Hybrid Molecule. Cell Death Discov. 2018, 4, 41. [Google Scholar] [CrossRef]
- Ahmed-Belkacem, A.; Pozza, A.; Muñoz-Martínez, F.; Bates, S.E.; Castanys, S.; Gamarro, F.; Pietro, A.D.; Pérez-Victoria, J.M. Flavonoid Structure-Activity Studies Identify 6-Prenylchrysin and Tectochrysin as Potent and Specific Inhibitors of Breast Cancer Resistance Protein ABCG2. Cancer Res. 2005, 65, 4852–4860. [Google Scholar] [CrossRef]
- Valdameri, G.; Pereira Rangel, L.; Spatafora, C.; Guitton, J.; Gauthier, C.; Arnaud, O.; Ferreira-Pereira, A.; Falson, P.; Winnischofer, S.M.B.; Rocha, M.E.M.; et al. Methoxy Stilbenes as Potent, Specific, Untransported, and Noncytotoxic Inhibitors of Breast Cancer Resistance Protein. ACS Chem. Biol. 2012, 7, 322–330. [Google Scholar] [CrossRef]
- Jackson, S.M.; Manolaridis, I.; Kowal, J.; Zechner, M.; Taylor, N.M.I.; Bause, M.; Bauer, S.; Bartholomaeus, R.; Bernhardt, G.; Koenig, B.; et al. Structural Basis of Small-Molecule Inhibition of Human Multidrug Transporter ABCG2. Nat. Struct. Mol. Biol. 2018, 25, 333–340. [Google Scholar] [CrossRef]
- Mioč, M.; Telbisz, Á.; Radman, K.; Bertoša, B.; Šumanovac, T.; Sarkadi, B.; Kralj, M. Interaction of Crown Ethers with the ABCG2 Transporter and Their Implication for Multidrug Resistance Reversal. Histochem. Cell Biol. 2022, 158, 261–277. [Google Scholar] [CrossRef]
- Guberović, I.; Marjanović, M.; Mioč, M.; Ester, K.; Martin-Kleiner, I.; Šumanovac Ramljak, T.; Mlinarić-Majerski, K.; Kralj, M. Crown Ethers Reverse P-Glycoprotein-Mediated Multidrug Resistance in Cancer Cells. Sci. Rep. 2018, 8, 14467. [Google Scholar] [CrossRef]


| Compd. | Structure | IC50 (µM) | |
|---|---|---|---|
| PLB-985 | PLB/ABCG2 | ||
| 1a |  | 37.7 ± 0.7 | 68.6 ± 9.8 |
| 1b |  | ≥100 | ≥100 |
| 1c | 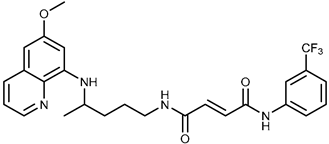 | 47.7 ± 14.9 | ≥100 |
| 1d | 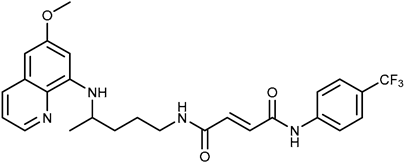 | ≥100 | ≥100 |
| 2a | 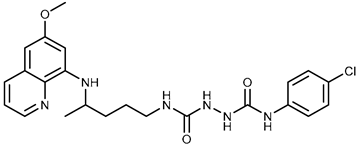 | 43.8 ± 5.3 | ≥100 |
| 2b | 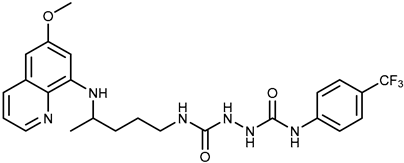 | 9.37 ± 1.09 | 12.1 ± 6.1 |
| Compd. | IC50 (μM) | |
|---|---|---|
| PLB-985 | PLB/ABCG2 | |
| Mitoxantrone (MX) | 0.003 ± 0.0001 | 0.12 ± 0.0002 |
| MX + Ko143 (1 µM) | 0.003 ± 0.0008 | 0.01 ± 0.004 |
| MX + 1a (0.5 µM) | 0.0021 ± 0.0015 | 0.01 ± 0.005 |
| MX + 1b (0.5 µM) | 0.003 ± 0.0007 | 0.02 ± 0.009 |
| MX + 1d (0.5 µM) | 0.0028 ± 0.001 | 0.01 ± 0.006 |
| Compd. | IC50 (μM) | |
|---|---|---|
| A2780 | A2780/Adr | |
| 1a | 6.7 ± 0.4 | 14 ± 0.5 |
| 1b | ≥100 | ≥100 |
| 1d | 50 ± 0.2 | ≥100 |
Disclaimer/Publisher’s Note: The statements, opinions and data contained in all publications are solely those of the individual author(s) and contributor(s) and not of MDPI and/or the editor(s). MDPI and/or the editor(s) disclaim responsibility for any injury to people or property resulting from any ideas, methods, instructions or products referred to in the content. |
© 2025 by the authors. Licensee MDPI, Basel, Switzerland. This article is an open access article distributed under the terms and conditions of the Creative Commons Attribution (CC BY) license (https://creativecommons.org/licenses/by/4.0/).
Share and Cite
Mioč, M.; Beus, M.; Carević, K.; Rajić, Z.; Sarkadi, B.; Telbisz, Á.; Kralj, M. Selective Inhibition of the ABCG2 Transporter by Primaquine Derivatives Reverses the Multidrug Resistance of Tumor Cells. Int. J. Mol. Sci. 2025, 26, 5367. https://doi.org/10.3390/ijms26115367
Mioč M, Beus M, Carević K, Rajić Z, Sarkadi B, Telbisz Á, Kralj M. Selective Inhibition of the ABCG2 Transporter by Primaquine Derivatives Reverses the Multidrug Resistance of Tumor Cells. International Journal of Molecular Sciences. 2025; 26(11):5367. https://doi.org/10.3390/ijms26115367
Chicago/Turabian StyleMioč, Marija, Maja Beus, Karla Carević, Zrinka Rajić, Balázs Sarkadi, Ágnes Telbisz, and Marijeta Kralj. 2025. "Selective Inhibition of the ABCG2 Transporter by Primaquine Derivatives Reverses the Multidrug Resistance of Tumor Cells" International Journal of Molecular Sciences 26, no. 11: 5367. https://doi.org/10.3390/ijms26115367
APA StyleMioč, M., Beus, M., Carević, K., Rajić, Z., Sarkadi, B., Telbisz, Á., & Kralj, M. (2025). Selective Inhibition of the ABCG2 Transporter by Primaquine Derivatives Reverses the Multidrug Resistance of Tumor Cells. International Journal of Molecular Sciences, 26(11), 5367. https://doi.org/10.3390/ijms26115367