
The Application of 1H Nuclear Magnetic Resonance (NMR), Gas Chromatography (GC) and Ultraviolet–Visible (UV-Vis) Spectroscopy Techniques to the Analysis of the Fatty Acid Profile as Quality of Argan Oil


 ,
,  , and
, and 
Abstract
1. Introduction
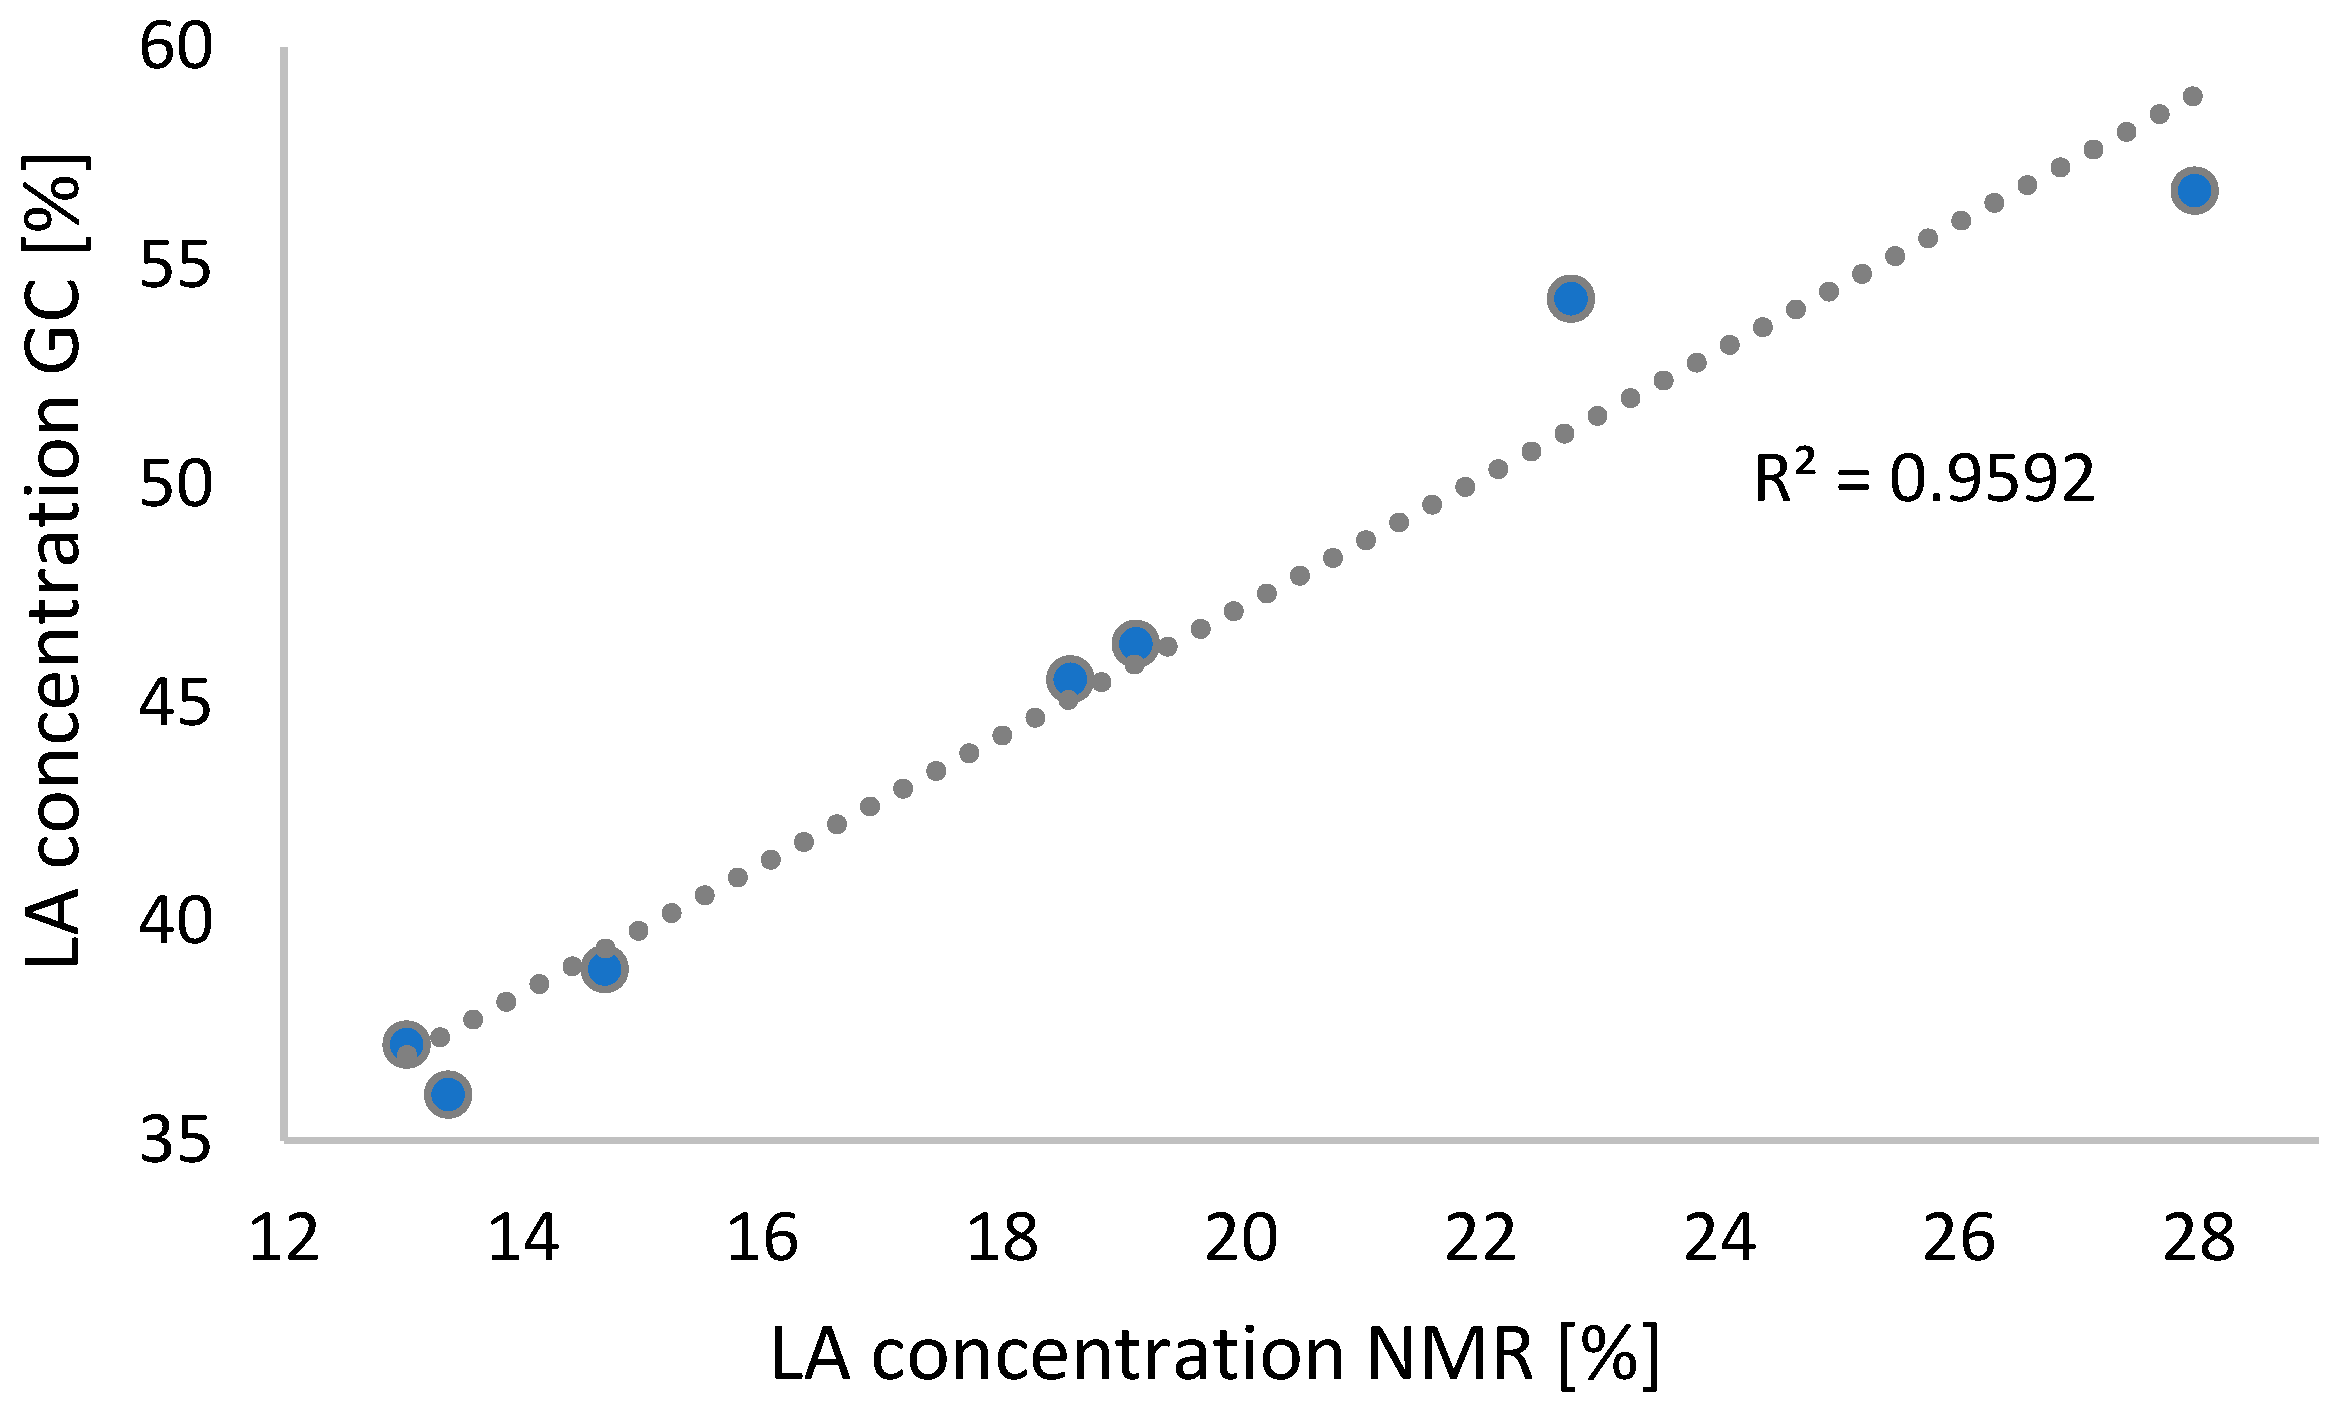
2. Results and Discussion
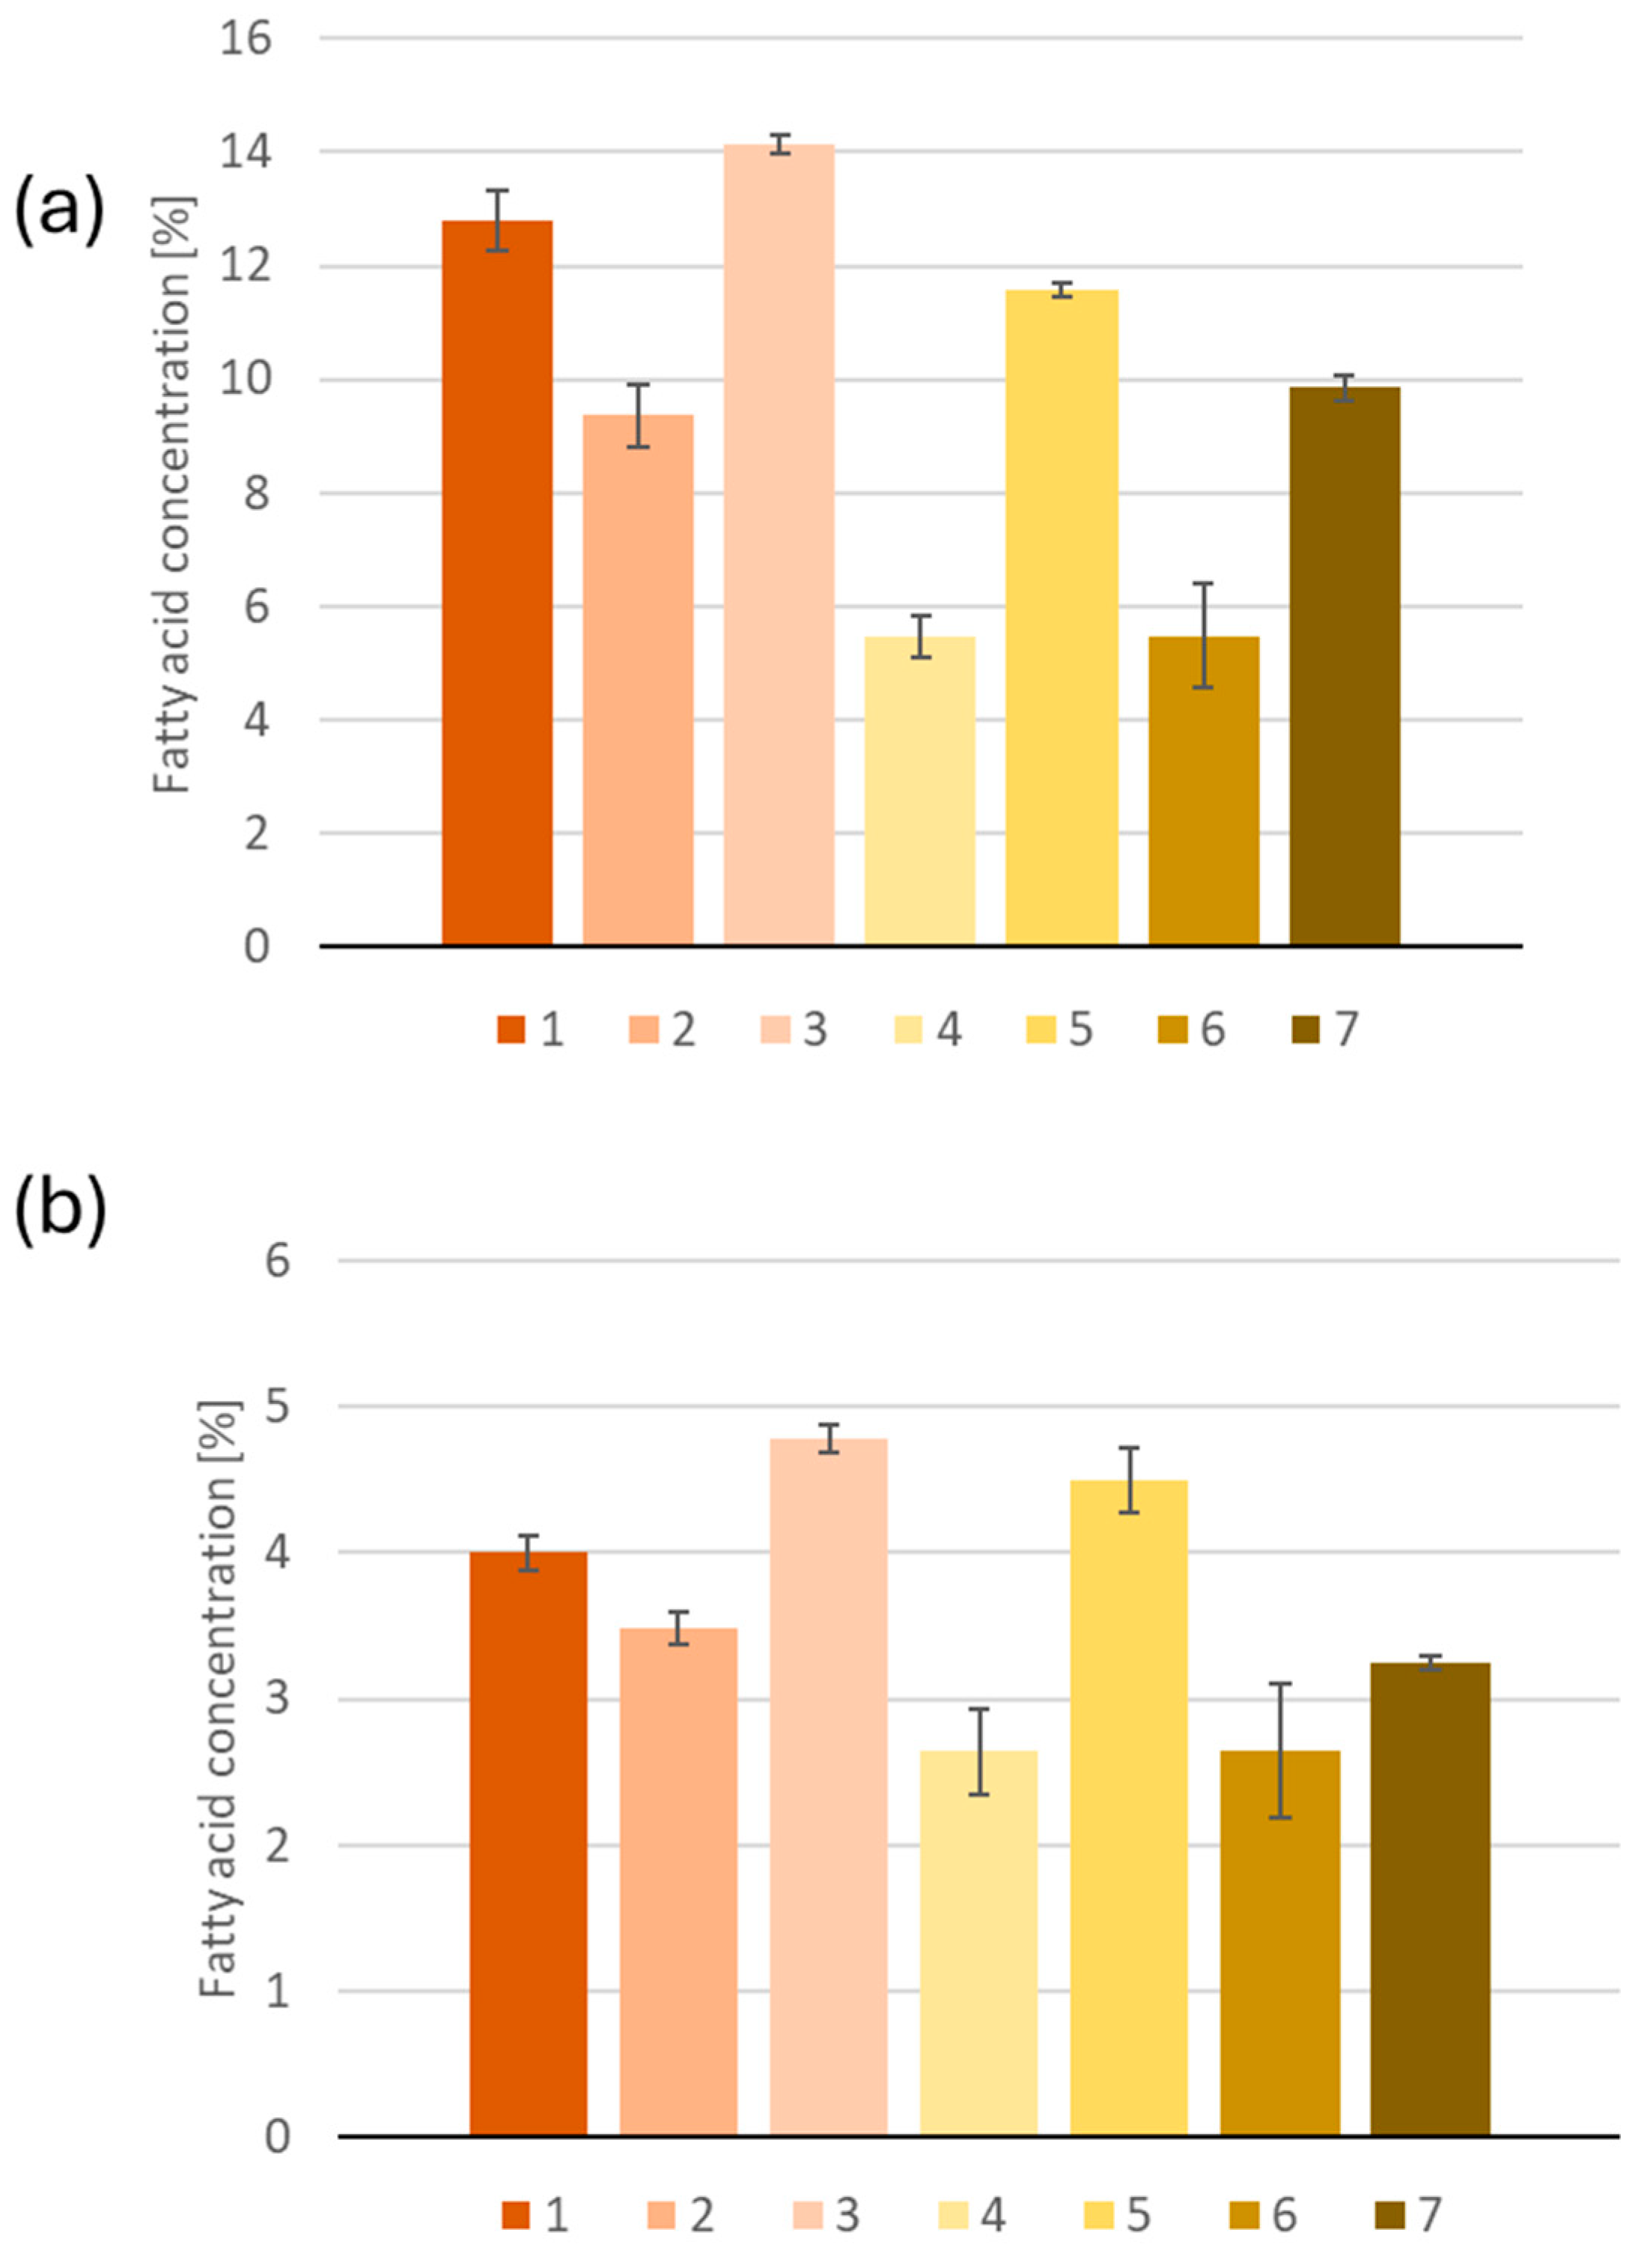
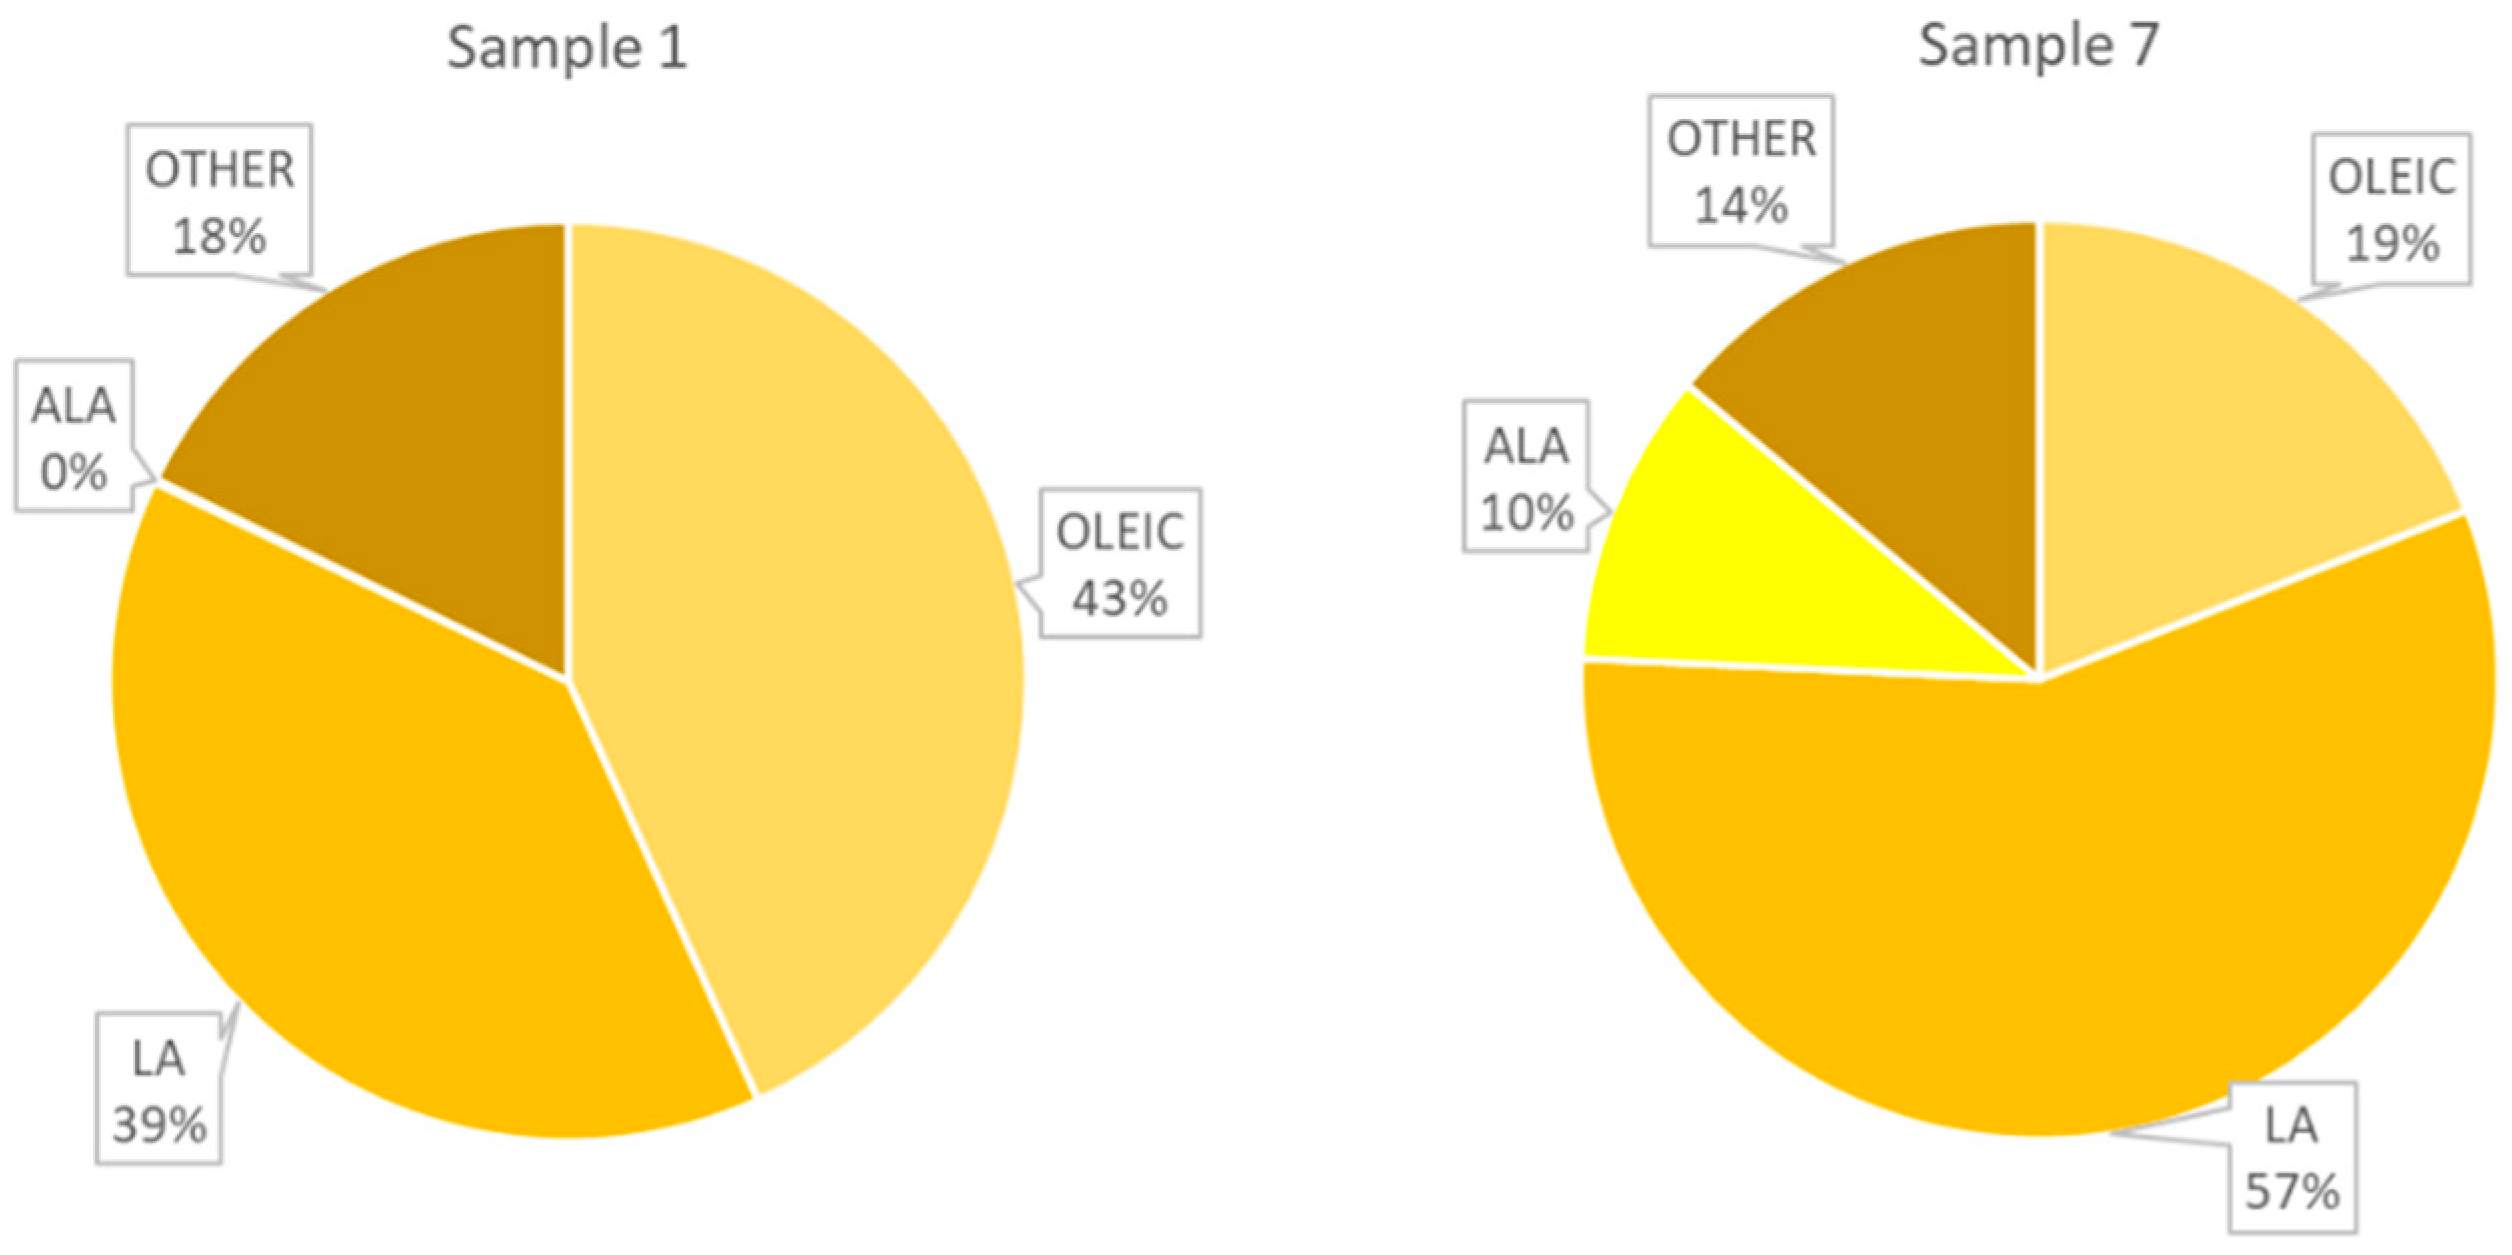
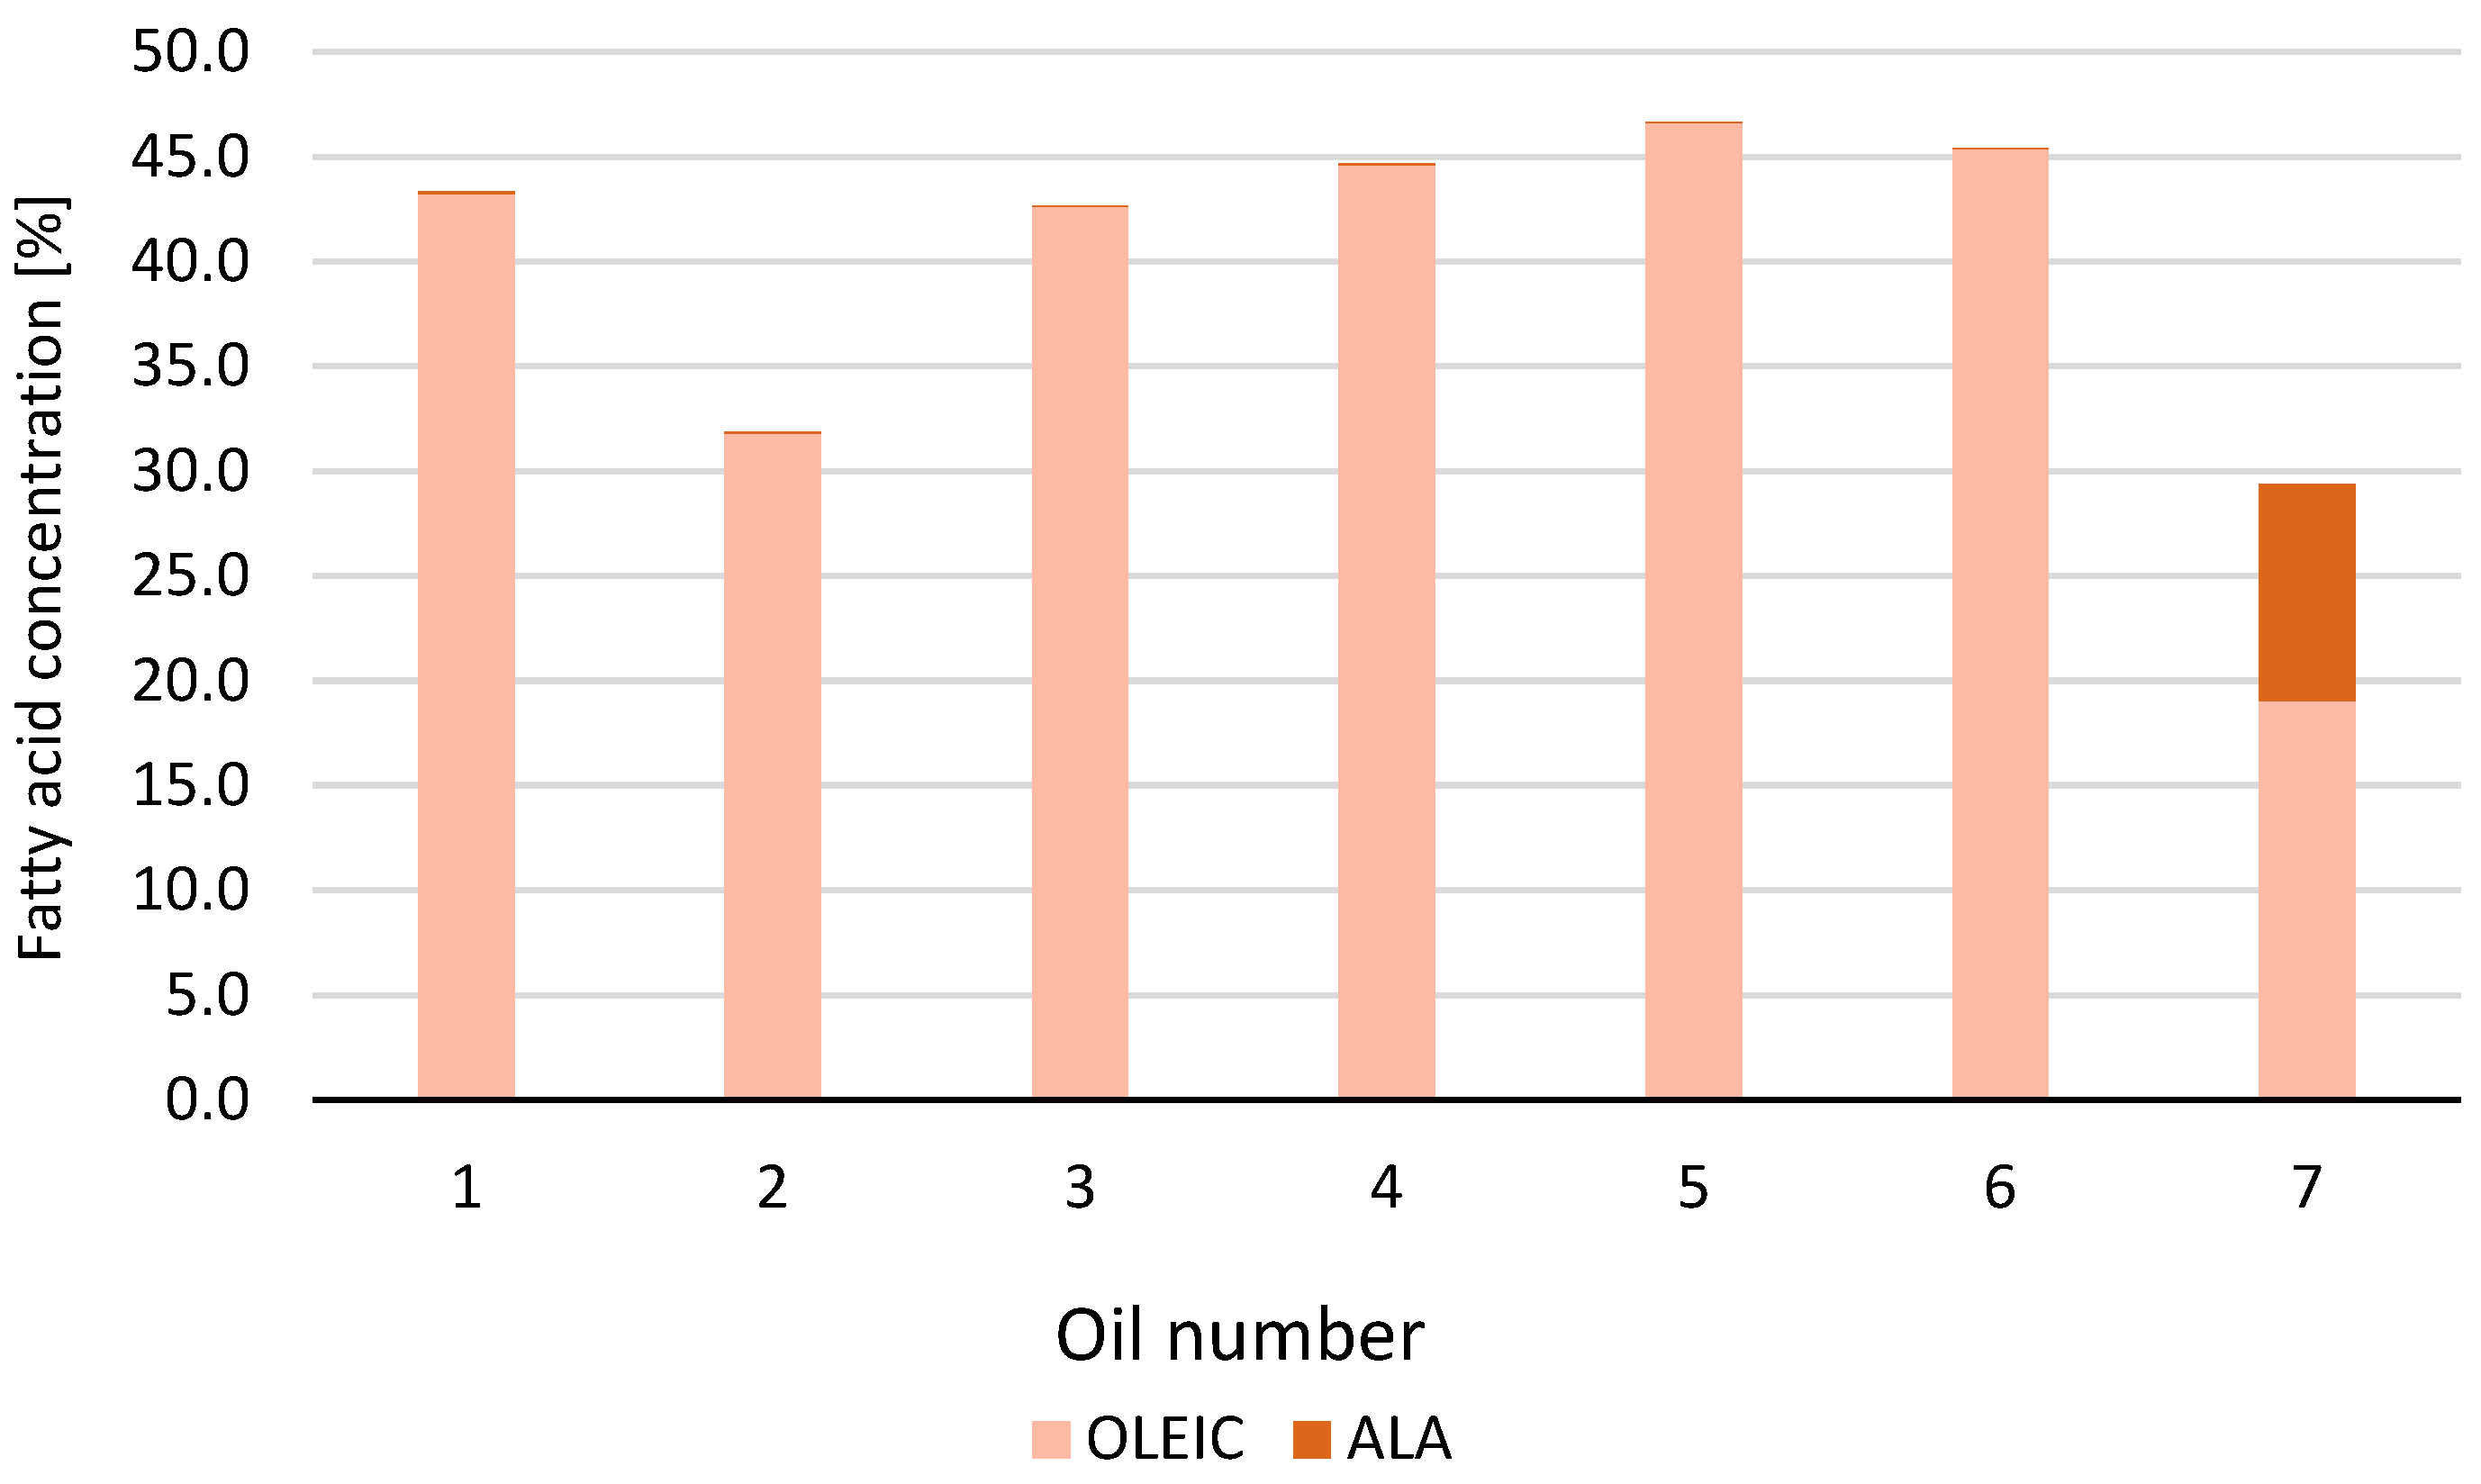
2.1. GC-MS Determination of Fatty Acids
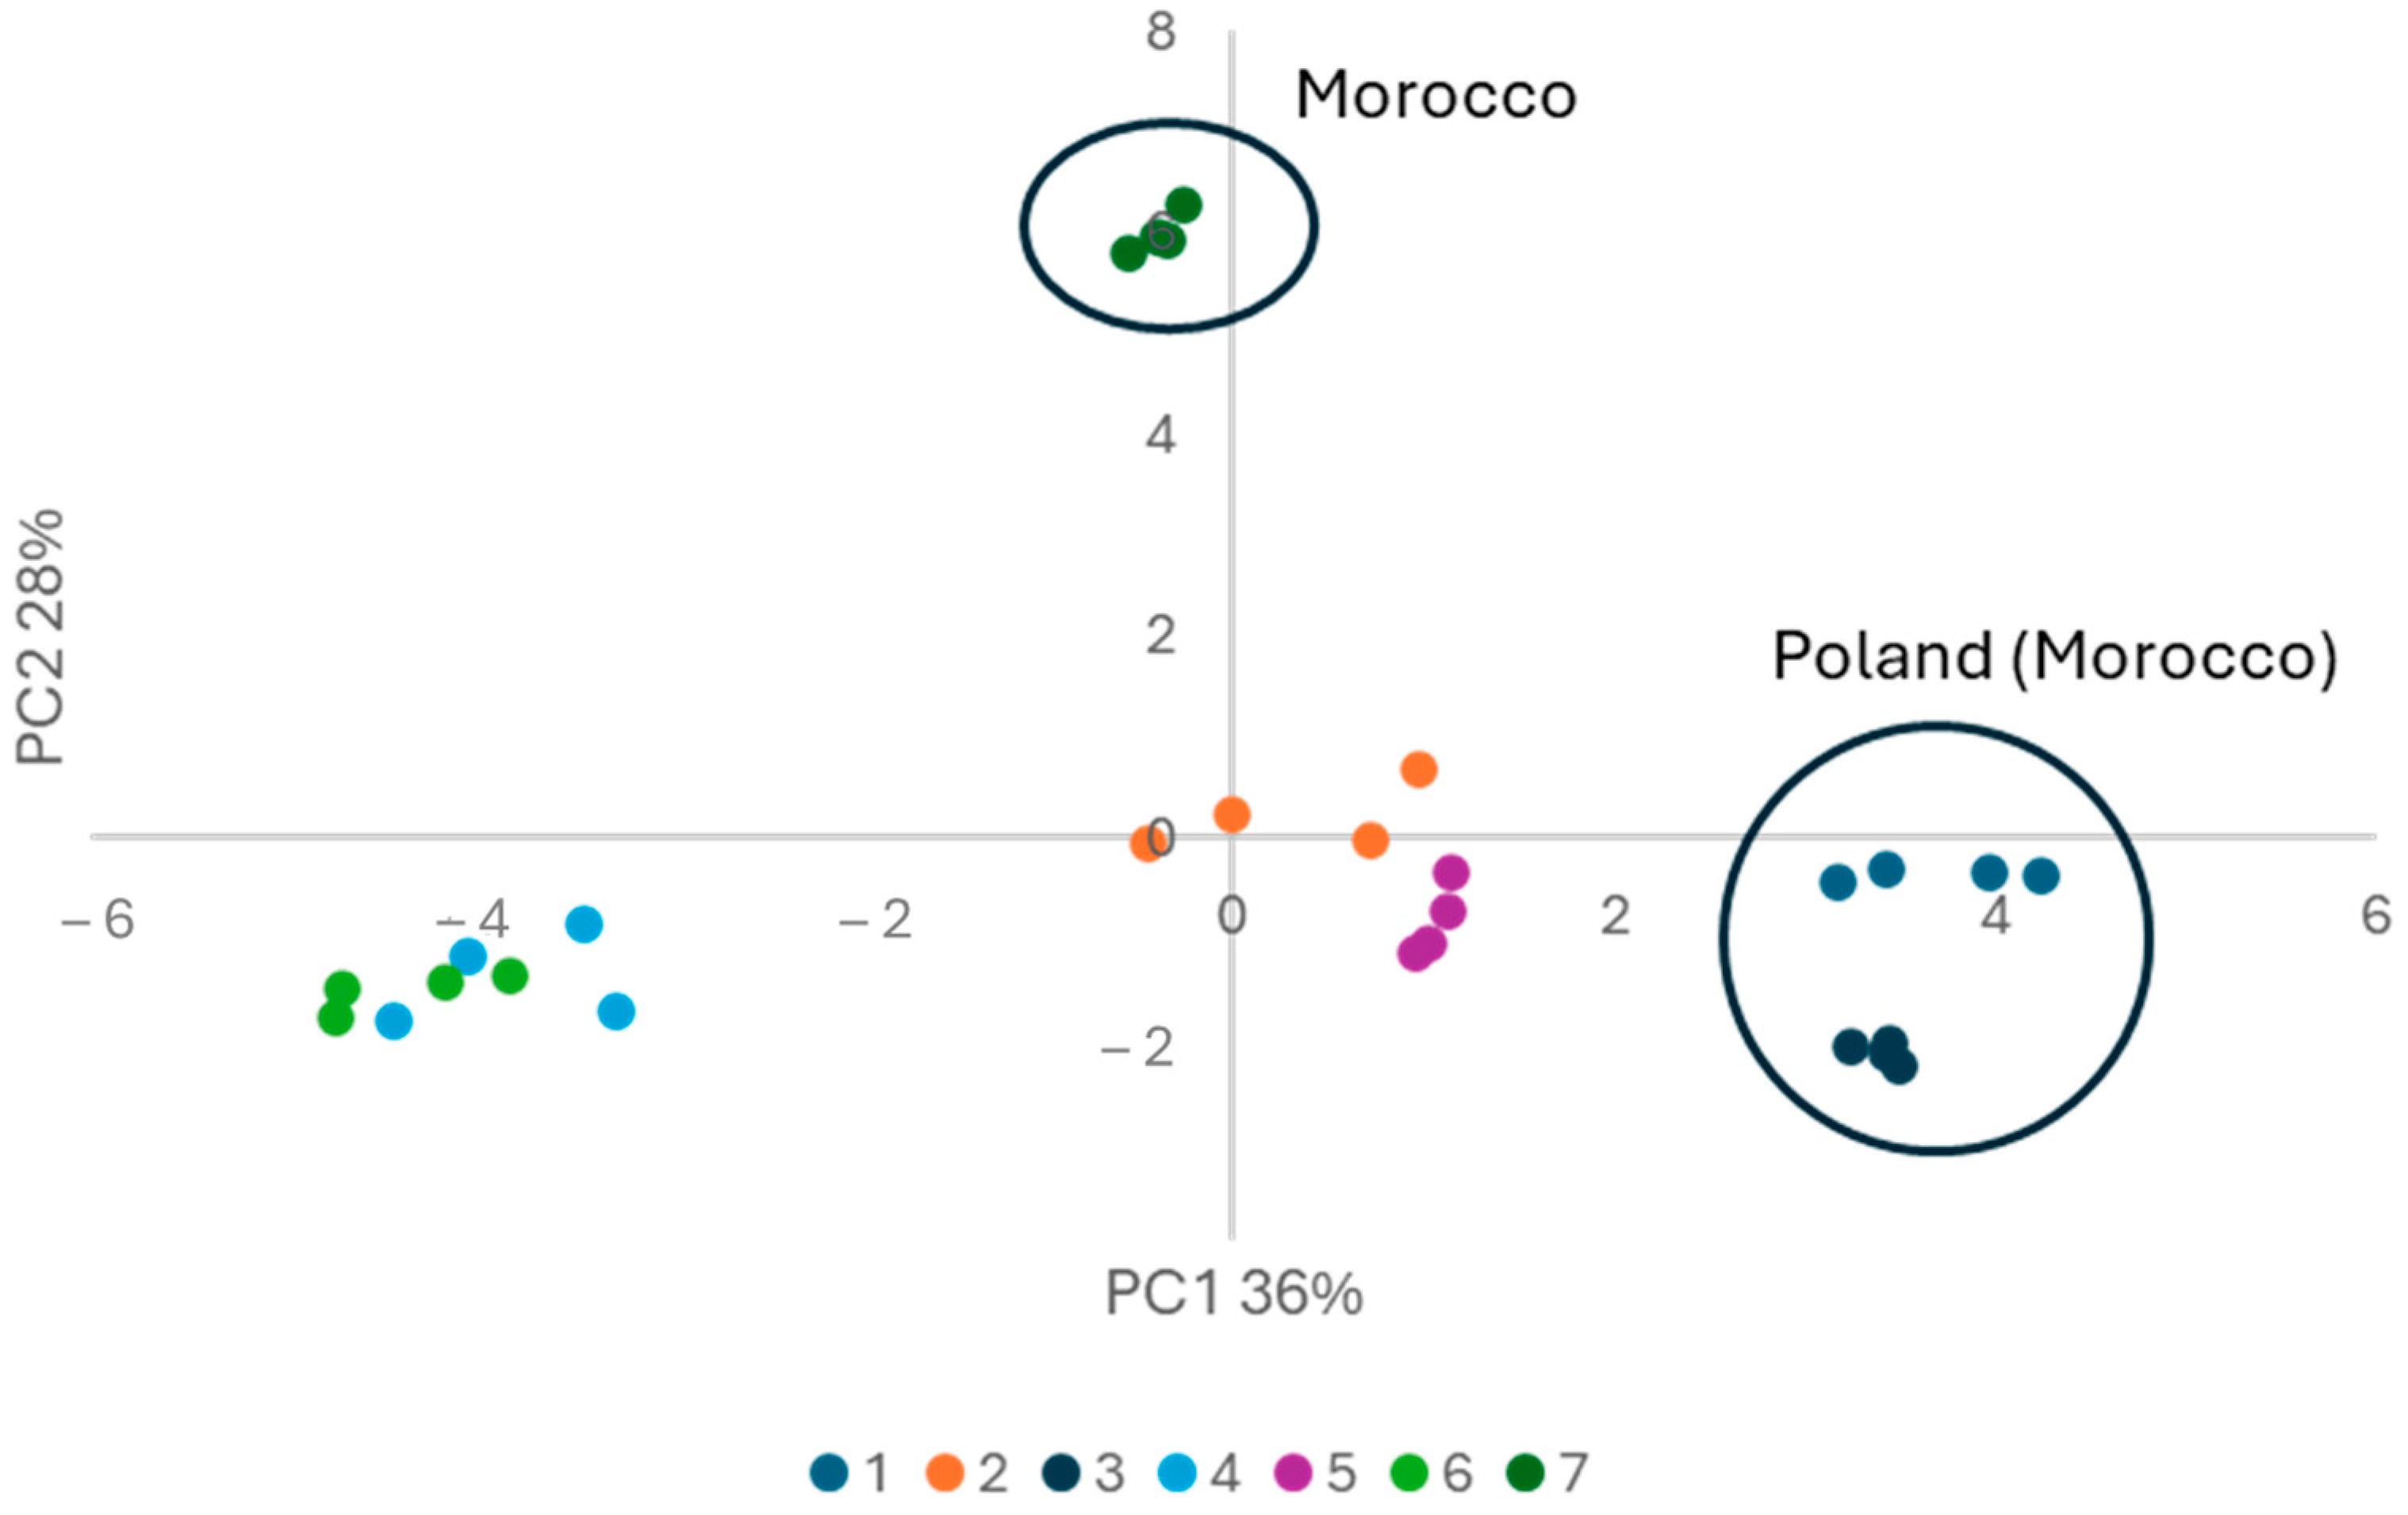
2.2. PCA Analysis
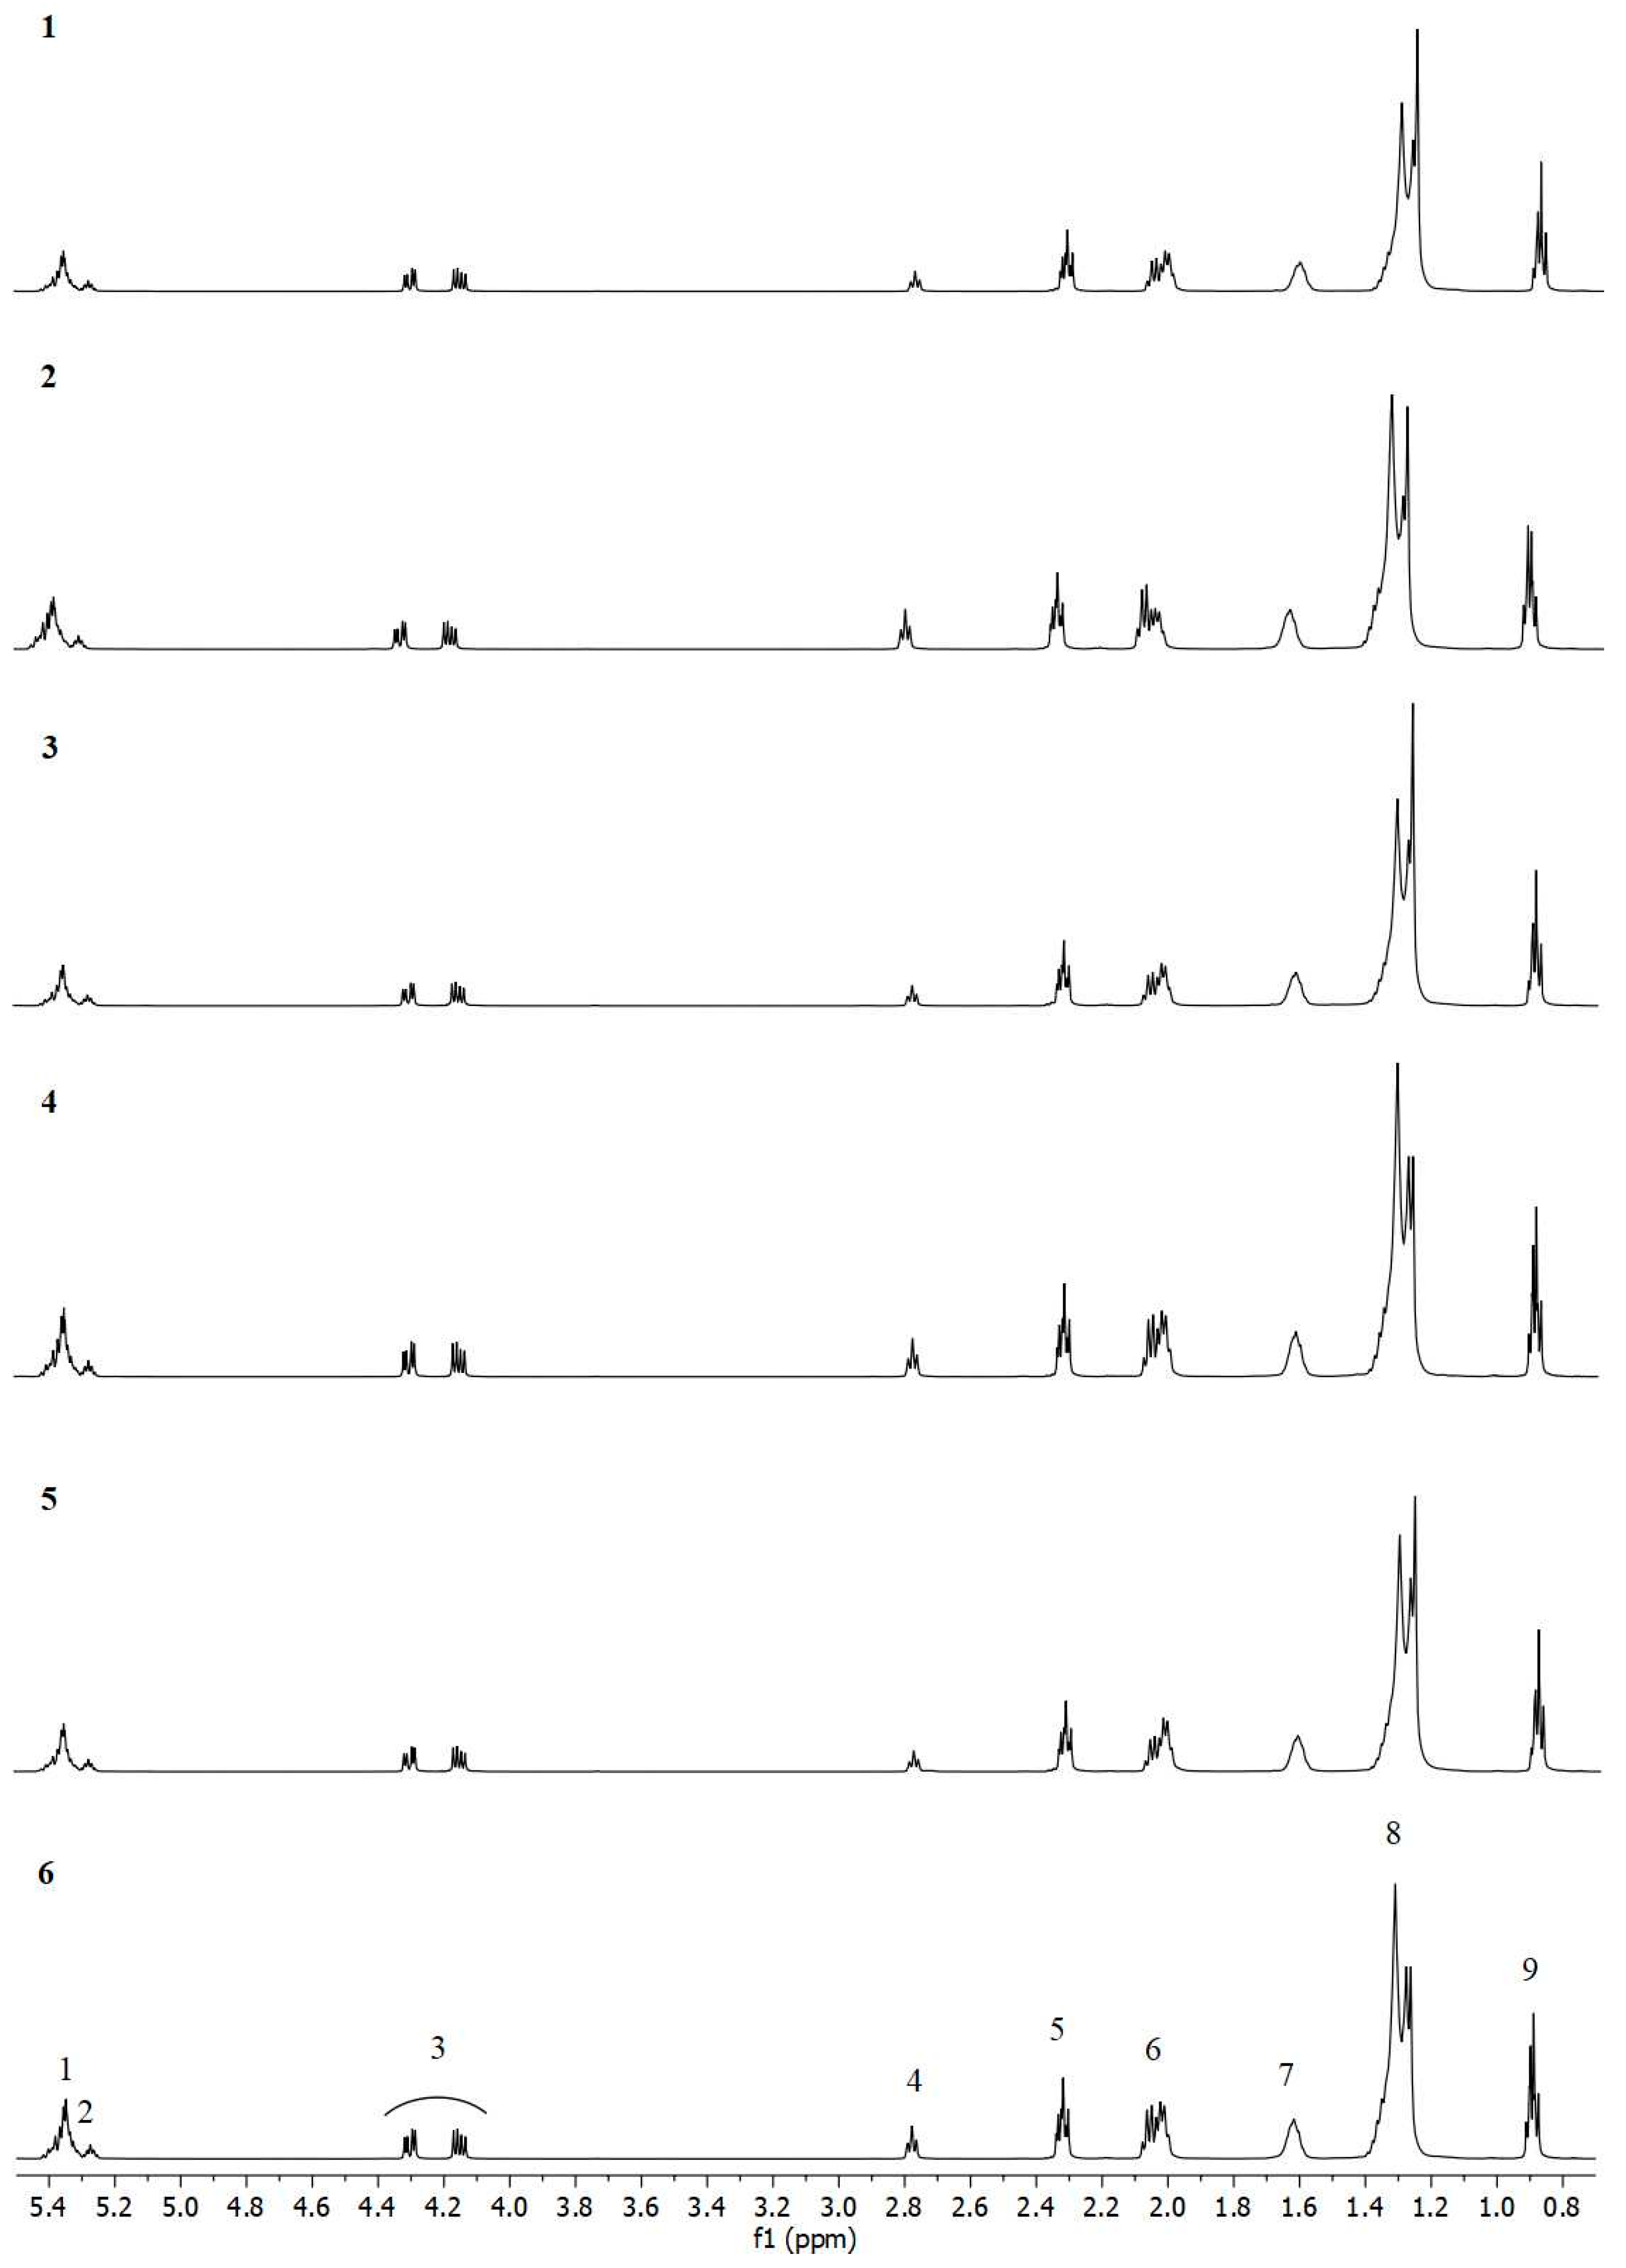
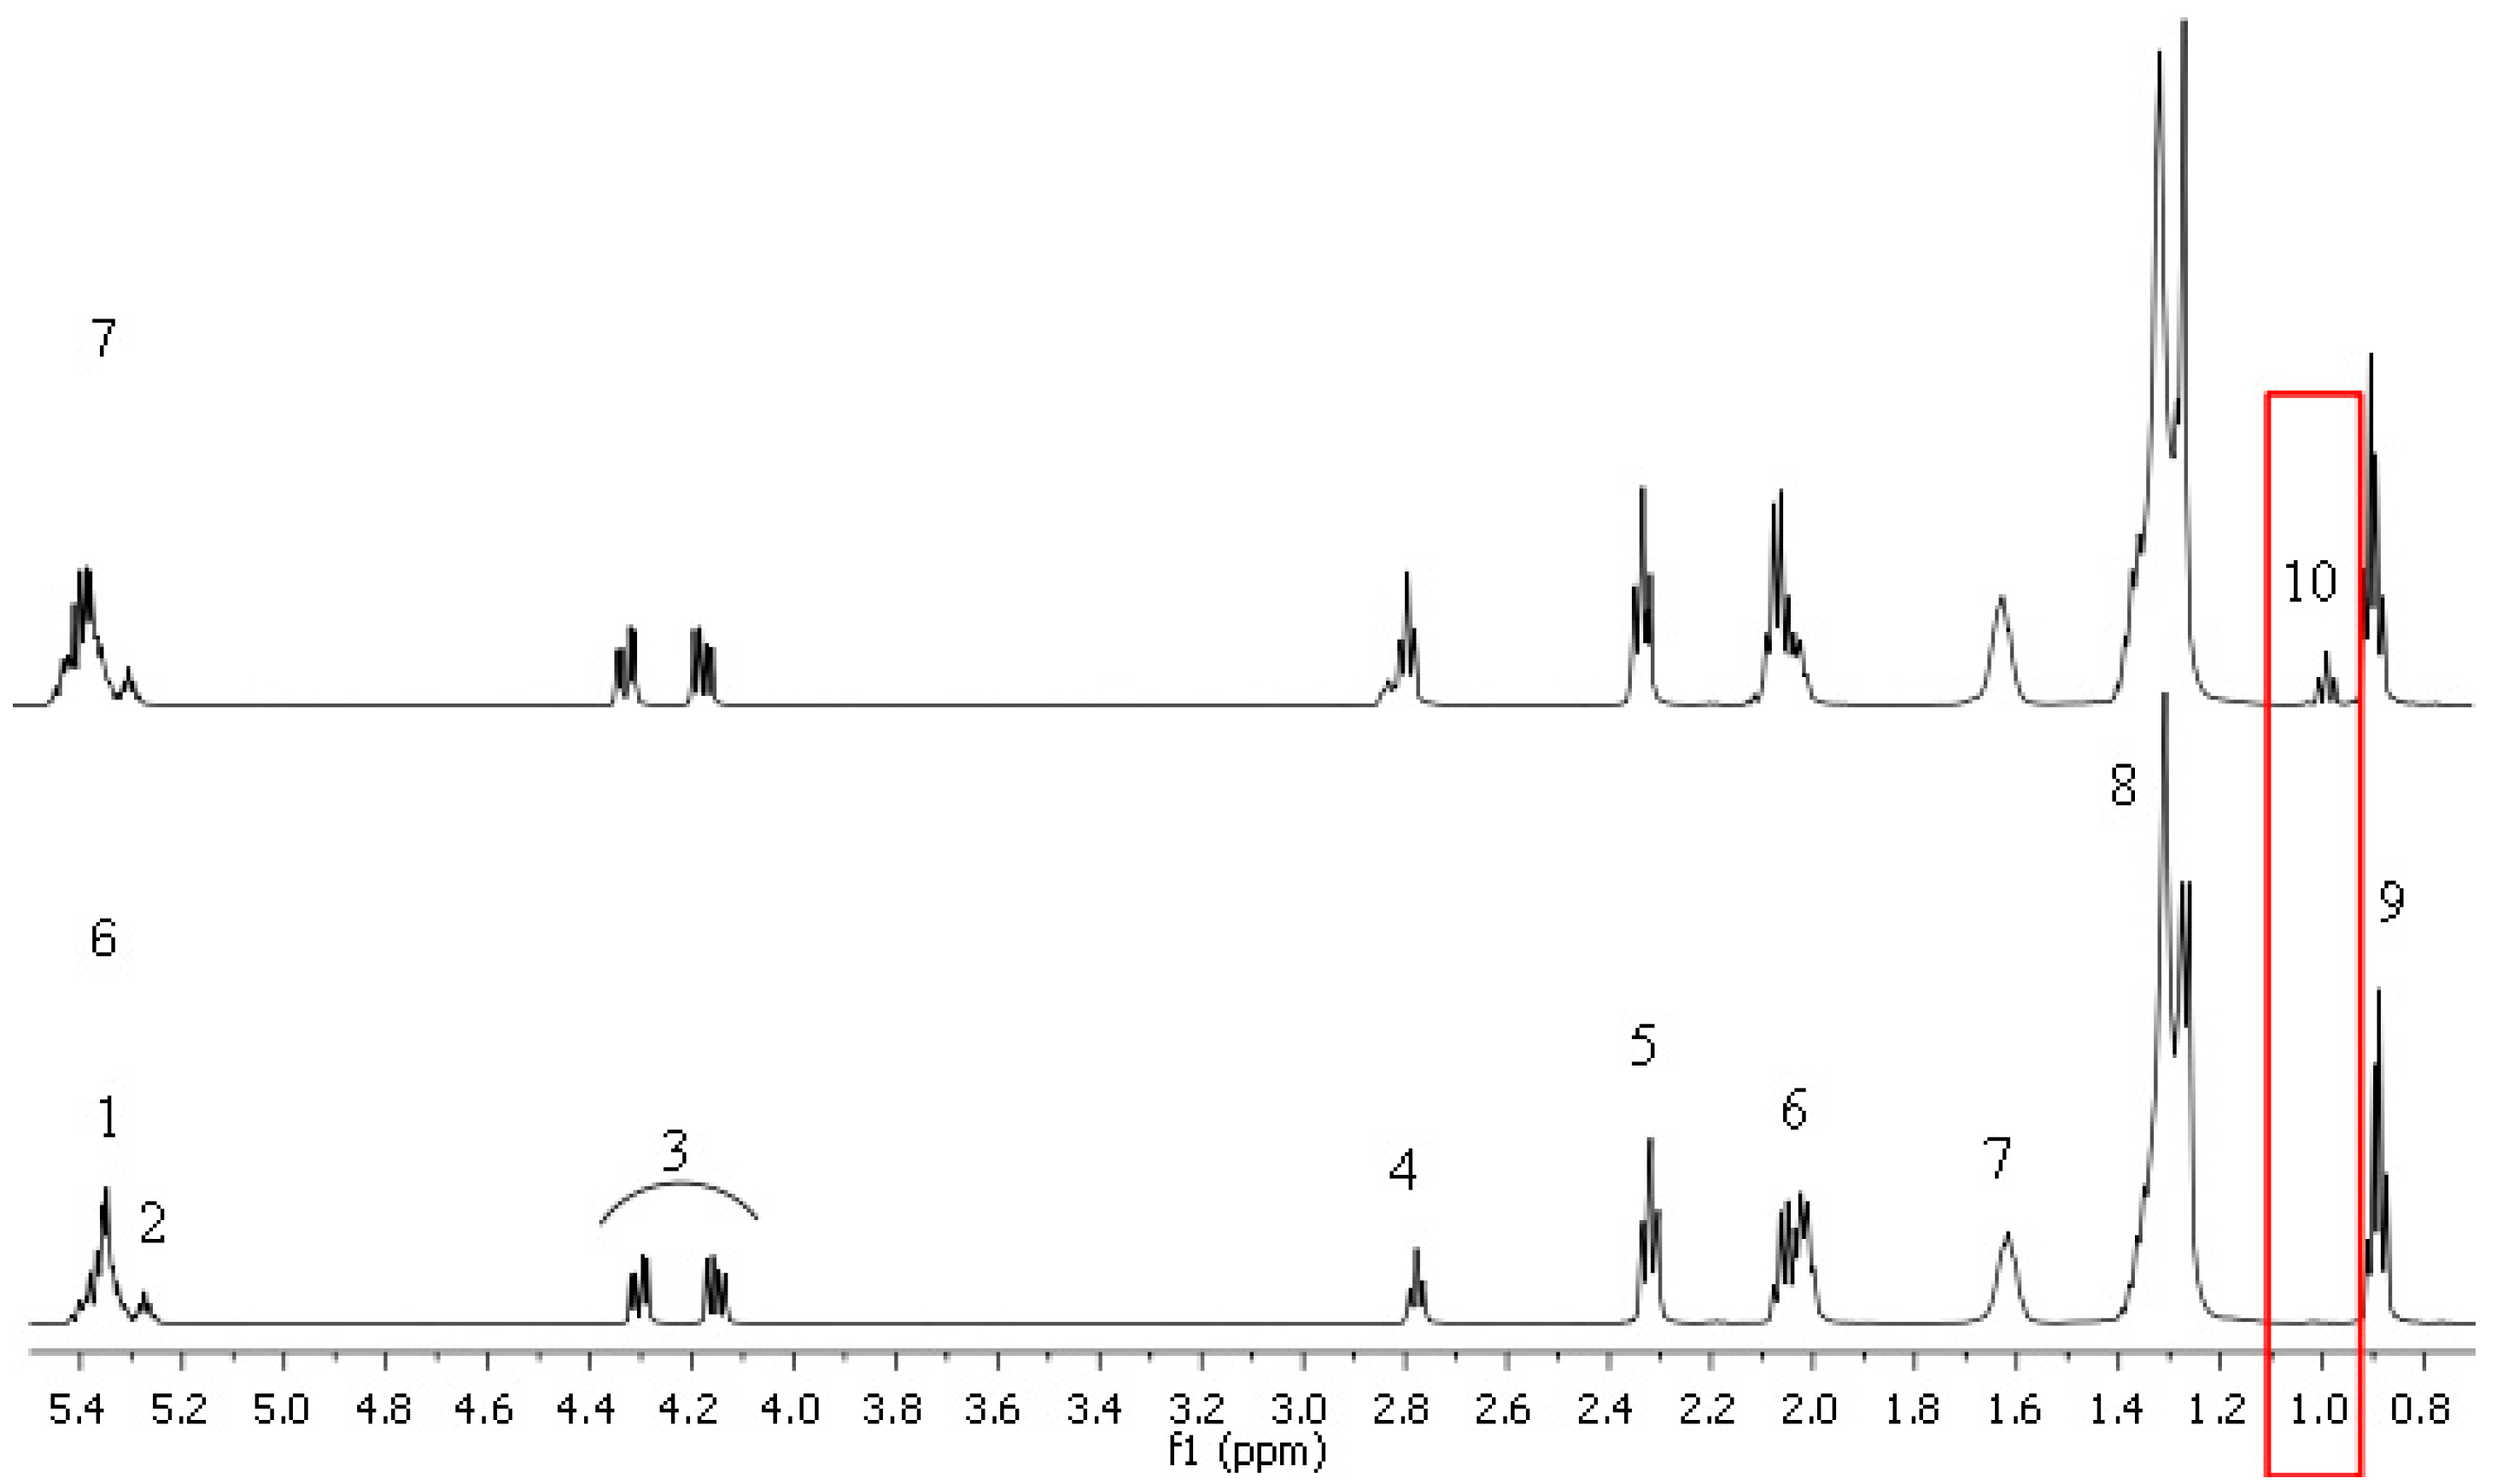
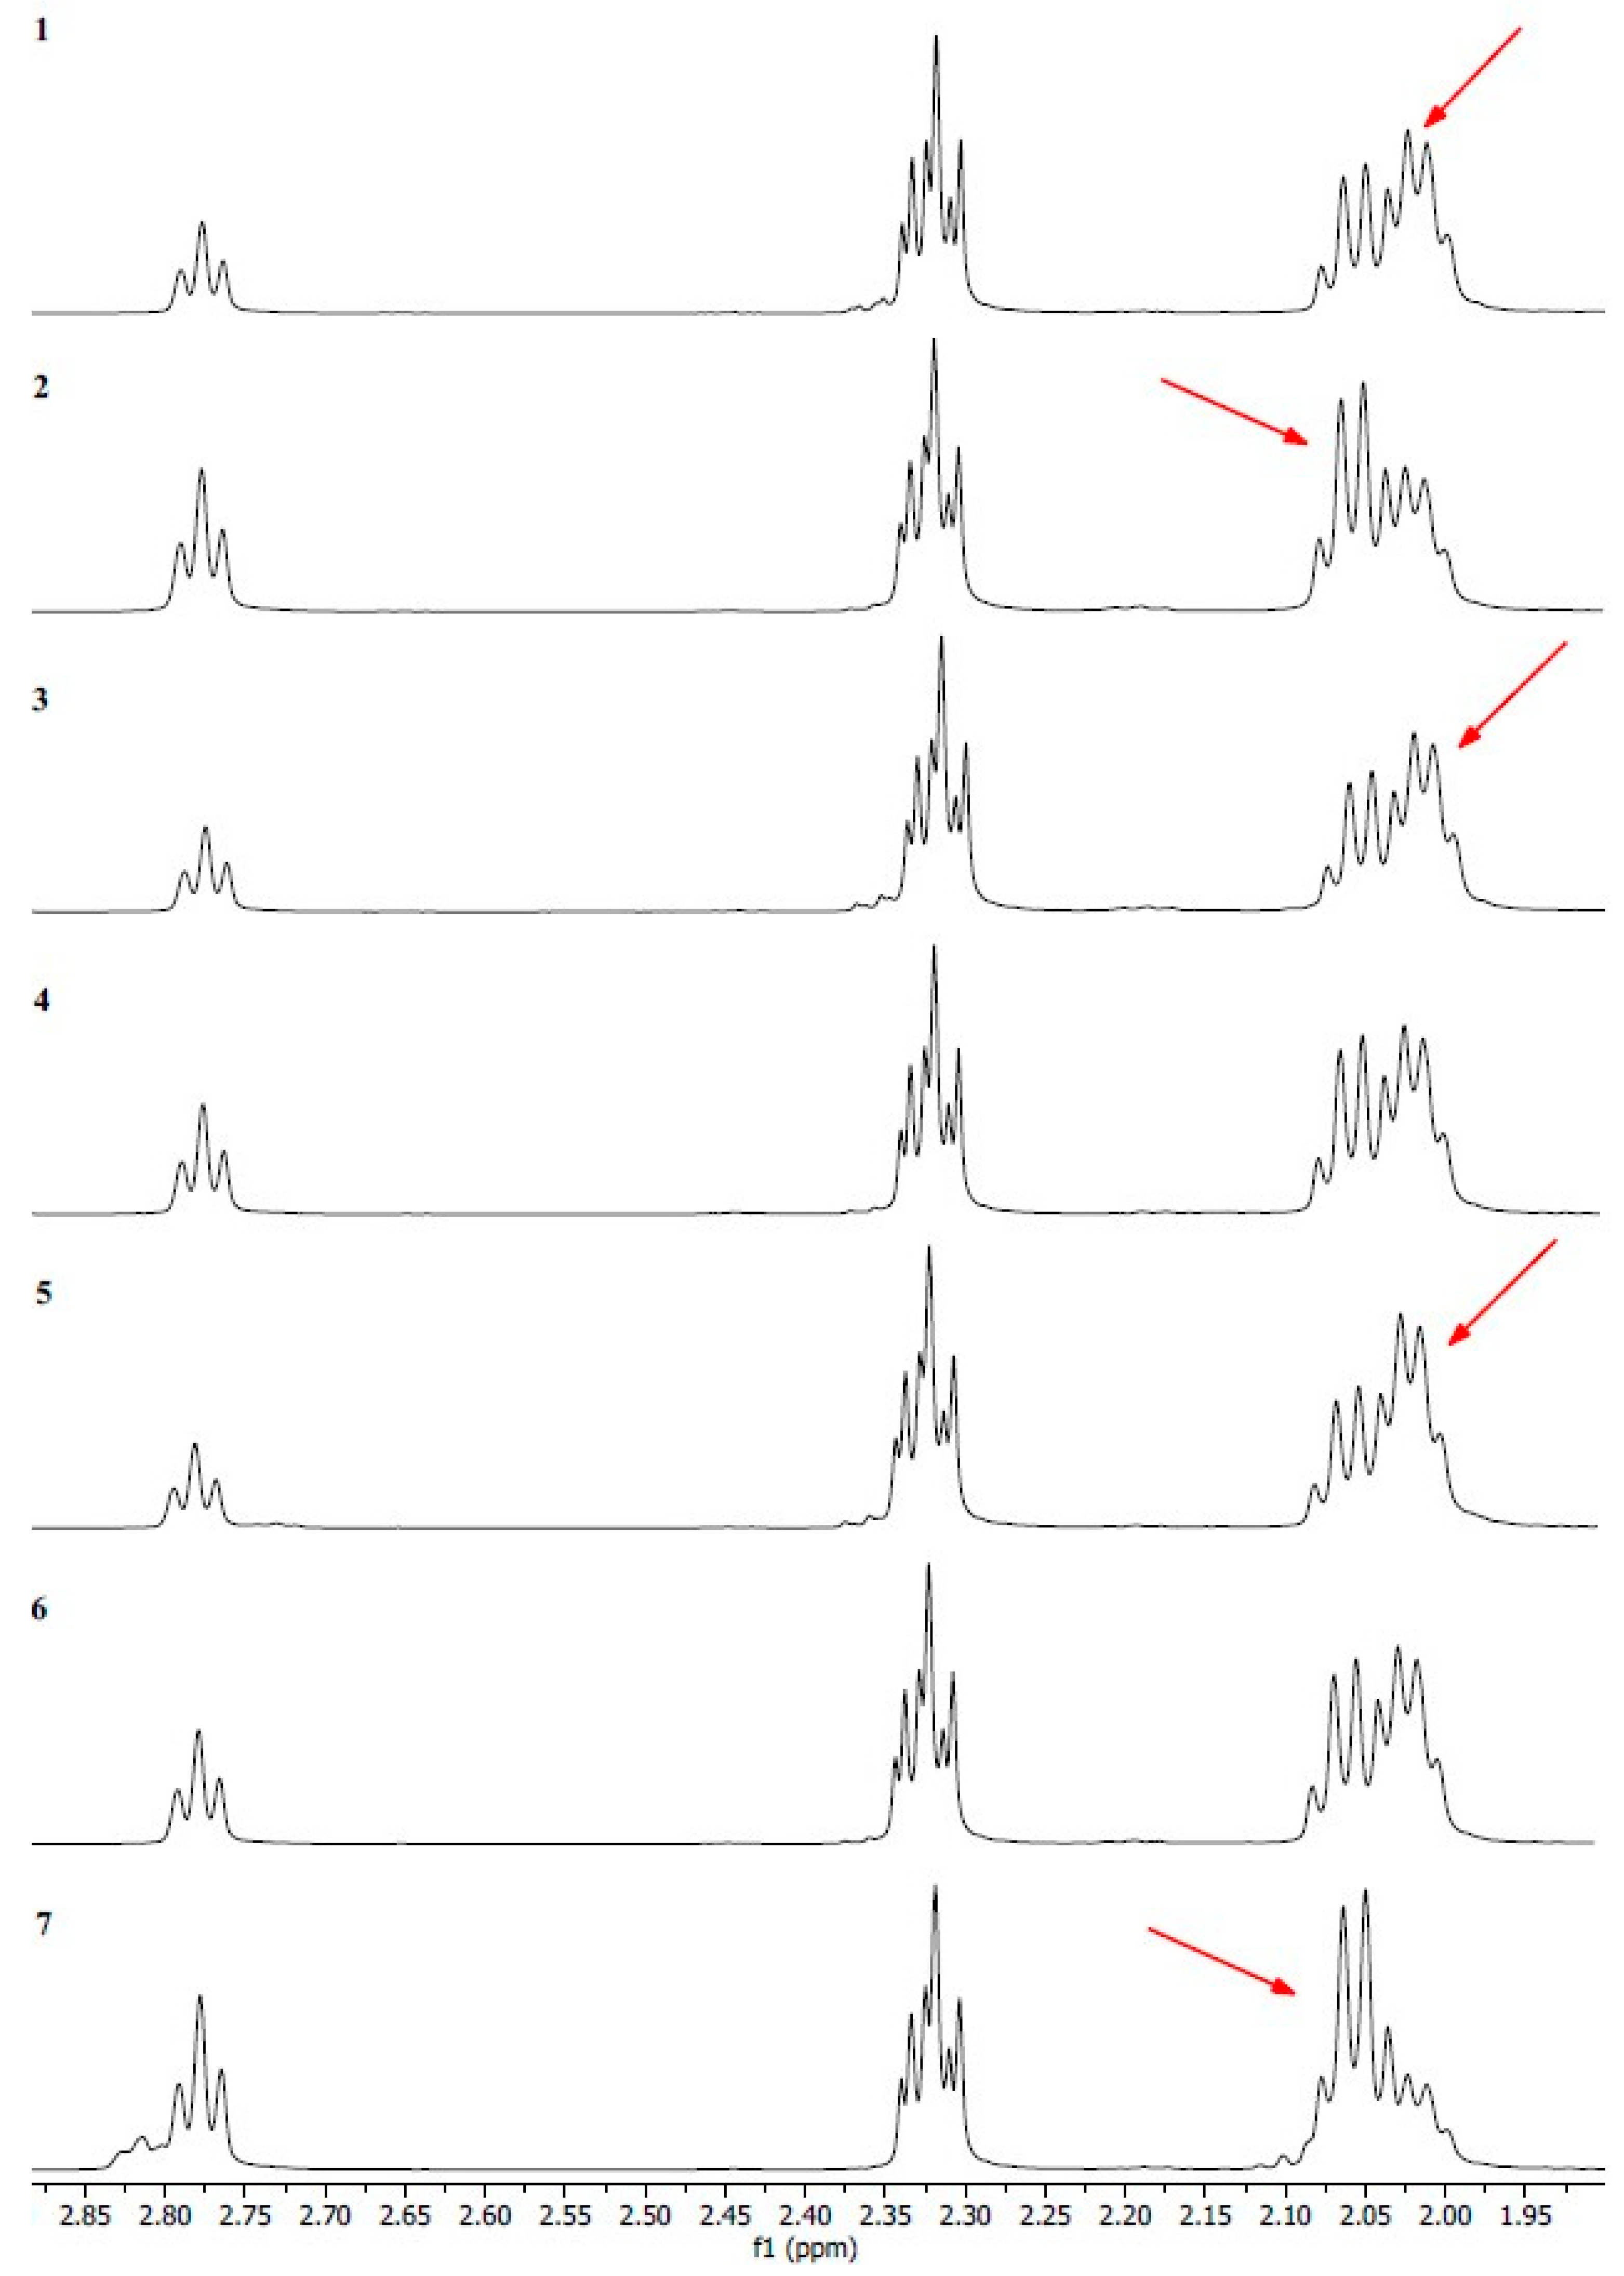
2.3. 1H NMR Study
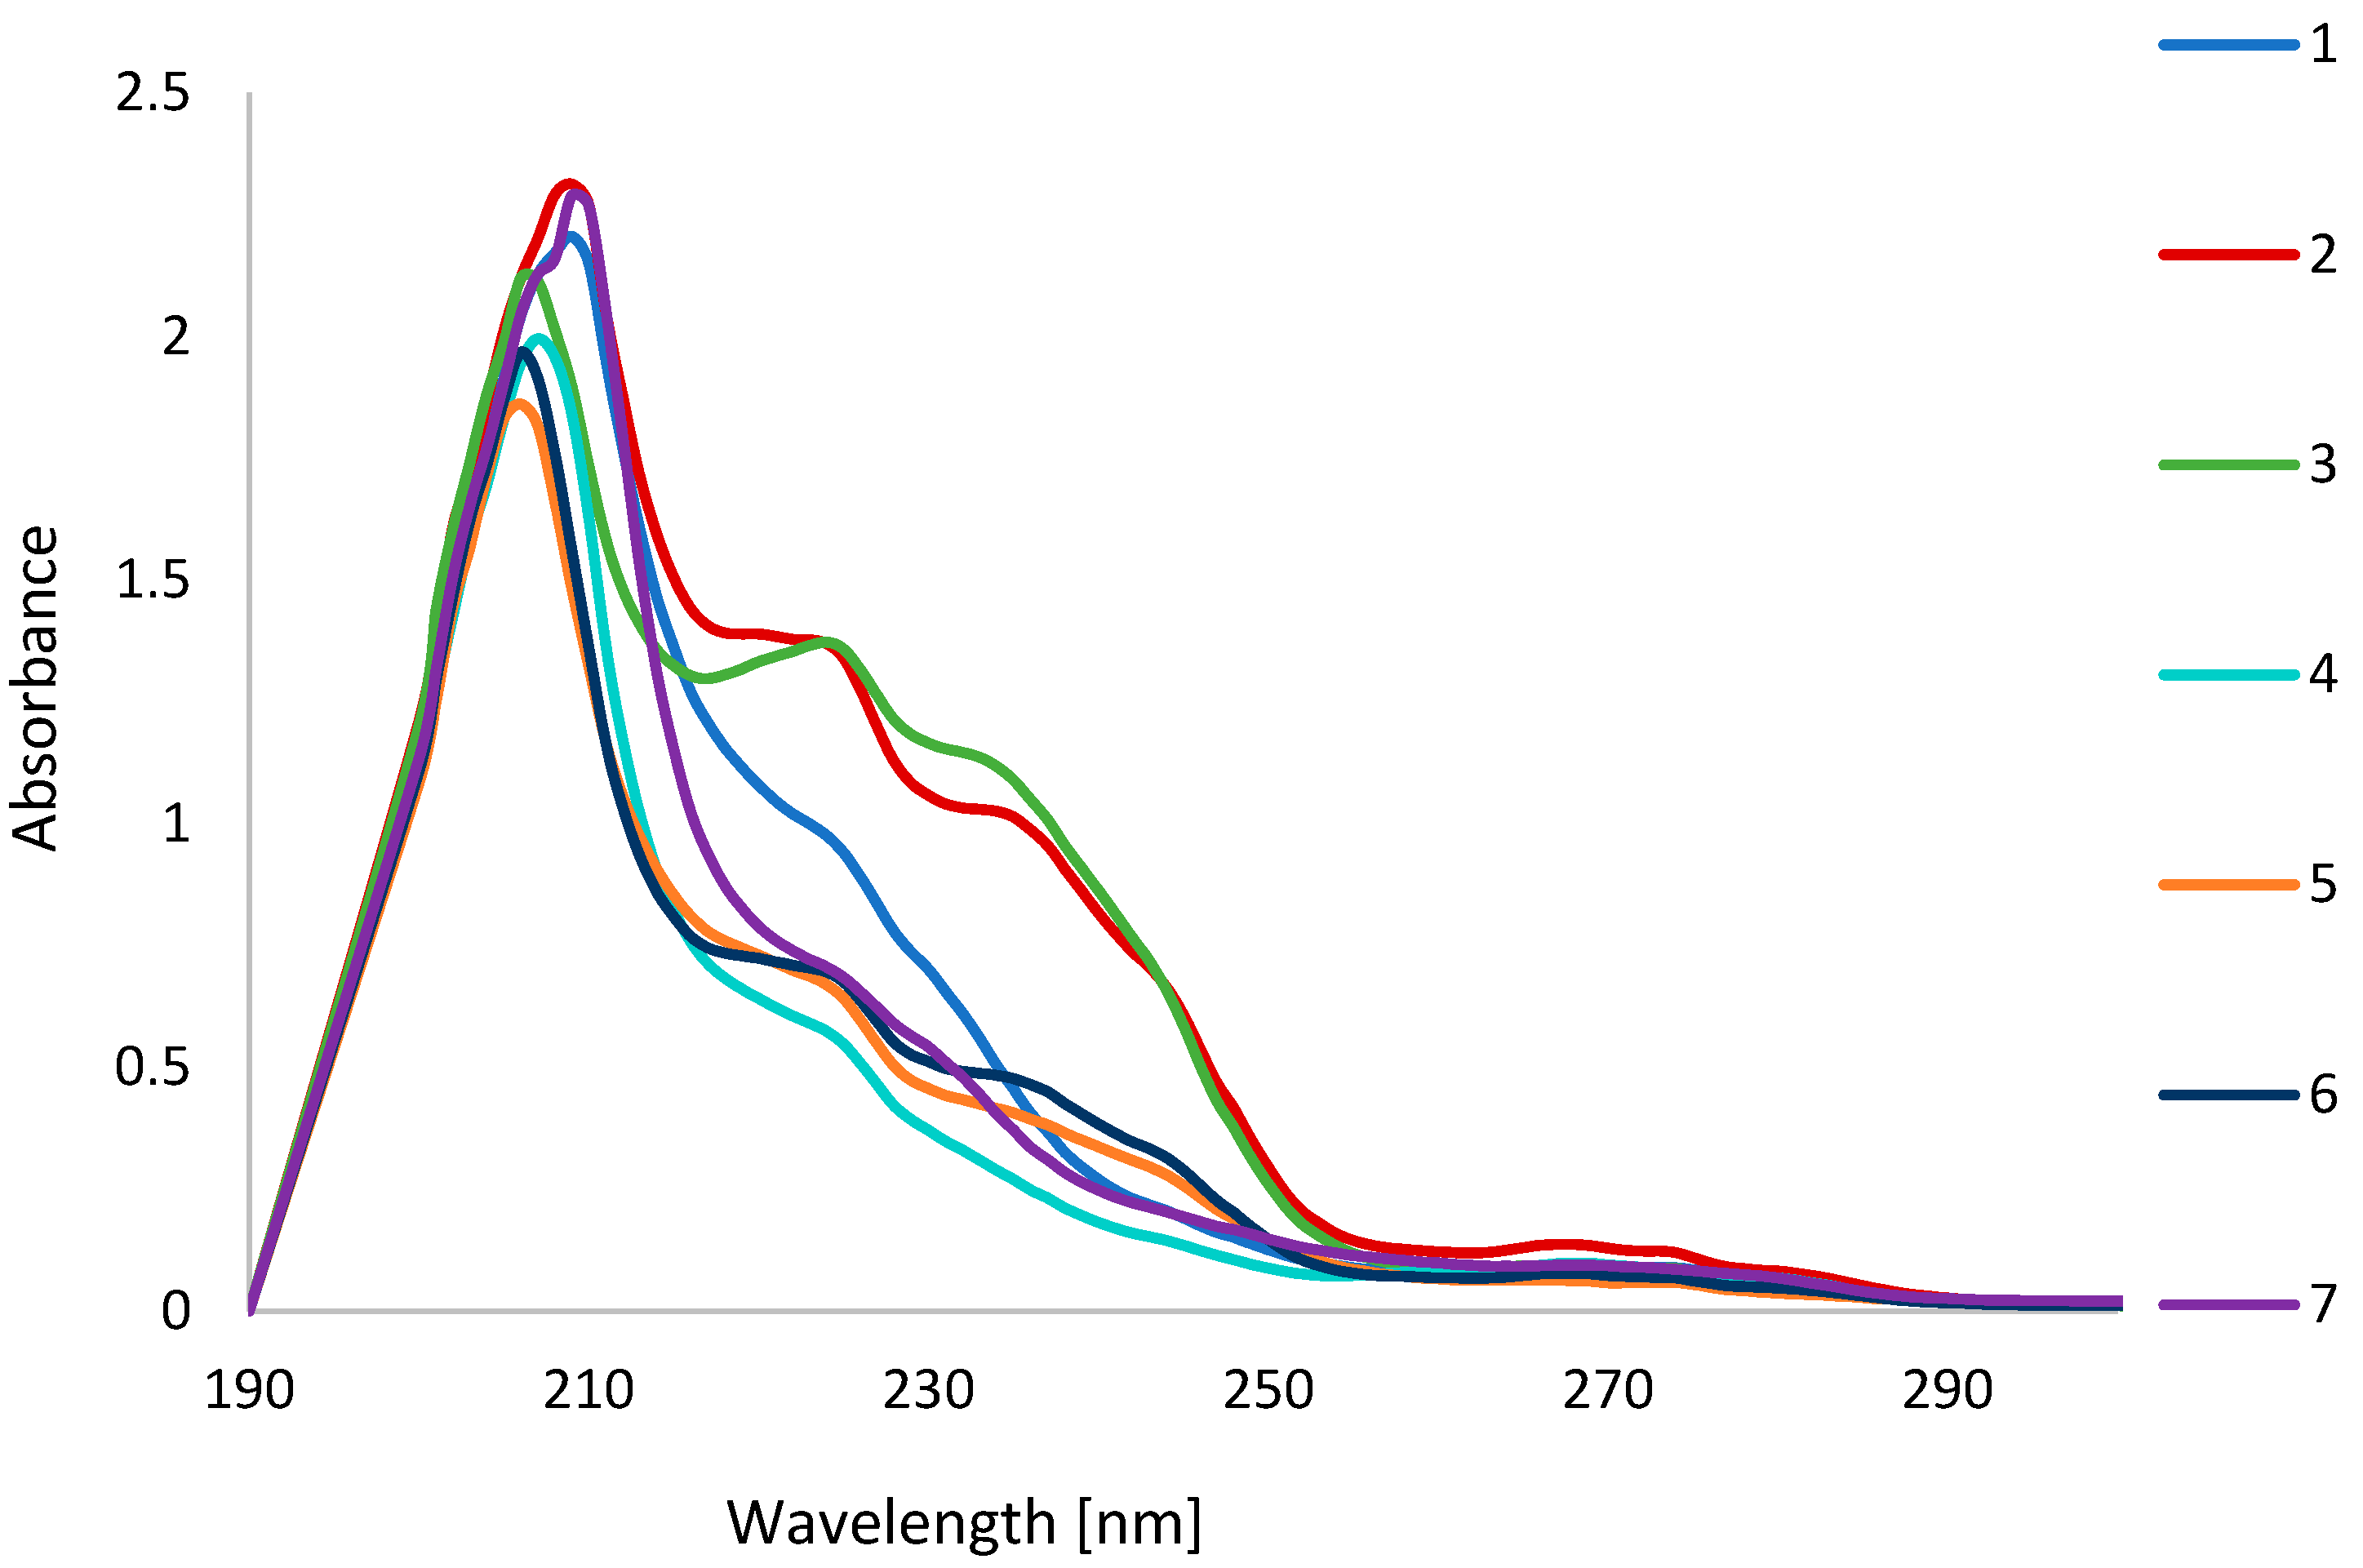
2.4. UV-Vis Study
3. Materials and Methods
3.1. Determination of Fatty Acid Content with GC-MS Technique
3.2. 1H NMR
3.3. UV-Vis Spectroscopy
3.4. Statistical Analysis
4. Conclusions
Author Contributions
Funding
Institutional Review Board Statement
Informed Consent Statement
Data Availability Statement
Acknowledgments
Conflicts of Interest
References
- El Yamani, M.; Ijjouk, R.; Kahime, K.; Rharrabti, Y. Ethnopharmacological Knowledge and Antioxidant Propensities of Argania spinosa L. from Morocco. Adv. Pharmacol. Pharm. Sci. 2024, 2024, 6795451. [Google Scholar] [CrossRef] [PubMed]
- Huang, P. Liquid gold: Berber women and the argan oil co-operatives in Morocco. Int. J. Intangible Herit. 2017, 12, 140–155. [Google Scholar]
- Belhoussaine, O.; El Kourchi, C.; Amakhmakh, M.; Ullah, R.; Iqbal, Z.; Goh, K.W.; Gallo, M.; Harhar, H.; Bouyahya, A.; Tabyaoui, M. Oxidative stability and nutritional quality of stored Linum usitatissmium L. and Argania spinosa L., oil blends: Chemical compositions, properties and nutritional value. Food Chem. X 2024, 23, 101680. [Google Scholar] [CrossRef]
- Maouardi, M.E.; Kharbach, M.; Cherrah, Y.; Braekeleer, K.D.; Bouklouze, A.; Heyden, Y.V. Quality Control and Authentication of Argan Oils: Application of Advanced Analytical Techniques. Molecules 2023, 28, 1818. [Google Scholar] [CrossRef]
- Charrouf, Z.; Guillaume, D. Argan oil: Occurrence, composition and impact on human health. Eur. J. Lipid Sci. Tech. 2008, 110, 632–636. [Google Scholar] [CrossRef]
- Gharby, S.; Charrouf, Z. Argan oil: Chemical composition, extraction process, and quality control. Front. Nutr. 2022, 8, 804587. [Google Scholar] [CrossRef]
- El Kebbaj, R.; Bouchab, H.; Tahri-Joutey, M.; Rabbaa, S.; Limami, Y.; Nasser, B.; Egbujor, M.C.; Tucci, P.; Andreoletti, P.; Saso, L.; et al. The Potential Role of Major Argan Oil Compounds as Nrf2 Regulators and Their Antioxidant Effects. Antioxidants 2024, 13, 344. [Google Scholar] [CrossRef] [PubMed]
- Alsatari, E.S.; AlSheyab, N.; D’Sa, J.L.; Gharaibeh, H.; Eid, S.; Al-Nusour, E.A.; Hayajneh, A.A. Effects of argan spinosa oil in the treatment of diaper dermatitis in infants and toddlers: A quasi-experimental study. J. Taibah Univ. Med. Sci. 2023, 18, 1288–1298. [Google Scholar] [CrossRef]
- Bednarczyk-Cwynar, B.; Majewska, K.; Olender, D.; Pawełczyk, A.; Sowa-Kasprzak, K.; Żwawiak, J. Skarby Natury w Kosmetyce; MedPharm Polska: Wrocław, Poland, 2014; Volume 1, pp. 7–12. [Google Scholar]
- Xiong, Z.; Liu, L.; Jian, Z.; Ma, Y.; Li, H.; Jin, X.; Liao, B.; Wang, K. Vitamin E and multiple health outcomes: An umbrella review of meta-analyses. Nutrients 2023, 15, 3301. [Google Scholar] [CrossRef]
- Eggersdorfer, M.; Schmidt, K.; Péter, S.; Richards, J.; Winklhofer-Roob, B.; Hahn, A.; Obermüller-Jevic, U. Vitamin E: Not only a single stereoisomer. Free Rad. Biol. Med. 2024, 215, 106–111. [Google Scholar] [CrossRef]
- Wołosik, K.; Knaś, M.; Niczyporuk, M. Fitokosmetologia, Wykłady z Fitokosmetologii, Fitokosmetyki i Kosmetyki Naturalnej; MedPharm Polska: Wrocław, Poland, 2012. [Google Scholar]
- Karameşe, M.; Özgür, D. The antibacterial and antifungal activities of commonly used herbal oils. J. Exp. Clin. Med. 2020, 37, 47–51. [Google Scholar]
- Amaral, J.S.; Raja, F.Z.; Costa, J.; Grazina, L.; Villa, C.; Charrouf, Z.; Mafra, I. Authentication of Argan (Argania spinosa L.) Oil Using Novel DNA-Based Approaches: Detection of Olive and Soybean Oils as Potential Adulterants. Foods 2022, 11, 2498. [Google Scholar] [CrossRef] [PubMed]
- Miklavčič, M.B.; Taous, F.; Valenčič, V.; Elghali, T.; Podgornik, M.; Strojnik, L.; Ogrinc, N. Fatty Acid Composition of Cosmetic Argan Oil: Provenience and Authenticity Criteria. Molecules 2020, 25, 4080. [Google Scholar] [CrossRef]
- Mohammed, F.; Guillaume, D.; Warland, J.; Abdulwali, N. Analytical methods to detect adulteration of argan oil: A critical review. Microchem. J. 2021, 168, 106501. [Google Scholar] [CrossRef]
- Taous, F.; El Ghali, T.; Marah, H.; Laraki, K.; Islam, M.; Cannavan, A.; Kelly, S. Geographical classification of authentic Moroccan Argan oils and the rapid detection of soya and sunflower oil adulteration with ATR-FTIR spectroscopy and chemometrics. Food Anal. Methods 2022, 15, 3032–3044. [Google Scholar] [CrossRef]
- Chiu, H.H.; Kuo, C.H. Gas chromatography-mass spectrometry-based analytical strategies for fatty acid analysis in biological samples. J. Food Drug Anal. 2020, 28, 60–73. [Google Scholar] [CrossRef]
- Smith, R. Greater decision uncertainty characterizes a transdiagnostic patient sample during ap-proach-avoidance conflict: A computational modelling approach. J. Psychiatry Neurosci. 2021, 46, E74–E87. [Google Scholar] [CrossRef]
- Rahmani, M. The chemical composition of virgin argan oil. Agricultures 2005, 14, 461–465. [Google Scholar]
- Charrouf, Z.; Guillaume, D. Ethnoeconomical, ethnomedical, and phytochemical study of Argania spinosa (L.) Skeels. J. Ethnopharmacol. 1999, 67, 7–14. [Google Scholar] [CrossRef]
- Białek, A.; Białek, M.; Lepionka, T.; Tober, E.; Czauderna, M. The Quality Determination of Selected Commercial Online Purchased Edible Pomegranate Seed Oils with New Argentometric Liquid Chromatography Method. J. Diet. Suppl. 2021, 18, 351–371. [Google Scholar] [CrossRef]
- Czauderna, M.; Kowalczyk, J.; Marounek, M.; Michalski, J.P.; Rozbicka-Wieczorek, A.J.; Krajewska, K.A. A new internal standard for HPLC assay of conjugated linoleic acid in animal tissues and milk. Czech J. Anim. Sci. 2011, 56, 23–29. [Google Scholar] [CrossRef]

| 1 | 2 | 3 | 4 | 5 | 6 | 7 | |
|---|---|---|---|---|---|---|---|
| FA [ug/g of Sample] | Mean ± SD | Mean ± SD | Mean ± SD | Mean ± SD | Mean ± SD | Mean ± SD | Mean ± SD |
| C10:0 | 36.1 a,b ± 5.9 | 43 a,b ± 10 | 48.2 b ± 8.0 | 35.7 a,b ± 9.9 | 39.6 a,b ± 3.5 | 27.0 a ± 7.0 | 37.0 a,b ± 4.0 |
| C12:0 | 58 a,b ± 12 | 73 b ± 10 | 62.0 a,b ± 8.1 | 52.4 a,b ± 8.9 | 54 a,b ± 11 | 48.2 a ± 3.5 | 52.5 a,b ± 7.8 |
| C14:0 | 789 a ± 39 | 557 b ± 40 | 708 c ± 16 | 311 d,e ± 29 | 535 b ± 28 | 272 e ± 23 | 347 d ± 30 |
| C15:0 | 234 a ± 22 | 138 b ± 31 | 202.3 a,c ± 6.1 | 65 d ± 14 | 168 b,c ± 11 | 50.5 d ± 7.2 | 73.2 d ± 8.4 |
| C16:0 [mg/g of sample] * | 54.4 a ± 2.2 | 35.2 b ± 2.1 | 47.3 c ± 0.5 | 18.0 d ± 1.3 | 35.9 b,e ± 0.4 | 16.1 d ± 2.7 | 39.30 e ± 0.84 |
| C17:0 | 269 a ± 31 | 193 b ± 27 | 267 a ± 18 | 116 c ± 20 | 223 a,b ± 23 | 97 c ± 15 | 369 d± 18 |
| C18:0 [mg/g of sample] * | 16.99 a ± 0.48 | 13.10 b ± 0.42 | 16.00 a ± 0.31 | 8.68 c ± 0.94 | 13.9 b ± 0.7 | 7.7 c ± 1.3 | 12.94 b ± 0.20 |
| C20:0 | 569 a,b ± 29 | 475 a ± 41 | 557 a,b ± 46 | 363 c ± 32 | 576 a,b ± 47 | 313 c ± 57 | 605 b ± 67 |
| C22:0 | 117 a ± 19 | 504 b ± 23 | 104.2 a ± 9.2 | 744 c ± 61 | 262 d ± 12 | 649 c ± 61 | 345 d ± 72 |
| C15:1 | 46.7 a ± 8.2 | 31.9 a,b ± 5.0 | - | 14 c,d ± 16 | 38.1 a,b ± 7.2 | 21.6 b,d ± 5.9 | 78.0 e ± 2.7 |
| C16:1 | 764 a ± 46 | 1004 b ± 119 | 1160 c ± 97 | 578 d ± 28 | 729 a ± 15 | 648 a,d ± 82 | 548 d ± 28 |
| C17:1 | 90 a,b ± 17 | 105 a,b ± 17 | 73.7 a ± 7.9 | 117.0 b ± 9.6 | 85 a ± 13 | 86 a,b ± 19 | 180.4 c ± 7.3 |
| C18:1(9Z) [mg/g of sample] * | 183.5 a ± 5.8 | 119.4 b ± 7.0 | 142.6 c ± 3.1 | 146.8 c ± 9.7 | 144.6 c ± 3.3 | 133 b,c ± 20 | 75.9 d ± 1.8 |
| C20:1 | 1007 a ± 46 | 605 b ± 65 | 851 c ± 55 | 398 d ± 47 | 831 c ± 68 | 367 d ± 78 | 414 d ± 31 |
| C14:2 | 33 a,b ± 12 | 42 a ± 10 | - | 15 b ± 18 | 33.2 a,b ± 4.8 | 30.3 a,b ± 9.3 | 48.7 a ± 5.4 |
| C18:2(9Z,12Z) [mg/g of sample] | 165.3 a ± 5.3 | 204 b ± 16 | 124.4 c ± 2.4 | 152.5 a,d ± 7.7 | 111.81 c ± 0.42 | 133 c,d ± 22 | 226.3 b ± 6.0 |
| C18:3(9Z,12Z,15Z) * | 495 a ± 38 | 295 a ± 34 | 221.9 a ± 8.9 | 258 a ± 15 | 159.7 a ± 5.6 | 212 a ± 41 | 41281 b ± 1513 |
| C20:2 | 51 a ± 12 | 136 a,b ± 34 | 44.4 a,b ± 3.8 | 54 c ± 11 | 161 b ± 17 | 49 c ± 19 | 247 d ± 33 |
| Signal | 1H δ ppm | Group of Labelled Protons H | Functional Group |
|---|---|---|---|
| 1 | 5.37–5.32 | -CH=CH- | Mono- and polyunsaturated fatty acids Olefinic protons |
| 2 | 5.29–5.25 | >CHOCOR | Triacylglycerols |
| 3 | 4.32–4.28 4.18–4.13 | -CH2OCOR | Triacylglycerols |
| 4 | 2.80–2.75 | =CH-CH2-CH= | Linoleic acid Linolenic acid |
| 5 | 2.34–2.29 | -OCO-CH2- | Acyl chains in unsaturated fatty acids |
| 6 | 2.09–1.99 | -CH2-CH=CH- | Mono- and polyunsaturated fatty acids |
| 7 | 1.65–1.58 | SQUA | Squalene |
| –OCO-CH2-CH2- | Acyl chains | ||
| 8 | 1.40–1.23 | -(CH2)n- | Acyl chains |
| 9 | 0.91–0.89 0.89–0.87 | -CH2-CH3 | Linoleic acid Linolenic acid |
| 10 | 1.00–0.96 | -CH=CH-CH2-CH3 | Linolenic acid |
| Number | ALA | LA | OLEIC | TOT UNSAT | TOT SAT | MUFA | PUFA |
|---|---|---|---|---|---|---|---|
| [%] | |||||||
| 1 | 0.00 | 14.68 | 68.27 | 82.96 | 17.04 | 53.02 | 29.94 |
| 2 | 0.00 | 22.76 | 63.21 | 85.97 | 14.03 | 39.89 | 46.08 |
| 3 | 0.00 | 13.03 | 62.25 | 75.28 | 24.72 | 49.07 | 26.21 |
| 4 | 0.00 | 19.12 | 74.09 | 93.21 | 6.79 | 55.35 | 37.86 |
| 5 | 0.00 | 13.37 | 71.24 | 84.61 | 15.39 | 57.64 | 26.97 |
| 6 | 0.00 | 18.58 | 73.73 | 92.31 | 7.69 | 55.22 | 37.09 |
| 7 | 3.56 | 27.97 | 55.05 | 86.59 | 13.41 | 24.09 | 62.50 |
| Number | Country of Purchase (Origin on Label) | Composition According to Manufacturer |
|---|---|---|
| 1 | Poland (Morocco) | 100% argan oil |
| 2 | Poland | 100% argan oil |
| 3 | Poland (Morocco) | 100% argan oil |
| 4 | Poland | 100% argan oil |
| 5 | Turkey | 100% argan oil |
| 6 | Poland | 100% argan oil |
| 7 | Morocco (Morocco) | 100% argan oil |
Disclaimer/Publisher’s Note: The statements, opinions and data contained in all publications are solely those of the individual author(s) and contributor(s) and not of MDPI and/or the editor(s). MDPI and/or the editor(s) disclaim responsibility for any injury to people or property resulting from any ideas, methods, instructions or products referred to in the content. |
© 2025 by the authors. Licensee MDPI, Basel, Switzerland. This article is an open access article distributed under the terms and conditions of the Creative Commons Attribution (CC BY) license (https://creativecommons.org/licenses/by/4.0/).
Share and Cite
Słomczyńska, P.; Siudem, P.; Białek, A.; Kaźmierski, S.; Paradowska, K. The Application of 1H Nuclear Magnetic Resonance (NMR), Gas Chromatography (GC) and Ultraviolet–Visible (UV-Vis) Spectroscopy Techniques to the Analysis of the Fatty Acid Profile as Quality of Argan Oil. Int. J. Mol. Sci. 2025, 26, 5322. https://doi.org/10.3390/ijms26115322
Słomczyńska P, Siudem P, Białek A, Kaźmierski S, Paradowska K. The Application of 1H Nuclear Magnetic Resonance (NMR), Gas Chromatography (GC) and Ultraviolet–Visible (UV-Vis) Spectroscopy Techniques to the Analysis of the Fatty Acid Profile as Quality of Argan Oil. International Journal of Molecular Sciences. 2025; 26(11):5322. https://doi.org/10.3390/ijms26115322
Chicago/Turabian StyleSłomczyńska, Patrycja, Paweł Siudem, Agnieszka Białek, Sławomir Kaźmierski, and Katarzyna Paradowska. 2025. "The Application of 1H Nuclear Magnetic Resonance (NMR), Gas Chromatography (GC) and Ultraviolet–Visible (UV-Vis) Spectroscopy Techniques to the Analysis of the Fatty Acid Profile as Quality of Argan Oil" International Journal of Molecular Sciences 26, no. 11: 5322. https://doi.org/10.3390/ijms26115322
APA StyleSłomczyńska, P., Siudem, P., Białek, A., Kaźmierski, S., & Paradowska, K. (2025). The Application of 1H Nuclear Magnetic Resonance (NMR), Gas Chromatography (GC) and Ultraviolet–Visible (UV-Vis) Spectroscopy Techniques to the Analysis of the Fatty Acid Profile as Quality of Argan Oil. International Journal of Molecular Sciences, 26(11), 5322. https://doi.org/10.3390/ijms26115322