Article

Physiological Muscle Function Is Controlled by the Skeletal Endocannabinoid System in Murine Skeletal Muscles

by
Nyamkhuu Ganbat
1,2,†,
Zoltán Singlár
1,†,
Péter Szentesi
1,3,
Elena Lilliu
4,
Zoltán Márton Kohler
5,
László Juhász
6,
Anikó Keller-Pintér
5,
Xaver Koenig
4,
Fabio Arturo Iannotti
7,
László Csernoch
1,3 and
Mónika Sztretye
1,3,*
1
Department of Physiology, Faculty of Medicine, University of Debrecen, 4032 Debrecen, Hungary
2
Doctoral School of Molecular Medicine, University of Debrecen, 4032 Debrecen, Hungary
3
HUN-REN Cell Physiology Research Group, University of Debrecen, 4032 Debrecen, Hungary
4
Department of Neurophysiology and Neuropharmacology, Center for Physiology and Pharmacology, Medical University of Vienna, 1090 Vienna, Austria
5
Department of Biochemistry, Albert Szent-Györgyi Medical School, University of Szeged, 6720 Szeged, Hungary
6
Institute of Surgical Research, Albert Szent-Györgyi Medical School, University of Szeged, 6720 Szeged, Hungary
7
Institute of Biomolecular Chemistry (ICB), National Research Council of Italy (CNR), 80078 Pozzuoli, NA, Italy
*
Author to whom correspondence should be addressed.
These authors contributed equally to this work.
Int. J. Mol. Sci. 2025, 26(11), 5291; https://doi.org/10.3390/ijms26115291
Submission received: 3 April 2025 / Revised: 23 May 2025 / Accepted: 27 May 2025 / Published: 30 May 2025
(This article belongs to the Special Issue Calcium Homeostasis of Cells in Health and Disease: Third Edition)

Abstract

The endocannabinoid system (ECS) is known to regulate crucial bodily functions, including healthy muscle activity. However, its precise roles in normal skeletal muscle function and the development of muscle disorders remain unclear. Previously, we developed a tamoxifen-inducible, skeletal muscle-specific CB1 receptor knockdown (skmCB1-KD) mouse model using the Cre/LoxP system. In this study, we aimed to clarify the mechanisms behind the observed reduction in muscle force generation in these mice. To investigate this, we analyzed calcium dynamics following electrical stimulation-induced muscle fatigue, assessed store-operated calcium entry (SOCE), and performed functional analysis of mitochondrial respiration. Our findings suggest that the reduced muscle performance observed in vivo likely arises from interconnected alterations in ATP production by mitochondria. Moreover, in skmCB1-KD mice, we detected a significant decrease in a component of the respiratory chain (complex IV) and a slowed dissipation of mitochondrial membrane potential upon the addition of an un-coupler (FCCP).

Graphical Abstract

1. Introduction

Skeletal muscle, the largest organ in our body, comprises about 40 to 50% of total body mass and serves crucial roles for overall health, not only for maintaining posture and enabling mobility but also for regulating whole-body homeostasis and metabolism [1,2].
Muscle contraction underlying force generation is a result of a strict sequence of processes called excitation–contraction coupling (ECC) [3,4]. Any alteration of this well-orchestrated sequence of events could lead to altered force generation. During muscle contraction and force generation, chemical energy (ATP) is continuously synthesized and broken down into ADP and AMP. ATP, which acts as fuel for the cell through oxidative phosphorylation (OXPHOS), is produced by the mitochondria, a key organelle that occupies about 10–15% of the muscle fiber volume [5]. Mitochondria, these highly dynamic organelles that constantly undergo fission and fusion, are essential in decoding intracellular calcium (Ca2+) signals, thus contributing to the spatiotemporal distribution of intracellular Ca2+ concentrations [6,7,8,9]. Mitochondrial morphology is essential for ATP synthesis, and this dynamism allows for the maintenance of the organelle membrane potential (ψm), which serves as the driving force for ATP synthesis within the electron transport chain (ETC).
Store-operated calcium entry (SOCE) is a Ca2+ influx pathway activated upon sarcoplasmic reticulum (SR) Ca2+ store depletion [10]. This process is based on the assembly and interaction of two proteins: stromal interaction molecule 1 (STIM1), a calcium sensor located in the SR membrane, and Orai1, a calcium channel located in the plasmalemma [11,12,13]. There are two distinct appearances of SOCE. The phasic (p)SOCE reflects the transient nature of the Ca2+ flux and is activated with every action potential when small Ca2+ depletions occur [14]. On the other hand, chronic (c)SOCE is slower and longer lasting and is activated following a partial (or virtually almost complete) SR depletion. This is either induced ex vivo through pharmacological activation of RyR1 or SERCA, or it occurs in vivo due to leaky RyR1s in pathological states like myopathies [15,16].
The endocannabinoid system (ECS) is a broadly distributed signaling network that is involved in a wide array of physiological processes such as mood and emotion, pain modulation, immune response, appetite, and metabolism [17,18,19,20]. The components of the system are the cannabinoid receptors (CB1R and CB2R), endocannabinoids (the two main ones are anandamide and 2-arachidonoyl-glycerol), and various enzymes and transport systems involved in their synthesis and degradation [21,22,23]. CB1Rs (encoded by the Cnr1 gene) are the most abundant in muscle, being involved in cellular functions like autophagy [24], motor control and coordination [25], energy balance and metabolism [26,27], and exerting several biochemical effects, including ATP production and modulation of reactive oxygen species (ROS) [28]. In addition to CB1Rs located on the cell membrane, referred to as peripheral CB1 (pCB1R) [29,30], a population is present in muscle mitochondria (mtCB1R), where it regulates mitochondrial oxidative activity [31,32]. A recent study showed that the global deletion of CB1Rs induced a fast-to-slow-twitch fiber type conversion in mouse M. gastrocnemius, which increased its oxidative capacity and affected its antioxidant defense systems [33]. Antagonism of CB1 receptors using synthetic agents (e.g., AM6545 or rimonabant) has uncovered several interesting effects in preclinical studies using mice. Studies have shown that CB1 antagonism can increase glucose uptake and oxygen consumption in the isolated soleus muscle of obese mice, potentially contributing to improved blood sugar control [34]. Furthermore, it enhanced muscle protein synthesis and anabolism in a mouse model of dexamethasone-induced muscle atrophy [35]. Another study described improved muscle regeneration after injury following rimonabant usage [36]. Cannabis sativa contains various compounds called phytocannabinoids, which can interact with the ECS. The two most well known are Δ9-Tetrahydrocannabinol (THC), which is the primary psychoactive component that binds to both CB1 and CB2 receptors, acting as an agonist (activator). In human muscle, THC could potentially indirectly impact muscle function through central nervous system effects on motor control, coordination, and pain perception. Cannabidiol (CBD), another naturally occurring chemical compound found in the Cannabis plant, is non-psychoactive and has a more complex interaction with the ECS. Nevertheless, studies have shown that CBD acts as a negative allosteric modulator of CB1 receptors, potentially reducing the effects of THC and endocannabinoids at this receptor [37].
In this study, using a combination of genetic and pharmacological approaches, we aimed to unravel the intricate interplay between ECS signaling and skeletal muscle physiology using a muscle-specific CB1-KD mouse model. Our work sheds light on the role of ECS, specifically CB1Rs, in murine skeletal muscle, providing new insight into the mechanisms of ECS-mediated regulation of skeletal muscle function, force generation, mitochondrial energetics, and overall muscle contraction. This creates new opportunities for therapeutic approaches focused on enhancing muscle health, metabolism, and function.

2. Results

2.1. In Vivo Muscle Force and Motor Coordination Are Depressed in skmCB1-KD Mice

Our workgroup previously generated and characterized a tamoxifen-inducible skeletal muscle-specific CB1R knockdown (KD) mouse model (skmCB1-KD; [38]). However, a key question was left unaddressed: what was the mechanism behind the altered force production (both in vivo and in vitro) observed in these animals? Here, we decided to further investigate these aspects and tried to elucidate the causes and reveal the molecular mechanisms underlying altered muscle performance in skmCB1-KD mice.
To induce skmCB1R-KD, we treated mice for 2 months with tamoxifen starting at one month of animal age (Figure 1A). The chosen tamoxifen treatment substantially reduces CB1R at mRNA and protein levels, as demonstrated in our earlier work [38]. The CB1 downregulation (on mRNA level) was verified in M. tibialis anterior samples (inset Figure 1A). Genotyping beforehand at 3 to 4 weeks of age allowed to assign animals into a Cre-recombinase negative (Cre−/−) and positive (Cre+/−) group, which served as control or allowed for skeletal muscle-specific tamoxifen-induced KD of CB1, respectively. Regular measurements of body weight, assessment of in vivo force using grip tests, as well as Rota-Rod evaluations (Figure 1A) were performed immediately before, 1, and 2 months after the initiation of tamoxifen treatment. The average weight of the mice was comparable across all tested time points before and after tamoxifen administration and did not differ between control (Cre−/−) and CB1R-KD (Cre+/−) mice (Figure 1C). To assess in vivo muscle performance and motor coordination, we measured the latency to fall for each mouse while the accelerating speed of the Rota-Rod was increased gradually from 4 to 300 rpm in 5 min (see the protocol in Figure 1B). The averaged data of these experiments clearly showed that already 1 month into the tamoxifen treatment the CB1R-KD (Cre+/−) mice performed worse, and their motor coordination was hindered (Figure 1D). While the latency to fall is a widely used parameter to evaluate motor performance, it is also influenced by motor coordination, balance and learning. As a second assessment of in vivo force production, we also performed measurements of the grip strength. When normalized to body weight the in vivo grip force was markedly declined at the end of the tamoxifen diet period in CB1R-KD mice compared to the control group (Figure 1E, 4.65 ± 0.23 mN/g for Cre−/− vs. 3.77 ± 0.37* mN/g for Cre+/−, * p < 0.05). These data are in agreement with our previous findings (Figure 1H, from reference [38]).

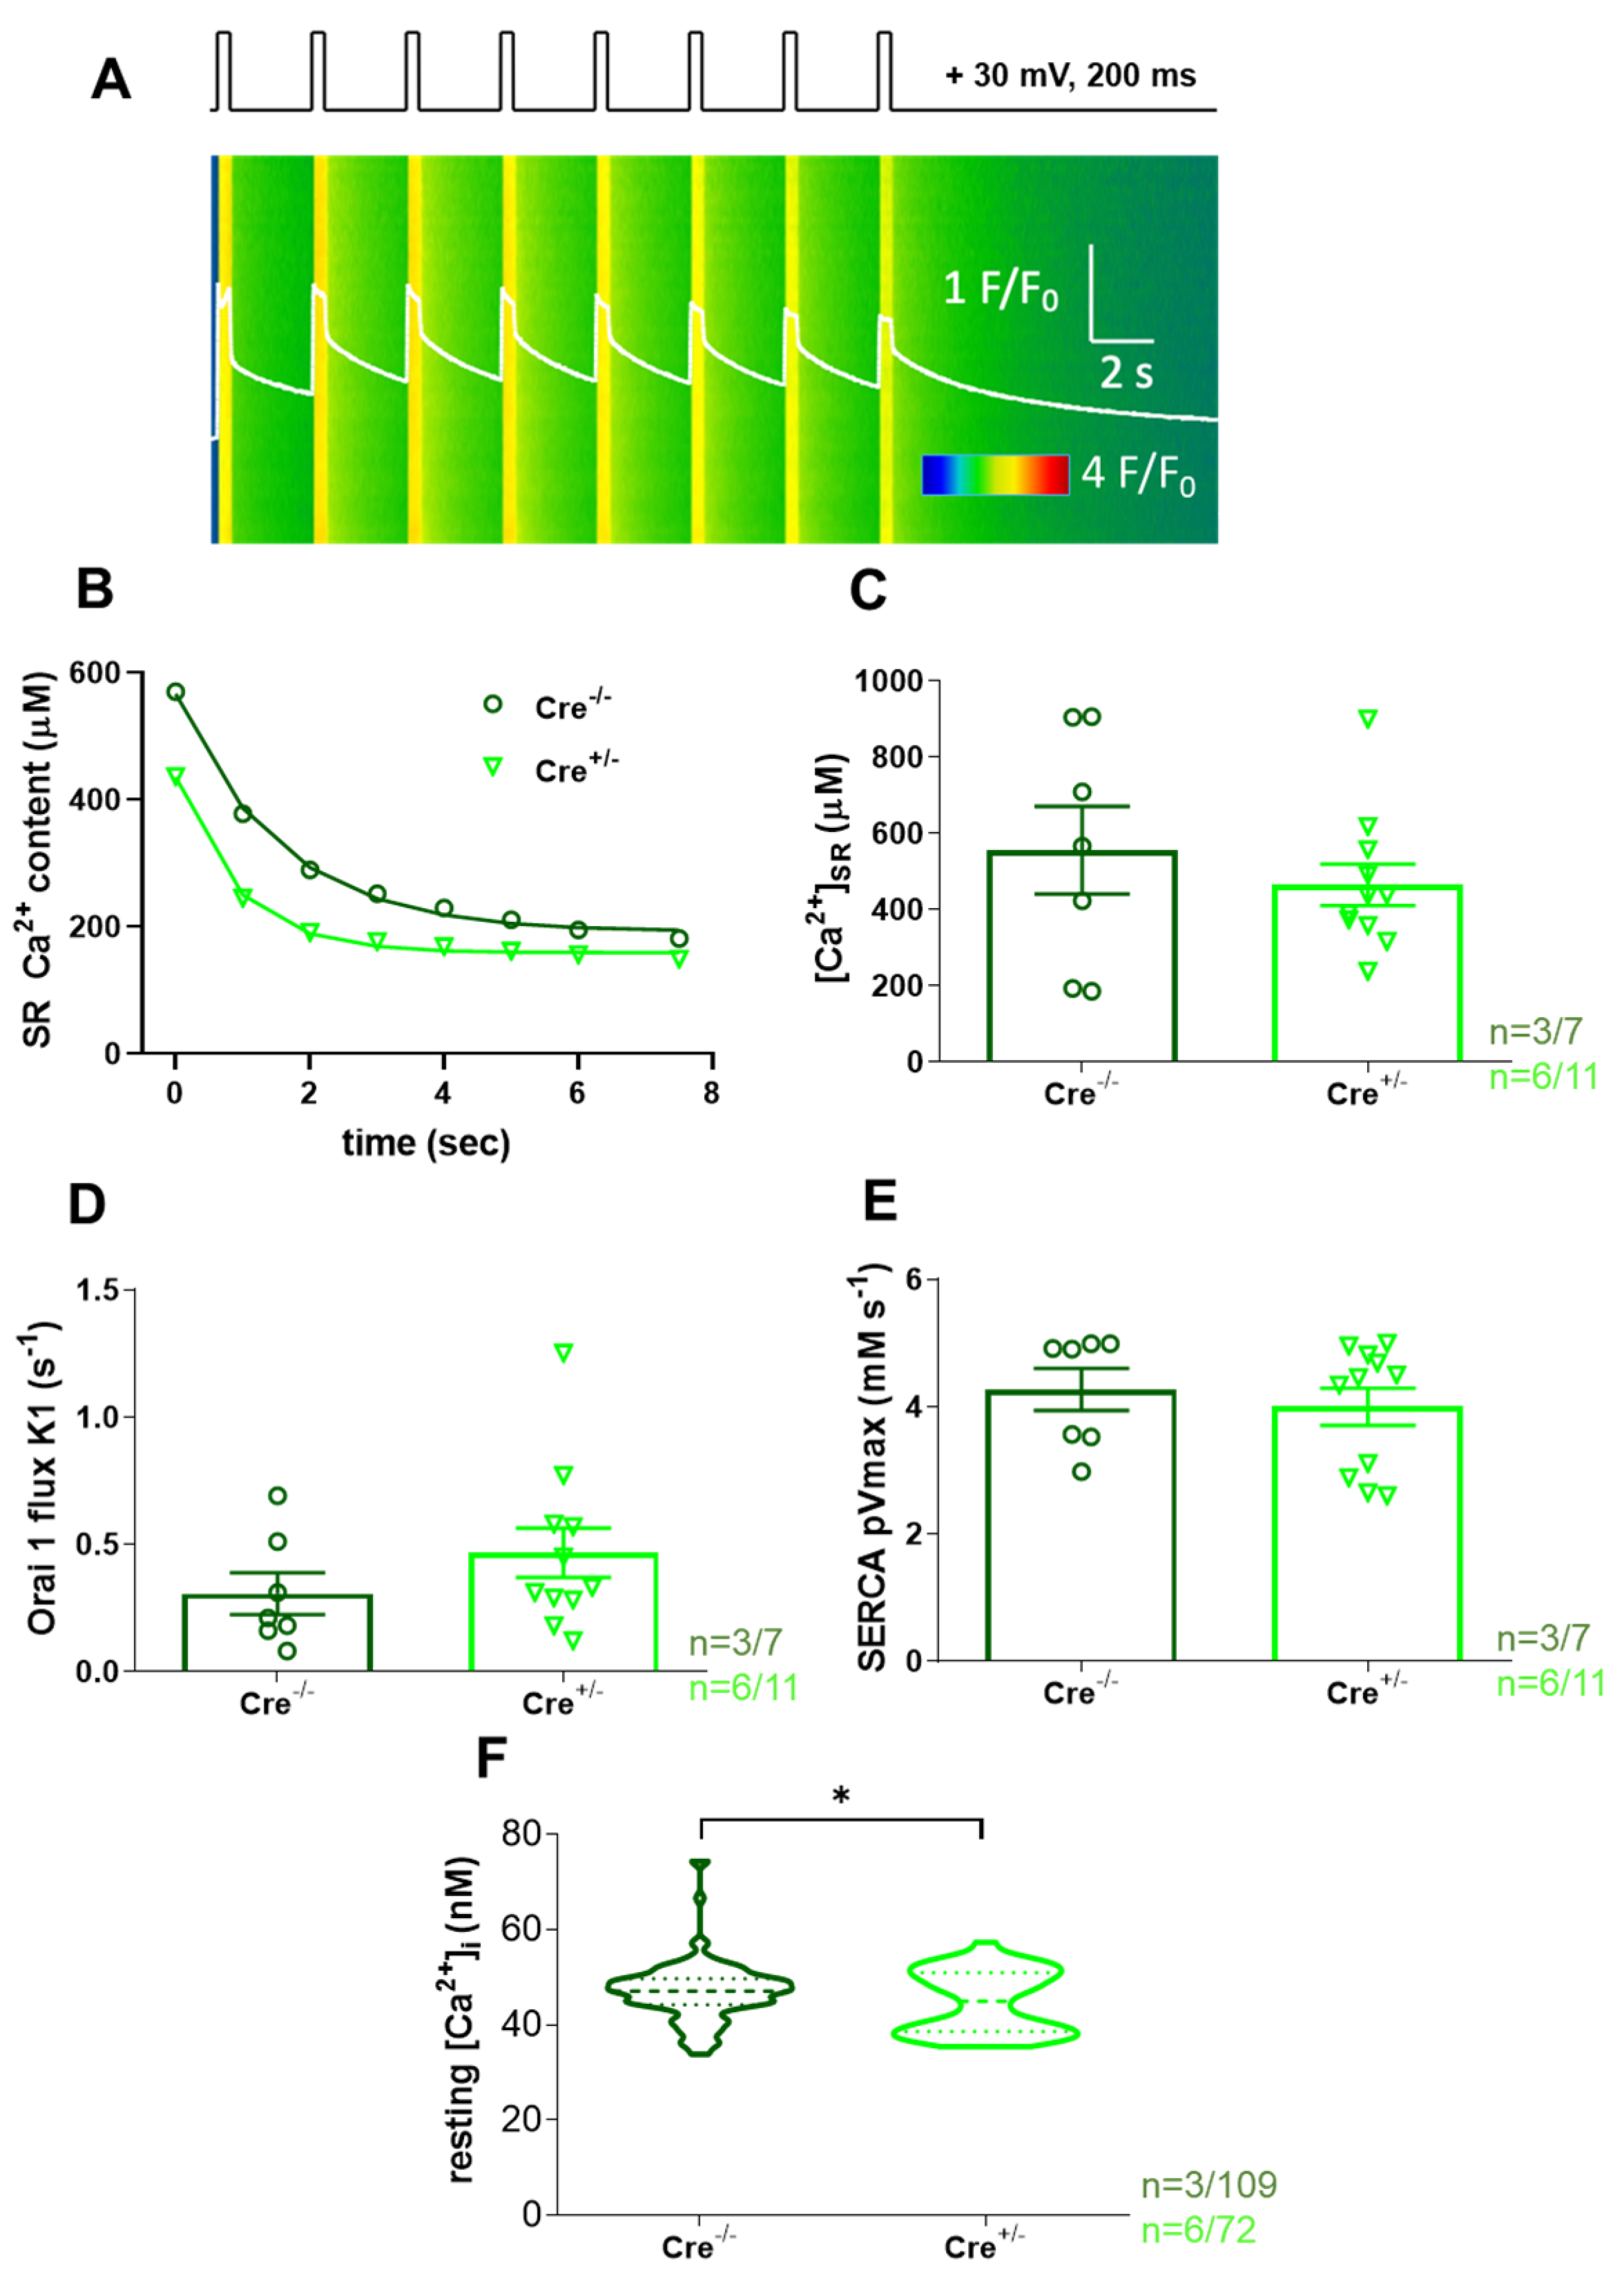
2.2. SOCE Activity Is Preserved in skmCB1-KD Mice

We and others have shown earlier that store-operated calcium entry (SOCE) plays an important role in regulating fiber calcium content [14,39,40] and may thus contribute to the reduction in muscle function.
Here, we sought to investigate SOCE using the skinned fiber technique [41], which allows high-resolution measurement of t-system membrane Ca2+ fluxes, including SOCE [41,42]. Briefly, the t-tubular system of M. extensor digitorum longus (EDL) fibers from Cre−/− and Cre+/− mice was loaded with the low-affinity Ca2+-sensitive dye Rhod-5N before fiber skinning (Figure 2A). Calibrated measurement of Rhod-5N fluorescence from within the t-tubular system revealed a slight but significant difference in steady-state t-system Ca2+ ([Ca2+]tsys) under resting conditions when comparing Cre−/− to Cre+/− (compare columns 1 and 3 in Figure 2A). We then induced SOCE by activating the RyR1s via exposure of the fiber to a solution containing nominally 0 mM free Mg2+ and Ca2+, and 30 mM caffeine, respectively. Afterwards, we assessed the reuptake of Ca2+ into the t-system after re-exposing the fiber to a physiological free [Ca2+]cyto of 67 nM. Steady-state Ca2+ levels after re-uptake were smaller compared to respective baseline values for both groups; however, the measured values turned out to be significantly smaller for Cre+/− specimens (Figure 2B, columns 2 and 4). The pharmacological activation of SOCE and concomitant depletion of the t-system is fully reversible, such that the t-system reloads with Ca2+ upon restoration of physiological [Ca2+]cyto and [Mg2+]cyto values [43]. Such a sequence of depletion and reuptake was repeated at different [Ca2+]cyto concentrations of 28, 67, 200, and 1342 nM for Cre−/− and Cre+/− fibers; original representative traces can be seen in Figure 2C,D, respectively. Evaluating [Ca2+]tsys after re-uptake revealed consistently smaller (albeit non-significant) values in Cre+/− compared to Cre−/− for all Ca2+ concentrations tested (Figure 2E). However, peak t-system uptake flux was not altered under the same conditions (Figure 2F), except for the highest concentration tested. When we evaluated the SOCE flux determined as the peak t-system Ca2+ release flux upon 30 mM caffeine application in zero Ca2+/Mg2+conditions, we noticed a reduction (albeit non-significant) in the absolute values by trend (Figure 2G). The peak t-system fluxes derived in this manner are, however, dependent on the driving force between the t-system and the cytosol. Because [Ca2+]t-sys was reduced in Cre+/− fibers (Figure 2E), we therefore plotted respective flux values over the ambient steady state [Ca2+]t-sys values immediately before depletion. A linear fit to these data is proportional to the t-system Ca2+ permeability and, as such, a relative measure of SOCE. Here, the linear relationship follows from the Goldman–Hodgkin–Katz current equation under the assumption of a sufficiently negative resting membrane potential close to −90 mV and a much larger Ca2+ concentration in the t-system compared to the cytosol [10] (see Methods section), two conditions that are readily met in the chosen preparation. When fitting respective data, both Cre−/− and Cre+/− samples showed a good linear correlation but were not different from each other (F-test; p = 0.77).
In agreement with SOCE being unaltered in CB1R-KD fibers, the protein expression of Orai1 and STIM1, the two key proteins thought to underlie SOCE in skeletal muscle [11,12,13], were likewise unaltered in Cre+/− specimens when compared to Cre−/− (Supplementary Figure S1A–C).
Collectively, these data suggest that the knockdown of CB1R did not alter SOCE but affected the ability of the fiber’s t-system to readily take up Ca2+ after depletion.
The t-system Ca2+-uptake proteins Na+/Ca2+ exchanger (NCX) and/or plasma membrane Ca2+ ATPase (PMCA) are known to equilibrate Ca2+ gradients across the t-system membrane in a bidirectional manner [43,44]. Ultimately, we found no changes in the expression of the latter on the protein level (Supplementary Figure S1D,E), suggesting that the observed reduction in t-system Ca2+-reuptake capacity may not relate to changes in these proteins but rather reflect changes at the level of the SR, such as altered SERCA or perhaps RyR1 function.

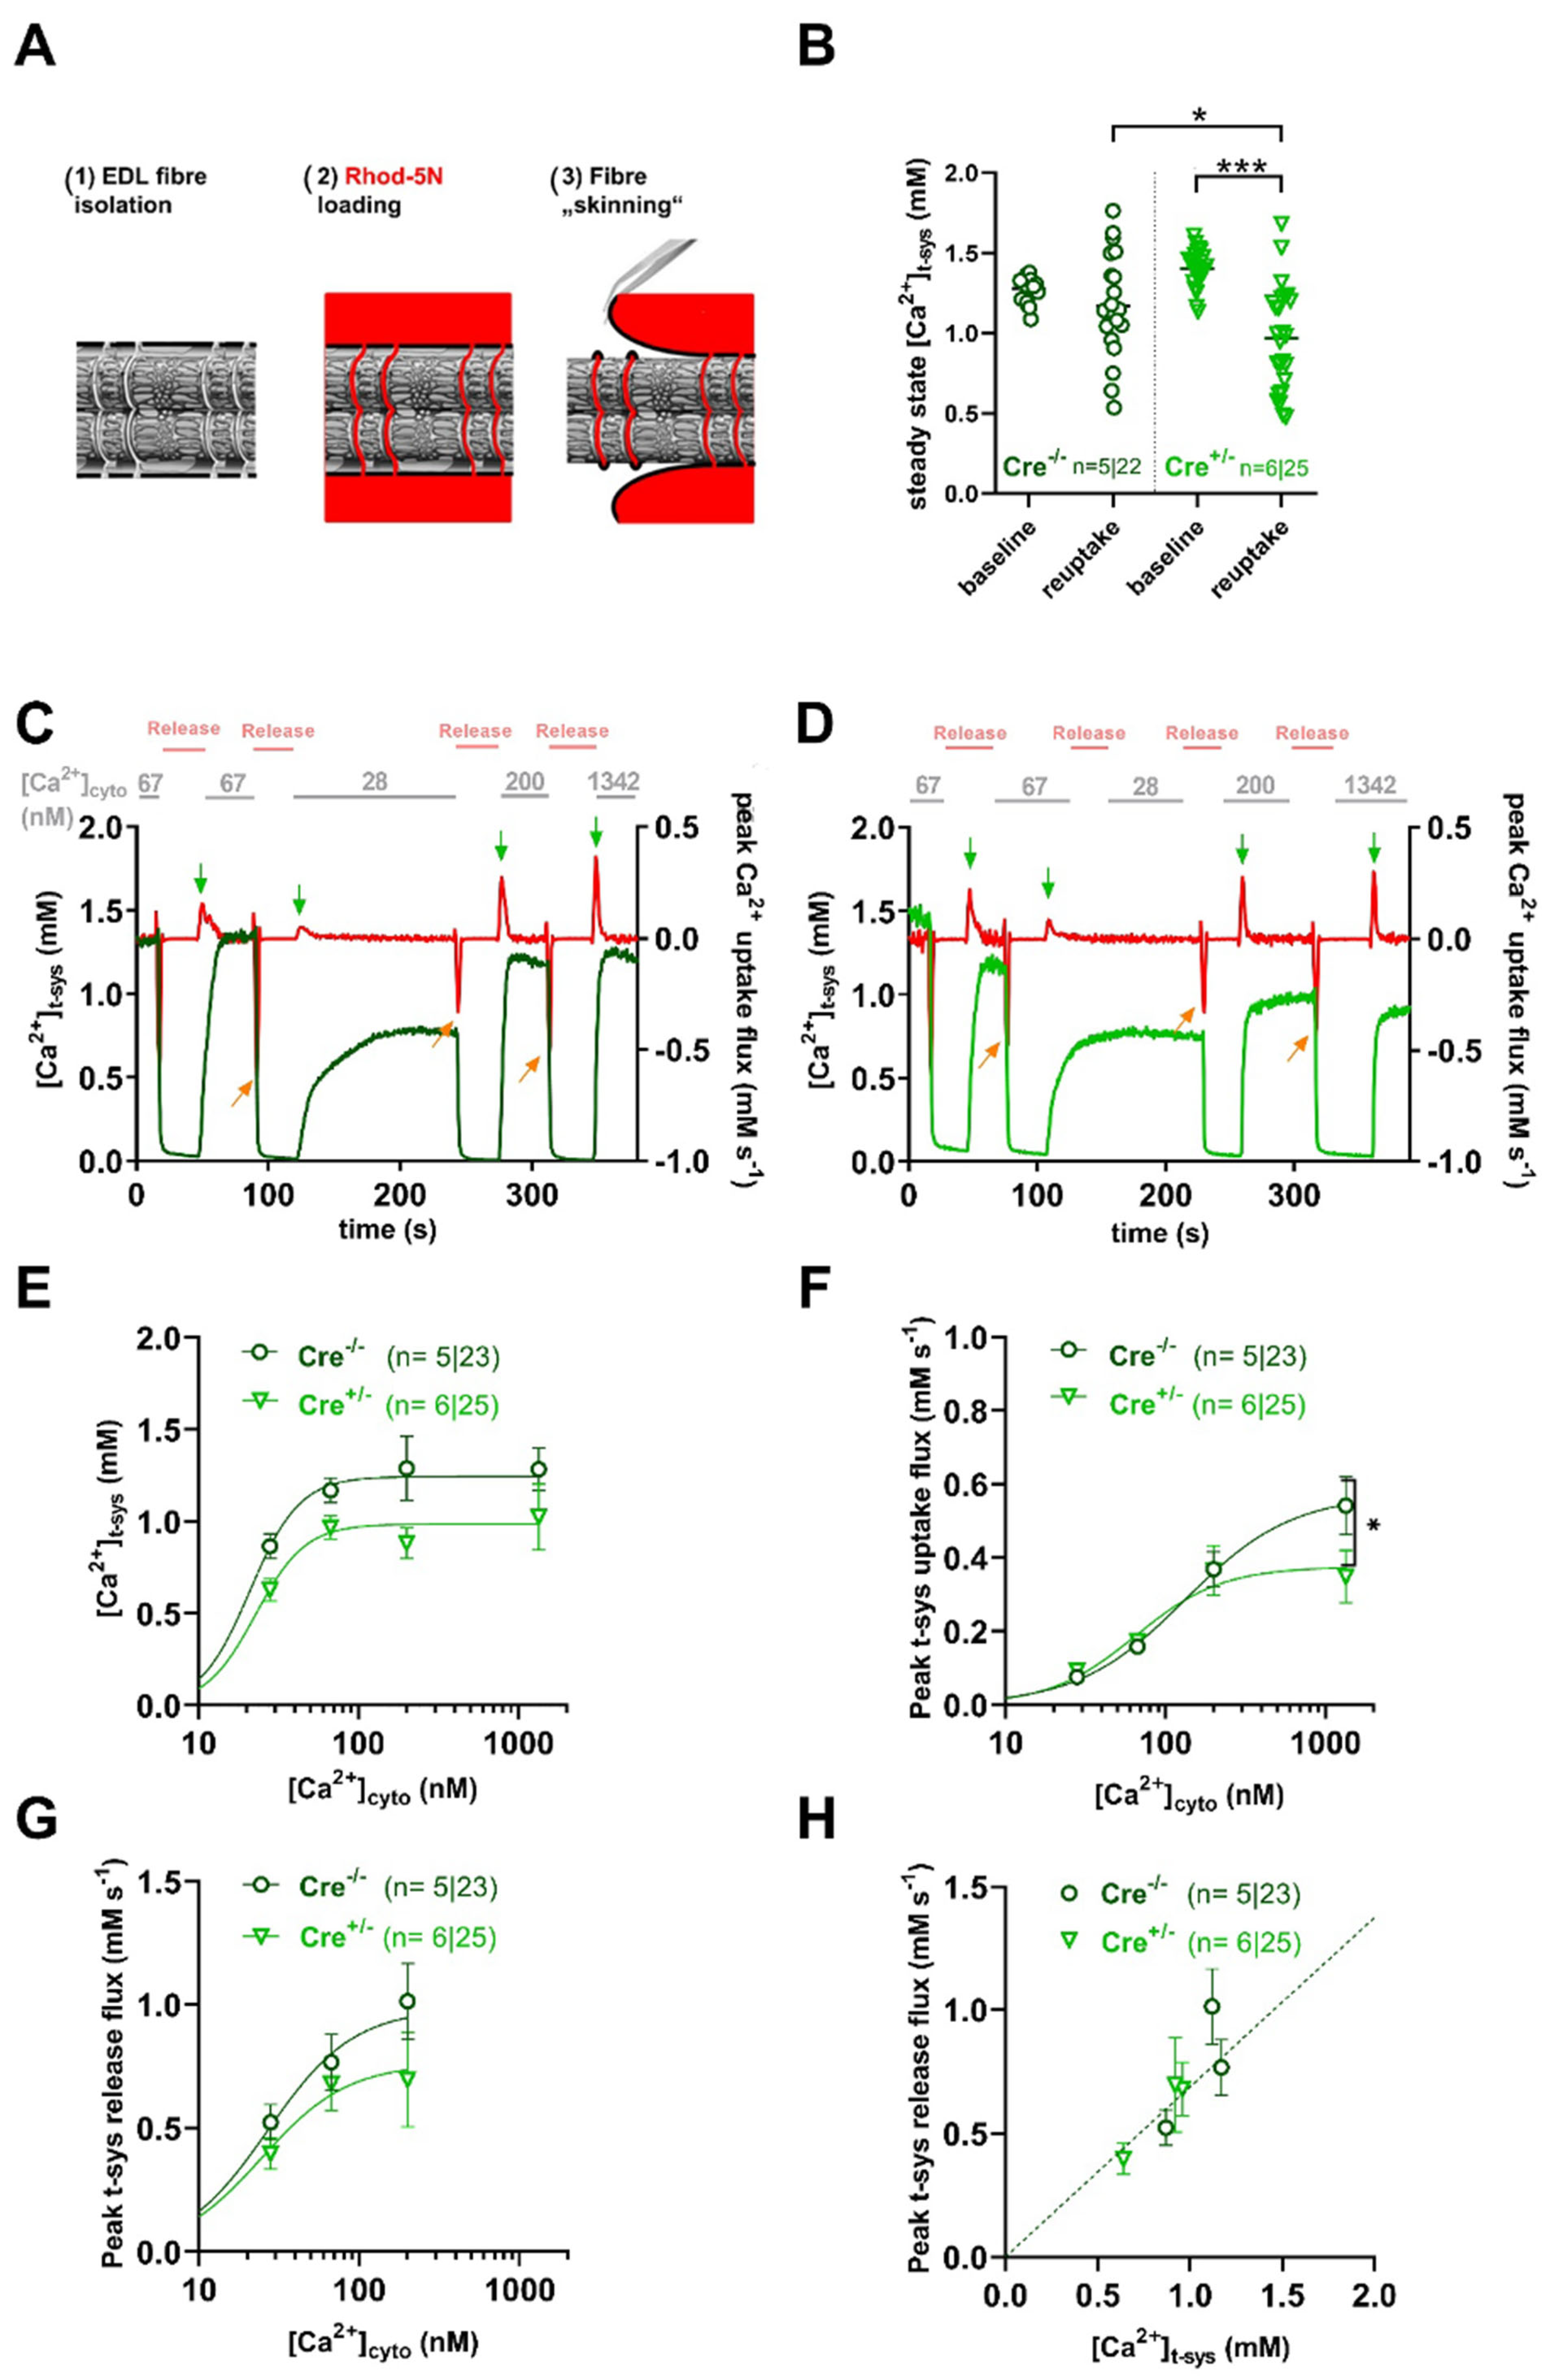
2.3. Calcium Homeostasis Is Preserved in skmCB1-KD Mice

Investigating a global CB1 knockout (KO) murine mouse model, our workgroup proposed earlier that CB1Rs are involved in the regulation of Ca2+ homeostasis of the skeletal muscle via a Gi protein and through a PKA-mediated mechanism [45]. Furthermore, our laboratory demonstrated that an immediate refilling of the SR following muscle activation would also require the proper functioning of SOCE [39].
Thus, to specifically investigate the putative involvement of ECS in these processes within the skeletal muscles of the skmCB1-KD mouse model, we monitored the decay of the Ca2+ release following electrical stimulation in control (Cre−/−) and skmCB1-KD (Cre+/−) enzymatically dissociated M. flexor digitorum brevis (FDB) fibers. This was performed in a series of Ca2+ transients triggered by voltage depolarizations with the pattern illustrated in Figure 3A (top). In Figure 3A, the fluorescence transient depicted as F/F0 is shown as a white trace in a single FDB fiber isolated from a Cre+/− mouse.
In Figure 3B, the SR Ca2+ content decline induced by voltage clamp stimulation was fitted with an exponential function for one representative Cre−/− and one Cre+/− FDB fiber. For the given examples, the SR Ca2+ decline at the end of the protocol was nearly identical in the two samples (190.7 µM for Cre−/− vs. 158.7 µM for Cre+/−). One must note that the light green trace for Cre+/− remains below the dark green Cre−/− values, possibly suggesting a higher propensity for depletion and thus fatigue in the Cre+/− animals. Overall, these data align with the SOCE experiments performed on skinned EDL fibers (Figure 2G). Nevertheless, the calculated [Ca2+]SR was only reduced by trend in the Cre+/− fibers and thus, unaffected by Cnr1 genetic ablation (Figure 3C, 555.2 ± 114.9 µM for Cre−/− vs. 464.7 ± 54.1 µM for Cre+/−).
In summary, our data suggest moderate fatigability, compromised t-system Ca2+ handling, and negligible changes in SOCE activity in skmCB1-KD Cre+/− muscles. Our findings are in line with unaltered Orai1 flux values (K1 values, Figure 3D), as calculated with our previously introduced model.
The process of Ca2+ clearance from the cytosol in skeletal muscles is primarily accomplished by the SERCA pumps, which mediate the uptake of Ca2+ into the SR stores. In this work, the indirectly calculated SERCA pump activity was found to be preserved (Figure 3E) following CB1 downregulation (4.26 ± 0.32 mMs−1 for Cre−/− vs. 3.99 ± 0.29 mMs−1 for Cre+/−).
Interestingly, when we measured the resting intracellular calcium concentration ([Ca2+]i) in FDB fibers loaded with the ratiometric dye Fura-2 AM, we found a small but significant reduction in Cre+/− fibers (Figure 3F, 47.1 ± 0.6 nM for Cre−/− vs. 44.9 ± 0.8* nM for Cre+/−, with * p < 0.03).
Taken together, our data suggest only minor alterations of Ca2+ homeostasis in CB1R-KD fibers. However, we believe these alterations might not be the (sole) reason behind the smaller in vivo grip force observed in this study and the decrease in vitro tetanic force demonstrated in our earlier work [38].

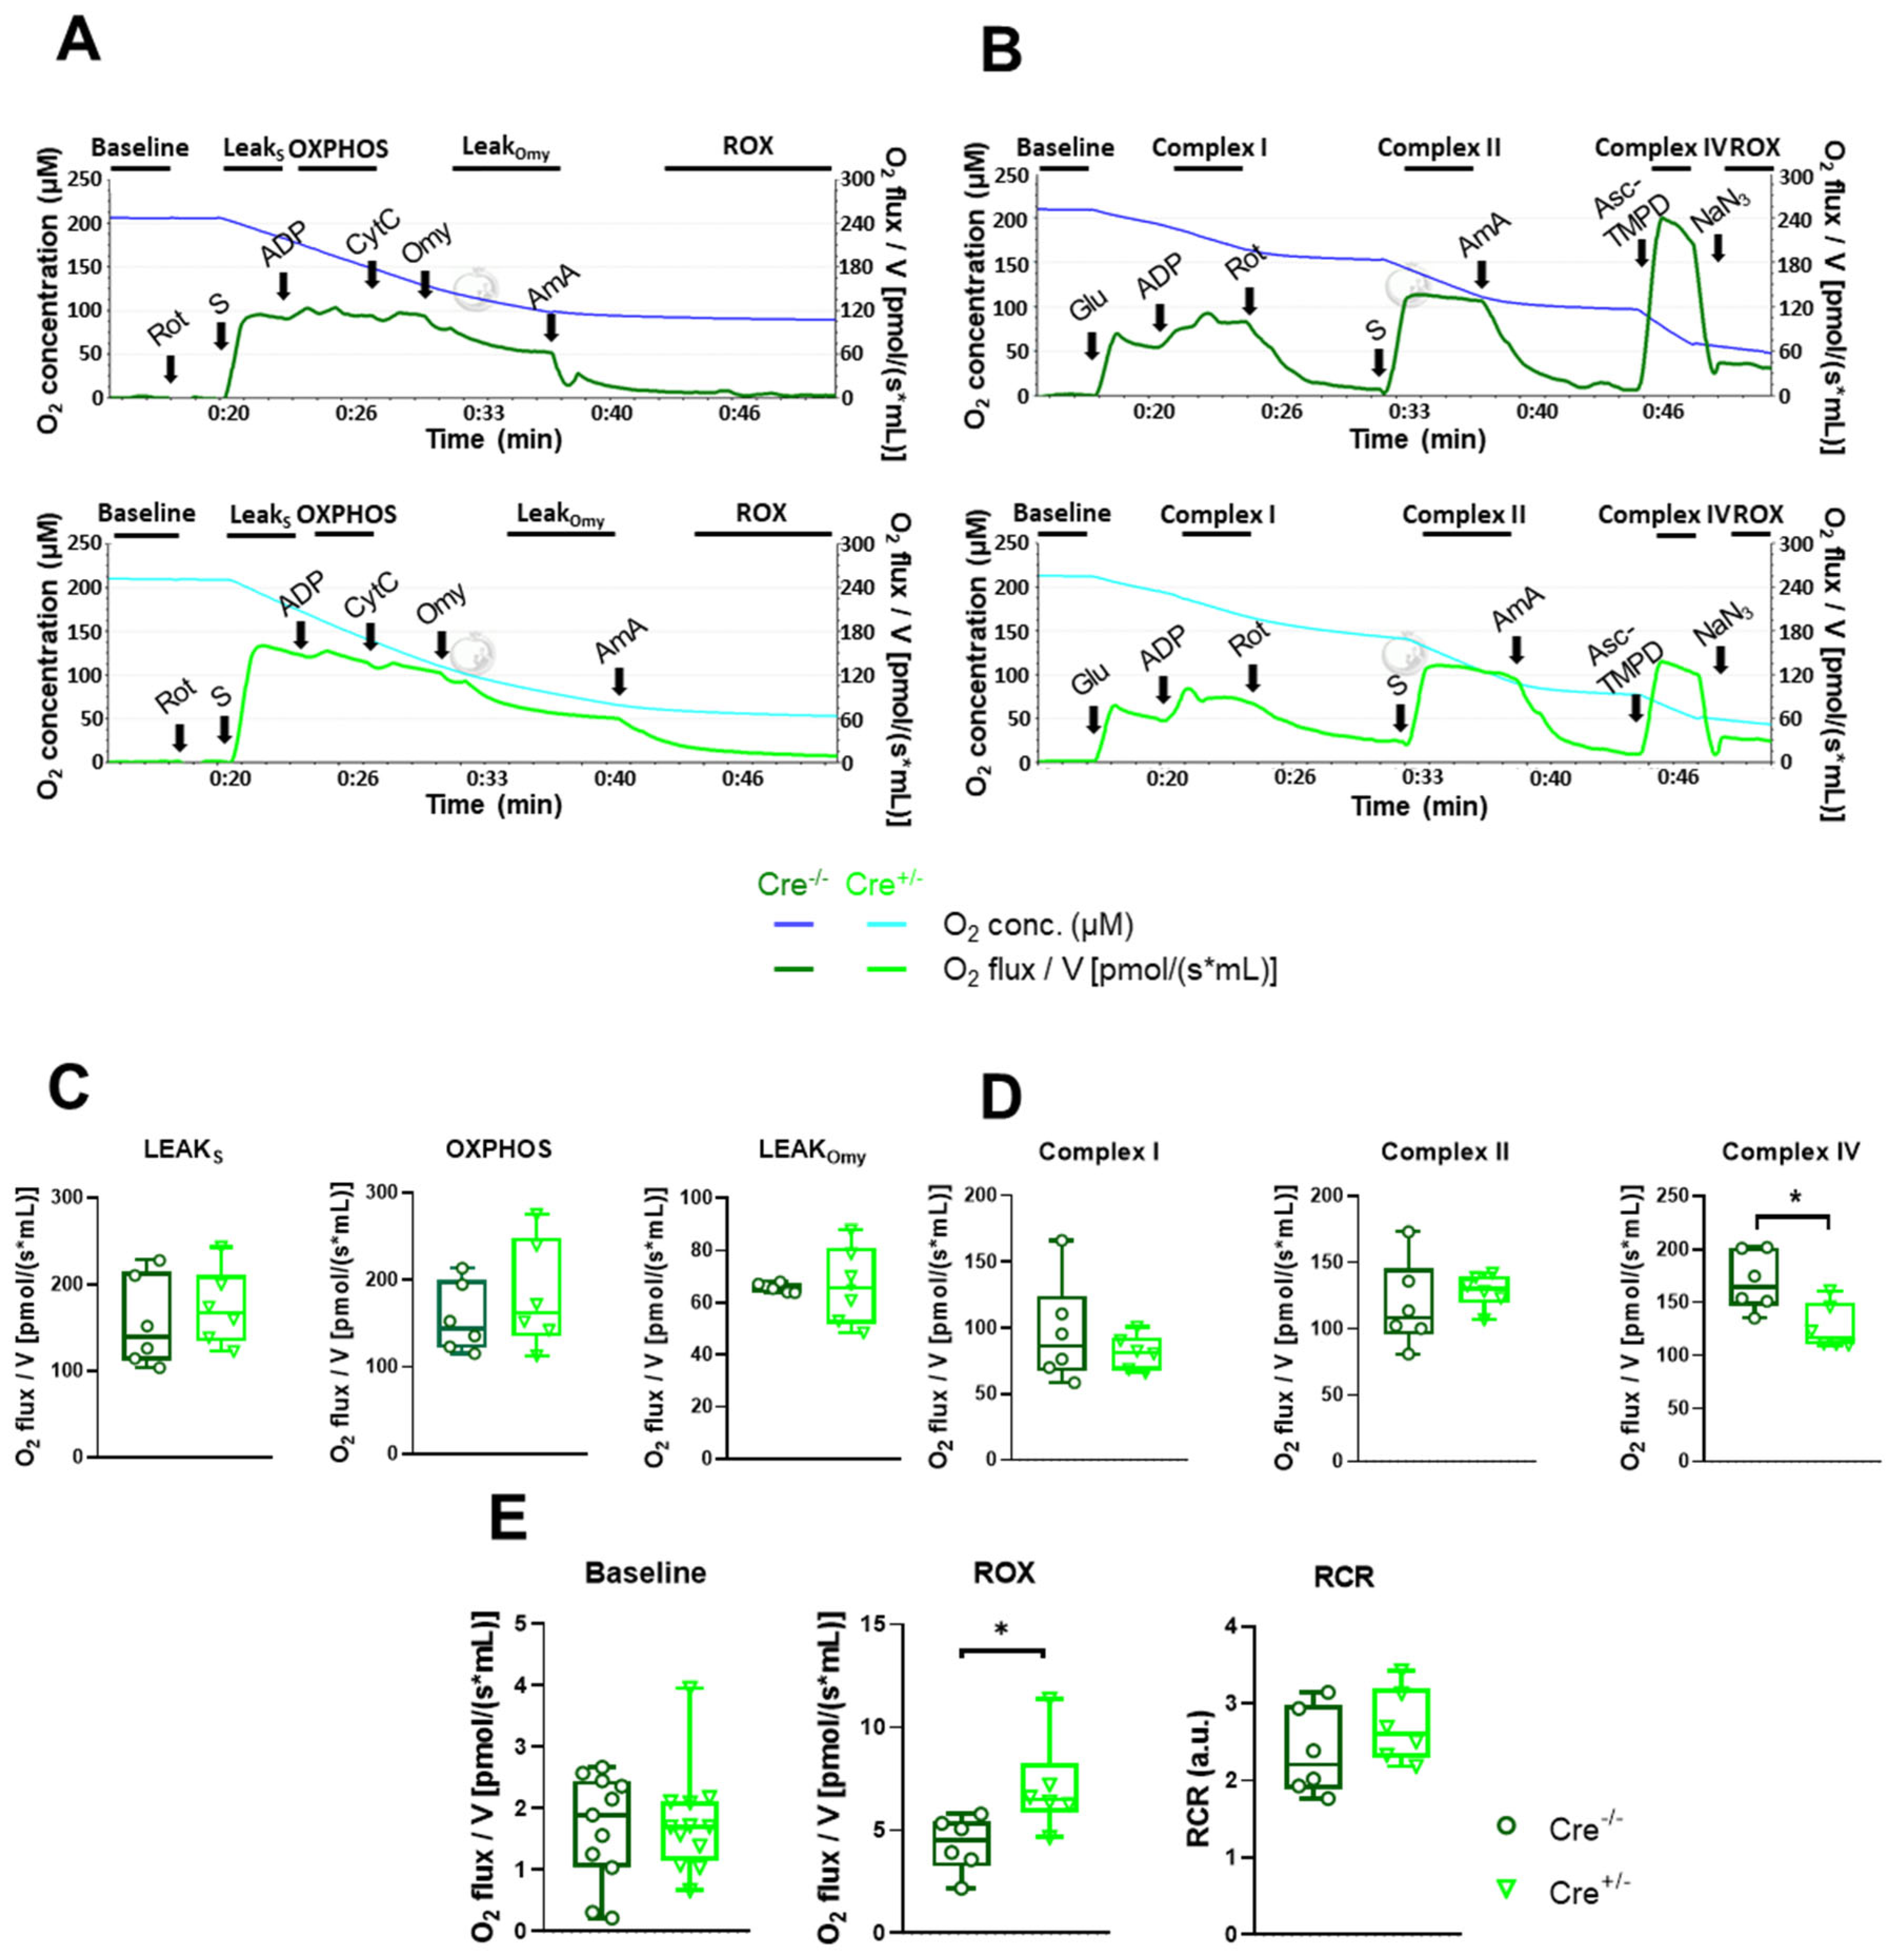
2.4. Mitochondrial Function Undergoes Modest Alterations in skmCB1-KD Mice

Mitochondria play a key role in maintaining skeletal muscle function, regulating oxidative stress, calcium homeostasis, and cellular respiration. Earlier, we proposed a role of CB1Rs and thus cannabinoid signaling in maintaining proper muscle function and mitochondrial morphology [38]. Here, we aimed to investigate whether the previously observed altered mitochondrial morphology following skeletal CB1R downregulation is also accompanied by changes in mitochondrial function. To test our hypothesis, we used high-resolution respirometry and two different protocols (short and long) to analyze potential changes in the mitochondrial respiration of M. gastrocnemius fibers isolated from the hind limbs of Cre−/− and Cre+/− mice.
First, we applied the short respiration protocol (Figure 4A). This allowed us to determine OXPHOS capacity and leak respiration before and after oligomycin (Omy) application, which inhibits ATP synthesis, resulting in a resting or unphosphorylated state (Figure 4C). Furthermore, routine or baseline respiration, residual oxygen consumption (ROX), and the respiratory control ratio (RCR) were also measured (Figure 4E). We did not observe any differences in these parameters upon CB1R knockdown. An exception was the increase in ROX (4.32 ± 0.54 pmol/s mL for Cre−/− vs. 7.07 ± 0.92* pmol/s mL for Cre+/−, * p < 0.05), which was obtained after inhibition of the electron transport chain pathway. Various cellular enzymes that consume O2 and promote autoxidation reactions give rise to ROX, including peroxidase and oxidase activities that partially contribute to reactive oxygen species (ROS) production. The oxidative stress, thus ROS state at rest, was verified with the non-ratiometric fluorescent dye CellRox Green, but we did not find significant differences between the two specimens (Supplementary Figure S2).
Baseline and ROX were determined using the longer respiration protocol as well, along with OXPHOS linked to complex I and II and complex IV activity (Figure 4B). Among these functional values, only complex IV showed a change, specifically a significant decrease in Cre+/− samples (Figure 4D, 169.7 ± 11.3 pmol/s mL vs. 126.8 ± 8.8* pmol/s mL, * p < 0.01). The respiratory control ratio (RCR) was unchanged (Figure 4E).

2.5. Mitochondrial Dynamics Marker Protein Levels Are Preserved in skmCB1-KD Mice

Since our previous [38] and current findings pointed towards morphological and functional mitochondrial alterations in skeletal muscles upon CB1R downregulation, we next decided to examine the expression level of proteins involved in the maintenance of mitochondrial calcium homeostasis and dynamics. Mitochondrial Ca2+ uptake is driven by the calcium-sensitive regulator MICU1, which modulates mitochondrial function by enhancing ATP production through the calcium-dependent activation of specific metabolic enzymes. Here, using molecular biology tools, we reconfirmed what we described in our prior work [38]: MICU1 was significantly downregulated on the protein level in Cre+/− specimens. In the present work, we checked as well for the mitochondrial content of the voltage-dependent anion channel (VDAC), which was found unaffected by CB1 knockdown (Supplementary Figure S3A,C). These findings were paired with no detectable fiber type switch (at least on the mRNA level) (Supplementary Figure S4). Since no changes were seen on the mRNA level, this aspect was not investigated further.
We also examined mitochondrial fusion-related proteins: Mfn2, and Opa1 and found no changes, albeit a decline by trend in the latter could be identified (Supplementary Figure S5A,C,D). Drp1, a protein involved in fission processes and known to affect mitochondrial degradation, respiration, and ATP synthesis, showed a similar decline by trend following CB1 knockdown (Supplementary Figure S5A,B), but the change did not reach statistical significance.

2.6. FCCP-Dependent Dissipation of Mitochondrial Membrane Potential Is Delayed in skmCB1-KD Mice

The mitochondrial membrane potential (ΔΨm) generated by the proton pumps of complexes I, III, and IV is an essential component in the process of energy storage during oxidative phosphorylation, and it provides the driving force for ATP synthesis. Together with the proton gradient ΔΨm, it forms the transmembrane potential of hydrogen ions, which is harnessed to make ATP. Since our respirometry data shed light on a decline in the complex IV activity in Cre+/− mice (Figure 4D), we were interested in exploring this aspect further.
To this end, we loaded single isolated FDB fibers from both strains with 20 nM TMRE—a dye that stains exclusively live mitochondria in the cell. While continuously scanning the fiber of interest with a confocal microscope, we followed the process of ΔΨm dissipation upon the application of 1 µM FCCP, a well-known un-coupler of the electron transport chain (Figure 5A,B for Cre−/− and Figure 5C,D for Cre+/−). Exponential fitting for individual cells (similar to those presented in panels B and D) was used to assess the decay time (τ) for n = 14 Cre−/− and n = 15 Cre+/− cells obtained from 4-4 animals, respectively. The obtained τ values were averaged and plotted for both groups (Figure 5E). Based on the individual exponential fits the average decay times were τ(Cre−/−) = 125.1 ± 17.9 s and τ(Cre+/−) = 211.3 ± 32.1* s, with * p < 0.02; Figure 5F), meaning that the normalized TMRE fluorescence dissipated slower in the Cre+/− fibers. To exclude possible artifacts due to dye bleaching or leakage, we repeated the experiments in the absence of FCCP in 5 control cells from a wild-type C57Bl6 mouse, but essentially no signal loss was detected (Figure 5E, cyan symbols).

3. Discussion

In the present paper, we provide a thorough description of the role of CB1 receptors in murine skeletal muscles. We characterized the in vivo muscle grip force generation and motor coordination in skeletal muscle-specific CB1-KD mice (referred to as Cre+/− throughout the manuscript) compared to littermate control Cre−/− animals. Furthermore, we analyzed various aspects of cellular calcium homeostasis and mitochondrial respiration and function.

3.1. Muscle Force Production and Fiber Type Composition in skmCB1-KD Mice

When compared to control Cre−/− mice, we found that Cre+/− mice had reduced in vivo grip strength force and altered motor coordination (Figure 1). Gonzalez-Mariscal et al. [46] proposed that muscle-specific genetic ablation of CB1R influences muscle metabolism by decreasing fat accumulation, promoting oxidative phosphorylation, increasing muscle mass, and inducing a shift in muscle composition characterized by an enrichment of oxidative fibers. Ultimately, these changes were deemed to contribute to enhanced physical performance and an overall improvement in whole-body metabolism in CB1R knockout (KO) mice. Our current results about altered grip force development (including our earlier results on decline in vitro force production as described in Singlár et al. [38]) may seem somewhat contradictory to these findings. The main difference between the two studies might result from (a) the extent of CB1R knockdown; our inducible CB1R-KD model exhibits ~23% reduction in CB1 on the protein level. On the other hand, the study by González-Mariscal et al. [46] did not directly characterize CB1 protein expression but only the expression of Cre recombinase. Considering that their mouse model is a constitutive KO model, the degree of CB1 knockdown is presumably greater than 23%; (b) the study by González-Mariscal et al. used a constitutive CB1-KO model, where over time compensation mechanisms are likely to occur and influence overall muscle function [46].
Most of the muscles present a heterogeneous composition of slow- and fast-type fibers [47]. The spectrum of myosin heavy chain (MHC) isoforms is not fixed and can shift according to the following scheme: I↔IIa↔IIx↔IIb. Iannotti et al. reported that global CB1-KO mice have larger and more numerous muscle fibers compared to control animals [48]. Likewise, Senese et al. [33], working on the systemic CB1-KO model, described elevated oxidative stress and a marked enrichment of type I slow oxidative fibers upon global systemic lack of CB1 in gastrocnemius muscles. In our skmCB1-KD mice, however, we did not detect signs of fiber type switch when examining MHC isoforms on the mRNA level in M. tibialis anterior (TA) samples (a mixed composition muscle, Supplementary Figure S4).

3.2. Calcium Homeostasis in skmCB1-KD Mice

It is now well established that long-lasting stimulation of muscle fibers may result in the increase in cytoplasmic Ca2+ concentration accompanied by the reduction in SR Ca2+ release, SR store content, and enhanced ROS production. The metabolic changes in the working muscle (e.g., reduced ATP, increased ADP) may lead to changes in cellular Ca2+ homeostasis that contribute to physiological fatigue, as reduced Ca2+ release may eventually cause reduced force output. Alterations in [Ca2+] across organelles have been related to a variety of pathologies, where the persistent intracellular Ca2+ overload impairs ATP production, promotes excessive ROS production, and provokes the apoptotic cascade and mitochondrial damage. Interestingly, in our skmCB1-KD mice, we found significantly declined [Ca2+]cyto values (Figure 3F), which would normally directly influence [Ca2+]mito uptake as a compensatory mechanism to normalize the [Ca2+]cyto [49]. We did not measure mitochondrial calcium here; however, in our earlier work, we did not identify signs of mitochondrial calcium overload (see Figure 6 from Singlár et al. [38]). In this study, changes in oxidative stress were observed through CellRox Green staining in FDB fibers from both specimens, but there was no evidence of excessive ROS production upon skmCB1 downregulation (Supplementary Figure S2). As discussed above, significantly lower levels of resting intracellular calcium were registered upon Cnr1 genetic ablation in FDB fibers (Figure 3B). This may serve as an explanation for the lower calculated [Ca2+]SR levels, which, however, did not result in enhanced SOCE activity as inferred from measurements in intact FDB (Figure 3D) and skinned EDL fibers (Figure 2). One feasible explanation for the minimal changes in SOCE could be the modest efficiency of CB1 knockdown induced by a 2-month-long tamoxifen diet. In the present work, we assessed the CB1 downregulation in TA muscles on the mRNA level (Figure 1A, inset). In our earlier work [38], we quantified in slow (SOL), fast (EDL), and mixed muscles (TA) the level of CB1 deficiency, and it was quite dramatic on the mRNA level (66.44%, 81.34%, and 66.04% for EDL, SOL, and TA), but more modest on the protein level (~23% in TA%). It remains elusive, however, whether an extended tamoxifen diet period would be more suitable to achieve a larger CB1 protein knockdown. During prolonged muscle stimulation (voltage or pharmacologically induced), it is speculated that pSOCE, in cooperation with the t-system Ca2+-uptake proteins Na+/Ca2+ exchanger (NCX) and/or plasma membrane Ca2+-ATPase (PMCA), equilibrates Ca2+ gradients across the t-system membrane in a bidirectional manner. These events lead to an influx of Ca2+ if [Ca2+]cyto transients are lower and an efflux of Ca2+ if [Ca2+]cyto transients are higher than “normal”. Moreover, [Ca2+]cyto sets SR load and, according to Koenig et al. [50], also affects pSOCE. Here, we have analyzed the protein levels of the PMCA, and no alterations were detected when comparing the TA muscle samples from Cre+/− and Cre−/− specimens (Supplementary Figure S1D,E).
The decline in SR Ca2+ concentration due to voltage-induced electrical stimulation in FDB fibers was moderate in the skmCB1-KD Cre+/− muscles (Figure 3B). This could indicate a slight impairment in SOCE dynamics within the Cre+/− muscle fibers, potentially leading to a more significant depletion of Ca2+ from the SR (for details, see Equation (A10) from Sztretye et al. [39]). It was established that phasic SOCE depends on [Ca2+]I; thus, the intracellular calcium levels, albeit significantly decreased in Cre+/− are only mildly reflected in the pSOCE measurements. Notably, the reduction in resting [Ca2+]i observed upon Cnr1 genetic depletion was modest, and we believe that the change is physiologically irrelevant, which may translate to insignificant changes in free Ca2+ concentration of the SR.

3.3. Mitochondria Function and Dynamics in skmCB1-KD Mice

In a working muscle, mitochondria will release ROS, which in turn could affect SOCE. Nevertheless, SOCE is completely controlled by the SR near-membrane Ca2+ content. The uptake of Ca2+ by the mitochondria is controlled by the [Ca2+]cyto, which is set by the Ca2+ permeability of the t-system (a balance of SOCE and PMCA activity [40,51]). On the other hand, more and more studies elaborate on the role of regulatory proteins that contribute to the connection between the sarco(endo)plasmic reticulum (SR) Ca2+ store and mitochondria contact sites referred to as mitochondria-associated membranes (MAMs). In mammalian skeletal muscle fibers, most mitochondria are in contact with the SR, providing a direct link between Ca2+ cycling and energy demand [52]. It is now generally accepted that mitochondria accumulate high [Ca2+] following physiological stimulation when [Ca2+]cyto rises from 0.1 μM to about 2–3 μM. The SR holds ~90% of the fiber Ca2+ content at steady state. The mitochondria hold < 5% of the fiber Ca2+ content in healthy muscle [40], and until recently, it was not considered a significant candidate to sequester compelling amounts of Ca2+ during SR Ca2+ release. Nevertheless, the proximity between the SR and the mitochondria ensures the formation of high [Ca2+] microdomains, allowing mitochondria to rapidly take up Ca2+. For Ca2+ to enter the mitochondrial matrix, it requires the crossing of the outer and inner mitochondrial membranes (OMM and IMM). The initial passage across the permeable OMM occurs through the voltage-dependent anion channel (VDAC), which is highly expressed in the OMM. Therefore, the VDAC expression levels constrain the mitochondrial Ca2+ influx; overexpression of VDAC increases the mitochondrial Ca2+ uptake, whereas silencing VDAC reduces it [53]. Here, we have analyzed the protein levels of VDAC, which showed an almost 2-fold increase in Cre+/− muscles (Supplementary Figure S4A,C). This increase, however, did not prove to be significant.
Furthermore, the accumulation of Ca2+ in the mitochondrial matrix occurs down to its electrochemical gradient via the mitochondrial calcium uniporter (MCU). MCU uses the electrochemical potential (ΔΨm ~ −180 mV) established across the IMM to drive the Ca2+ entry into the matrix [54]. MICU1 protein, as part of the MCU holocomplex, acts as a gatekeeper, keeping the channel closed under resting conditions and establishing a Ca2+ threshold for mitochondrial uptake [55]. In a very recent study by Hasan et al. [56], MICU1/2 loss increased mitochondrial calcium influx and sensitized mitochondria to calcium overload injury. In our skmCB1-KD muscles, MICU1 levels were significantly decreased upon Cnr1 genetic manipulation (Supplementary Figure S4B,D).
Treatment with protonophores like FCCP disrupts the ΔΨm, entirely abolishing the mitochondrial Ca2+ uptake process and depleting buffered mitochondrial Ca2+ [53,57]. In our experiments with FCCP, we observed significantly slower dissipation of ΔΨm upon CB1 ablation in Cre+/− muscles (Figure 5E,F). We propose that this phenomenon, along with decreased complex IV activity (Figure 4D), may contribute to a diminished ATP turnover and, consequently, a lower rate of energy production. This may explain the reduced in vivo grip force generation (as well as the reduced in vitro force findings presented by Singlár et al. [38]) and potentially lead to increased fatigability in Cre+/− specimens.
Mitochondrial energy production is carried out by the five complexes inserted in the IMM. In summary, pyruvate, a by-product of glucose metabolism, enters the mitochondria through VDAC and is enzymatically converted into acetyl-CoA within the matrix. Further, the acetyl-CoA enters the Krebs cycle, where it undergoes oxidation, resulting in the production of NADH and FADH2 [58]. NADH is subsequently oxidized by complex I (NADH dehydrogenase), which transfers electrons to ubiquinone, reducing it to ubiquinol. Complex II (succinate dehydrogenase) is the only membrane-bound enzyme in the Krebs cycle, catalyzing the conversion of succinate to fumarate [59]. Complex III (ubiquinol-cytochrome C oxidoreductase) catalyzes the transport of H+ from the matrix to IS, coupled with the movement of electrons from ubiquinol to cytochrome C. After receiving the electrons, cytochrome C transports them to complex IV (cytochrome C oxidase). Lastly, complex IV then transfers the electrons to molecular oxygen, forming water. This process also drives the translocation of two protons (H⁺) from the matrix to the IS for each water molecule produced [60]. In our mitochondrial respiration experiments performed on freshly isolated M. gastrocnemius fibers, we found a marked decline in complex IV activity (Figure 4D), which could be associated with changes in organelle energy status, thus ATP provision. In this study, an examination of TA muscle fibers (Supplementary Figure S4), which have a mixed fiber composition similar to the gastrocnemius muscle used for the respirometry experiments, did not reveal any evidence of a fiber type shift towards an oxidative phenotype (at least at the mRNA level). Nevertheless, we cannot fully exclude this possibility.
CB1Rs have been proposed to regulate nitric oxide (NO) production through nitric oxide synthase (nNOS and eNOS); thus, their role has been associated with vascular health, cannabinoid-mediated neuroprotection, and mitochondrial biogenesis in adipose tissue and placenta [61,62]. Considering that NO is a direct inhibitor of complex IV, one cannot exclude the possibility that the regulation of NOS/NO production might also be involved in the impaired complex IV activity seen in CB1R-KD muscles. This hypothesis, however, was not verified in the present study.
Mitochondrial dynamics, essential for maintaining the proper shape and structure of mitochondria, rely on a fine-tuned equilibrium between division (fission) and fusion. This balance between fission and fusion events is crucial for healthy mitochondrial function. The proteins regulating fission are Drp1 and Fis1, whereas fusion is controlled by Mfn1, Mfn2, and Opa1. Mfn2 is located at both ER and mitochondrial membranes, where it has been reported to strengthen ER–mitochondria contacts and facilitate mitochondrial Ca2+ uptake [63,64]. Recently, it was proposed that Mfn2 acts as a negative regulator of ER-mitochondrial tethers, which, by reducing the number of MAM contacts, avoids toxic Ca2+ accumulation [65]. Earlier, we described significantly altered mitochondrial morphology upon muscle-specific CB1 downregulation [38]. In the present study, the mitochondrial dynamics-related proteins examined (Mfn2, Opa1, Drp1) displayed no expression level changes in Cre+/− mice (Supplementary Figure S5).

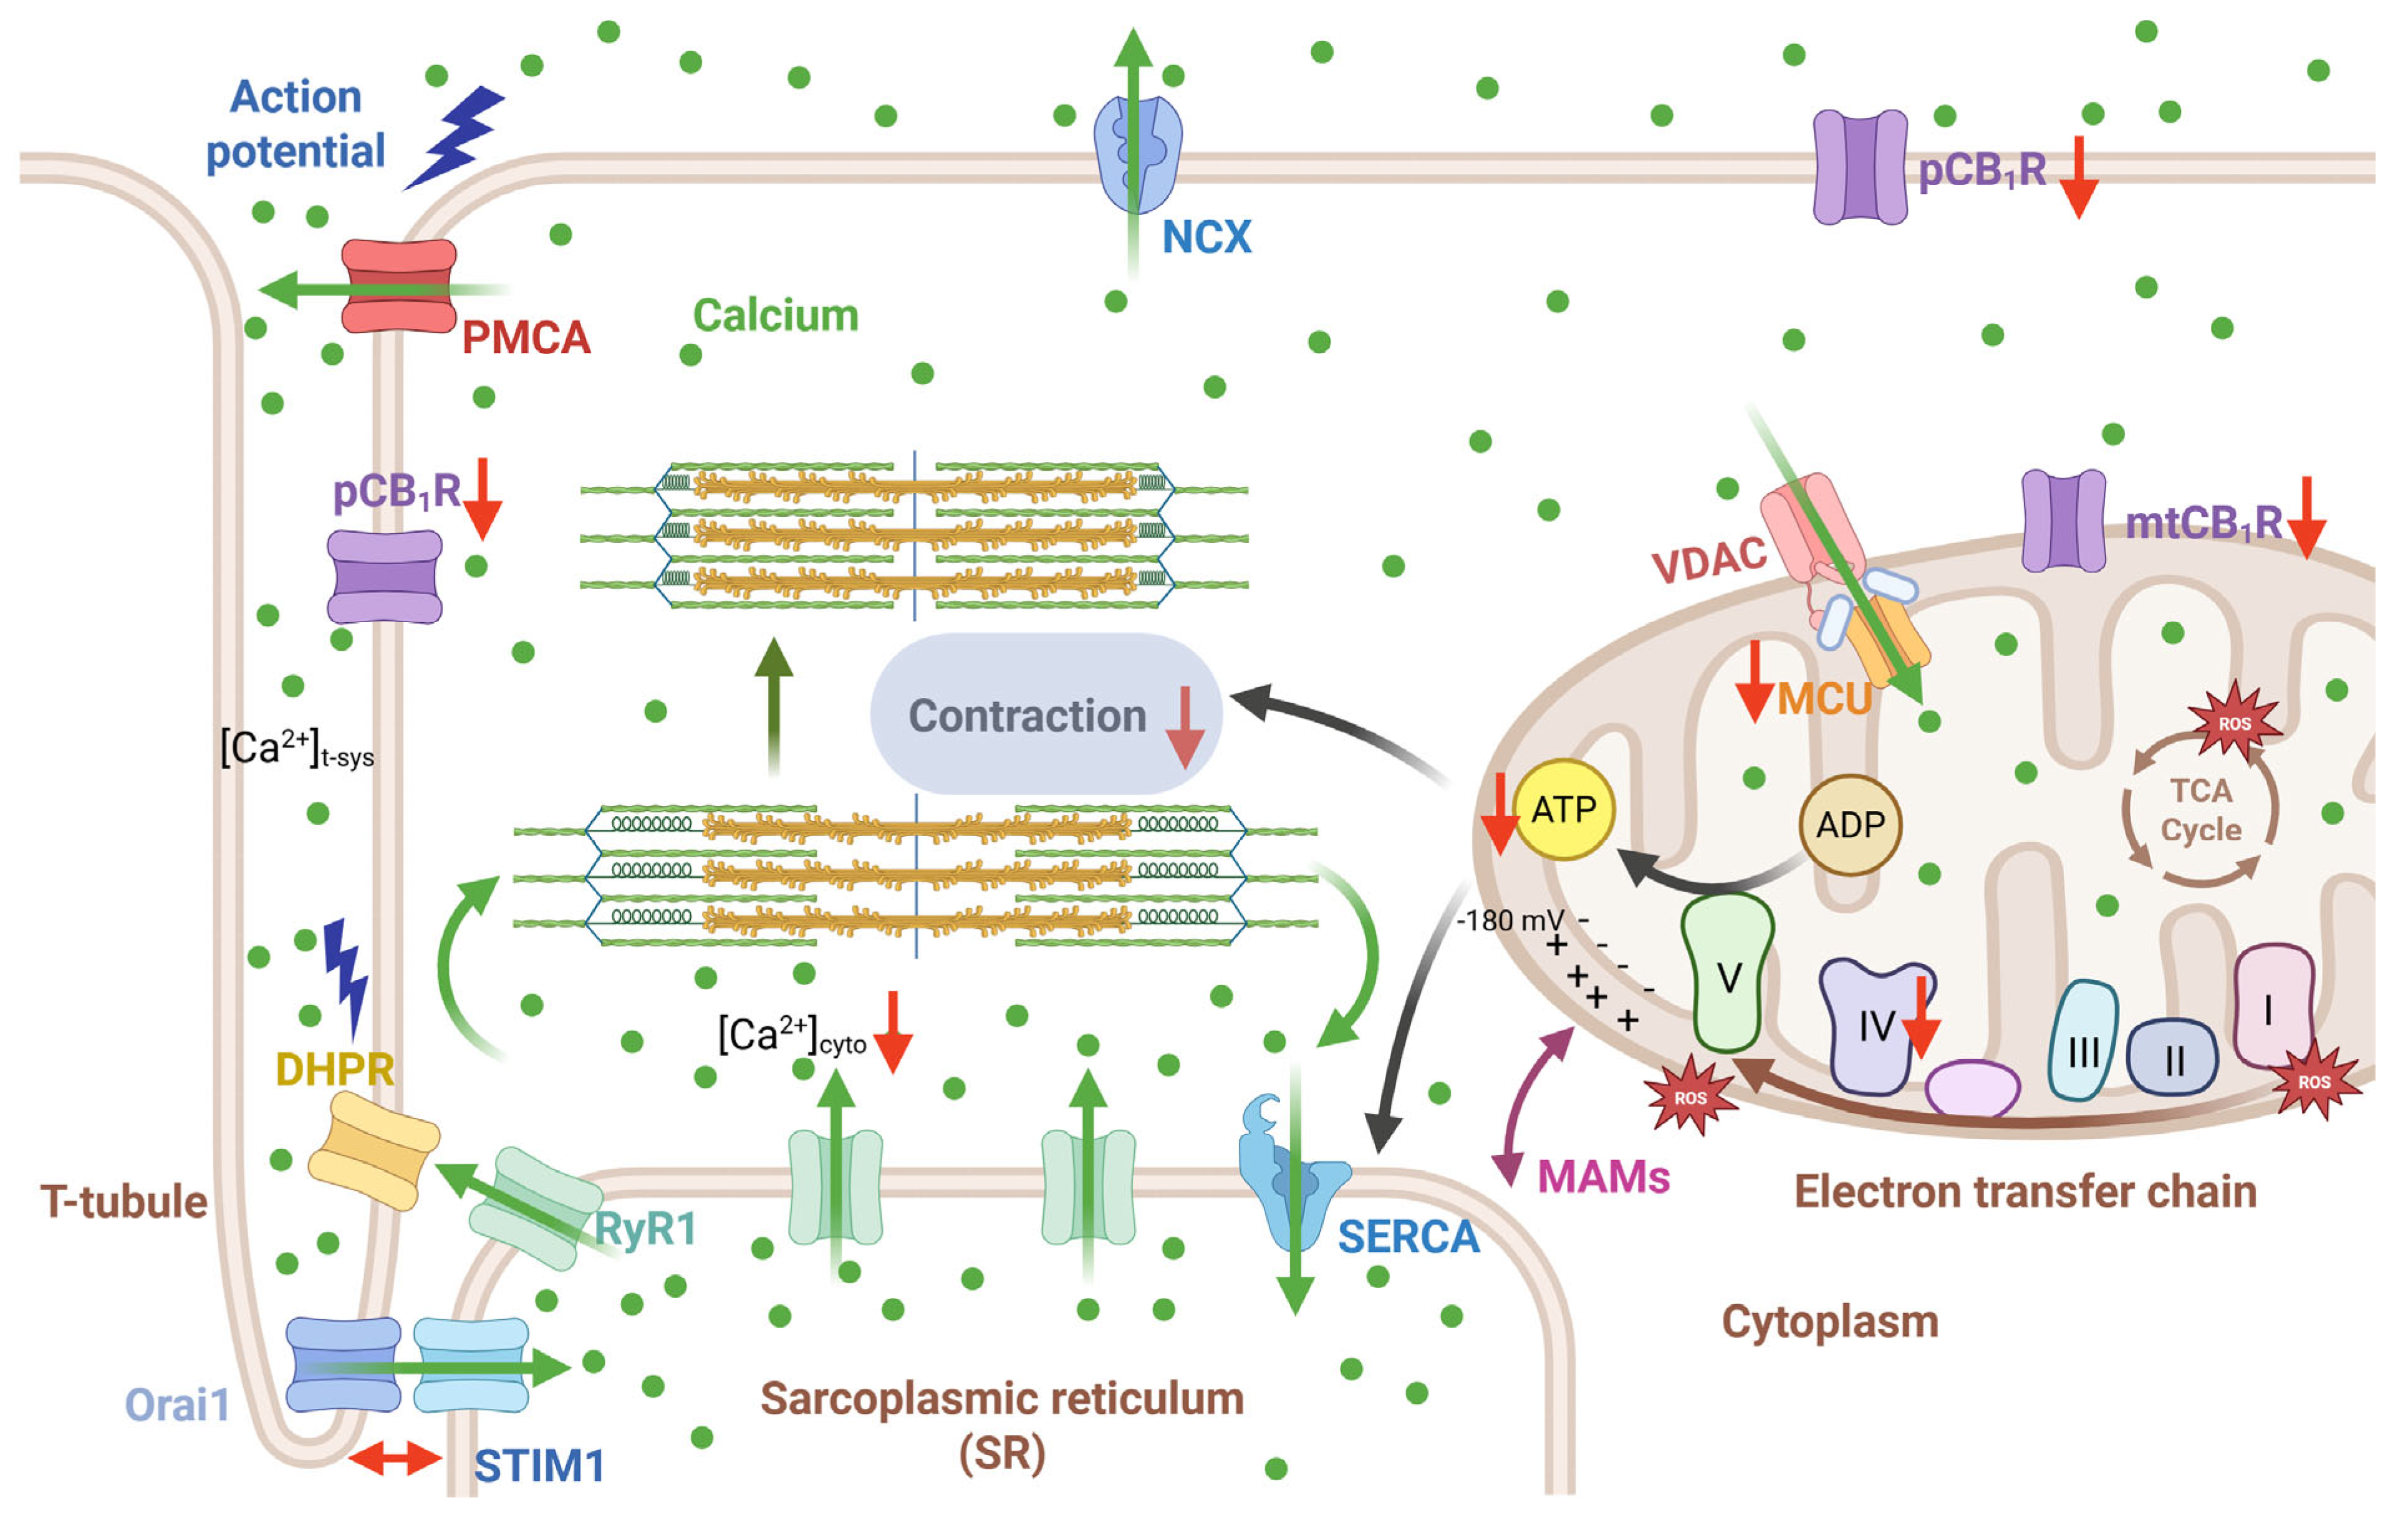
3.4. CB1R-Mediated Signaling Pathways Supporting Skeletal Muscle Function

The CB1 receptor is a G protein-coupled receptor, characterized by its association with heterotrimeric G proteins (Gα, Gβ, and Gγ subunits). Formerly, our workgroup investigated a systemic CB1-KO mouse model and found that cannabinoid signaling inhibits sarcoplasmic Ca2+ release and regulates excitation–contraction coupling in mammalian skeletal muscles via a Gi-PKA-mediated mechanism [45]. On the other hand, a few years ago, Iannotti et al. demonstrated that in C2C12 myoblasts, the effects of 2-AG or synthetic CB1 agonists were unaffected by pertussis toxin, indicating that CB1 coupling in these cells does not involve Gi proteins [48]. Instead, CB1 stimulation induced the hydrolysis of PIP2 (phosphatidylinositol 4,5-bisphosphate), which relies on Gq-PLC-IP3 axis activation, thus elevating intracellular calcium concentration. Keeping in mind that the CB1 mRNA and protein expression profile during murine C2C12 myotube formation is highly time-sensitive, one possible explanation for the above-described discrepancy could be the experimental model studied: Oláh et al. [45] evaluated terminally differentiated C2C12 myotubes and adult FDB fibers from CB1-KO mice, whereas Iannotti et al. [48] examined differentiating C2C12 myoblasts.
Ultimately, we propose drawing an analogy with the CB1-KO model characterized by Oláh et al. [45]: in our skmCB1-KD mouse model, signaling mediated by the Gi/o protein through the inhibition of the adenylyl cyclase-cAMP-PKA axis may serve as a significant downstream effect of CB1 downregulation, potentially accounting for the altered aspects of calcium homeostasis presented in the present work (Figure 2 and Figure 3). However, we must acknowledge that we did not conduct experiments to confirm this hypothesis, and further investigations are needed to test this.
Our research, summarized in Figure 6, reveals a substantial decrease in muscle contraction and in vivo force generation, concluding that this is likely due to impaired ATP production by the mitochondria. While there were modest shifts in intracellular calcium homeostasis, our findings suggest that CB1 receptors primarily impact ATP generation, not calcium directly. A crucial unanswered question remains: are these effects mediated by CB1 receptors located on the plasma membrane or within the mitochondria? This aspect requires further study. Nevertheless, building on our past work [38], we now have stronger evidence that CB1 receptors play a vital role in maintaining both muscle force and cellular/mitochondrial health. This understanding suggests that targeting CB1Rs could be a promising strategy to combat muscle weakness in various diseases, including sarcopenia and myopathies.

4. Materials and Methods

4.1. Animal Care

Animal experiments adhered to the guidelines of the European Community (86/609/EEC) and were designed to minimize animal suffering and distress. The experimental protocol was approved by the Institutional Animal Care Committee of the University of Debrecen (3-1/2019/DEMAB). The mice were housed in plastic cages with mesh covers and fed ad libitum with pelleted mouse chow and water. Room illumination was an automated cycle of 12 h light and 12 h dark, and the room temperature was maintained within the range of 22–25 °C.

4.1.1. Generation of the Muscle-Specific CB1 Knockdown Mouse Strain

Tamoxifen-inducible muscle-specific CB1 knockdown mice were obtained as described in Singlár et al. [38]. Mixed-gender, tamoxifen-inducible, muscle-specific CB1 knockdown mice (hereinafter referred to as Cre+/−) and littermate controls (Cre−/−) were used here.

4.1.2. Tamoxifen Diet

To induce CB1 ablation, a tamoxifen diet (per os) was started immediately after the separation of the Cre+/− and Cre−/− pups from the mother at the age of 4 weeks. Littermates were fed for 2 months without interruption (while monitoring normal body weight gain and performing grip strength and Rota-Rod tests; see Figure 1A) and then were used for the subsequent experiments. The tamoxifen-supplemented chow (Envigo, TD 130857) contained 500 mg tamoxifen/kg, providing 80 mg tamoxifen/kg body weight per day, assuming 20–25 g body weight and 3–4 g daily food intake.

4.2. Molecular Biology

4.2.1. Genotyping

Genotyping was performed at 3 to 4 weeks of age, and the procedure helped to identify the animals and allowed their classification into experimental groups.
Total genomic DNA was isolated from finger biopsies and screened for the presence of the HSA-Cre recombinase cassette by PCR (Biometra Advanced Twin 48 G, 230 V, Analytik Jena GmbH, Jena, Germany) as described in detail earlier in Singlár et al. [38].

4.2.2. Western Blot Analysis

M. tibialis anterior (TA) skeletal muscle tissues were homogenized in lysis buffer (20 mM Tris–HCl, 5 mM EGTA, Protease Inhibitor Cocktail (Sigma, St. Louis, MO, USA) with an HT Mini homogenizer (OPS Diagnostics, Lebanon, NJ, USA). Six-fold concentrated electrophoresis sample buffer (20 mM Tris–HCl, pH 7.4, 0.01% bromophenol blue dissolved in 10% SDS, 100 mM β-mercaptoethanol) was added to total lysates to adjust equal protein concentration of samples, and then the mixture was boiled for 5 min at 90 °C. Twenty micrograms of total protein was loaded into each lane and separated on a 10% SDS–polyacrylamide gel. Proteins were transferred to nitrocellulose membranes, blocked with 5% non-fat milk dissolved in phosphate saline buffer (PBS), and then the membranes were incubated with the appropriate primary antibodies overnight at 4 °C. The primary antibodies used for specific labeling are summarized in Table 1. After washing for 30 min in TBS supplemented with 1% Tween-20 (TBST), membranes were incubated with HRP-conjugated secondary antibodies (Blotting Grade Goat Anti-Rabbit IgG (H+L) (Human IgG Absorbed) Horseradish Peroxidase Conjugate (cat.no. 170-6515, Bio-Rad, Hercules, CA, USA) and Blotting Grade Affinity Purified Goat Anti-Mouse IgG (H+L) Horseradish Peroxidase Conjugate (cat.no. 170-6516). Membranes were developed, and signals were detected using enhanced chemiluminescence (Thermo Fisher Scientific, Waltham, MA, USA). Optical density of signals was measured by ImageJ software 1.53k (version Java 1.8.0_172, NIH, Bethesda, MD, USA), and results were normalized to the optical density of α-actinin (1:1000, cat.no. sc-166524, Santa Cruz Biotechnology, Dallas, TX, USA) and tubulin (1:4000, cat. no. T5168, Sigma, St. Louis, MO, USA), respectively (see Table 1).

4.2.3. qPCR

TRI reagent (cat. no. TR118MRC, Cincinnati, OH, USA) was used to isolate total ribonucleic acid (RNA) fractions from homogenized skeletal muscle specimens of M. flexor digitorum brevis (FDB), M. extensor digitorum longus (EDL), M. soleus (SOL), and M. tibialis anterior (TA) from tamoxifen-fed Cre+/− and Cre−/− mice. Before use, the separated RNA samples were kept at −80 °C dissolved in nuclease-free water (NFW). A spectrophotometer set to 260 nm (NanoDrop ND1000; Promega Biosciences, Madison, WI, USA) was used to measure the RNA yield and purity. After treating the separated RNA samples with DNase and RNase inhibitor (Ambion, Austin, TX, USA), a High-Capacity cDNA Reverse Transcription Kit (cat. no. 00735667, Thermo Fisher, Waltham, MA, USA) was used to perform reverse transcription.
Five hundred nanograms of the extracted total RNAs was reverse transcribed into complementary DNA (cDNA) following the manufacturer’s instructions. Random hexamers were used in a 25 µL reaction volume to carry out cDNA synthesis. SYBRGreen mix (cat.no. 4367659, Thermo Fisher Scientific, Waltham, MA, USA) was utilized for quantitative RT-PCR. A LightCycler 480 Master instrument (Roche, Basel, Switzerland) was used for the amplification (cat. no. for plates, Roche: 04729692001; cat. no. for sealing foils, Roche: 04729757001). The investigated genes are summarized in Table 2; all primers were synthesized by Invitrogen and were as follows: myosin heavy chain 1 (MHCI), myosin heavy chain 2A (MHCIIA), and myosin heavy chain 2X (MHCIIX). The 18sRNA housekeeping gene was used as the internal control (Invitrogen, Thermo Fisher Scientific, Waltham, MA, USA).
Forty-five cycles of 3 min at 95 °C were performed. The comparative Ct technique was used to determine the relative expression values for each transcript of interest. Each sample was normalized to its own internal control gene expression after being conducted in triplicate. Subsequent analysis was conducted using the mean values that were obtained.

4.3. In Vivo Experiments

4.3.1. Body Weight Measurement

The body weight was measured at the beginning of the tamoxifen diet (at 1-month-old age) and weekly afterward until the end of the 2-month feeding period (3-month-old age) for each individual mouse in both Cre−/− and Cre+/− groups. In Figure 1C we present the average monthly body weight monitoring.

4.3.2. Grip Strength Test

Forepaw force was measured as previously described [38]. Briefly, the animals were gently dragged away from the grip test meter by their tails after they had successfully grabbed its bar for a brief period. A computer linked to the test meter recorded the maximum force before the animal released the bar, digitizing it at a frequency of 2 kHz. Each animal underwent the test ten to fifteen times to get an averaged single data point, which was then normalized to body weight. Grip strength was assessed before, during, and after the tamoxifen diet at 1, 2, and 3 months of age, respectively.

4.3.3. Rota-Rod Test

The mice were placed on a rotating cylinder (cat.no YPFB00, Dev Scientific and Engineering, India), and the duration (in seconds) spent on the rotating rod before falling was recorded. The device was set to an accelerating protocol (rpm consistently increased over time—accelerating from 4 to 300 rpm in 300 s). The mice were acclimated to the Rota-Rod before testing. The acclimatization consisted of three trials with 10 min intervals between trials at a constant speed (4 rpm) for 1 min. The performance of the mouse was tested after 30 min of rest, and the time the mouse remained on the Rota-Rod was recorded. On the day of the examination, the accelerating protocol was performed three times, and the average of the three trials was calculated for each animal. The test was carried out at various time points of the tamoxifen diet: before (1-month-old), during (2-month-old), and after (3-month-old).

4.4. In Vitro Experiments

Mice were anesthetized and sacrificed in compliance with the guidelines of the European Community (86/609/EEC). After CO2 overdose and cervical dislocation, M. flexor digitorum brevis (FDB), M. extensor digitorum longus (EDL), M. tibialis anterior (TA), and M. gastrocnemius muscles from the hind limb were dissected manually under a transmitted light microscope using thin forceps and fine precision surgical scissors.

4.4.1. Isolation of Single FDB Fibers

All calcium measurements were carried out on skeletal muscle fibers from the FDB or EDL muscle of the mouse. Calcium-free Ringer’s solution (containing in mM: 136 NaCl, 5 KCl, 1 MgCl2, 10 HEPES; 10 glucose; pH 7.2) was used during the dissection of the muscle. Single muscle fibers from FDB were enzymatically dissociated in minimal essential media containing 0.2% type I collagenase (Sigma) at 37 °C for 45–50 min. To release single fibers, the FDB muscles were mechanically dissociated and then triturated gently in a normal Ringer solution (same as above but supplemented with 2.6 mM CaCl2). The isolated fibers were then placed in culture dishes and stored at 4 °C in the refrigerator until use. Only fibers with clearly visible striations and no swelling or surface membrane damage were selected for subsequent experiments.

4.4.2. Mitochondrial Membrane Potential Measurement, Oxidative Stress Measurement, Confocal Microscopy, and Image Processing

Isolated FDB fibers from 3-month-old Cre−/− and Cre+/− mice were loaded with 20 nM tetramethylrhodamine methyl ester (TMRE) prepared in normal Ringer’s solution at room temperature for 15 min. After 20 min the excess dye was washed. To monitor TMRE fluorescence, a time series of images was acquired using a Zeiss 5Live confocal microscope (Zeiss, Oberkochen, Germany) equipped with a 20x air objective and 543 nm laser. Sequential images were taken at 10 s intervals. Twenty seconds after the start of the time series, 1 μM FCCP was perfused onto the fiber while the decay of TMRE fluorescence indicating the mitochondrial membrane potential (ψm) dissipation was continually monitored. Using the Zeiss Zen Blue edition software (v3.12, Zeiss, Oberkochen, Germany), an arbitrarily chosen region of interest (ROI) was marked on all subsequent images, and the obtained fluorescence values were fitted with an exponential function using Equation (3) to determine the decay time (τ). The averages of the individual decay times were plotted.
In the CellRox Green experiments (cat.no. C10444, Thermo Fisher Scientific, Waltham, MA, USA), FDB fibers were loaded in normal Ringer’s solution with the dye in 1:500 dilution for 30 min at 37 °C. Excitation wavelength was at 488 nm and detection at λ > 520 nm. An arbitrary ROI (marked with a rectangle) was selected in parallel with the longitudinal axis of the fiber and the fluorescence was plotted. The ROI selection was always done in a way to avoid areas of dye accumulation (e.g., nuclei). Fluorescence was calculated similarly as described previously [66]. In short, at the peaks (I-band fluorescence, representing mitochondria (FI-band)) and at troughs (A-band fluorescence, representing baseline (FA-band)), fluorescence was measured, then the normalized mitochondrial fluorescence expressed as Fmito was calculated with the equation:
Fmito = (FI-band − FA-band)/FA-band

4.4.3. Assessment of Mitochondrial Oxygen Consumption Using High-Resolution Respirometry

Mitochondrial oxygen consumption (O2 flux) was assessed in M. gastrocnemius (7 mg/chamber) using High-Resolution FluoRespirometry (Oxygraph-2k, Oroboros Instruments, Innsbruck, Austria). The isolated muscles were incubated in BIOPS solution containing saponin to ensure membrane permeabilization. After stabilization of baseline respiration, we used a short and a long respirometric protocol (see below).
In the short respirometric protocol (Figure 4A), the integrity of the outer mitochondrial membrane was tested with exogenous cytochrome c (10 µM) following OXPHOS II stimulation (0.5 µM Rotenone (Rot), 10 mM succinate (S), and 2.5 mM ADP). Respiratory control ratio (RCR), an index of respiration coupled to ADP-ATP conversion, was expressed as a ratio of OXPHOS II to the ATP synthase-inhibited (oligomycin, Omy; 2.5 μM) LEAK state. The electron transport system-independent respiration (or residual oxygen consumption; ROX) was determined after complex III inhibition with antimycin A (2.5 μM).
In the long respirometric protocol (Figure 4B), complex I-linked oxidative phosphorylation (OXPHOS I) was measured in the presence of complex I-linked substrates (10 mM glutamate and 2 mM malate) and ADP (2.5 mM). Rotenone (Rot; 0.5 µM) was used to (a) inhibit complex I and (b) assess complex II-linked oxidative phosphorylation (OXPHOS II) in the presence of succinate (S; 10 mM) and adenylate. After inhibition of complex III (antimycin A; 2.5 µM), complex IV respiratory activity was measured with ascorbate (2 mM) and artificial substrate N,N,N′,N′-Tetramethyl-p-phenylenediamine dihydrochloride (TMPD; 0.5 mM). Ascorbate was added before TMPD to avoid uncontrollable autoxidation of the electron donor. Sodium azide (NaN3; 100 mM) was finally administered to block complex IV-linked mitochondrial respiration.
Both the short and long protocol measurements were performed in a Mir05 respiration medium under continuous magnetic stirring (750 rpm) at 37 °C. The DatLab 7 software (version 7.4.0.4., Oroboros Instruments, Innsbruck, Austria) was used for online display, respirometry data acquisition, and analysis.

4.4.4. T-System Ca2+-Uptake Measurement

Mixed-gender Cre−/− (n = 5) and Cre+/− (n = 7) mice were investigated, and t-system uptake measurements were performed as previously described in Cully et al. [41]. Briefly, euthanasia was performed via cervical dislocation, followed by rapid dissection of the whole M. extensor digitorum longus (EDL) muscle, which was then placed in a glass Petri dish covered with Sylgard and submerged in paraffin oil. A bundle of fibers was exposed to a standard Ringer solution containing 2.5 mM of the low-affinity Ca2+-sensitive dye Rhod-5N for 10 min. Individual fibers were isolated from the Rhod-5N-loaded bundle and skinned by mechanically removing the sarcolemma. Skinned fibers were subsequently transferred to a custom-made chamber constructed on top of a 1.5 mm coverslip filled with an intracellular solution containing (in mM) 90 HEPES, 10 EGTA, 9.86 MgO2, 9.7 CaCO3, 8 Na2ATP, and 10 NaCP, with pH adjusted to 7.1 with KOH (yielding a free Ca2+ concentration of 67 nM). Adjustment of the total [Ca2+] and [Mg2+] resulted in free [Ca2+] concentrations of 28, 67, 200, and 1342 nM, and free [Mg2+] concentrations of 1 mM, respectively. The chosen calcium concentrations are a consequence of the mixing of different EGTA-buffered solutions (one low, one high in free Ca2+) following Cully et al. [41]. These solutions are based on earlier work by George Stephenson [67]. Depletion of the t-system was induced in a nominally Ca2+ and Mg2+-free solution with the addition of 30 mM caffeine (cat.no. C0750, Sigma). The chamber was transferred onto the stage of a confocal microscope for continuous Rhod-5N fluorescence recording. Minimal (Fmin) and maximal (Fmax) dye fluorescence were determined in the presence of maximal (5 mM) and nominally Ca2+-free solutions containing 25 µM of ionomycin (cat.no. I9657, Sigma) and A23187 (cat.no. C7522, Sigma). The spatially averaged real-time fluorescent signal (F) was converted to calcium concentration using the formula:
[Ca2+] = β KD × (F − Fmin)/(Fmax − F)
with a KD of 0.872 mM (Cully et al. [41]). Uptake fluxes were calculated as the signal’s first-time derivative.

4.4.5. Resting Myoplasmic [Ca2+]i Measurement

The resting intracellular Ca2+ concentration was measured using the Fura-2 AM fluorescent calcium indicator. Briefly, single FDB fibers were mounted on a glass coverslip with 5 µM Fura-2 AM dye for 1 h. Fibers were then washed with fresh normal Tyrode’s solution (137 mM NaCl, 5.4 mM KCl, 0.5 mM MgCl2, 1.8 mM CaCl2, 11.8 mM Hepes-NaOH, and 1 g/L glucose, pH 7.4) and then imaged with the CoolLED pE-340fura setup (CoolLED Ltd., Hampshire, UK). The acquisition rate was set to 10 Hz. Fura-2 ratios from myoplasmic areas of interest were calculated as R = F340/F380 using Zeiss Zen Blue Edition software (Zeiss, Oberkochen, Germany) and then converted to resting free Ca2+ concentrations using an in situ calibration curve for Fura-2 AM according to the method of Grynkiewicz et al. [68] based on Equation (1) (see above), where β Kd = 0.3.

4.4.6. Whole-Cell Voltage Clamp

The experimental design was as described in our earlier report [39]. Briefly, isolated FDB fibers were voltage-clamped (Axoclamp 2B, Axon Instruments, Union City, CA, USA) and imaged using a confocal microscope (Zeiss 5 Live, Oberkochen, Germany). Fibers were dialyzed with 50 µM Rhod-2-containing internal solution (see below). The experimental temperature was 20–22 °C, and the holding potential was −80 mV. Pipette resistance varied between 1 and 2 MΩ. The experiments were performed in the presence of 10 mM EGTA so that the endogenous buffers in the removal process were almost negligible. Correction for linear capacitive currents was performed by analog compensation.
The intracellular calcium ([Ca2+]i) values were determined from the fluorescence (F) and the background fluorescence (F0) in line scan images analyzed by an in-house custom-made program using the following parameters taken from Royer et al. [69]: Kd Rhod-2 = 1.58 μM and kON = 0.07 μM−1 ms−1 and kOFF = 130 s−1. Ca2+-release flux was derived from cytosolic Ca2+ transients and subjected to a removal-model fit analysis, which calculates release flux as that necessary to account for the evolution of [Ca2+]i(t) in a single-compartment model that includes quantitatively specified processes of removal as originally described by Melzer et al. [70] and further optimized by Royer et al. [69]. In brief, the model considers that [EGTA] is sufficiently high, and thus only four forms of Ca2+ must be considered: free, bound to the monitoring dye, bound to EGTA, and sequestered in the SR. From the release flux (the flux exiting through the release channels), the net flux leaving the SR can be derived by subtraction of the pump-removal flux.
The evolution of SR Ca2+ content during repetitive stimulation in both mouse groups was calculated from the amount of calcium released minus the removal flux, which contains the uptake of Ca2+ into the SR by the SERCA pump.
To estimate the average amount of calcium in the SR from the depolarizing train, single-exponential functions were fitted to the eight points of the series. The exponential decay was assessed by the equation below:
y = y0 + ae−bx
where x is the number of tetanic pulses applied, b is the time constant of SR depletion, and a is the remaining SR calcium content.
External bath solution (in mM): 140 TEA-CH3SO3, 1 CaCl2, 3.5 MgCl2, 10 Hepes, 1 4-AP, 0.5 CdCl2, 0.3 LaCl3, 0.001 TTX (citrate), and 0.05 BTS (N-benzyl-p-toluene sulphonamide; Sigma-Aldrich). pH was adjusted to 7.2 with TEA-OH, and osmolality was adjusted to 320 mOsm with TEA methanesulfonate.
Internal (pipette) solution (in mM): 110 N-methylglucamine, 110 L-glutamic acid, 10 EGTA, 10 Tris, 10 glucose, 5 Na ATP, 5 phosphocreatine Tris, 0.1 Rhod-2, 3.56 CaCl2, and 7.4 mM MgCl2 were added for a nominal 1 mM [Mg2+] and 100 nM [Ca2+]. pH was set to 7.2 with NaOH, and osmolality to 320 mOsm with N-methylglucamine.

4.5. Quantification and Statistical Analysis

Pooled data were expressed as the mean ± standard error of the mean (SEM). The differences between Cre−/− and Cre+/− mice were assessed using one-way analysis of variance (ANOVA) and all pairwise Bonferroni’s multiple comparison methods using the statistical program Prism 9 (GraphPad Software, San Diego, CA, USA). Student’s t-test was used to test the significance, and a p-value of less than 0.05 was considered statistically significant. G-Power (version 3.1.9.7) software was used to estimate the number of specimens included in the in vivo experiments (α = 0.05; assumed effect size: 1; calculated power: 0.9548089).

5. Conclusions

To develop effective therapies for conditions with defective endocannabinoid system (ECS) activity, it is essential to understand the skeletal ECS’s function in health and disease. Here, we present a detailed functional and molecular characterization of a transgenic mouse model with skeletal muscle-specific Cnr1 genetic ablation. Our in vivo results demonstrate that CB1R knockdown impairs motor coordination and grip strength in mice. Furthermore, at the cellular level, we observed modestly altered calcium homeostasis and significantly decreased mitochondrial function (decreased complex IV activity). Therefore, we propose that the ECS (particularly CB1R) plays a key role in physiological muscle force generation and in maintaining cellular and mitochondrial homeostasis and function.

Supplementary Materials

The following supporting information can be downloaded at: https://www.mdpi.com/article/10.3390/ijms26115291/s1.

Author Contributions

M.S., A.K.-P., X.K., F.A.I. and L.C. designed the experiments. Research on genotyping, body weight, grip force, and Rota-Rod was performed by Z.S. and N.G. Molecular biology experiments were performed by N.G. and Z.S. Functional studies, and research on calcium imaging were performed by Z.S., N.G., M.S., P.S., E.L., Z.M.K., L.J., M.S., N.G., P.S., Z.S., A.K.-P. and E.L. analyzed the results. M.S. wrote the manuscript. All authors have read and agreed to the published version of the manuscript.

Funding

This work was supported by grants from the Hungarian National Research, Development and Innovation Office: NKFIH-FK-142481 (M.S.), NKFIH-FK 134684 (A.K.-P.) and NKFIH 2019-2.1.11-TÉT-2019-00102 (M.S.). Projects no. TKP2020-NKA-04 and TKP2021-EGA-28 have been implemented with the support provided by the National Research, Development, and Innovation Fund of Hungary, financed under the TKP2021-EGA funding scheme. Additional funding: Austrian Science Fund (FWF) 10.55776/P31563 and 10.55776/I04649 to X.K. and DOC Fellowship of the Austrian Academy of Science to E.L.

Institutional Review Board Statement

Animal experiments were in compliance with the guidelines of the European Community (86/609/EEC). The animal study protocol was approved by the Institutional Animal Care Committee of the University of Debrecen (3-1/2019/DEMAB).

Informed Consent Statement

Not applicable.

Data Availability Statement

Data will be made available on reasonable request.

Acknowledgments

The authors would like to thank Moran Kanaan (UniTalent student, University of Debrecen) for her help with molecular biology experiments and Judit Reményi-Puskár (University of Debrecen) for excellent technical assistance. The authors wish to thank Bradley Launikonis (University of Queensland, Brisbane, Australia) for fruitful discussion on the topic and critical review of the manuscript.

Conflicts of Interest

The authors declare no conflicts of interest.

References

  1. Wolfe, R.R. The Underappreciated Role of Muscle in Health and Disease. Am. J. Clin. Nutr. 2006, 84, 475–482. [Google Scholar] [CrossRef] [PubMed]
  2. Merz, K.E.; Thurmond, D.C. Role of Skeletal Muscle in Insulin Resistance and Glucose Uptake. Compr. Physiol. 2020, 10, 785–809. [Google Scholar] [CrossRef] [PubMed]
  3. Franzini-Armstrong, C.; Jorgensen, A.O. Structure and Development of E-C Coupling Units in Skeletal Muscle. Annu. Rev. Physiol. 1994, 56, 509–534. [Google Scholar] [CrossRef]
  4. Meissner, G.; Lu, X. Dihydropyridine Receptor-Ryanodine Receptor Interactions in Skeletal Muscle Excitation-Contraction Coupling. Biosci. Rep. 1995, 15, 399–408. [Google Scholar] [CrossRef] [PubMed]
  5. Eisenberg, B.R. Quantitative Ultrastructure of Mammalian Skeletal Muscle. Compr. Physiol. 2011, 73–112. [Google Scholar] [CrossRef]
  6. Marcucci, L.; Canato, M.; Protasi, F.; Stienen, G.J.M.; Reggiani, C.A. 3D Diffusional-Compartmental Model of the Calcium Dynamics in Cytosol, Sarcoplasmic Reticulum and Mitochondria of Murine Skeletal Muscle Fibers. PLoS ONE 2018, 13, e0201050. [Google Scholar] [CrossRef]
  7. Rizzuto, R.; De Stefani, D.; Raffaello, A.; Mammucari, C. Mitochondria as Sensors and Regulators of Calcium Signalling. Nat. Rev. Mol. Cell Biol. 2012, 13, 566–578. [Google Scholar] [CrossRef]
  8. Marcucci, L.; Nogara, L.; Canato, M.; Germinario, E.; Raffaello, A.; Carraro, M.; Bernardi, P.; Pietrangelo, L.; Boncompagni, S.; Protasi, F.; et al. Mitochondria Can Substitute for Parvalbumin to Lower Cytosolic Calcium Levels in the Murine Fast Skeletal Muscle. Acta Physiol. 2024, 240, e14208. [Google Scholar] [CrossRef]
  9. Butera, G.; Vecellio Reane, D.; Canato, M.; Pietrangelo, L.; Boncompagni, S.; Protasi, F.; Rizzuto, R.; Reggiani, C.; Raffaello, A. Parvalbumin Affects Skeletal Muscle Trophism through Modulation of Mitochondrial Calcium Uptake. Cell Rep. 2021, 35, 109087. [Google Scholar] [CrossRef]
  10. Launikonis, B.S.; Ríos, E. Store-Operated Ca2+ Entry during Intracellular Ca2+ Release in Mammalian Skeletal Muscle. J. Physiol. 2007, 583, 81–97. [Google Scholar] [CrossRef]
  11. Feske, S.; Gwack, Y.; Prakriya, M.; Srikanth, S.; Puppel, S.-H.; Tanasa, B.; Hogan, P.G.; Lewis, R.S.; Daly, M.; Rao, A. A Mutation in Orai1 Causes Immune Deficiency by Abrogating CRAC Channel Function. Nature 2006, 441, 179–185. [Google Scholar] [CrossRef] [PubMed]
  12. Liou, J.; Kim, M.L.; Heo, W.D.; Jones, J.T.; Myers, J.W.; Ferrell, J.E.J.; Meyer, T. STIM Is a Ca2+ Sensor Essential for Ca2+-Store-Depletion-Triggered Ca2+ Influx. Curr. Biol. 2005, 15, 1235–1241. [Google Scholar] [CrossRef] [PubMed]
  13. Baba, Y.; Hayashi, K.; Fujii, Y.; Mizushima, A.; Watarai, H.; Wakamori, M.; Numaga, T.; Mori, Y.; Iino, M.; Hikida, M.; et al. Coupling of STIM1 to Store-Operated Ca2+ Entry through Its Constitutive and Inducible Movement in the Endoplasmic Reticulum. Proc. Natl. Acad. Sci. USA 2006, 103, 16704–16709. [Google Scholar] [CrossRef] [PubMed]
  14. Koenig, X.; Choi, R.H.; Launikonis, B.S. Store-Operated Ca2+ Entry Is Activated by Every Action Potential in Skeletal Muscle. Commun. Biol. 2018, 1, 31. [Google Scholar] [CrossRef]
  15. Zhang, S.L.; Yu, Y.; Roos, J.; Kozak, J.A.; Deerinck, T.J.; Ellisman, M.H.; Stauderman, K.A.; Cahalan, M.D. STIM1 Is a Ca2+ Sensor That Activates CRAC Channels and Migrates from the Ca2+ Store to the Plasma Membrane. Nature 2005, 437, 902–905. [Google Scholar] [CrossRef]
  16. Onopiuk, M.; Brutkowski, W.; Young, C.; Krasowska, E.; Róg, J.; Ritso, M.; Wojciechowska, S.; Arkle, S.; Zabłocki, K.; Górecki, D.C. Store-Operated Calcium Entry Contributes to Abnormal Ca2+ Signalling in Dystrophic Mdx Mouse Myoblasts. Arch. Biochem. Biophys. 2015, 569, 1–9. [Google Scholar] [CrossRef]
  17. Cavuoto, P.; McAinch, A.J.; Hatzinikolas, G.; Janovská, A.; Game, P.; Wittert, G.A. The Expression of Receptors for Endocannabinoids in Human and Rodent Skeletal Muscle. Biochem. Biophys. Res. Commun. 2007, 364, 105–110. [Google Scholar] [CrossRef]
  18. Ruiz de Azua, I.; Lutz, B. Multiple Endocannabinoid-Mediated Mechanisms in the Regulation of Energy Homeostasis in Brain and Peripheral Tissues. Cell. Mol. Life Sci. 2019, 76, 1341–1363. [Google Scholar] [CrossRef]
  19. Di Marzo, V.; Stella, N.; Zimmer, A. Endocannabinoid Signalling and the Deteriorating Brain. Nat. Rev. Neurosci. 2015, 16, 30–42. [Google Scholar] [CrossRef]
  20. Pagotto, U.; Marsicano, G.; Cota, D.; Lutz, B.; Pasquali, R. The Emerging Role of the Endocannabinoid System in Endocrine Regulation and Energy Balance. Endocr. Rev. 2006, 27, 73–100. [Google Scholar] [CrossRef]
  21. Hudson, B.D.; Hébert, T.E.; Kelly, M.E. Physical and Functional Interaction between CB1 Cannabinoid Receptors and Β2-Adrenoceptors. Br. J. Pharmacol. 2010, 160, 627–642. [Google Scholar] [CrossRef] [PubMed]
  22. Di Marzo, V.; Piscitelli, F. The Endocannabinoid System and Its Modulation by Phytocannabinoids. Neurotherapeutics 2015, 12, 692–698. [Google Scholar] [CrossRef]
  23. Migliaccio, M.; Ricci, G.; Suglia, A.; Manfrevola, F.; Mackie, K.; Fasano, S.; Pierantoni, R.; Chioccarelli, T.; Cobellis, G. Analysis of Endocannabinoid System in Rat Testis during the First Spermatogenetic Wave. Front. Endocrinol. 2018, 9, 269. [Google Scholar] [CrossRef]
  24. Sepúlveda, C.; Rodríguez, J.M.; Monsalves-Álvarez, M.; Donoso-Barraza, C.; Pino-de la Fuente, F.; Matías, I.; Leste-Lasserre, T.; Zizzari, P.; Morselli, E.; Cota, D.; et al. The CB1 Cannabinoid Receptor Regulates Autophagy in the Tibialis Anterior Skeletal Muscle in Mice. Biol. Res. 2023, 56, 14. [Google Scholar] [CrossRef]
  25. El Manira, A.; Kyriakatos, A. The Role of Endocannabinoid Signaling in Motor Control. Physiology 2010, 25, 230–238. [Google Scholar] [CrossRef] [PubMed]
  26. Eckardt, K.; Sell, H.; Taube, A.; Koenen, M.; Platzbecker, B.; Cramer, A.; Horrighs, A.; Lehtonen, M.; Tennagels, N.; Eckel, J. Cannabinoid Type 1 Receptors in Human Skeletal Muscle Cells Participate in the Negative Crosstalk between Fat and Muscle. Diabetologia 2009, 52, 664–674. [Google Scholar] [CrossRef] [PubMed]
  27. Dalle, S.; Schouten, M.; Deboutte, J.; de Lange, E.; Ramaekers, M.; Koppo, K. The Molecular Signature of the Peripheral Cannabinoid Receptor 1 Antagonist AM6545 in Adipose, Liver and Muscle Tissue. Toxicol. Appl. Pharmacol. 2024, 491, 117081. [Google Scholar] [CrossRef] [PubMed]
  28. Hebert-Chatelain, E.; Desprez, T.; Serrat, R.; Bellocchio, L.; Soria-Gomez, E.; Busquets-Garcia, A.; Pagano Zottola, A.C.; Delamarre, A.; Cannich, A.; Vincent, P.; et al. A Cannabinoid Link between Mitochondria and Memory. Nature 2016, 539, 555–559. [Google Scholar] [CrossRef]
  29. Esposito, I.; Proto, M.C.; Gazzerro, P.; Laezza, C.; Miele, C.; Alberobello, A.T.; D’Esposito, V.; Beguinot, F.; Formisano, P.; Bifulco, M. The Cannabinoid CB1 Receptor Antagonist Rimonabant Stimulates 2-Deoxyglucose Uptake in Skeletal Muscle Cells by Regulating the Expression of Phosphatidylinositol-3-Kinase. Mol. Pharmacol. 2008, 74, 1678–1686. [Google Scholar] [CrossRef]
  30. Crespillo, A.; Suárez, J.; Bermúdez-Silva, F.J.; Rivera, P.; Vida, M.; Alonso, M.; Palomino, A.; Lucena, M.A.; Serrano, A.; Pérez-Martín, M.; et al. Expression of the Cannabinoid System in Muscle: Effects of a High-Fat Diet and CB1 Receptor Blockade. Biochem. J. 2011, 433, 175–185. [Google Scholar] [CrossRef]
  31. Hebert-Chatelain, E.; Reguero, L.; Puente, N.; Lutz, B.; Chaouloff, F.; Rossignol, R.; Piazza, P.V.; Benard, G.; Grandes, P.; Marsicano, G. Studying Mitochondrial CB1 Receptors: Yes We Can. Mol. Metab. 2014, 3, 339. [Google Scholar] [CrossRef] [PubMed]
  32. Mendizabal-Zubiaga, J.; Melser, S.; Bénard, G.; Ramos, A.; Reguero, L.; Arrabal, S.; Elezgarai, I.; Gerrikagoitia, I.; Suarez, J.; De Fonseca, F.R.; et al. Cannabinoid CB1 Receptors Are Localized in Striated Muscle Mitochondria and Regulate Mitochondrial Respiration. Front. Physiol. 2016, 7, 476. [Google Scholar] [CrossRef] [PubMed]
  33. Senese, R.; Petito, G.; Silvestri, E.; Ventriglia, M.; Mosca, N.; Potenza, N.; Russo, A.; Manfrevola, F.; Cobellis, G.; Chioccarelli, T.; et al. Effect of CB1 Receptor Deficiency on Mitochondrial Quality Control Pathways in Gastrocnemius Muscle. Biology 2024, 13, 116. [Google Scholar] [CrossRef] [PubMed]
  34. Rohbeck, E.; Eckel, J.; Romacho, T. Cannabinoid Receptors in Metabolic Regulation and Diabetes. Physiology 2021, 36, 102–113. [Google Scholar] [CrossRef]
  35. Dalle, S.; Schouten, M.; Ramaekers, M.; Koppo, K. The Cannabinoid Receptor 1 Antagonist AM6545 Stimulates the Akt-MTOR Axis and in Vivo Muscle Protein Synthesis in a Dexamethasone-Induced Muscle Atrophy Model. Mol. Cell. Endocrinol. 2023, 563, 111854. [Google Scholar] [CrossRef]
  36. Dalle, S.; Schouten, M.; Vanderbeke, K.; Van Parys, E.; Ramaekers, M.; Thomis, M.; Costamagna, D.; Koppo, K. The CB1 Antagonist Rimonabant Improves Muscle Regeneration and Remodels the Inflammatory and Endocannabinoid Profile upon Injury in Male Mice. Life Sci. 2025, 361, 123296. [Google Scholar] [CrossRef]
  37. Hryhorowicz, S.; Kaczmarek-Ryś, M.; Andrzejewska, A.; Staszak, K.; Hryhorowicz, M.; Korcz, A.; Słomski, R. Allosteric Modulation of Cannabinoid Receptor 1—Current Challenges and Future Opportunities. Int. J. Mol. Sci. 2019, 20, 5874. [Google Scholar] [CrossRef]
  38. Singlár, Z.; Ganbat, N.; Szentesi, P.; Osgonsandag, N.; Szabó, L.; Telek, A.; Fodor, J.; Dienes, B.; Gönczi, M.; Csernoch, L.; et al. Genetic Manipulation of CB1 Cannabinoid Receptors Reveals a Role in Maintaining Proper Skeletal Muscle Morphology and Function in Mice. Int. J. Mol. Sci. 2022, 23, 15653. [Google Scholar] [CrossRef]
  39. Sztretye, M.; Geyer, N.; Vincze, J.; Al-Gaadi, D.; Oláh, T.; Szentesi, P.; Kis, G.; Antal, M.; Balatoni, I.; Csernoch, L.; et al. SOCE Is Important for Maintaining Sarcoplasmic Calcium Content and Release in Skeletal Muscle Fibers. Biophys. J. 2017, 113, 2496–2507. [Google Scholar] [CrossRef]
  40. Lamboley, C.R.; Pearce, L.; Seng, C.; Meizoso-Huesca, A.; Singh, D.P.; Frankish, B.P.; Kaura, V.; Lo, H.P.; Ferguson, C.; Allen, P.D.; et al. Ryanodine Receptor Leak Triggers Fiber Ca(2+) Redistribution to Preserve Force and Elevate Basal Metabolism in Skeletal Muscle. Sci. Adv. 2021, 7, eabi7166. [Google Scholar] [CrossRef]
  41. Cully, T.R.; Edwards, J.N.; Murphy, R.M.; Launikonis, B.S. A Quantitative Description of Tubular System Ca2+ Handling in Fast- and Slow-Twitch Muscle Fibres. J. Physiol. 2016, 594, 2795–2810. [Google Scholar] [CrossRef] [PubMed]
  42. Lamb, G.D.; Stephenson, D.G. Measurement of Force and Calcium Release Using Mechanically Skinned Fibers from Mammalian Skeletal Muscle. J. Appl. Physiol. 2018, 125, 1105–1127. [Google Scholar] [CrossRef]
  43. Cully, T.R.; Choi, R.H.; Bjorksten, A.R.; Stephenson, D.G.; Murphy, R.M.; Launikonis, B.S. Junctional Membrane Ca(2+) Dynamics in Human Muscle Fibers Are Altered by Malignant Hyperthermia Causative RyR Mutation. Proc. Natl. Acad. Sci. USA 2018, 115, 8215–8220. [Google Scholar] [CrossRef]
  44. Brini, M.; Carafoli, E. The Plasma Membrane Ca2+ ATPase and the Plasma Membrane Sodium Calcium Exchanger Cooperate in the Regulation of Cell Calcium. Cold Spring Harb. Perspect. Biol. 2011, 3, a004168. [Google Scholar] [CrossRef] [PubMed]
  45. Oláh, T.; Bodnár, D.; Tóth, A.; Vincze, J.; Fodor, J.; Reischl, B.; Kovács, A.; Ruzsnavszky, O.; Dienes, B.; Szentesi, P.; et al. Cannabinoid Signalling Inhibits Sarcoplasmic Ca2+ Release and Regulates Excitation–Contraction Coupling in Mammalian Skeletal Muscle. J. Physiol. 2016, 594, 7381–7398. [Google Scholar] [CrossRef]
  46. González-Mariscal, I.; Montoro, R.A.; O’Connel, J.F.; Kim, Y.; Gonzalez-Freire, M.; Liu, Q.R.; Alfaras, I.; Carlson, O.D.; Lehrmann, E.; Zhang, Y.; et al. Muscle Cannabinoid 1 Receptor Regulates Il-6 and Myostatin Expression, Governing Physical Performance and Whole-Body Metabolism. FASEB J. 2019, 33, 5850–5863. [Google Scholar] [CrossRef]
  47. Gaglianone, R.B.; Santos, A.T.; Bloise, F.F.; Ortiga-Carvalho, T.M.; Costa, M.L.; Quirico-Santos, T.; da Silva, W.S.; Mermelstein, C. Reduced Mitochondrial Respiration and Increased Calcium Deposits in the EDL Muscle, but Not in Soleus, from 12-Week-Old Dystrophic Mdx Mice. Sci. Rep. 2019, 9, 1986. [Google Scholar] [CrossRef] [PubMed]
  48. Iannotti, F.A.; Silvestri, C.; Mazzarella, E.; Martella, A.; Calvigioni, D.; Piscitelli, F.; Ambrosino, P.; Petrosino, S.; Czifra, G.; Bíró, T.; et al. The Endocannabinoid 2-AG Controls Skeletal Muscle Cell Differentiation via CB1 Receptor-Dependent Inhibition of Kv7 Channels. Proc. Natl. Acad. Sci. USA 2014, 111, E2472–E2481. [Google Scholar] [CrossRef]
  49. Mareedu, S.; Million, E.D.; Duan, D.; Babu, G.J. Abnormal Calcium Handling in Duchenne Muscular Dystrophy: Mechanisms and Potential Therapies. Front. Physiol. 2021, 12, 647010. [Google Scholar] [CrossRef]
  50. Koenig, X.; Choi, R.H.; Schicker, K.; Singh, D.P.; Hilber, K.; Launikonis, B.S. Mechanistic Insights into Store-Operated Ca2+ Entry during Excitation-Contraction Coupling in Skeletal Muscle. Biochim. Biophys. Acta-Mol. Cell Res. 2019, 1866, 1239–1248. [Google Scholar] [CrossRef]
  51. Pearce, L.; Meizoso-Huesca, A.; Seng, C.; Lamboley, C.R.; Singh, D.P.; Launikonis, B.S. Ryanodine Receptor Activity and Store-Operated Ca2+ Entry: Critical Regulators of Ca2+ Content and Function in Skeletal Muscle. J. Physiol. 2023, 601, 4183–4202. [Google Scholar] [CrossRef] [PubMed]
  52. Bleck, C.K.E.; Kim, Y.; Willingham, T.B.; Glancy, B. Subcellular Connectomic Analyses of Energy Networks in Striated Muscle. Nat. Commun. 2018, 9, 5111. [Google Scholar] [CrossRef] [PubMed]
  53. Garbincius, J.F.; Elrod, J.W. Mitochondrial Calcium Exchange in Physiology and Disease. Physiol. Rev. 2022, 102, 893–992. [Google Scholar] [CrossRef]
  54. Wang, Y.; Li, X.; Zhao, F. MCU-Dependent MROS Generation Regulates Cell Metabolism and Cell Death Modulated by the AMPK/PGC-1α/SIRT3 Signaling Pathway. Front. Med. 2021, 8, 674986. [Google Scholar] [CrossRef]
  55. Pallafacchina, G.; Zanin, S.; Rizzuto, R. Recent Advances in the Molecular Mechanism of Mitochondrial Calcium Uptake. F1000Research 2018, 7, F1000-Faculty. [Google Scholar] [CrossRef]
  56. Hasan, G. IP3Rs and NSOCE—Tied Together at Two Ends. Contact 2024, 7. [Google Scholar] [CrossRef]
  57. Mammucari, C.; Raffaello, A.; Vecellio Reane, D.; Gherardi, G.; De Mario, A.; Rizzuto, R. Mitochondrial Calcium Uptake in Organ Physiology: From Molecular Mechanism to Animal Models. Pflug. Arch. 2018, 470, 1165–1179. [Google Scholar] [CrossRef]
  58. McCommis, K.S.; Finck, B.N. Mitochondrial Pyruvate Transport: A Historical Perspective and Future Research Directions. Biochem. J. 2015, 466, 443–454. [Google Scholar] [CrossRef] [PubMed]
  59. Casanova, A.; Wevers, A.; Navarro-Ledesma, S.; Pruimboom, L. Mitochondria: It Is All about Energy. Front. Physiol. 2023, 14, 1114231. [Google Scholar] [CrossRef]
  60. Mailloux, R.J. Teaching the Fundamentals of Electron Transfer Reactions in Mitochondria and the Production and Detection of Reactive Oxygen Species. Redox Biol. 2015, 4, 381–398. [Google Scholar] [CrossRef]
  61. Tedesco, L.; Valerio, A.; Cervino, C.; Cardile, A.; Pagano, C.; Vettor, R.; Pasquali, R.; Carruba, M.O.; Marsicano, G.; Lutz, B.; et al. Cannabinoid Type 1 Receptor Blockade Promotes Oxide Synthase Expression in White Adipocytes. Diabetes 2008, 57, 2028–2036. [Google Scholar] [CrossRef] [PubMed]
  62. Abán, C.E.; Accialini, P.L.; Etcheverry, T.; Leguizamón, G.F.; Martinez, N.A.; Farina, M.G. Crosstalk Between Nitric Oxide and Endocannabinoid Signaling Pathways in Normal and Pathological Placentation. Front. Physiol. 2018, 9, 1699. [Google Scholar] [CrossRef]
  63. Filadi, R.; Greotti, E.; Turacchio, G.; Luini, A.; Pozzan, T.; Pizzo, P. Mitofusin 2 Ablation Increases Endoplasmic Reticulum-Mitochondria Coupling. Proc. Natl. Acad. Sci. USA 2015, 112, E2174–E2181. [Google Scholar] [CrossRef] [PubMed]
  64. Casellas-Díaz, S.; Larramona-Arcas, R.; Riqué-Pujol, G.; Tena-Morraja, P.; Müller-Sánchez, C.; Segarra-Mondejar, M.; Gavaldà-Navarro, A.; Villarroya, F.; Reina, M.; Martínez-Estrada, O.M.; et al. Mfn2 Localization in the ER Is Necessary for Its Bioenergetic Function and Neuritic Development. EMBO Rep. 2021, 22, e51954. [Google Scholar] [CrossRef]
  65. Murphy, E.; Steenbergen, C. Regulation of Mitochondrial Ca2+ Uptake. Annu. Rev. Physiol. 2021, 83, 107–126. [Google Scholar] [CrossRef]
  66. Sztretye, M.; Singlár, Z.; Szabó, L.; Angyal, Á.; Balogh, N.; Vakilzadeh, F.; Szentesi, P.; Dienes, B.; Csernoch, L. Improved Tetanic Force and Mitochondrial Calcium Homeostasis by Astaxanthin Treatment in Mouse Skeletal Muscle. Antioxidants 2020, 9, 98. [Google Scholar] [CrossRef]
  67. Stephenson, D.G.; Williams, D.A. Calcium-Activated Force Responses in Fast- and Slow-Twitch Skinned Muscle Fibres of the Rat at Different Temperatures. J. Physiol. 1981, 317, 281–302. [Google Scholar] [CrossRef]
  68. Grynkiewicz, G.; Poenie, M.; Tsien, R.Y. A New Generation of Ca2+ Indicators with Greatly Improved Fluorescence Properties. J. Biol. Chem. 1985, 260, 3440–3450. [Google Scholar] [CrossRef] [PubMed]
  69. Royer, L.; Pouvreau, S.; Ríos, E. Evolution and Modulation of Intracellular Calcium Release during Long-Lasting, Depleting Depolarization in Mouse Muscle. J. Physiol. 2008, 586, 4609–4629. [Google Scholar] [CrossRef]
  70. Melzer, W.; Rios, E.; Schneider, M.F. A General Procedure for Determining the Rate of Calcium Release from the Sarcoplasmic Reticulum in Skeletal Muscle Fibers. Biophys. J. 1987, 51, 849–863. [Google Scholar] [CrossRef]
Figure 1. In vivo grip force and coordination experiments. (A) Experimental scheme for the evaluation of control (Cre−/−) and skmCB1-KD (Cre+/−) mice. Tamoxifen feeding was started at one month of age and lasted two months (scheme was created with BioRender). Inset shows the normalized CB1 mRNA expression measured via qPCR in M. tibialis anterior muscles. 18sRNA was used as housekeeping gene. n = 2 technical replicates from N = 4 and 3 biological samples for Cre−/− (circles) and Cre+/− (triangles), respectively. Here, and all subsequent cases (unless otherwise noted) Student’s t-test was used to assess significance. ** p < 0.009. (B) Rota-Rod measurements were used to assess muscle performance and coordination. The average latency to fall was recorded using the protocol illustrated. On the day of the evaluation 3 trials spaced at 1 min intervals were executed at a constant speed of 4 rpm that was maintained for 60 s for acclimatization purposes. After a 30 min’ rest period, the acceleration speed was gradually increased from 4 to 300 rpm in 5 min. Three test trials were recorded with 15 min intervals and the average of these trials was noted for each animal. (C) Body weight monitoring during tamoxifen feeding. For each mouse, the body weight was assessed weekly. The bar graph presents the average body weight starting from the beginning of the tamoxifen feeding at one month of age. N is the number of specimens investigated in each group (here, and all subsequent panels). (D) The average latency to fall was recorded at different age time points in Cre−/− and Cre+/− mice during the Rota-Rod test evaluations. Note that after one month of tamoxifen feeding, the Cre+/− animals performed significantly worse, and this tendency was maintained until the end of feeding. * p ≤ 0.05. (E) Grip force normalized to body weight in Cre−/− and Cre+/− mice. After 2 months of tamoxifen feeding the Cre+/− animals performed significantly worse than the control group. * p ≤ 0.05.
Ijms 26 05291 g001
Figure 2. Measurement of SOCE in skinned EDL fibers. (A) Schematic representation of the protocol steps to perform measurements of SOCE in skinned fibers of mouse EDL muscles: (1) Isolated EDL fiber under paraffin oil with intact sarcolemma. (2) Incubation of the muscle fiber with a low-affinity Ca2+-sensitive dye (Rhod-5N). (3) Skinning of the fiber under paraffin oil traps Rhod-5N in the sealed t-system which allows measuring [Ca2+]t-sys and enables full access to the cytoplasm. (B) The steady-state [Ca2+]t-sys at baseline and after reuptake of Ca2+ following full depletion in Ca2+ and Mg2+ free and 30 mM caffeine solution (see panels C and D) in Cre−/− and Cre+/− mice. Note that in the Cre+/− animals the reuptake was significantly smaller than in the Cre−/− specimens. The numbers of animals/fibers are given in brackets. ANOVA with Tukey’s post hoc test was performed. * and *** indicate statistical significance at p < 0.05 and p < 0.001, respectively. (C,D) Typical recording of [Ca2+]t-sys derived from the calibrated fluorescence of Rhod-5N in a control Cre−/− (C) and a skmCB1-KD Cre+/− (D) skinned fiber following steps 1–3 presented in panel A. The fiber is bathed in an internal solution containing 1 mM free Mg2+ and 67 nM free Ca2+. SOCE is induced through direct activation of the RyR1s by exposing the fiber to a “release” solution containing 0 mM free Mg2+ and 30 mM caffeine. Activation of pSOCE (dark and bright green traces) is seen as a steep depletion of [Ca2+]t-sys. The depletion is fully reversible as the t-system reloads with Ca2+ upon restoration of physiological [Ca2+]cyto and [Mg2+]cyto. Red traces show the t-system release flux calculated as the first-time derivative of the dark or bright green traces. Green arrows indicate the peak t-system uptake fluxes at known calcium concentration content solutions. Orange arrows indicate the peak t-system release fluxes. (EG) show [Ca2+]t-sys, the peak t-system release flux and the peak t-system uptake flux plotted as a function of [Ca2+]cyto. Note that the peak t-system uptake flux was altered at the highest concentration tested. *p  ≤  0.05. (H) Strong linear correlation between the peak t-system release flux (mMs−1) and [Ca2+]t-sys (mM), but no difference between Cre−/− and Cre+/− fibers.
Ijms 26 05291 g002
Figure 3. Intracellular calcium homeostasis assessment in FDB fibers. (A) Representative line-scan image of Rhod-2 fluorescence normalized to the baseline value F0(x) in a Cre+/− FDB fiber subjected to successive rectangular depolarizing voltage steps (top black trace) under whole-cell voltage clamp. The Ca2+ transients were elicited by 200 ms long membrane depolarizations to +30 mV applied once per second. The white trace is the temporal profile of the normalized fluorescence (F) obtained by averaging 50 lines in the spatial domain normalized to average resting F0(x) values. (B) For one representative Cre−/− and one Cre+/− fiber the SR Ca2+ content was estimated from the amount released during each depolarizing pulse minus the removal flux. A single-exponential function was fitted to the points obtained following 8 consecutive stimuli (see Equation (A10) in Appendix A in Sztretye et al. [39]) with the following parameters: y0 = 190.7 vs. 158.7; a = 375.4 vs. 276.3; and b = 0.65 vs. 1.11, respectively, where b is the time constant of SR depletion, and a is the remaining SR calcium content after the last applied stimulus. (C) [Ca2+]SR values were calculated for 7 and 11 FDB fibers from 3 Cre−/− and 6 Cre+/− animals, respectively. The calculation of [Ca2+]SR was based on similar exponential fits as seen in (B). On average, by trend, in the Cre+/− fibers (bright green), the SR calcium content was slightly lower than in the control Cre−/− specimens. This difference was not statistically different. (D) Pooled data of the calculated fluxes through Orai1 channels (K1) as predicted by our previously introduced model (see Appendix A in Sztretye et al. [39]) show non-significant calcium flux changes upon CB1 knockdown in the Cre+/− fibers. (E) The calculated SERCA pump activity (pVmax) is preserved in Cre+/− fibers. (F) The resting intracellular calcium concentration is decreased following CB1R knockdown. Results presented as violin plots are from 109 and 72 fibers, from 3 Cre−/− and 6 Cre+/− animals, respectively. Dashed lines depict the median (central horizontal line in the box) while the dotted lines indicate the upper and lower quartiles. * indicates statistical significance at p < 0.03.
Ijms 26 05291 g003
Figure 4. Mitochondrial respiration measurement performed on gastrocnemius muscle fibers. (A) Representative traces of the short treatment protocol for mitochondrial respiration measurement; the lines indicate the chamber O2 concentrations (blue and cyan) and O2 consumption (dark and bright green) in the Cre−/− and Cre+/− muscles samples, respectively. (B) Representative plots of the long treatment protocol; the lines show chamber O2 concentrations (blue and cyan) and O2 consumption (dark and bright green) in muscles from Cre−/− and Cre+/− mice. (C) Measured LEAKS state, oxidative phosphorylation (OXPHOS), LEAKOmy state are presented as O2 flux/V (pmol/[s × mL]). (D) Measured complex I-linked oxidative phosphorylation (complex I), complex II-linked oxidative phosphorylation (complex II), and complex IV respiratory activity (complex IV) are presented as O2 flux/V (pmol/[s × mL]). The box plots demonstrate the median (horizontal line in the box) and the 25th (lower whisker) and 75th (upper whisker) percentiles (n = 6). * indicates statistical significance at p < 0.01. (E) Baseline, residual oxygen consumption (ROX), and respiratory control ratio (RCR) are plotted as the ratio of OXPHOS and LEAKOmy status. * indicates statistical significance at * p < 0.05. Abbreviations: Asc-TMPD, ascorbate and N,N,N’,N’-Tetramethyl-p-phenylenediamine dihydrochloride; AmA, antimycin A; au, arbitrary unit; CytC, cytochrome c; Glu, glutamate and malate; Omy, oligomycin; Rot, rotenone; S, succinate; NaN3, sodium azide.
Ijms 26 05291 g004
Figure 5. Measurement of FCCP-dependent dissipation of mitochondrial membrane potential (Δψm) in FDB fibers. (A,C) Representative confocal image series of TMRE fluorescence recorded on an FDB fiber from a Cre−/− (A) and a Cre+/− (C) mouse, respectively, before (10 s) and during the application of 1 µM FCCP (indicated in panel (B,D) by the blue horizontal line). Note the fading over time of the dye fluorescence as the un-coupler poisons the organelle, leading to Δψm loss. (B,D) Normalized TMRE fluorescence for the two representative cells presented in panels (A,C). The red symbols and red arrows indicate the time points when the image series shown in (A,C) were taken. The exponential fit (solid line) allowed for the calculation of Δψm decay times (τ) for the two representative examples as follows: τ =111.7 s for Cre−/− and τ =121.13 s for Cre+/−. (E) The averaged normalized TMRE fluorescence decay was slower in Cre+/− mice. Data are plotted as means ±SEM. In cyan is the average of 5 control (C57/Bl6) FDB cells, where no FCCP was administered. (F) Averaged decay time values were significantly higher following FCCP administration in the skmCB1-KD specimens. * indicates statistical significance at * p < 0.02. Abbreviations: TMRE, tetramethylrhodamine, ethyl ester; FCCP, carbonyl cyanide-p-trifluoromethoxyphenylhydrazone.
Ijms 26 05291 g005
Figure 6. Mitochondrial dysfunction underlies reduced muscle performance in CB1 receptor-deficient mice. Red arrows indicate the changes obtained in our current experiments following tamoxifen-induced muscle-specific CB1 downregulation. Green arrows show the path followed by calcium ions. Briefly, during the ECC mechanism, calcium is released from the SR via the RyR1s and then binds to contractile proteins to induce contraction. SR depletion triggers SOCE activation via Orai1/STIM1 concerted action. Upon muscle relaxation, calcium is returned to the store via the SERCA pumps or sequestered by mitochondria via uptake by the VDAC/MCU proteins. Black arrows indicate the path followed by ATP to induce muscle contraction. Besides calcium, ATP is also critical for muscle contraction, and it underlies SERCA function as well. Abbreviations: pCB1R, plasma membrane cannabinoid receptor type 1; mtCB1R, mitochondrial cannabinoid receptor type 1; DHPR, dihydropyridine receptor; PMCA, plasma membrane calcium ATPase; Orai1, calcium release-activated calcium channel protein 1; STIM1, Stromal interaction molecule 1; RyR1, ryanodine receptor type 1; SERCA, sarco(endo)plasmic reticulum calcium ATPase; NCX, sodium calcium exchanger; ATP, adenosine trisphosphate; ADP, adenosine diphosphate; VDAC, voltage activated anion channel; MCU, mitochondrial calcium uniporter; ROS, reactive oxygen species; TCA, Tricarboxylic acid; MAM, mitochondria-associated membrane. Created in BioRender. Sztretye, M. (2025) https://BioRender.com.
Ijms 26 05291 g006
Table 1. List if antibodies used in Western blot analysis.
NameCat. no.CompanyDilution
anti-Orai1MA5-15777Invitrogen1:500
anti-STIM1AB-9870Sigma1:1000
anti-PMCA5F10Abcam *1:1000
anti-VDACMA5-35349Invitrogen1:1000
anti-MICU1PA5-77364Invitrogen1:200
anti-Drp1C6C7Cell Signaling Technology **1:1000
anti-Mfn2D2D10Cell Signaling Technology1:1000
anti-Opa1MA-16149Invitrogen1:1000
anti-α-actininsc-166524Santa Cruz Biotechnology1:1000
anti-tubulinT5168Sigma1:4000
* Abcam, Cambridge, UK; ** Cell Signalling Technology, Danvers, MA, USA.
Table 2. Primer sequences used for identifying myosin heavy chain isoforms in muscle samples.
NameForward PrimerReverse Primer
MHCI5′-GAGTAGCTCTTGTGCTACCCAGC-3′5′-AATTGCTTTATTCTGCTTCCACC-3′
MHCIIA5′-GCAAGAAGCAGATCCAGAAAC-3′5′-GGTCTTCTTCTGTCTGGTAAGTAAGC-3′
MHCIIX5′-GCAACAGGAGATTTCTGACCTCAC-3′5′-CCAGAGATGCCTCTGCTTC-3′
18s RNA5′-GGGAGCCTGAGAAACGGC-3′5′-GGGTCGGGAGTGGGTAATTTT-3′
Disclaimer/Publisher’s Note: The statements, opinions and data contained in all publications are solely those of the individual author(s) and contributor(s) and not of MDPI and/or the editor(s). MDPI and/or the editor(s) disclaim responsibility for any injury to people or property resulting from any ideas, methods, instructions or products referred to in the content.

