
Elucidating the Anti-Diabetic Mechanisms of Mushroom Chaga (Inonotus obliquus) by Integrating LC-MS, Network Pharmacology, Molecular Docking, and Bioinformatics


Abstract

1. Introduction
2. Results
2.1. Phytochemicals Derived from Chaga
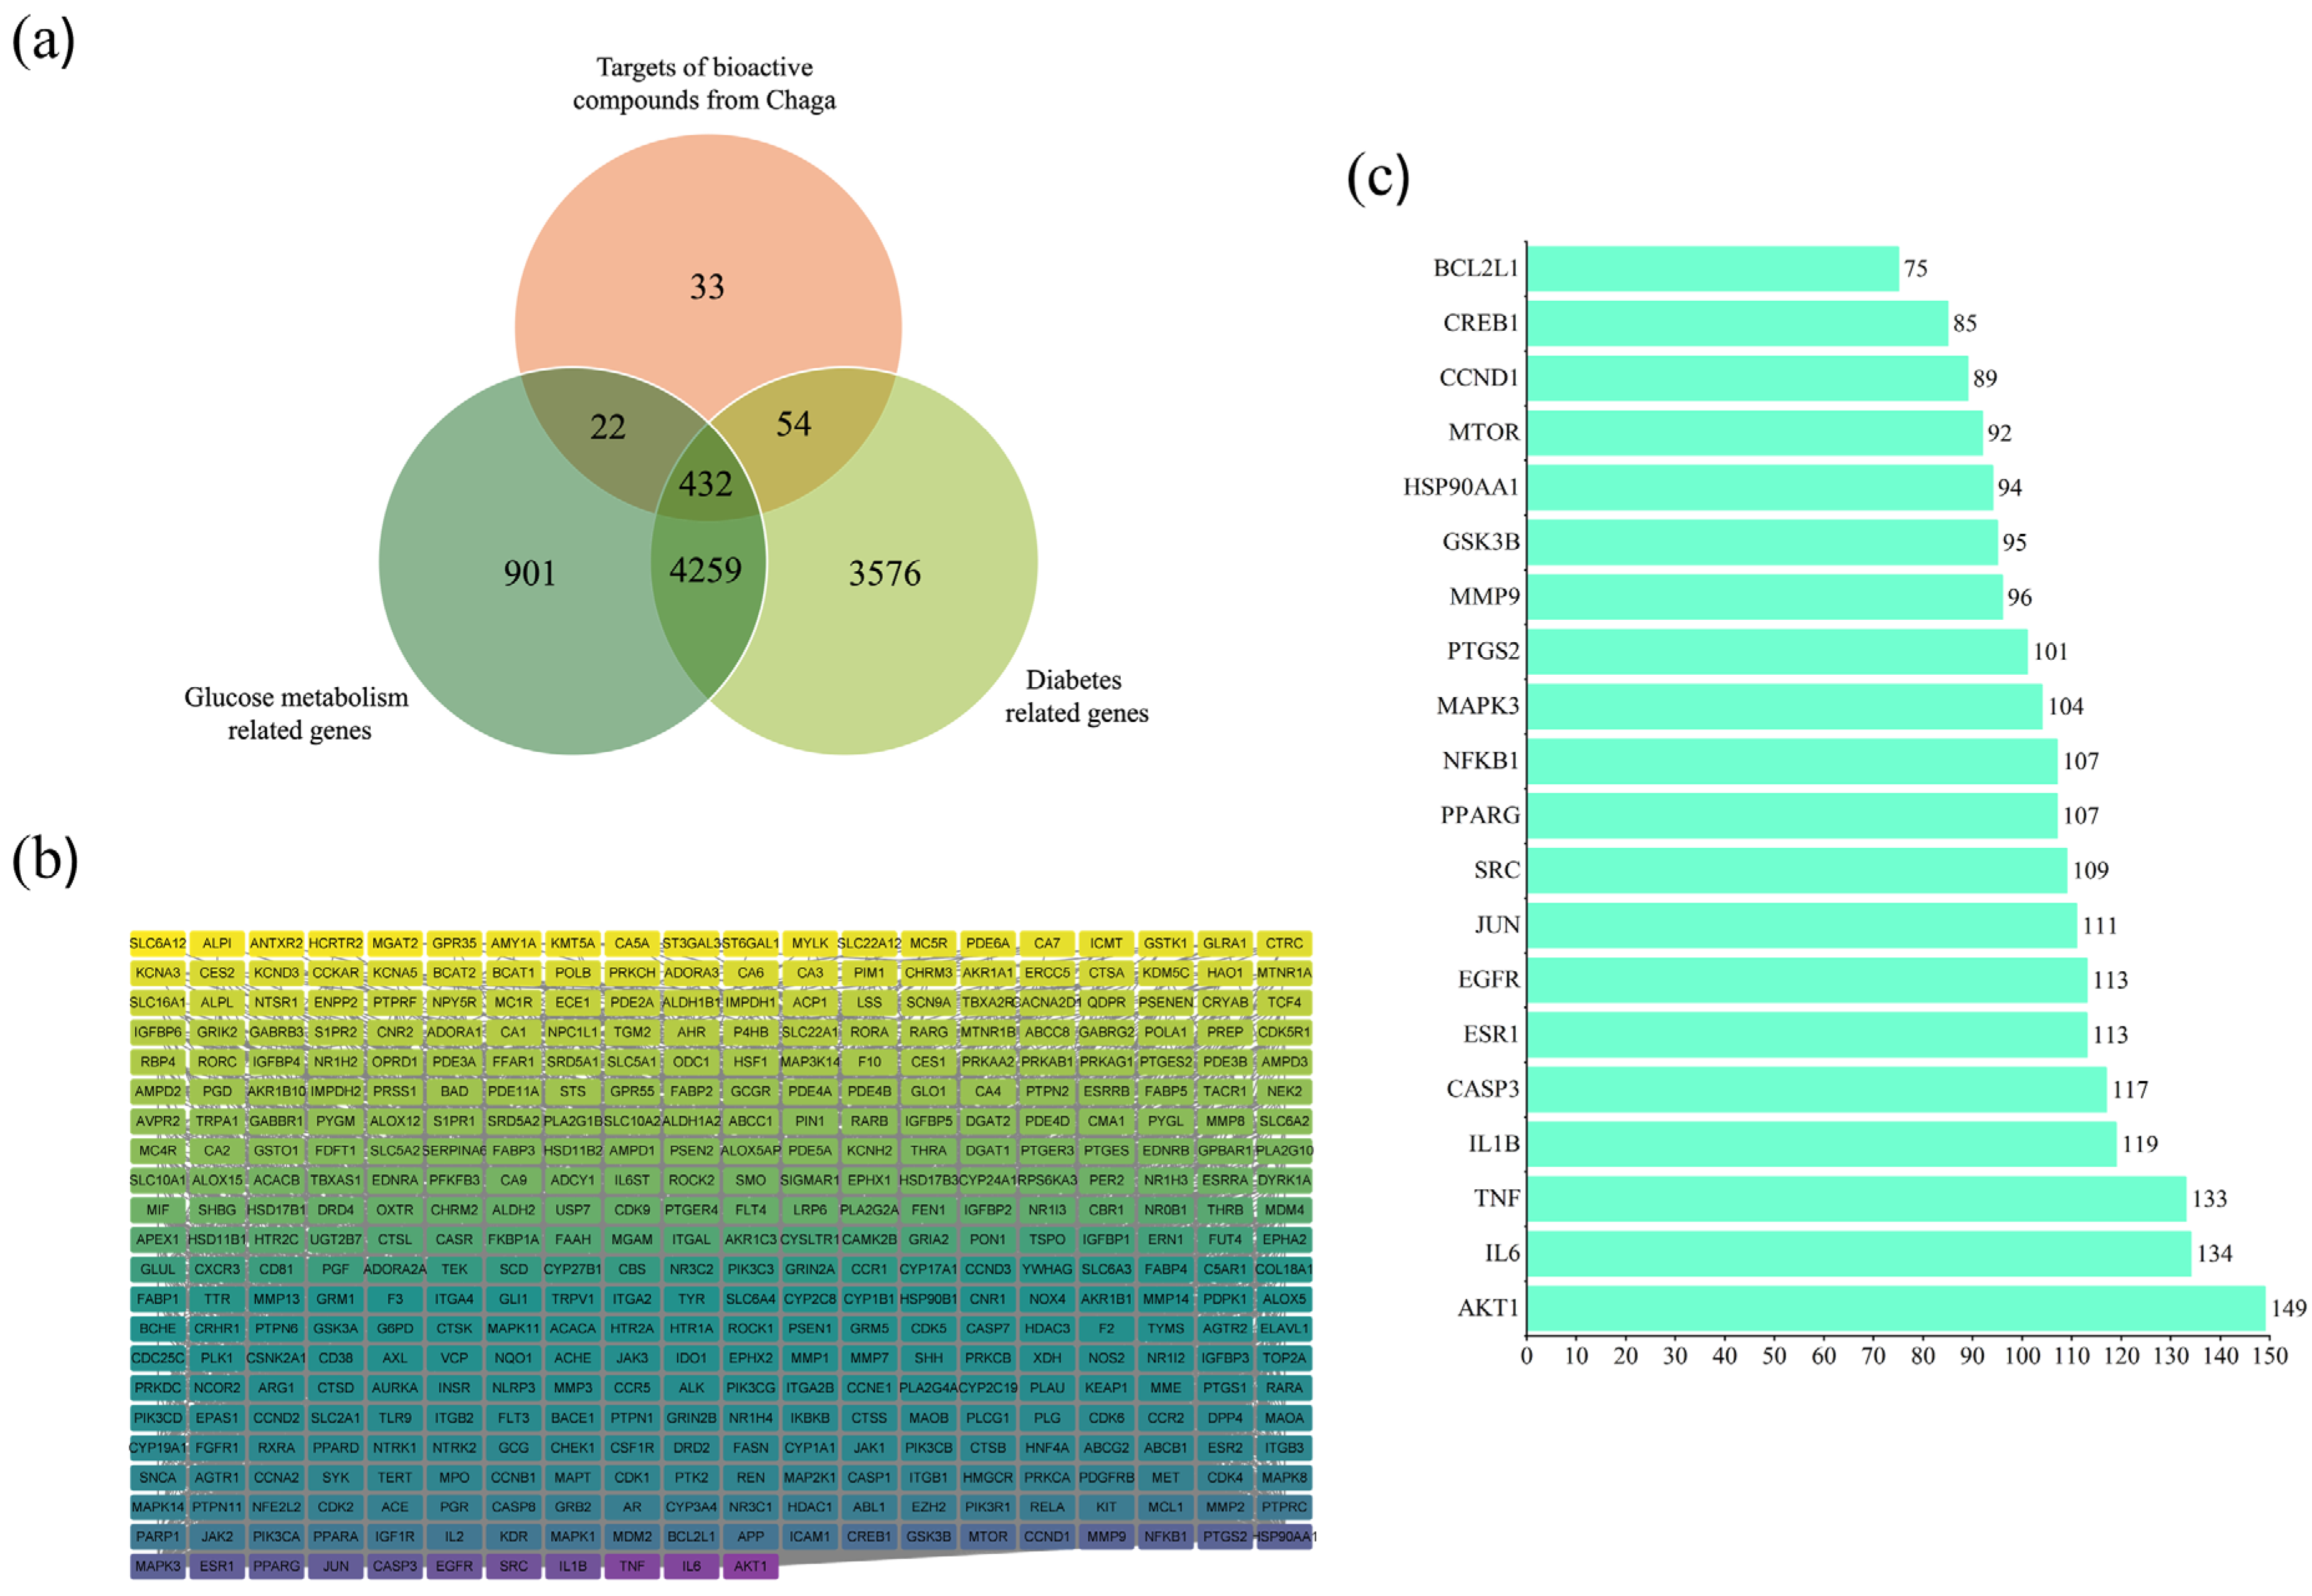
2.2. Diabetes and Compound-Related Targets
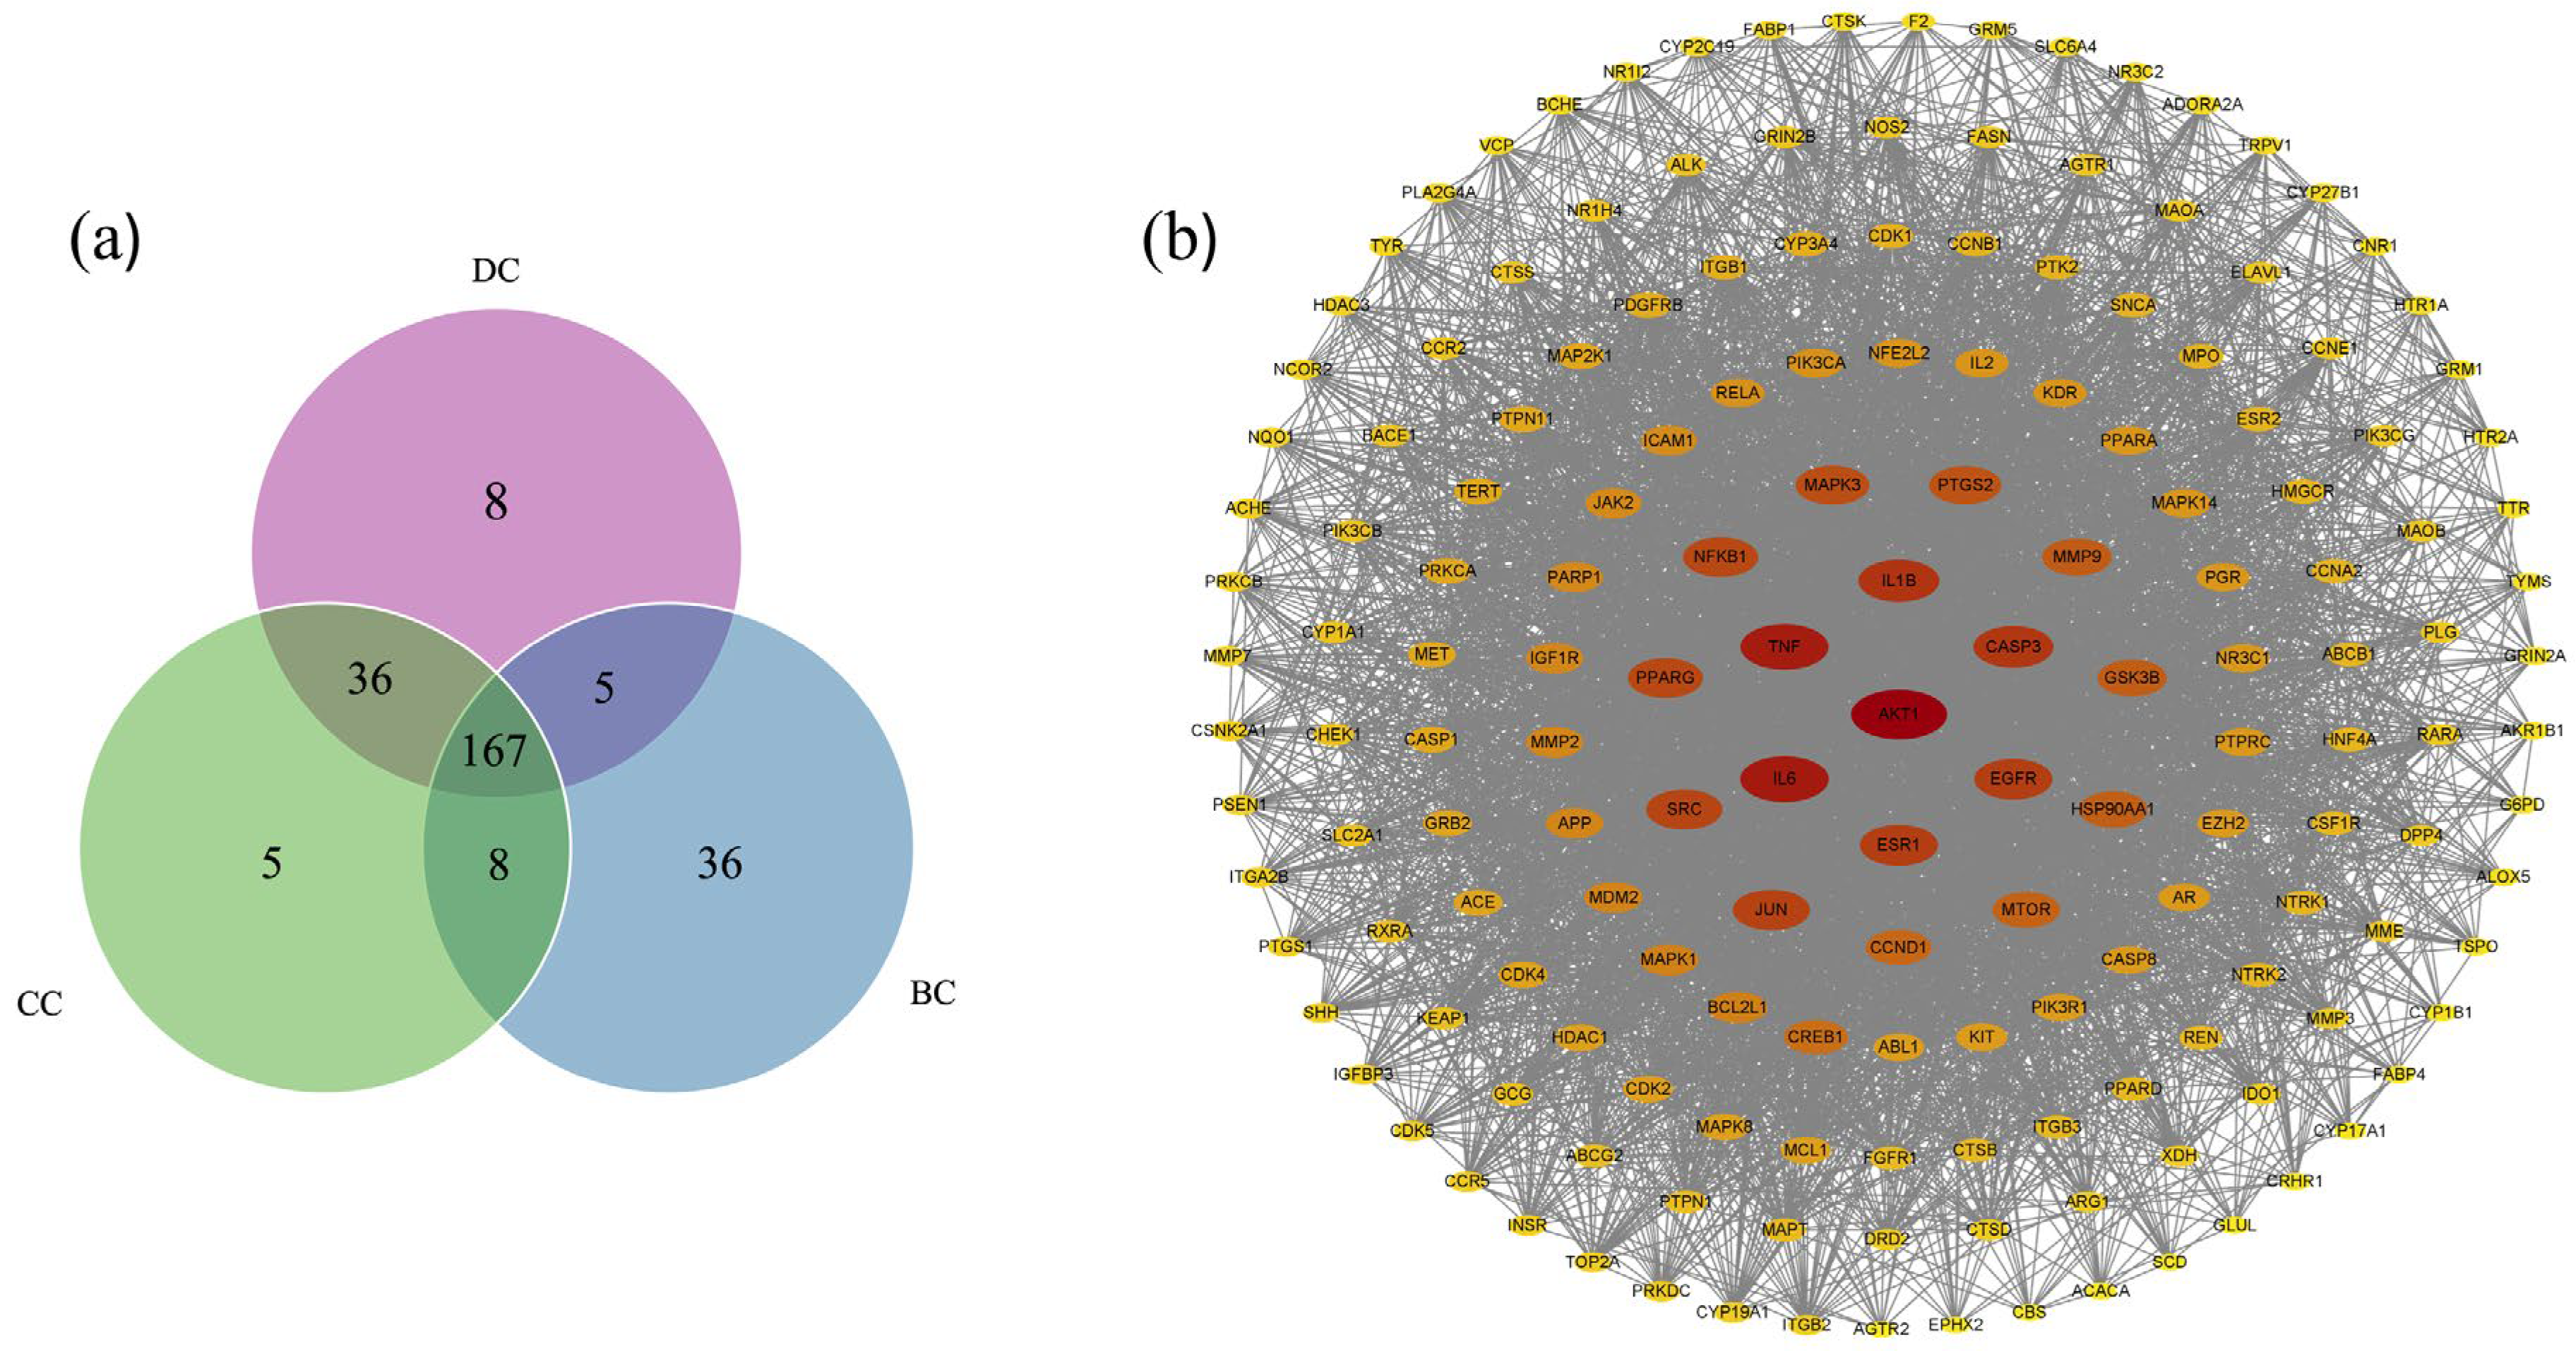
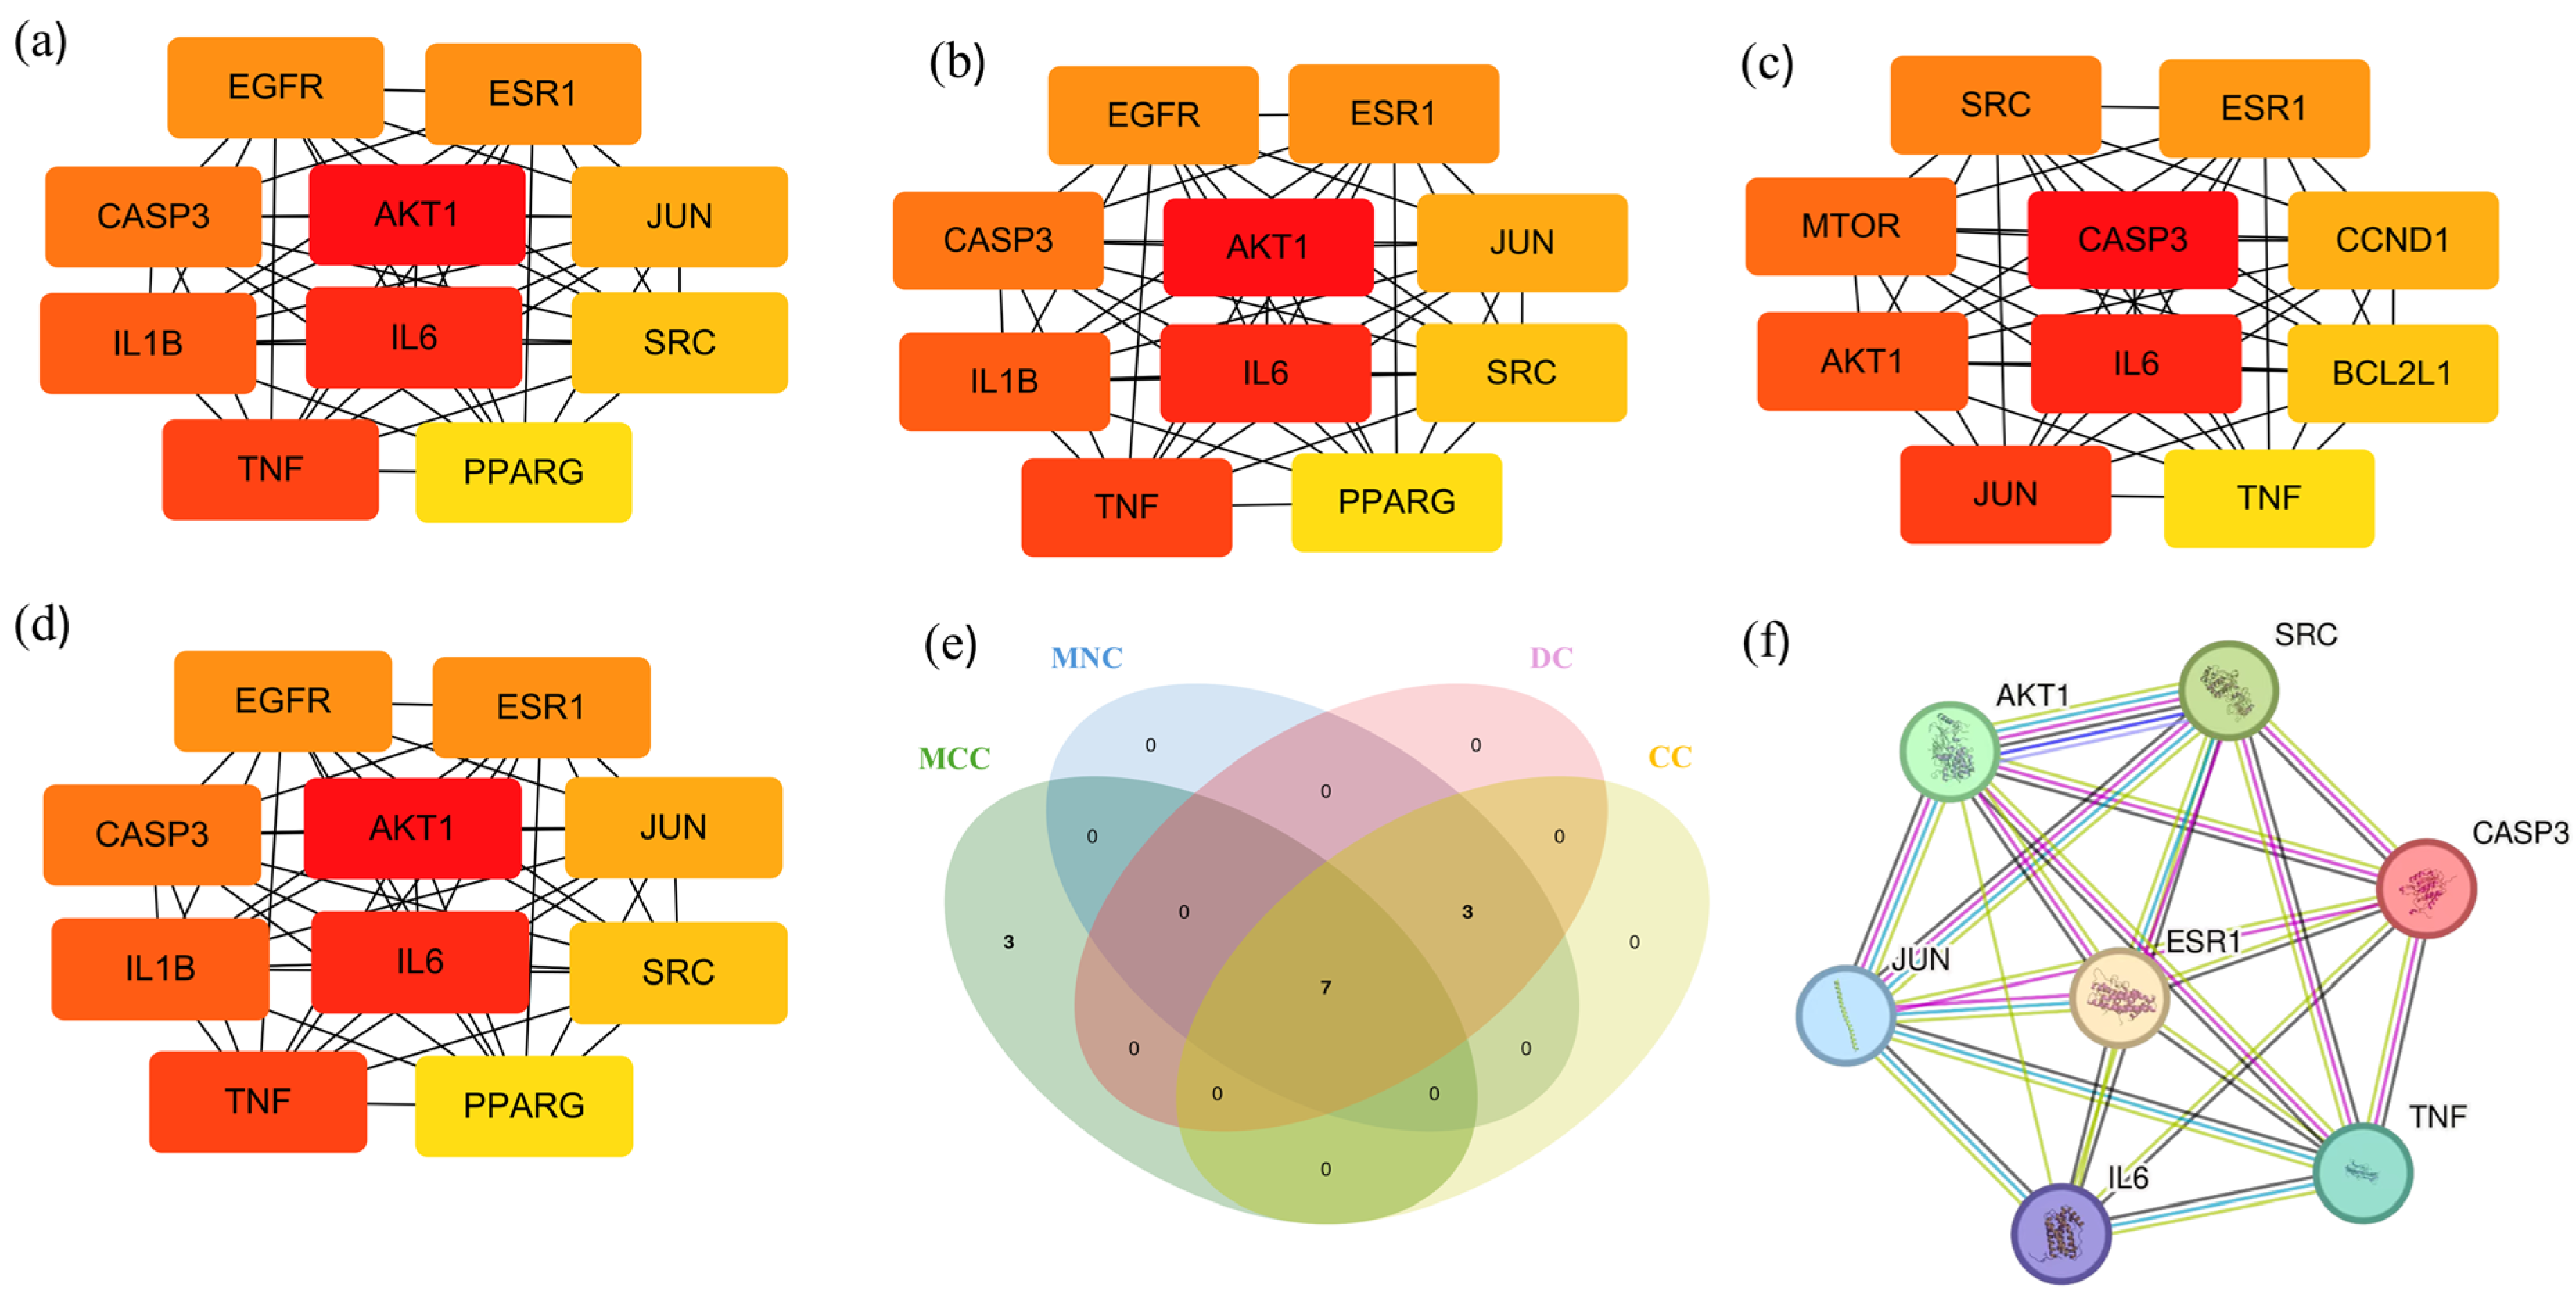
2.3. Anti-Diabetes Targets of Chaga and PPI Analysis
2.4. Core Targets for Enrichment Analysis
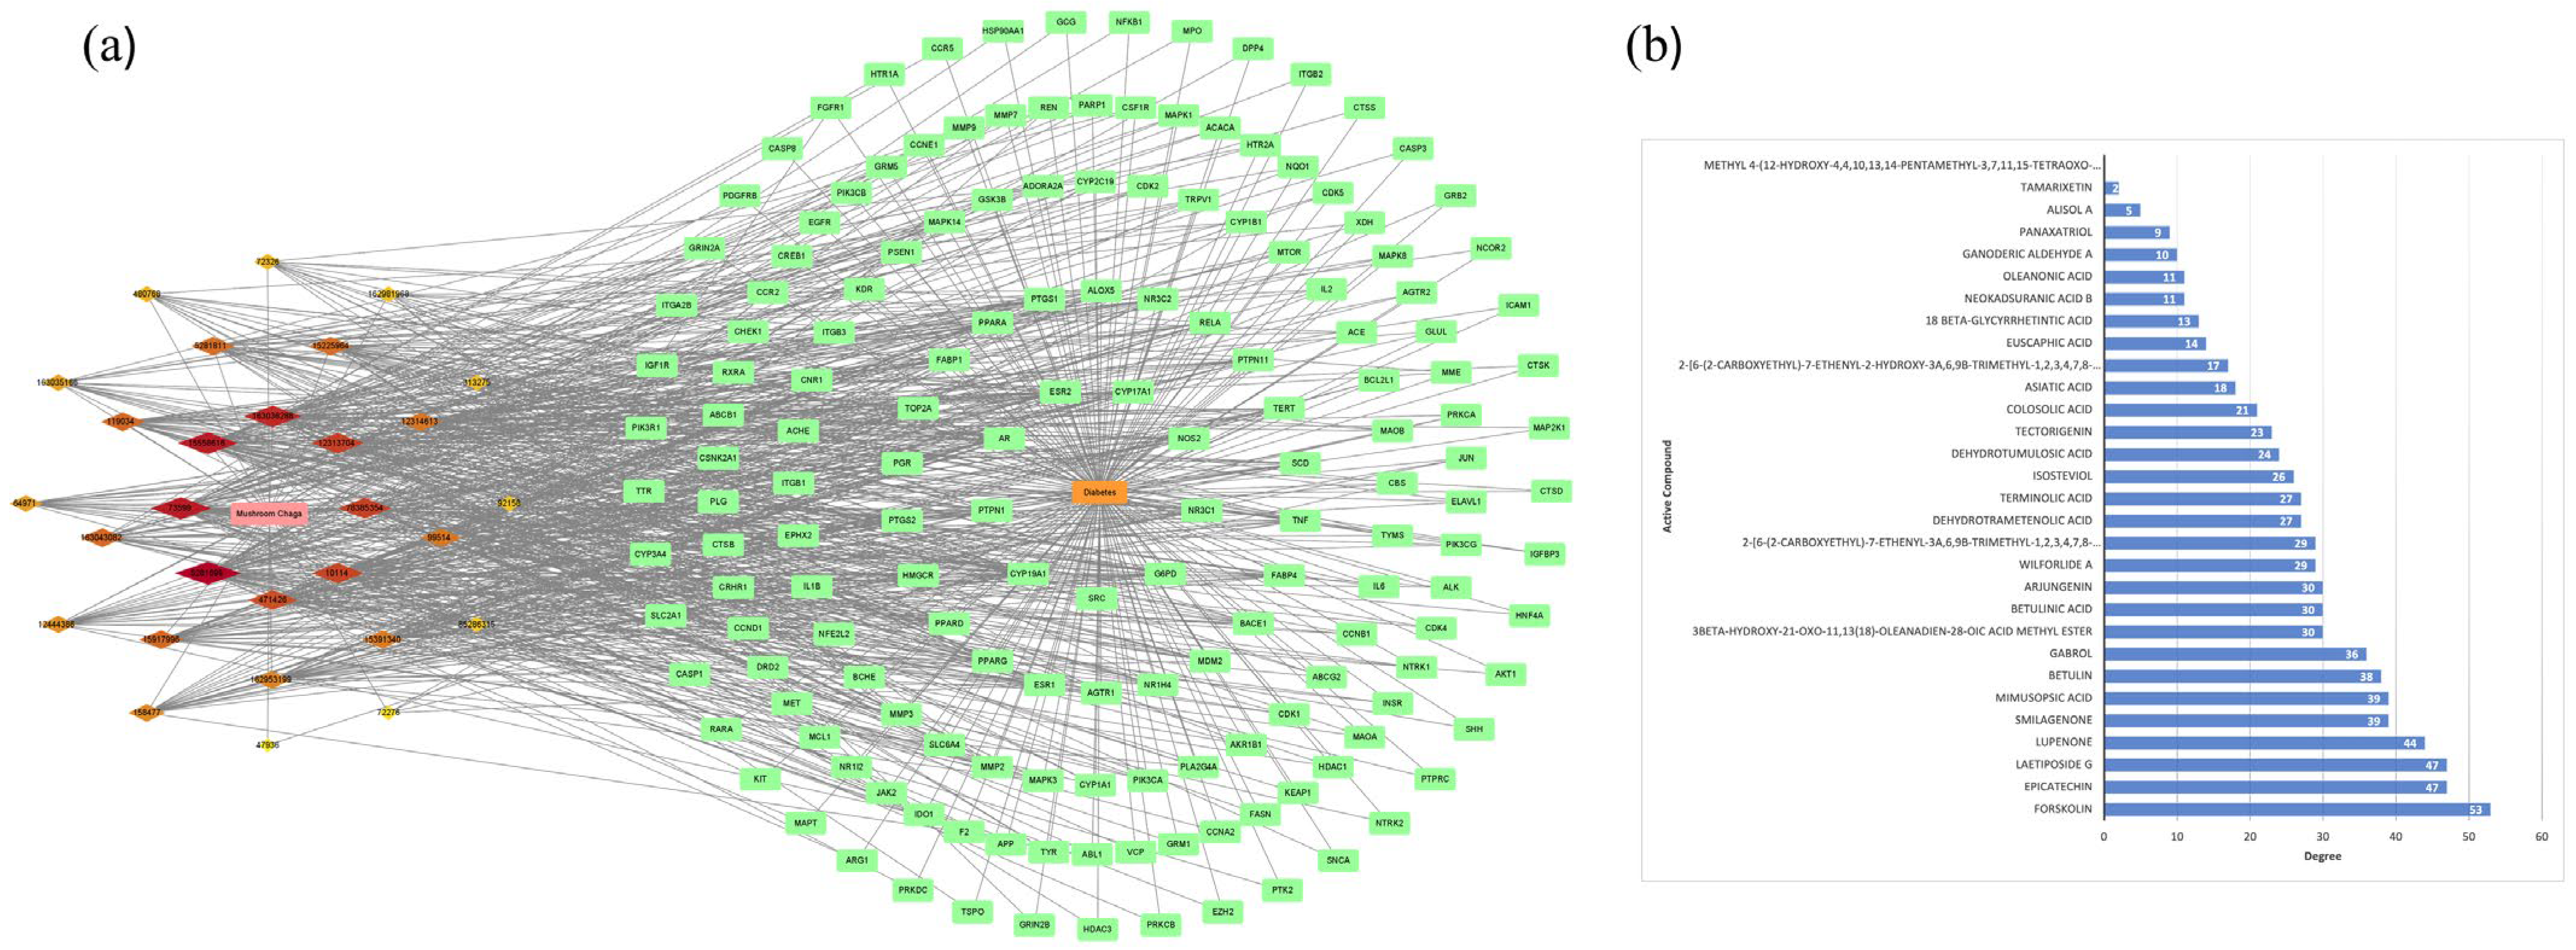
2.5. Construction of Central Targets of Chaga for Component–Target Docking
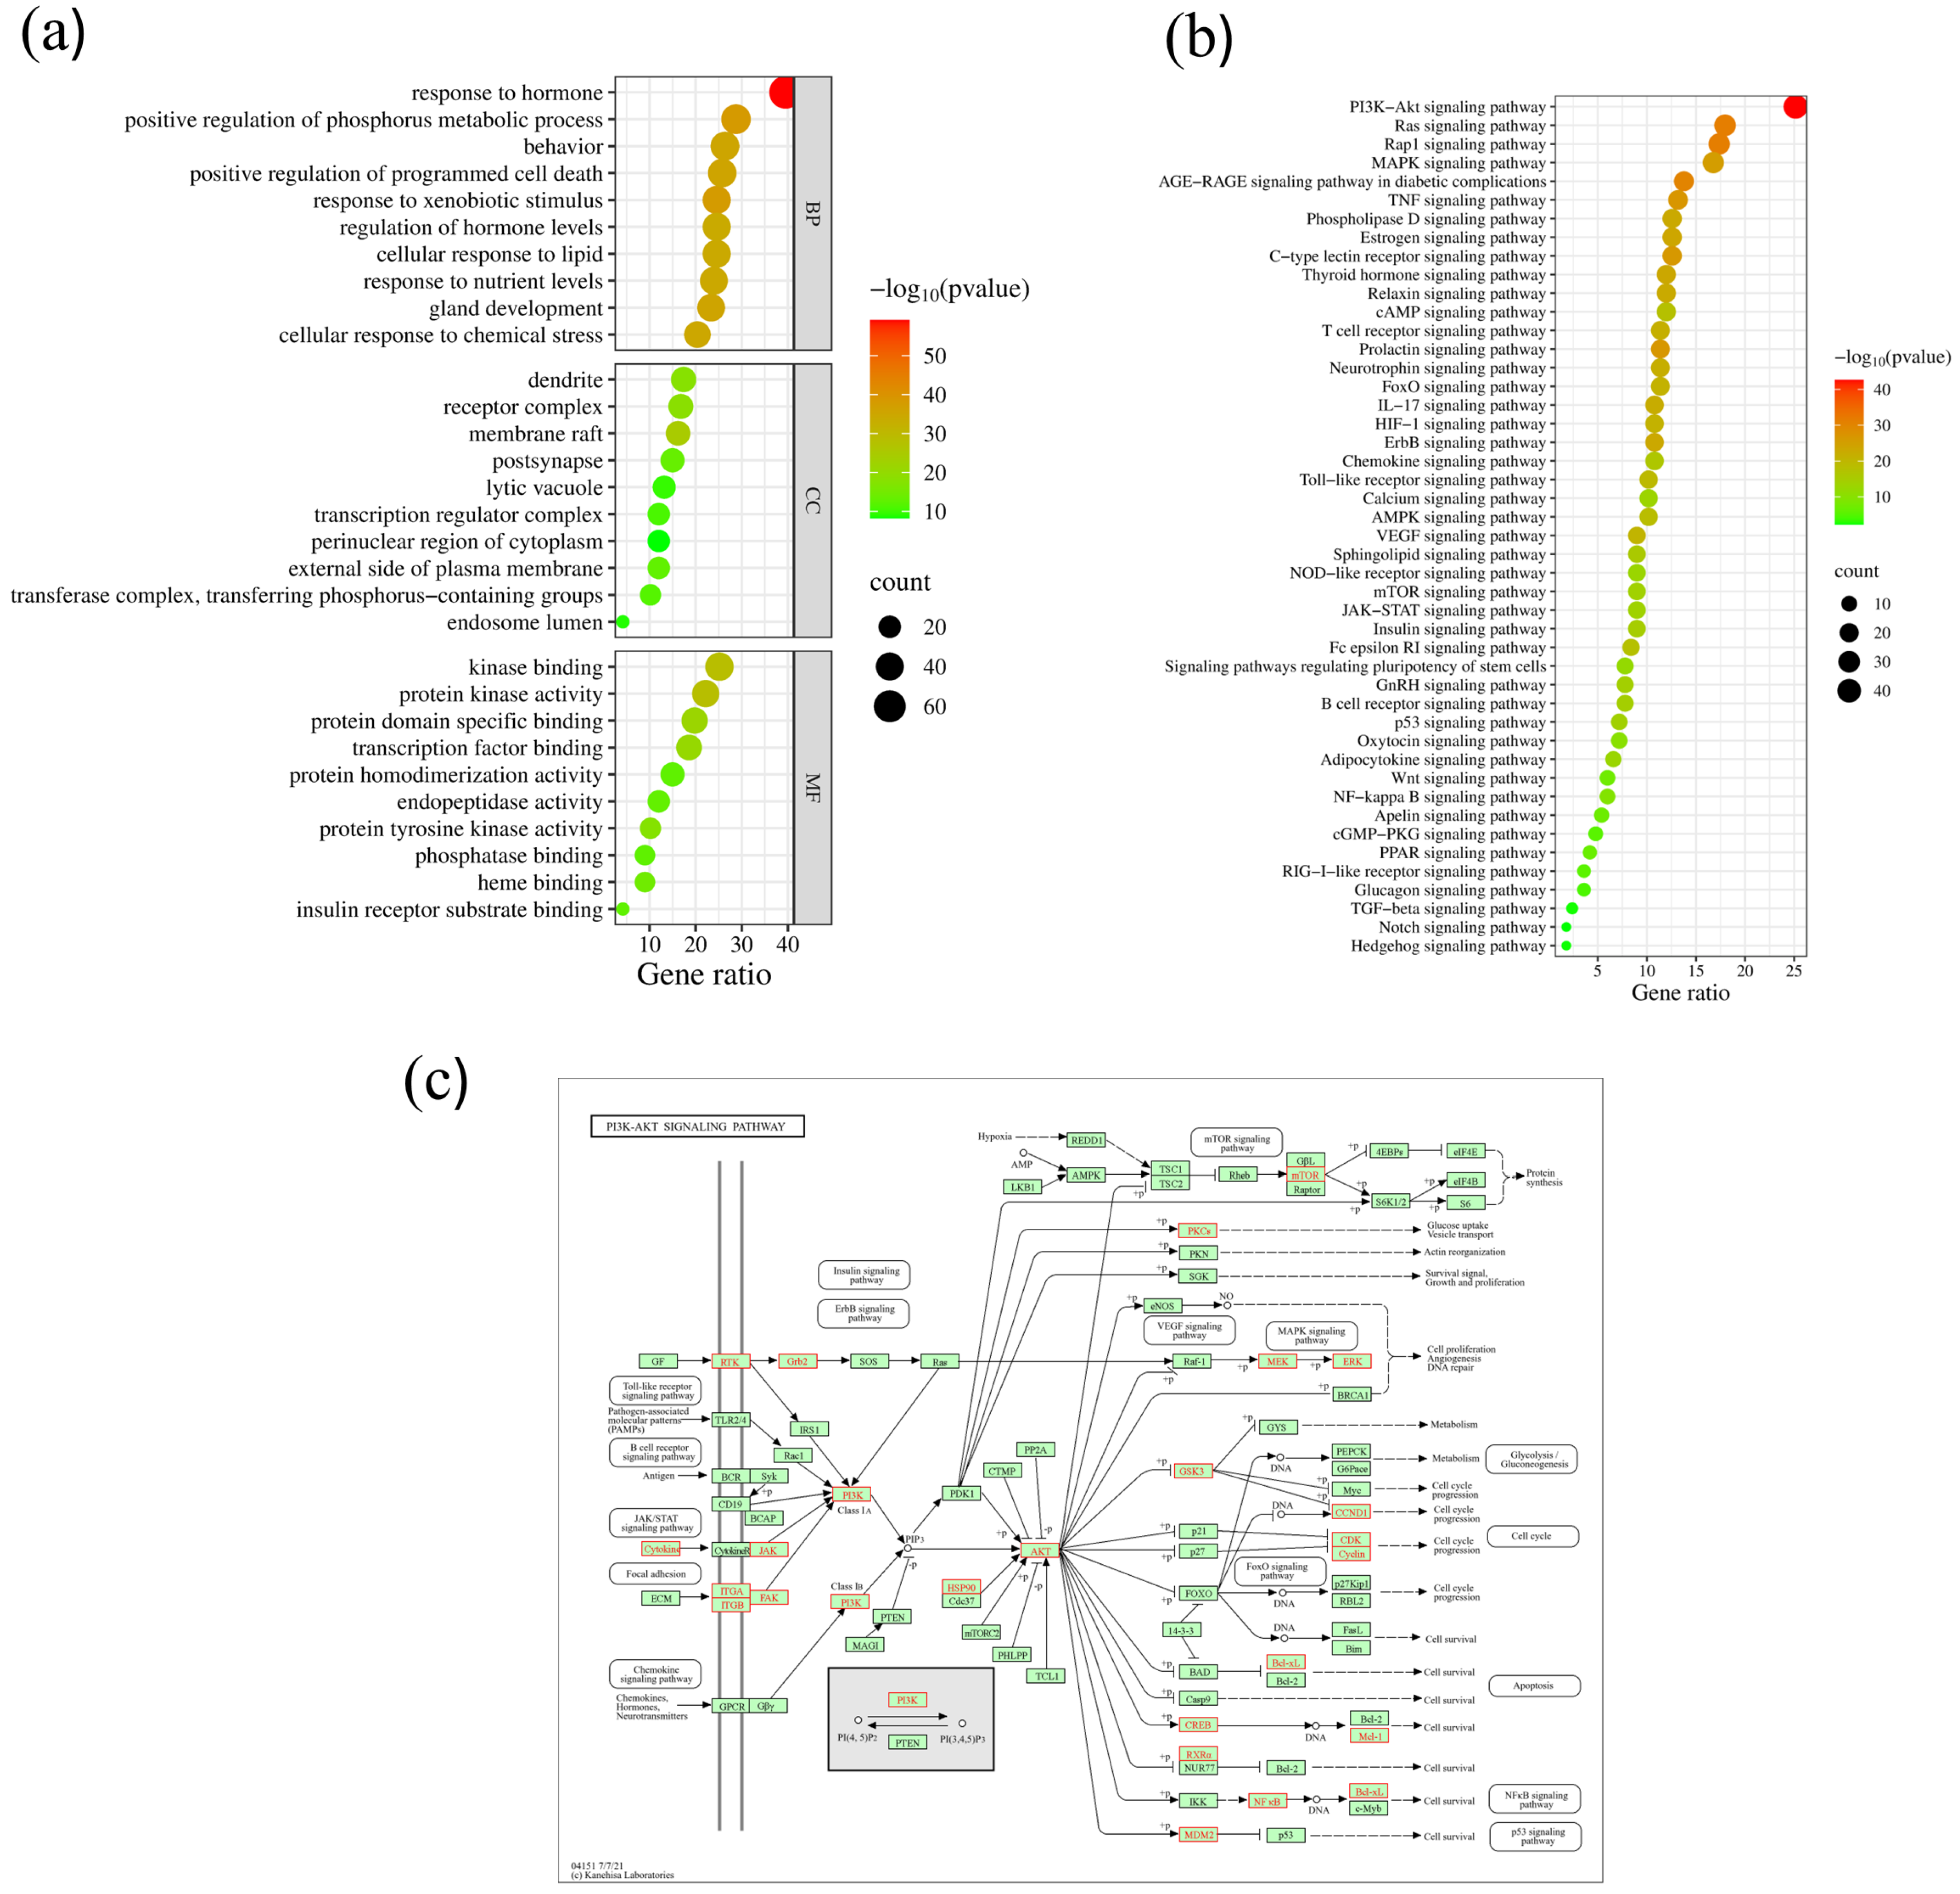
2.6. GO Enrichment Analysis of Core Targets
2.7. KEGG Enrichment Analysis of Core Targets
2.8. Construction of Chaga-Components-Targets-Diabetes-Signaling Pathway Network
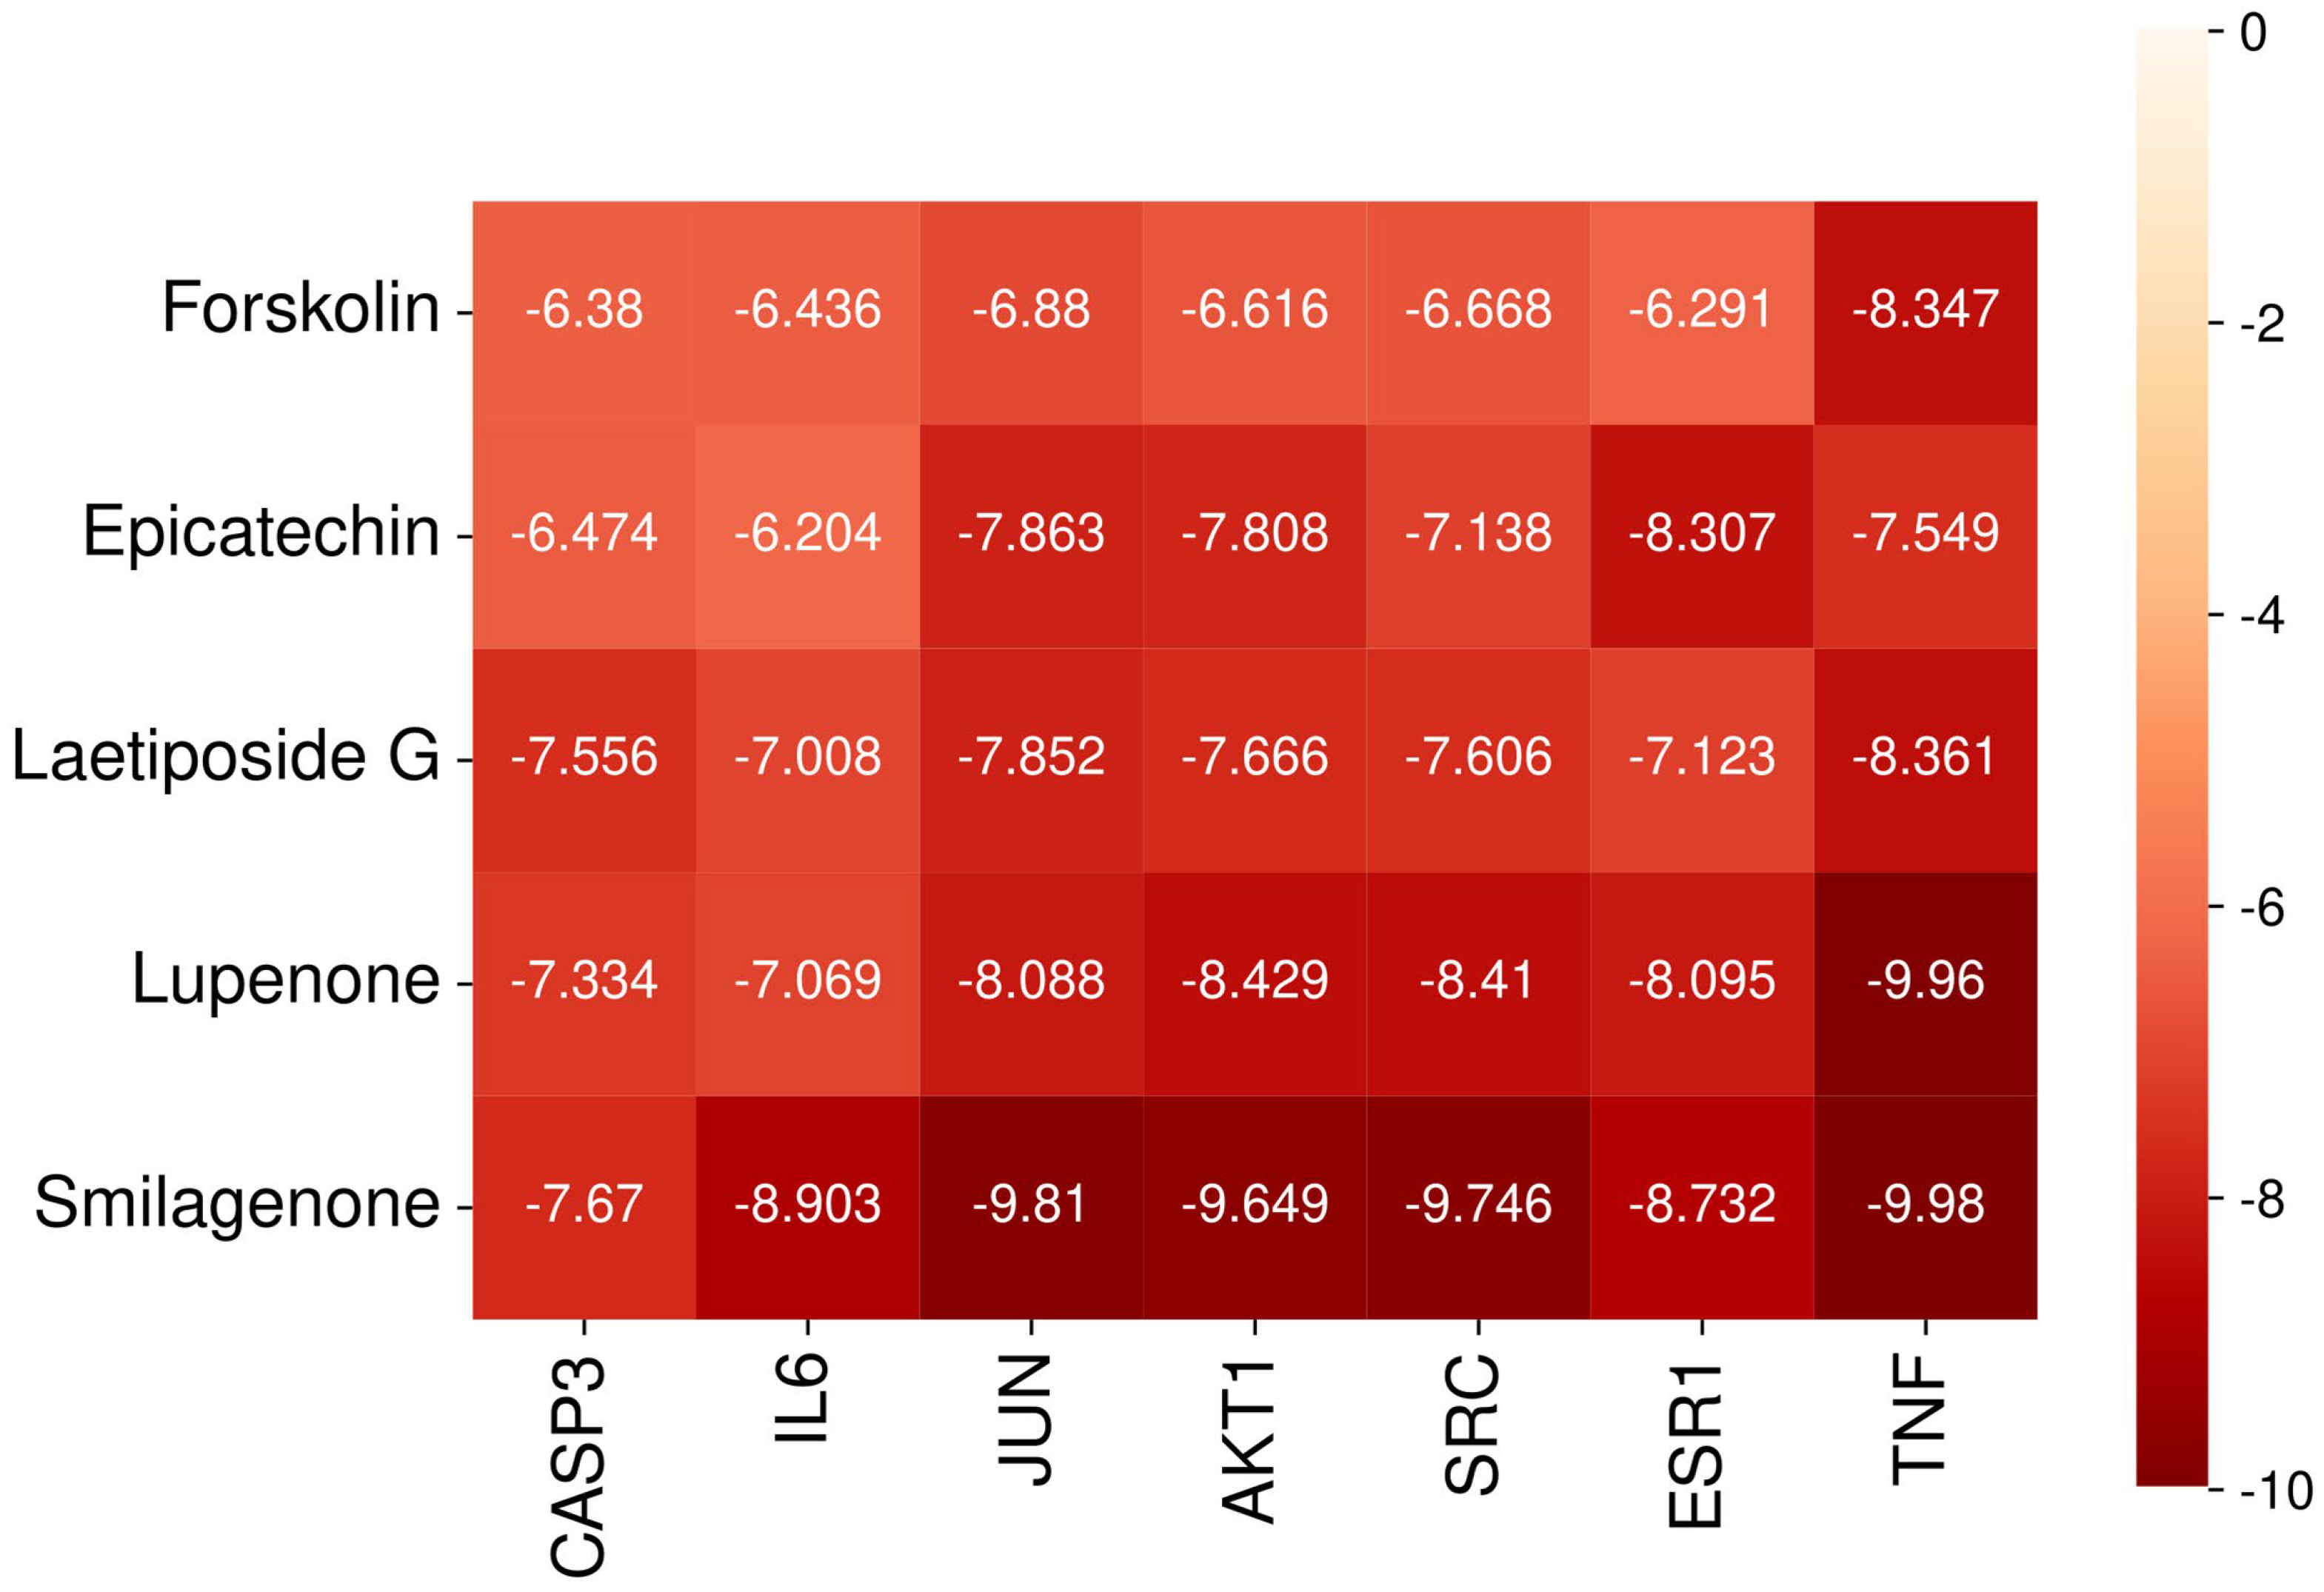
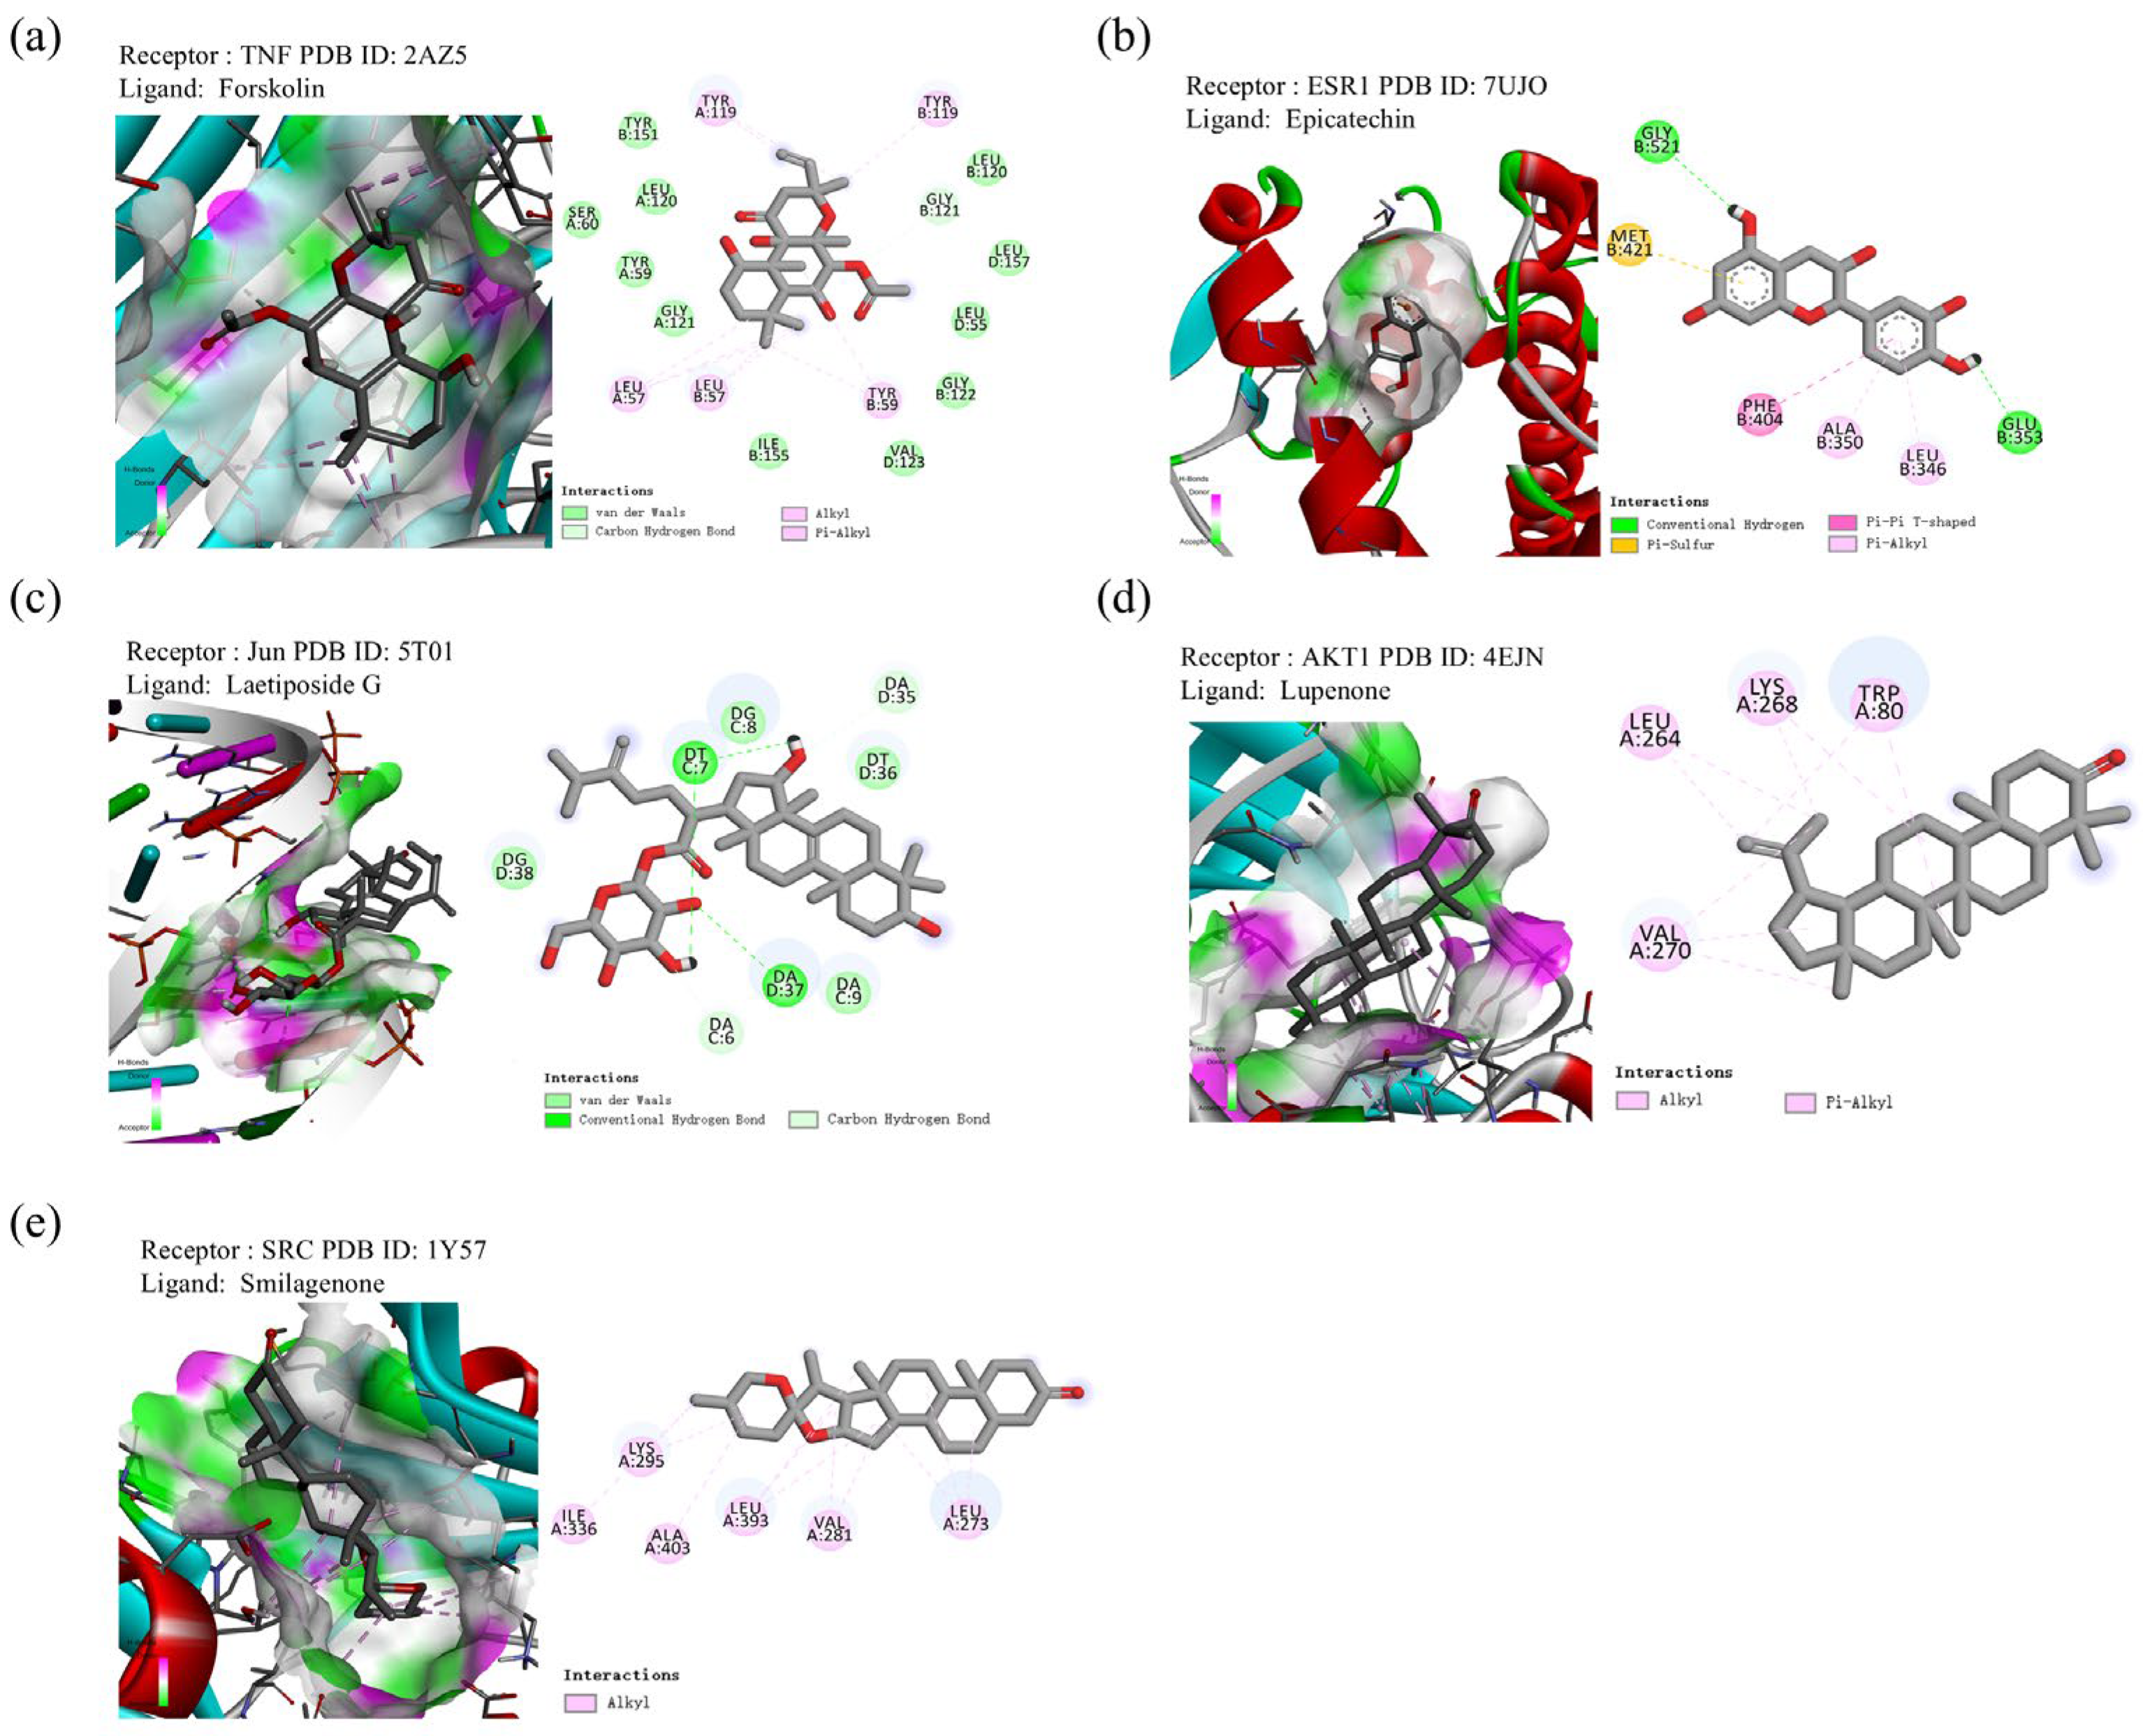
2.9. Molecular Docking
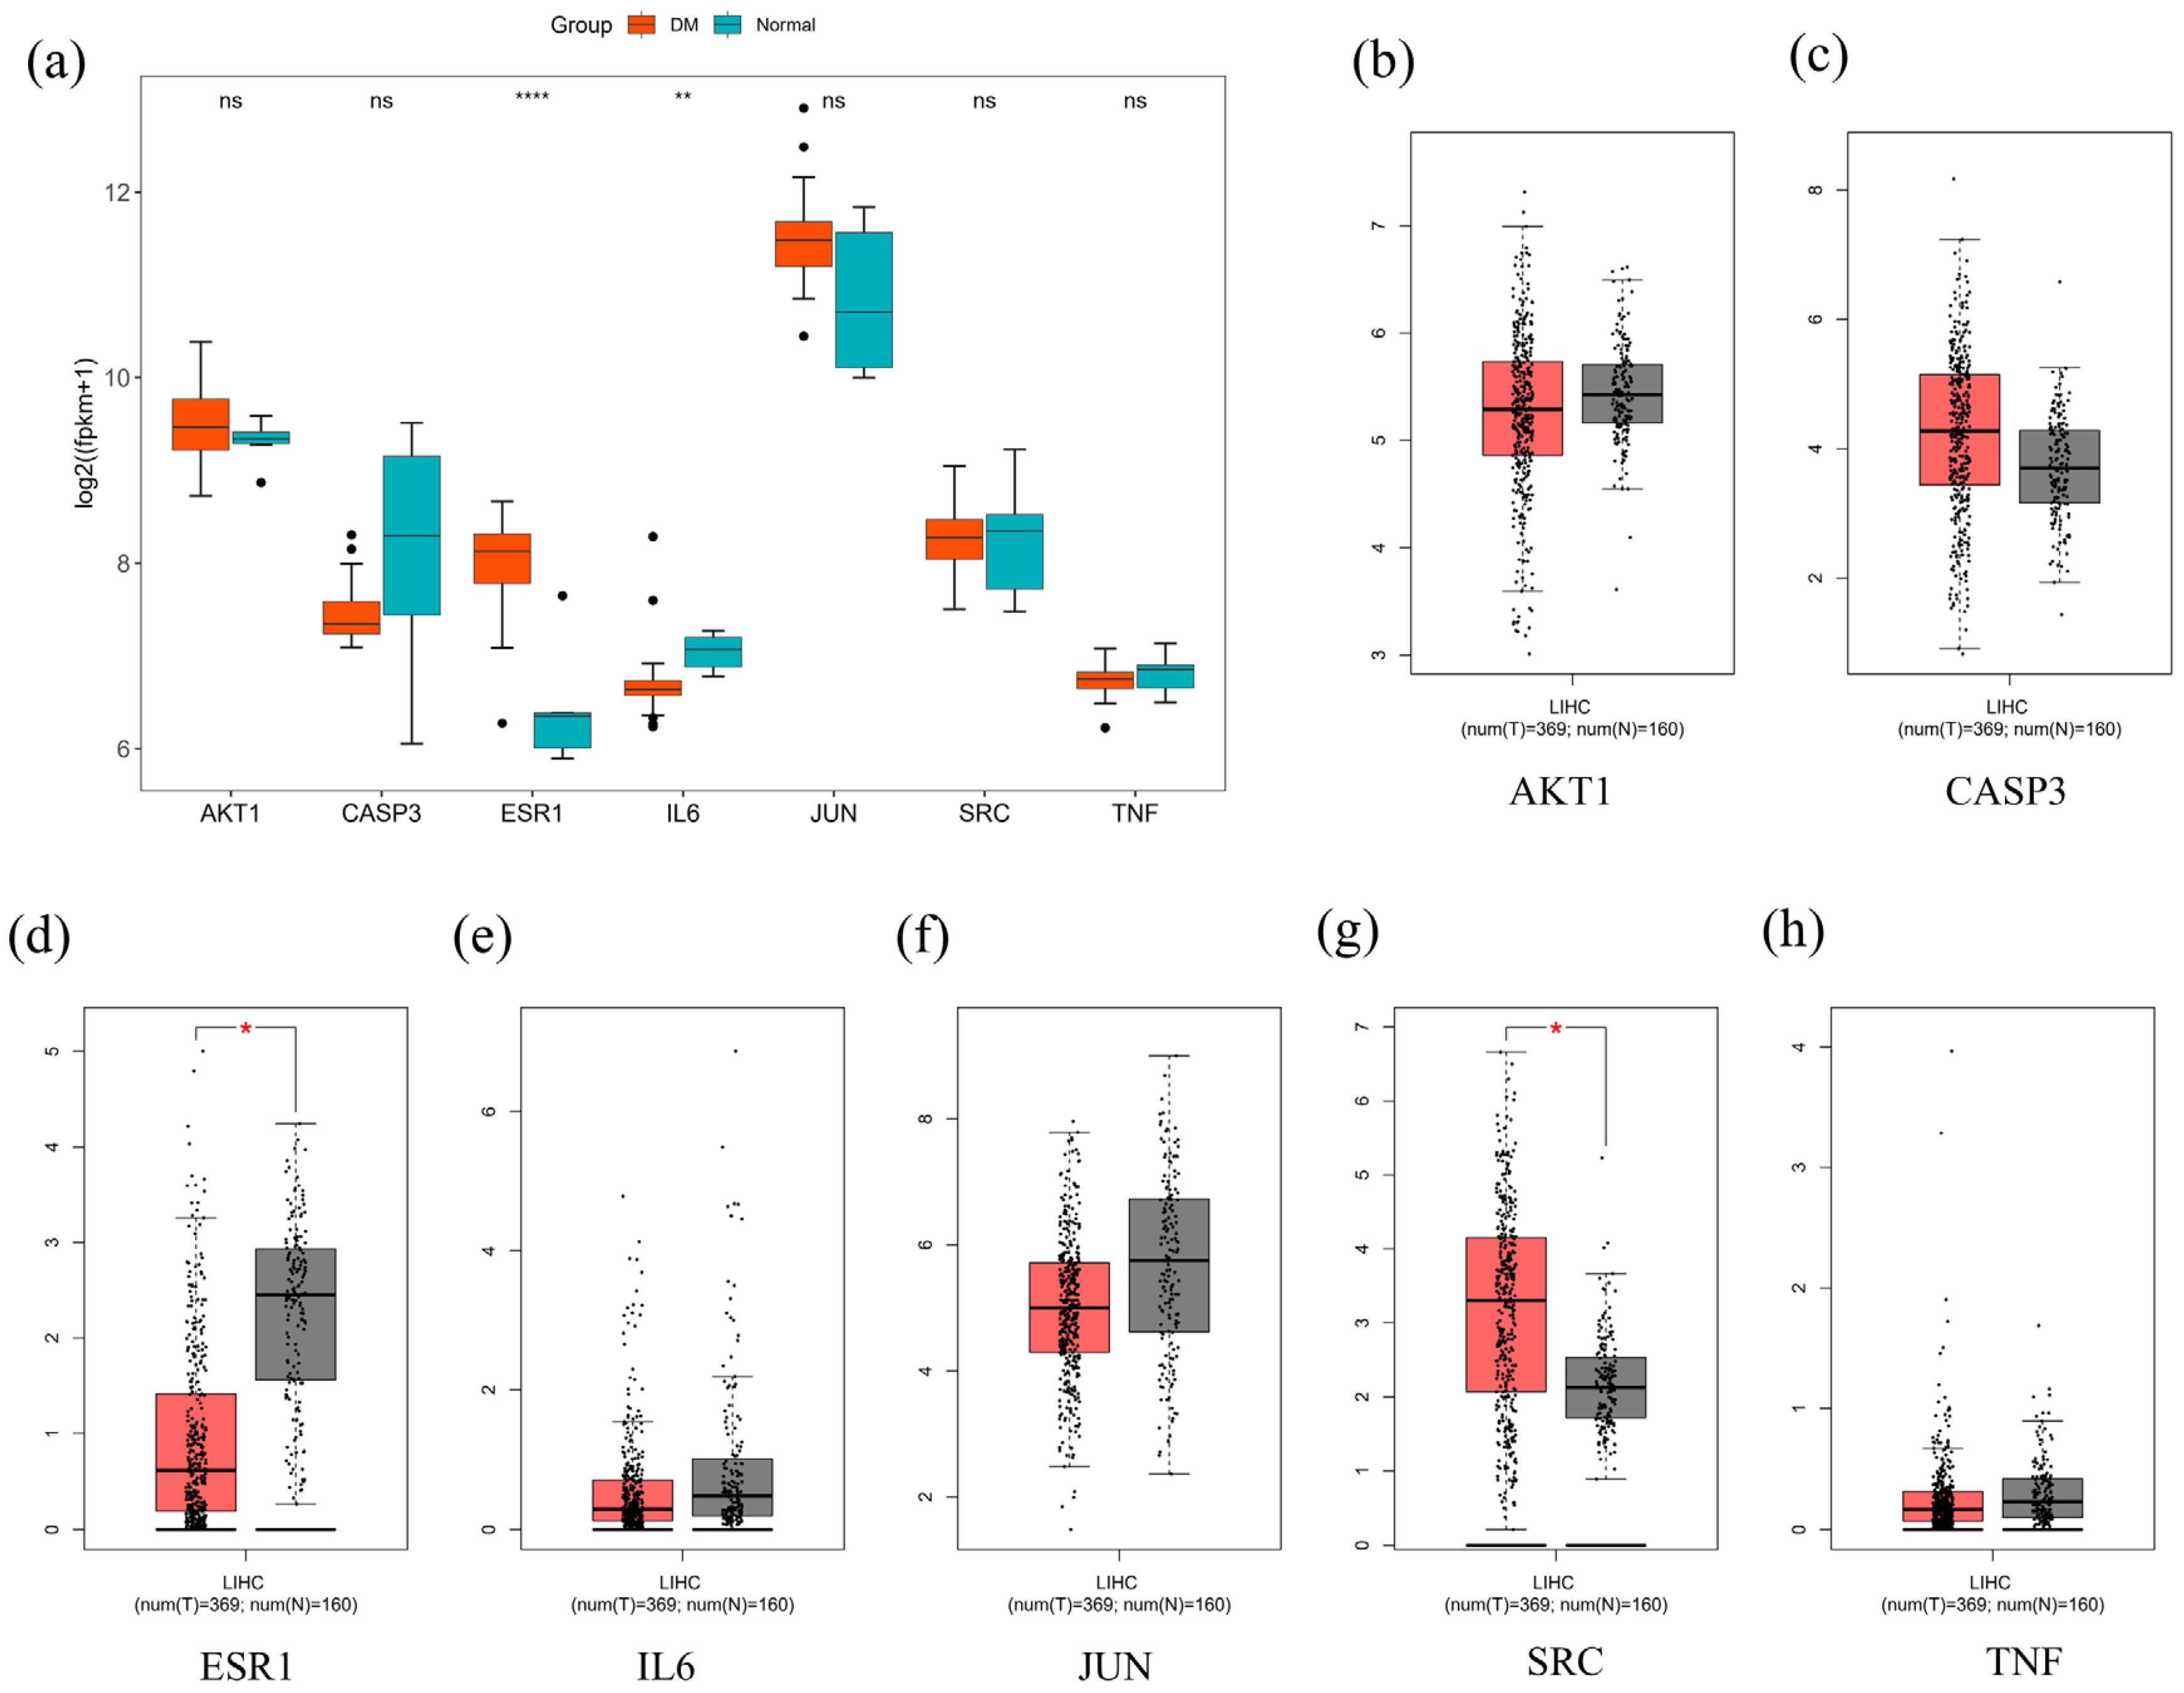
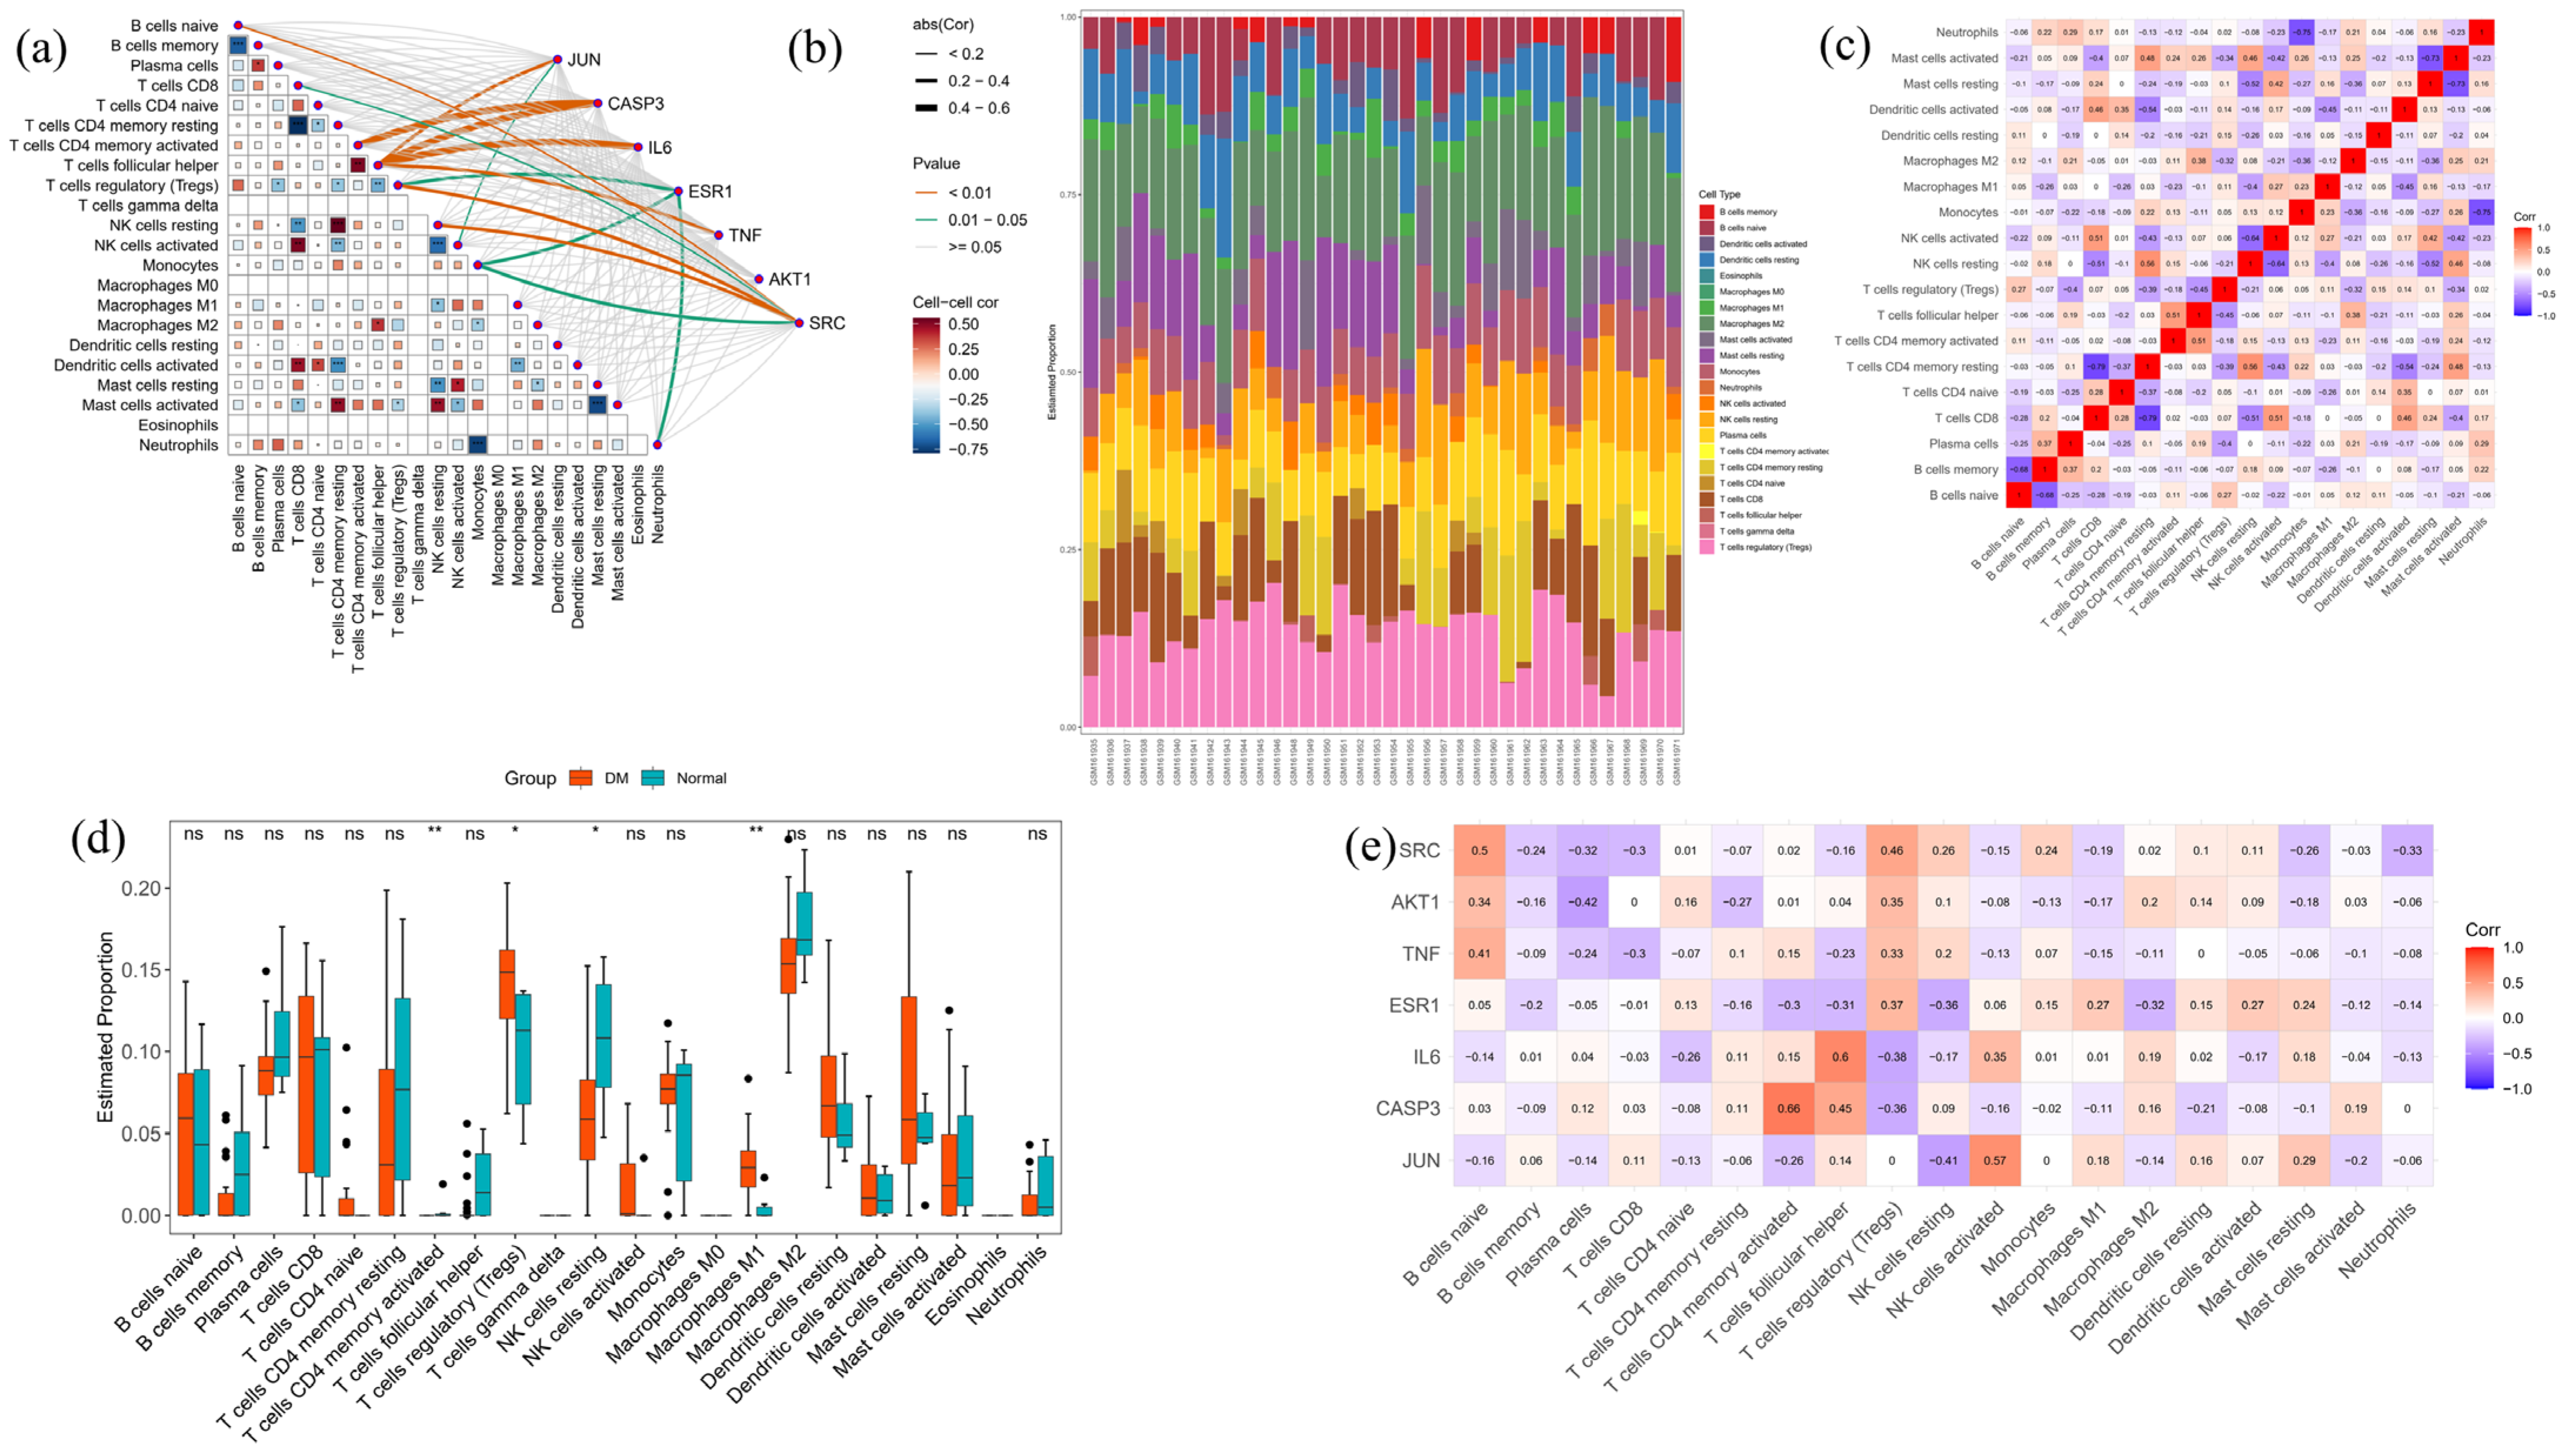
2.10. Bioinformatics
3. Discussion
4. Methodology
4.1. Preparation of Chaga Extracts
4.2. Ultra-High-Performance Liquid Chromatography–Q-Exactive HF Mass Spectrometry (UHPLC-QE-MS) Analysis
4.3. Protein Targets of Components Prediction
4.4. Diabetes-Related Target Collection
4.5. Overlapping Targets Between Components, Glucose Metabolism, and Diabetic Prediction
4.6. Protein–Protein Interaction (PPI) Network Construction
4.7. Chaga Core Anti-Diabetic Targets for Enrichment Analysis Construction
4.8. Interaction Network Construction
4.9. Chaga Central Targets for Component–Target Docking Construction
4.10. GO and KEGG Enrichment Analysis
4.11. Chaga-Components-Targets-Diabetics-Signaling Pathway Network Construction
4.12. Molecular Docking
4.13. Core Gene Expression Analysis
4.14. Analysis of Immune Cell Infiltration
5. Conclusions
Author Contributions
Funding
Informed Consent Statement
Data Availability Statement
Conflicts of Interest
Abbreviations
| AGEs | Advanced glycation end-products |
| Akt | Protein kinase B |
| AMPK | AMP-activated protein kinase |
| BC | Betweenness centrality |
| BPs | Biological processes |
| CC | Closeness centrality |
| CCs | Cellular components |
| DC | Degree of centrality |
| DM | Diabetes mellitus |
| GLUT4 | Glucose transporter type 4 |
| GO | Gene Ontology |
| GSK-3β | Glycogen synthase kinase-3β |
| KEGG | Kyoto Encyclopedia of Genes and Genomes |
| LC-MS | Liquid chromatography–mass spectrometry |
| MCC | Maximal clique centrality |
| MFs | Molecular functions |
| MNC | Maximum neighborhood component |
| PI3K/Akt | Phosphatidylinositol 3-kinase/protein kinase B |
| PPI | Protein–protein interaction |
| ROS | Reactive oxygen species |
| T2D | Type 2 diabetes |
| UHPLC | Ultra-high-performance liquid chromatography |
| UHPLC-QE-MS | Ultra-high-performance liquid chromatography–Q-Exactive HF mass spectrometry |
References
- International Diabetes Federation. IDF Diabetes Atlas, 10th ed.; International Diabetes Federation: Brussels, Belgium, 2021; Available online: https://diabetesatlas.org (accessed on 20 March 2025).
- Li, M.; Chi, X.; Wang, Y.; Setrerrahmane, S.; Xie, W.; Xu, H. Trends in insulin resistance: Insights into mechanisms and therapeutic strategy. Signal Transduct. Target. Ther. 2022, 7, 216. [Google Scholar] [CrossRef] [PubMed]
- Huang, X.; Liu, G.; Guo, J.; Su, Z. The PI3K/AKT pathway in obesity and type 2 diabetes. Int. J. Biol. Sci. 2018, 14, 1483. [Google Scholar] [CrossRef] [PubMed]
- González, P.; Lozano, P.; Ros, G.; Solano, F. Hyperglycemia and oxidative stress: An integral, updated and critical overview of their metabolic interconnections. Int. J. Mol. Sci. 2023, 24, 9352. [Google Scholar] [CrossRef] [PubMed]
- Abugomaa, A.; Elbadawy, M.; Ishihara, Y.; Yamamoto, H.; Kaneda, M.; Yamawaki, H.; Sasaki, K. Anti-cancer activity of Chaga mushroom (Inonotus obliquus) against dog bladder cancer organoids. Front Pharmacol. 2023, 14, 1159516. [Google Scholar] [CrossRef]
- Doi, N.; Araki, K.; Fukuta, Y.; Kuwagaito, Y.; Yamauchi, Y.; Sasai, Y.; Kuzuya, M. Anti-glycation and antioxidant effects of Chaga mushroom decoction extracted with a fermentation medium. Food Sci. Tech. Res. 2023, 29, 155–161. [Google Scholar] [CrossRef]
- Alhallaf, W.; Perkins, L.B. The anti-inflammatory properties of chaga extracts obtained by different extraction methods against LPS-induced RAW 264.7. Molecules 2022, 27, 4207. [Google Scholar] [CrossRef]
- Er Demirhan, B.; Demirhan, B. Investigation of twelve significant mycotoxin contamination in nut-based products by the LC–MS/MS method. Metabolites 2022, 12, 120. [Google Scholar] [CrossRef]
- Xu, X.; Pang, C.; Yang, C.; Zheng, Y.; Xu, H.Y.; Lu, Z.; Xu, Z.H. Antihyperglycemic and antilipidperoxidative effects of polysaccharides extracted from medicinal mushroom Chaga, Inonotus obliquus (Pers.: Fr.) Pilat (Aphyllophoromycetideae) on alloxan-diabetes mice. Int. J. Med. Mushrooms. 2010, 12, 235–244. [Google Scholar] [CrossRef]
- Shen, D.; Feng, Y.; Zhang, X.; Liu, J.; Gong, L.; Liao, H.; Li, R. In Vitro Immunomodulatory Effects of Inonotus obliquus Extracts on Resting M0 Macrophages and LPS-Induced M1 Macrophages. Evid. Based Complement. Alternat Med. 2022, 2022, 8251344. [Google Scholar] [CrossRef]
- Szychowski, K.A.; Skóra, B.; Pomianek, T.; Gmiński, J. Inonotus obliquus—From folk medicine to clinical use. J. Trad. Complement. Med. 2020, 11, 293–302. [Google Scholar] [CrossRef]
- Aramabašić Jovanović, J.; Mihailović, M.; Uskoković, A.; Grdović, N.; Dinić, S.; Vidaković, M. The effects of major mushroom bioactive compounds on mechanisms that control blood glucose level. J. Fungi 2021, 7, 58. [Google Scholar] [CrossRef] [PubMed]
- Feng, Y.; Ren, Y.; Zhang, X.; Yang, S.; Jiao, Q.; Li, Q.; Jiang, W. Metabolites of traditional Chinese medicine targeting PI3K/AKT signaling pathway for hypoglycemic effect in type 2 diabetes. Front. Pharmacol. 2024, 15, 1373711. [Google Scholar] [CrossRef]
- Wang, J.; Wang, C.; Li, S.; Li, W.; Yuan, G.; Pan, Y.; Chen, H. Anti-diabetic effects of Inonotus obliquus polysaccharides in streptozotocin-induced type 2 diabetic mice and potential mechanism via PI3K-Akt signal pathway. Biomed. Pharmacother. 2017, 95, 1669–1677. [Google Scholar] [CrossRef]
- Daina, A.; Michielin, O.; Zoete, V. SwissTargetPrediction: Updated data and new features for efficient prediction of protein targets of small molecules. Nucleic Acids Res. 2019, 47, W357–W364. [Google Scholar] [CrossRef]
- Keiser, M.J.; Roth, B.L.; Armbruster, B.N.; Ernsberger, P.; Irwin, J.J.; Shoichet, B.K. Relating protein pharmacology by ligand chemistry. Nat. Biotech. 2007, 25, 197–206. [Google Scholar] [CrossRef]
- Safran, M.; Rosen, N.; Twik, M.; BarShir, R.; Stein, T.I.; Dahary, D.; Lancet, D. The genecards suite. In Practical Guide to Life Science Databases; Springer: Singapore, 2021; pp. 27–56. [Google Scholar]
- Oliveros, J.C. VENNY. An Interactive Tool for Comparing Lists with Venn Diagrams. 2007. Available online: http://bioinfogp.cnb.csic.es/tools/venny/index.html (accessed on 20 December 2024).
- Szklarczyk, D.; Kirsch, R.; Koutrouli, M.; Nastou, K.; Mehryary, F.; Hachilif, R.; Gable, A.L.; von Mering, C. The STRING database in 2023: Protein-protein association networks and functional enrichment analyses for any sequenced genome of interest. Nucleic Acids Res. 2023, 51, D638–D646. [Google Scholar] [CrossRef] [PubMed]
- Zhou, Y.; Zhou, B.; Pache, L.; Chang, M.; Khodabakhshi, A.H.; Tanaseichuk, O.; Benner, C.; Chanda, S.K. Metascape provides a biologist-oriented resource for the analysis of systems-level datasets. Nat. Commun. 2019, 10, 1523. [Google Scholar] [CrossRef] [PubMed]
- Liu, Y.; Zhang, J.; Liu, X.; Zhou, W.; Stalin, A.; Fu, C.; Lu, S. Investigation on the mechanisms of guiqi huoxue capsule for treating cervical spondylosis based on network pharmacology and molecular docking. Medicine 2021, 100, e26643. [Google Scholar] [CrossRef]
- Wong, F.; Krishnan, A.; Zheng, E.J.; Stärk, H.; Manson, A.L.; Earl, A.M.; Jaakkola, T.; Collins, J.J. Benchmarking AlphaFold-enabled molecular docking predictions for antibiotic discovery. Mol. Syst. Biol. 2022, 18, e11081. [Google Scholar] [CrossRef]
- Luo, J.; Luo, J.; Wu, Y.; Fu, Y.; Fang, Z.; Han, B.; Du, B.; Yang, Z.; Xu, B. Anti-obesity effects of Adzuki bean saponins in improving lipid metabolism through reducing oxidative stress and alleviating mitochondrial abnormality by activating the PI3K/Akt/GSK3β/β-catenin signaling pathway. Antioxidants 2024, 13, 1380. [Google Scholar] [CrossRef]
- Liu, Y.; Luo, J.; Xu, B. Elucidation of anti-obesity mechanisms of phenolics in Artemisiae argyi folium (aiye) by integrating LC-MS, network pharmacology, and molecular docking. Life 2024, 14, 656. [Google Scholar] [CrossRef] [PubMed]
- Han, B.; Luo, J.; Xu, B. Revealing molecular mechanisms of the bioactive saponins from edible root of Platycodon grandiflorum in combating obesity. Plants 2024, 13, 1123. [Google Scholar] [CrossRef]
- Liu, Y.; Luo, J.; Meenu, M.; Xu, B. Anti-obesity mechanisms elucidation of essential oil components from Artemisiae Argyi Folium (Aiye) by the integration of GC-MS, network pharmacology, and molecular docking. Int. J. Food Prop. 2025, 28, 2452445. [Google Scholar] [CrossRef]
- Luo, J.; Wu, Y.; Moussa, A.Y.; Huang, Y.; Fu, Y.; Wei, Y.; Xu, B. Unveiling the molecular mechanisms of adzuki bean (Vigna angularis) derived bioactive phytochemicals in combating obesity. Food Biosci. 2024, 62, 105515. [Google Scholar] [CrossRef]
- Ern, P.T.Y.; Quan, T.Y.; Yee, F.S.; Yin, A.C.Y. Therapeutic properties of Inonotus obliquus (Chaga mushroom): A review. Mycology 2023, 15, 144–161. [Google Scholar] [CrossRef] [PubMed]
- Luo, J.; Yan, W.; Chen, Z.; Xu, B. Elucidating the anti-obesity phytochemicals in Chenpi and their molecular mechanisms. Food Sci. Human Wellness 2024, 14, 9250204. [Google Scholar] [CrossRef]
- Kiselova-Kaneva, Y.; Galunska, B.; Nikolova, M.; Dincheva, I.; Badjakov, I. High resolution LC-MS/MS characterization of polyphenolic composition and evaluation of antioxidant activity of Sambucus ebulus fruit tea traditionally used in Bulgaria as a functional food. Food Chem. 2022, 367, 130759. [Google Scholar] [CrossRef]
- Saini, R.K.; Song, M.H.; Yu, J.W.; Lee, J.H.; Ahn, H.Y.; Keum, Y.S.; Lee, J.H. Profiling of nutritionally vital bioactive compounds in emerging green leafy vegetables: A comparative study. Foods 2022, 11, 3867. [Google Scholar] [CrossRef]
- Agu, P.C.; Afiukwa, C.A.; Orji, O.U.; Ezeh, E.M.; Ofoke, I.H.; Ogbu, C.O.; Ugwuja, E.I.; Aja, P.M. Molecular docking as a tool for the discovery of molecular targets of nutraceuticals in diseases management. Sci. Rep. 2023, 13, 13398. [Google Scholar] [CrossRef]
- Wang, K.; Yin, J.; Chen, J.; Ma, J.; Si, H.; Xia, D. Inhibition of inflammation by berberine: Molecular mechanism and network pharmacology analysis. Phytomedicine 2024, 128, 155258. [Google Scholar] [CrossRef]
- Nauck, M.A.; Müller, T.D. Incretin hormones and type 2 diabetes. Diabetologia 2023, 66, 1780–1795. [Google Scholar] [CrossRef] [PubMed]
- Mironov, N.; Haque, M.; Atfi, A.; Razzaque, M.S. Phosphate dysregulation and metabolic syndrome. Nutrients 2022, 14, 4477. [Google Scholar] [CrossRef] [PubMed]
- Erekat, N.S. Programmed cell death in diabetic nephropathy: A review of apoptosis, autophagy, and necroptosis. Int. Med. J. Experimen Clin. Res. 2022, 28, e937766-1. [Google Scholar] [CrossRef]
- Saltiel, A.R. Insulin signaling in health and disease. J. Clin. Investig. 2021, 131, e142241. [Google Scholar] [CrossRef] [PubMed]
- Zhao, X.; An, X.; Yang, C.; Sun, W.; Ji, H.; Lian, F. The crucial role and mechanism of insulin resistance in metabolic disease. Front. Endocrinol. 2023, 14, 1149239. [Google Scholar] [CrossRef]
- Das, D.; Sarkar, S.; Dihingia, A.; Afzal, N.U.; Wann, S.B.; Kalita, J.; Dewanjee, S.; Manna, P. A popular fermented soybean food of Northeast India exerted promising antihyperglycemic potential via stimulating PI3K/AKT/AMPK/GLUT4 signaling pathways and regulating muscle glucose metabolism in type 2 diabetes. J. Food Biochem. 2022, 46, e14385. [Google Scholar] [CrossRef]
- Zhou, Y.J.; Xu, N.; Zhang, X.C.; Zhu, Y.Y.; Liu, S.W.; Chang, Y.N. Chrysin improves glucose and lipid metabolism disorders by regulating the AMPK/PI3K/AKT signaling pathway in insulin-resistant HepG2 cells and HFD/STZ-induced C57BL/6J mice. J. Agric. Food Chem. 2021, 69, 5618–5627. [Google Scholar] [CrossRef]
- Fazakerley, D.J.; Koumanov, F.; Holman, G.D. GLUT4 On the move. Biochem. J. 2021, 479, 445–462. [Google Scholar] [CrossRef]
- Jin, D.X.; He, J.F. Pi3k/akt signaling pathway–mediated three flavonoids’ modulation on glucose metabolism. Rev. Bras. Farmacogn. 2022, 32, 834–839. [Google Scholar] [CrossRef]
- Liu, Y.; Qiu, Y.; Chen, Q.; Han, X.; Cai, M.; Hao, L. Puerarin suppresses the hepatic gluconeogenesis via activation of PI3K/Akt signaling pathway in diabetic rats and HepG2 cells. Biomed. Pharmacother. 2021, 137, 111325. [Google Scholar] [CrossRef]
- Chen, J.Y.; Peng, S.Y.; Cheng, Y.H.; Lee, I.T.; Yu, Y.H. Effect of Forskolin on body weight, glucose metabolism and adipocyte size of diet-induced obesity in mice. Animals 2021, 11, 645. [Google Scholar] [CrossRef] [PubMed]
- Naghibi, M.; Tayefi Nasrabadi, H.; Soleimani Rad, J.; Garjani, A.; Gholami Farashah, M.S.; Mohammadnejad, D. Forskolin improves male reproductive complications caused by hyperglycemia in type 2 diabetic rats. Int. J. Fertil. Steril. 2023, 17, 268–275. [Google Scholar] [PubMed]
- Fraga, C.G.; Cremonini, E.; Galleano, M.; Oteiza, P.I. Natural products and diabetes: (-)-epicatechin and mechanisms involved in the regulation of insulin sensitivity. Handb. Exp. Pharmacol. 2025, 287, 159–173. [Google Scholar] [CrossRef] [PubMed]
- Slavova-Kazakova, A.; Janiak, M.A.; Sulewska, K.; Kancheva, V.D.; Karamać, M. Synergistic, additive, and antagonistic antioxidant effects in the mixtures of curcumin with (-)-epicatechin and with a green tea fraction containing (-)-epicatechin. Food Chem. 2021, 360, 129994. [Google Scholar] [CrossRef] [PubMed]
- Lakthan, T.; Limpachayaporn, P.; Rayanil, K.O.; Charoenpanich, P.; Phuangbubpha, P.; Charoenpanich, A. Lupenone-rich fraction derived from Cissus quadrangularis L. suppresses lipid accumulation in 3T3-L1 adipocytes. Life 2023, 13, 1724. [Google Scholar] [CrossRef]
- Yung, J.H.M.; Giacca, A. Role of c-Jun N-terminal kinase (JNK) in obesity and type 2 diabetes. Cells 2020, 9, 706. [Google Scholar] [CrossRef]
- Taheri, R.; Mokhtari, Y.; Yousefi, A.M.; Bashash, D. The PI3K/Akt signaling axis and type 2 diabetes mellitus (T2DM): From mechanistic insights into possible therapeutic targets. Cell Biol. Int. 2024, 48, 1049–1068. [Google Scholar] [CrossRef]
- Gregorio, K.C.R.; Laurindo, C.P.; Machado, U.F. Estrogen and glycemic homeostasis: The fundamental role of nuclear estrogen receptors ESR1/ESR2 in glucose transporter GLUT4 regulation. Cells 2021, 10, 99. [Google Scholar] [CrossRef]
- O’Brien, M.H.; Pitot, H.C.; Chung, S.H.; Lambert, P.F.; Drinkwater, N.R.; Bilger, A. estrogen receptor-α suppresses liver carcinogenesis and establishes sex-specific gene expression. Cancers 2021, 13, 2355. [Google Scholar] [CrossRef]
- Zhang, Y.Y.; Elam, E.; Ni, Z.J.; Zhang, F.; Thakur, K.; Wang, S.; Zhang, J.G.; Wei, Z.J. LC-MS/MS targeting analysis of terpenoid metabolism in Carya cathayensis at different developmental stages. Food Chem. 2022, 366, 130583. [Google Scholar] [CrossRef]
- Shannon, P.; Markiel, A.; Ozier, O.; Baliga, N.S.; Wang, J.T.; Ramage, D.; Amin, N.; Schwikowski, B.; Ideker, T. Cytoscape: A software environment for integrated models of biomolecular interaction networks. Genome Res. 2003, 13, 2498–2504. [Google Scholar] [CrossRef] [PubMed]
- Liu, L.; Jiao, Y.; Yang, M.; Wu, L.; Long, G.; Hu, W. Network pharmacology, molecular docking and molecular dynamics to explore the potential immunomodulatory mechanisms of deer antler. Int. J. Mol. Sci. 2023, 24, 10370. [Google Scholar] [CrossRef] [PubMed]
- Zhao, S.; Ni, F.; Qiu, T.; Wolff, J.T.; Tsai, S.C.; Luo, R. Molecular Basis for Polyketide Ketoreductase-Substrate Interactions. Int. J. Mol. Sci. 2020, 21, 7562. [Google Scholar] [CrossRef]
- PyMOL. The PyMOL Molecular Graphics System, Version 2.0; Schrödinger, LLC: New York, NY, USA, 2017. [Google Scholar]
- Wang, W.; Wang, Y. Integrative bioinformatics analysis of biomarkers and pathways for exploring the mechanisms and molecular targets associated with pyroptosis in type 2 diabetes mellitus. Front. Endocrinol. 2023, 14, 1207142. [Google Scholar] [CrossRef] [PubMed]
- Tang, Z.; Li, C.; Kang, B.; Gao, G.; Li, C.; Zhang, Z. GEPIA: A web server for cancer and normal gene expression profiling and interactive analyses. Nucleic Acids Res. 2017, 45, W98–W102. [Google Scholar] [CrossRef]
- Zhou, Y.; Liu, C.; Zhang, Z.; Chen, J.; Zhao, D.; Li, L.; Tong, M.; Zhang, G. Identification and validation of diagnostic biomarkers of coronary artery disease progression in type 1 diabetes via integrated computational and bioinformatics strategies. Comput. Biol. Med. 2023, 159, 106940. [Google Scholar] [CrossRef]

| No. | Compound Name | Compound Structure | Group | Target Number | PubChem CID | MZ Value | Adduct Ions | Type | Formula | Retention Time (s) | MS2 (M/Z) | Peak Value | ppm |
|---|---|---|---|---|---|---|---|---|---|---|---|---|---|
| 1 | Tamarixetin | 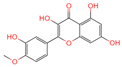 | Flavone | 109 | 5,281,699 | 315.0508719 | [M-H]− | Neg | C16H12O7 | 101.188 | 315.049869; 271.026506; 227.070704; 209.060198; 92.679913 | 423,008,185.4 | 0.406456701 |
| 2 | Tectorigenin | 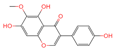 | Isoflavone | 73 | 5,281,811 | 299.0562603 | [M-H]− | Neg | C16H12O6 | 155.009 | 299.055325; 255.066879; 211.0409; 237.054751; 227.035073 | 191,098,601.4 | 0.870455461 |
| 3 | 2-[6-(2-Carboxyethyl)-7-ethenyl-2-hydroxy-3a,6,9b-trimethyl-1,2,3,4,7,8-hexahydro cyclopenta[a]naphthalen-3-yl]-6-hydroxy-6-methyl-5-methylideneheptanoic acid | 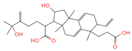 | Polycyclic Aromatic Hydrocarbons, (PAHs) | 54 | 163,043,082 | 499.3063976 | [M-H]− | Neg | C30H44O6 | 467.32 | 499.30433; 187.097384; 92.680764; 125.096957; 500.31087 | 176,318,574 | 1.206423975 |
| 4 | Alisol A | 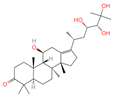 | Triterpenoids | 95 | 15,558,616 | 535.3637525 | [M+FA]− | Neg | C30H50O5 | 489.307 | 535.37193; 489.361334; 536.364022; 386.850678; 109.065859 | 65,494,393.38 | 2.330227473 |
| 5 | Asiatic acid | 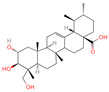 | Triterpenoids | 65 | 119,034 | 487.3445628 | [M-H]− | Neg | C30H48O5 | 491.309 | 487.345071; 488.345858; 73.029652; 54.151807; 109.065719 | 114,915,667.3 | 1.154737219 |
| 6 | Isosteviol | 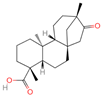 | Diterpenoid | 68 | 99,514 | 363.2182348 | M+HCOO | Neg | C20H30O3 | 496.82 | 363.220266; 301.219918; 319.226219; 231.211763; 72.99321 | 26,364,667.26 | 0.646322331 |
| 7 | Terminolic acid |  | Triterpenoids glucoside | 54 | 12,314,613 | 563.3608362 | M+CH3COO | Neg | C30H48O6 | 520.801 | 563.351955; 485.331287; 517.353289; 582.091972; 103.881389 | 21,190,641.49 | 3.259305253 |
| 8 | Arjungenin | 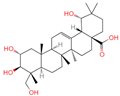 | Triterpenoids | 51 | 12,444,386 | 503.338039 | [M-H]− | Neg | C30H48O6 | 526.846 | 503.338521; 92.68161; 425.302602; 457.29446; 485.260314 | 39,637,808.49 | 0.077564917 |
| 9 | Methyl 4-(12-hydroxy-4,4,10,13,14-pentamethyl-3,7,11,15-tetraoxo-2,5,6,12,16,17-hexahydro-1H-cyclopenta[a]phenanthre-17-yl)pentanoate | 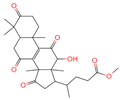 | Triterpenoids | - | 162,984,414 | 485.2549275 | [M-H]− | Neg | C28H38O7 | 560.168 | 485.331281; 427.282211; 379.264977; 467.246817; 423.255523 | 34,371,858.3 | 0.149345426 |
| 10 | Dehydrotumulosic acid | 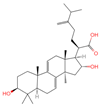 | Triterpenoids | 66 | 15,225,964 | 483.3487451 | [M-H]− | Neg | C31H48O4 | 605.497 | 483.350109; 484.348208; 53.70788; 57.034681; 162.838479 | 13,338,969.54 | 1.54152815 |
| 11 | Euscaphic acid | 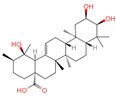 | Triterpenoids | 77 | 471,426 | 487.3420462 | [M-H]− | Neg | C30H48O5 | 622.893 | 487.345165; 165.020038; 425.344197; 411.325271; 381.276225 | 439,249,992.8 | 1.957243167 |
| 12 | Colosolic acid |  | Triterpenoids | 68 | 15,917,996 | 517.352961 | [M+FA]− | Neg | C30H48O4 | 623.896 | 471.344563; 441.338464; 472.355581; 52.374559; 517.386766 | 19,924,369.48 | 2.008218219 |
| 13 | Laetiposide G | 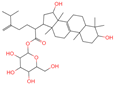 | Triterpenoids | 25 | 85,286,315 | 647.4166805 | [M-H]− | Neg | C37H60O9 | 664.321 | 647.426051; 92.677381; 187.096644; 125.096959; 89.024806 | 6,672,290.148 | 0.493481417 |
| 14 | 2-[6-(2-Carboxyethyl)-7-ethenyl-3a,6,9b-trimethyl-1,2,3,4,7,8-hexahydro cyclopenta[a]naphthalen-3-yl]-6-methyl-5-methylideneheptanoic acid | 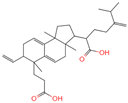 | Triterpenoids | 52 | 162,953,199 | 467.3161948 | [M-H]− | Neg | C30H44O4 | 693.617 | 467.314009; 371.261375; 83.050558; 92.681611; 468.321422 | 20,388,189.76 | 1.722931034 |
| 15 | Betulinic acid | 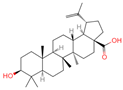 | Triterpenoids | 53 | 64,971 | 455.3526274 | [M-H]− | Neg | C30H48O3 | 703.636 | 455.353083; 456.359141; 50.597266; 92.676531; 411.293613 | 581,078,510.3 | 3.01445483 |
| 16 | Oleanonic acid | 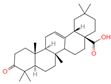 | Triterpenoids | 85 | 12,313,704 | 499.3432828 | M+HCOO | Neg | C30H46O3 | 760.737 | 453.341453; 61.988561; 92.680765; 454.341248; 50.373094 | 9,760,177.404 | 0.566249293 |
| 17 | Epicatechin |  | Flavanol | 20 | 72,276 | 291.0861046 | [M+H]+ | Pos | C15H14O6 | 46.5308 | 139.038665; 123.044504; 165.054501; 147.043675; 291.087129 | 373,945,509.4 | 0.359428699 |
| 18 | Glabrol | 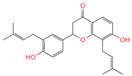 | Flavanones | 20 | 480,768 | 393.2089956 | [M+H]+ | Pos | C25H28O4 | 58.8721 | 393.205584; 394.213319; 92.657626; 153.054649; 375.102135 | 324,258,064.6 | 0.011256345 |
| 19 | Forskolin | 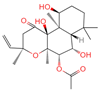 | Diterpenoid | 3 | 47,936 | 411.2381929 | [M+H]+ | Pos | C22H34O7 | 244.05 | 393.227554; 375.21174; 167.106581; 125.095873; 411.24093 | 775,007,987.6 | 0.469105286 |
| 20 | Mimusopsic acid | 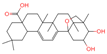 | Triterpenoids | 20 | 162,981,968 | 485.3253743 | [M+H]+ | Pos | C30H44O5 | 463.121 | 485.323255; 467.314296; 449.303379; 421.309481; 95.085504 | 1,676,895,247 | 1.289307824 |
| 21 | Neokadsuranic acid B | 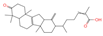 | Triterpenoids | 92 | 78,385,354 | 453.3374578 | [M+H]+ | Pos | C30H44O3 | 481.408 | 453.340042; 435.329506; 417.317354; 107.085173; 311.236845 | 302,123,599.7 | 3.215767303 |
| 22 | Smilagenone | 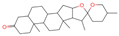 | Triterpenoids | 22 | 313,275 | 415.320709 | [M+H]+ | Pos | C27H42O3 | 485.857 | 415.063669; 397.313404; 109.100875; 95.085575; 119.085774 | 25,172,111.45 | 0.700548339 |
| 23 | 18 beta-Glycyrrhetintic Acid | 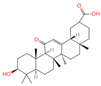 | Triterpenoids | 81 | 10,114 | 471.3468656 | [M+H]+ | Pos | C30H46O4 | 513.041 | 471.344968; 453.343313; 107.085123; 95.085453; 435.329815 | 917,819,007.6 | 0.285164639 |
| 24 | 3beta-hydroxy-21-oxo-11,13(18)-oleanadien-28-oic acid methyl ester |  | Triterpenoids | 43 | 163,035,166 | 483.3465734 | [M+H]+ | Pos | C31H46O4 | 521.46 | 483.311442; 465.288031; 429.277318; 405.318836; 447.283351 | 69,113,720.32 | 0.882538726 |
| 25 | Wilforlide A | 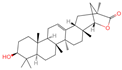 | Triterpenoids | 48 | 158,477 | 455.3517334 | [M+H]+ | Pos | C30H46O3 | 528.872 | 455.357056; 81.069528; 437.352349; 109.100779; 69.069803 | 513,163,312.1 | 0.585490831 |
| 26 | Ganoderic aldehyde A |  | Triterpenoids | 84 | 163,036,286 | 453.3356962 | [M+H]+ | Pos | C30H44O3 | 642.652 | 453.331046; 435.322148; 69.069814; 109.100811; 81.069578 | 167,072,813.4 | 2.876074492 |
| 27 | Dehydrotrametenolic acid | 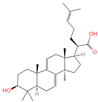 | Triterpenoids | 56 | 15,391,340 | 455.3514154 | [M+H]+ | Pos | C30H46O3 | 647.617 | 455.351776; 107.08527; 109.100787; 121.101364; 95.08478 | 250,319,010.4 | 1.283864243 |
| 28 | Betulin | 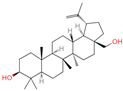 | Triterpenoids | 31 | 72,326 | 443.3792757 | [M+H]+ | Pos | C30H50O2 | 672.397 | 443.311471; 69.0698; 425.306414; 109.100714; 81.069471 | 71,825,700.8 | 21.93225228 |
| 29 | Lupenone | 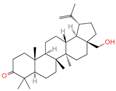 | Triterpenoids | 22 | 92,158 | 425.3770963 | [M+H]+ | Pos | C30H48O | 714.536 | 95.084839; 81.069561; 69.069828; 137.132042; 425.372928 | 1,002,461,661 | 2.124550292 |
| 30 | Panaxatriol | 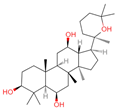 | Triterpene sapogenin | 89 | 73,599 | 459.3823159 | M+H-H2O | Pos | C30H52O4 | 743.23 | 459.377958; 441.371333; 423.359272; 135.116679; 69.069876 | 42,410,492.67 | 1.489083716 |
Disclaimer/Publisher’s Note: The statements, opinions and data contained in all publications are solely those of the individual author(s) and contributor(s) and not of MDPI and/or the editor(s). MDPI and/or the editor(s) disclaim responsibility for any injury to people or property resulting from any ideas, methods, instructions or products referred to in the content. |
© 2025 by the authors. Licensee MDPI, Basel, Switzerland. This article is an open access article distributed under the terms and conditions of the Creative Commons Attribution (CC BY) license (https://creativecommons.org/licenses/by/4.0/).
Share and Cite
Randeni, N.; Luo, J.; Wu, Y.; Xu, B. Elucidating the Anti-Diabetic Mechanisms of Mushroom Chaga (Inonotus obliquus) by Integrating LC-MS, Network Pharmacology, Molecular Docking, and Bioinformatics. Int. J. Mol. Sci. 2025, 26, 5202. https://doi.org/10.3390/ijms26115202
Randeni N, Luo J, Wu Y, Xu B. Elucidating the Anti-Diabetic Mechanisms of Mushroom Chaga (Inonotus obliquus) by Integrating LC-MS, Network Pharmacology, Molecular Docking, and Bioinformatics. International Journal of Molecular Sciences. 2025; 26(11):5202. https://doi.org/10.3390/ijms26115202
Chicago/Turabian StyleRandeni, Nidesha, Jinhai Luo, Yingzi Wu, and Baojun Xu. 2025. "Elucidating the Anti-Diabetic Mechanisms of Mushroom Chaga (Inonotus obliquus) by Integrating LC-MS, Network Pharmacology, Molecular Docking, and Bioinformatics" International Journal of Molecular Sciences 26, no. 11: 5202. https://doi.org/10.3390/ijms26115202
APA StyleRandeni, N., Luo, J., Wu, Y., & Xu, B. (2025). Elucidating the Anti-Diabetic Mechanisms of Mushroom Chaga (Inonotus obliquus) by Integrating LC-MS, Network Pharmacology, Molecular Docking, and Bioinformatics. International Journal of Molecular Sciences, 26(11), 5202. https://doi.org/10.3390/ijms26115202