Article

The RopGEF Gene Family and Their Potential Roles in Responses to Abiotic Stress in Brassica rapa

College of Horticulture Science and Engineering, Shandong Agricultural University, Tai’an 271018, China
*
Author to whom correspondence should be addressed.
These authors contributed equally to this work.
Int. J. Mol. Sci. 2024, 25(6), 3541; https://doi.org/10.3390/ijms25063541
Submission received: 23 February 2024 / Revised: 16 March 2024 / Accepted: 18 March 2024 / Published: 21 March 2024

Abstract

:
Guanine nucleotide-exchange factors (GEFs) genes play key roles in plant root and pollen tube growth, phytohormone responses, and abiotic stress responses. RopGEF genes in Brassica rapa have not yet been explored. Here, GEF genes were found to be distributed across eight chromosomes in B. rapa and were classified into three subfamilies. Promoter sequence analysis of BrRopGEFs revealed the presence of cis-elements characteristic of BrRopGEF promoters, and these cis-elements play a role in regulating abiotic stress tolerance and stress-related hormone responses. Organ-specific expression profiling demonstrated that BrRopGEFs were ubiquitously expressed in all organs, especially the roots, suggesting that they play a role in diverse biological processes. Gene expression analysis revealed that the expression of BrRopGEF13 was significantly up-regulated under osmotic stress and salt stress. RT-qPCR analysis revealed that the expression of BrRopGEF13 was significantly down-regulated under various types of abiotic stress. Protein–protein interaction (PPI) network analysis revealed interactions between RopGEF11, the homolog of BrRopGEF9, and the VPS34 protein in Arabidopsis thaliana, as well as interactions between AtRopGEF1, the homolog of BrRopGEF13 in Arabidopsis, and the ABI1, HAB1, PP2CA, and CPK4 proteins. VPS34, ABI1, HAB1, PP2CA, and CPK4 have previously been shown to confer resistance to unfavorable environments. Overall, our findings suggest that BrRopGEF9 and BrRopGEF13 play significant roles in regulating abiotic stress tolerance. These findings will aid future studies aimed at clarifying the functional characteristics of BrRopGEFs.

1. Introduction

Guanine nucleotide-exchange factors (GEFs) activate ROP by converting GDP-bound ROP/RAC GTPases into their active GTP-bound forms, allowing them to interact with downstream effectors. Plant-specific RopGEF family members have a conserved RopGEF catalytic domain, the PRONE domain (plant-specific ROP nucleotide exchanger), and show catalytic activity towards multiple small G-protein ROPs [1]. These RopGEFs can dimerize and bind to two ROP molecules, and their activity is regulated by phosphorylation [2,3]. The catalytic activity of the PRONE structural domain can be inhibited by the C-terminus of RopGEFs. Recent research has shown that RopGEFs interact with RLKs on the membrane to relieve their inhibition of the PRONE domain, and the activated PRONE domain subsequently activates ROPs, which in turn regulates the expression of downstream genes [4,5].
Several studies have explored the role of RopGEFs in the abiotic stress responses of A. thaliana. The A. thaliana genome contains 14 AtRopGEFs, which exhibit a high degree of sequence similarity. The expression levels of these 14 AtRopGEFs are significantly altered in response to various abiotic stresses, such as cold, heat, salt, and osmotic stress. The expression of AtRopGEF5 is up-regulated under salt and osmotic stress treatments but down-regulated under heat treatment; the expression of AtRopGEF14 is increased under salt stress but decreased under heat stress. Furthermore, AtRopGEF1, 7, 9, and 12 levels are enhanced under heat stress but do not change in response to cold stress. However, osmotic stress induces the expression group 3 AtRopGEFs, such as AtRopGEF1, 5, and 7. Overall, these findings indicate that the expression of individual AtRopGEFs, as well as groups of AtRopGEF genes, is altered in various ways following exposure to abiotic stress [6].
Although few studies have been conducted on RopGEFs in other plant species, previous research on A. thaliana, Oryza sativa, Medicago truncatula, Solanum lycopersicum, and Physcomitrium patens indicates that they play a role in various developmental processes in plants [1,7]. In A. thaliana, AtRopGEFs play a role in various signaling-mediated developmental processes such as root development, stomatal development, and pollen tube growth. Specifically, AtRopGEF1, which is expressed at the tip of the pollen tube, plays a key role in maintaining normal polar growth by activating ROP1 during pollen tube elongation [7]. AtRopGEF12 is also involved in the regulation of pollen tube polar growth [5]. The Pr form of the photosensitizing pigment activates the expression of AtRopGEF11 (also known as PIRF1) in vitro under dark conditions, whereas the Pfr form of the photosensitizing pigment inhibits the expression of this gene. AtRopGEF11 can interact with ROPs in the presence of photosensitizing pigments to activate them, and these interactions play a key role in the regulation of light signals and the maintenance of normal root development [8]. AtRopGEF1, AtRopGEF4, and AtRopGEF10 are involved in regulating stomatal development by affecting the activity of ROP11 in the ABA signaling pathway. Mutations of AtRopGEF1 and AtRopGEF4 result in increased sensitivity to ABA and increased stomatal closure [9]. Moreover, simultaneous mutations of AtRopGEF1, AtRopGEF4, and AtRopGEF10 result in increased sensitivity to ABA. AtRopGEF7 regulates root tip stem cell homeostasis by regulating the expression of the growth hormone-mediated transcription factor PLT and affecting the accumulation of the growth hormone export protein PIN1, which affects the formation of growth hormone concentration gradients as well as the growth hormone response [10]. Additionally, AtRopGEF1 controls the polar localization of the AUX1 protein and the accumulation and distribution of the PIN protein, which regulates embryonic development and the root gravitropic response [11]. A study of the upstream factors of AtRopGEFs revealed that plant-like receptor protein kinases RLKs (receptor-like kinases) are involved in AtRopGEFs-ROPs signaling and regulate downstream signaling by activating corresponding AtRopGEFs, which, in turn, activate ROPs [12]. The reduction in cell tip development is a significant macroscopic symptom of ARK mutants, and the growth phenotype is partially recovered by RopGEF3 expression and forced apical localization [13].
In rice (O. sativa), the roles of OsRopGEFs in several developmental processes, such as pollen germination, pollen tube growth, root development, and the expression of agronomic traits, such as plant height and grain length, have been clarified. Specifically, OsRopGEF2, OsRopGEF3, OsRopGEF6, and OsRopGEF8 are predominantly expressed in pollen, indicating that they play key roles in pollen germination and pollen tube growth. Phenotypic analysis has shown that the double-knockout mutants OsRopGEF2 and OsRopGEF8 are characterized by a significant reduction in pollen germination and seed yield [14]. OsRopGEF3 was found to interact with OsRac3 to regulate root hair elongation and reactive oxygen species (ROS) production. OsRopGEF3 converts the GDP of OsRac3 to GTP, and the activated OsRac3 protein interacts with OsRBOH5 to generate ROS, indicating that OsRopGEF3 plays a key role in rice root hair growth [15]. Furthermore, single mutants of OsRopGEF5 and OsRopGEF3 have been shown to affect plant height and grain length, respectively [16]. A previous study of M. truncatula has revealed that the down-regulated expression of MtRopGEF2 results in shortened root hairs similar to those observed in DN-MtROP3. This finding suggests that MtRopGEF2 plays a role in root hair growth by affecting the activity of MtROPs [17]. In tomato (S. lycopersicum), the kinase partner protein (KPP) serves as an ROP guanine nucleotide exchange factor (GEF) responsible for activating ROP GTPases and interacts with the tomato pollen receptor kinases LePRK1 and LePRK2. KPP nucleates branched actin by recruiting it via the membrane-localized receptors LePRK1 and LePRK2, the ARP2/3 complex, and actin bundles, and this plays a key role in regulating pollen tube growth and shape [4]. In P. patens, RopGEFs and ROP GTPASE-ACTIVATING PROTEINs (RepGAPs) form membrane domains when they grow in the tips of cells [18].
Chinese cabbage (Brassica rapa), an economically important crop with high nutritional value, is highly susceptible to the deleterious effects of abiotic stresses, especially salt and osmotic stress. Diverse molecular mechanisms underlie the deleterious effects of these stresses on plants [19,20]. However, the roles of AtRopGEFs in development and stress responses in B. rapa have not yet been elucidated. Thus, BrRopGEF gene family members were identified and annotated using bioinformatic approaches, and their structures, protein sequences, conserved structural domains, evolutionary relationships, and expression patterns were systematically analyzed to aid future studies of the biological functions of BrRopGEF gene family members in B. rapa.

2. Results

2.1. Identification of RopGEF Genes and Analysis of the Physical–Chemical Properties and Subcellular Localization of Their Encoded Proteins

We used HMMER and local BLAST algorithms to compare BrROPGEF sequences against the B. rapa genome database. We confirmed the presence of the PRONE (or PRONE superfamily) domains using the conserved domain database (CDD) and protein families (PFAM) database. A total of 21 BrRopGEFs were identified. Based on their physical positions in the B. rapa genome, these BrRopGEF members were named BrRopGEF1BrRopGEF21 (Table 1). Among the 21 BrRopGEF genes, the length of BrRopGEF1 was the shortest (1586 base pairs), and the length of BrRopGEF17 was the longest (7369 base pairs). The lengths of the amino acid sequences ranged from 391 to 941 amino acids, and the corresponding molecular masses of the proteins ranged from 44,107.32 to 565,501.00 Daltons. The isoelectric points of the BrRopGEF proteins in B. rapa varied from 4.95 to 9.12. The isoelectric points of 18 BrROPGEF proteins were greater than 7, indicating that the number of acidic amino acids was higher in BrROPGEF proteins than in other proteins within the family. Subcellular localization predictions, which were performed using the WOLF PSORT server, indicated that BrRopGEFs were distributed across various organelles within the cell, including the nucleus, cytosol, and chloroplast.

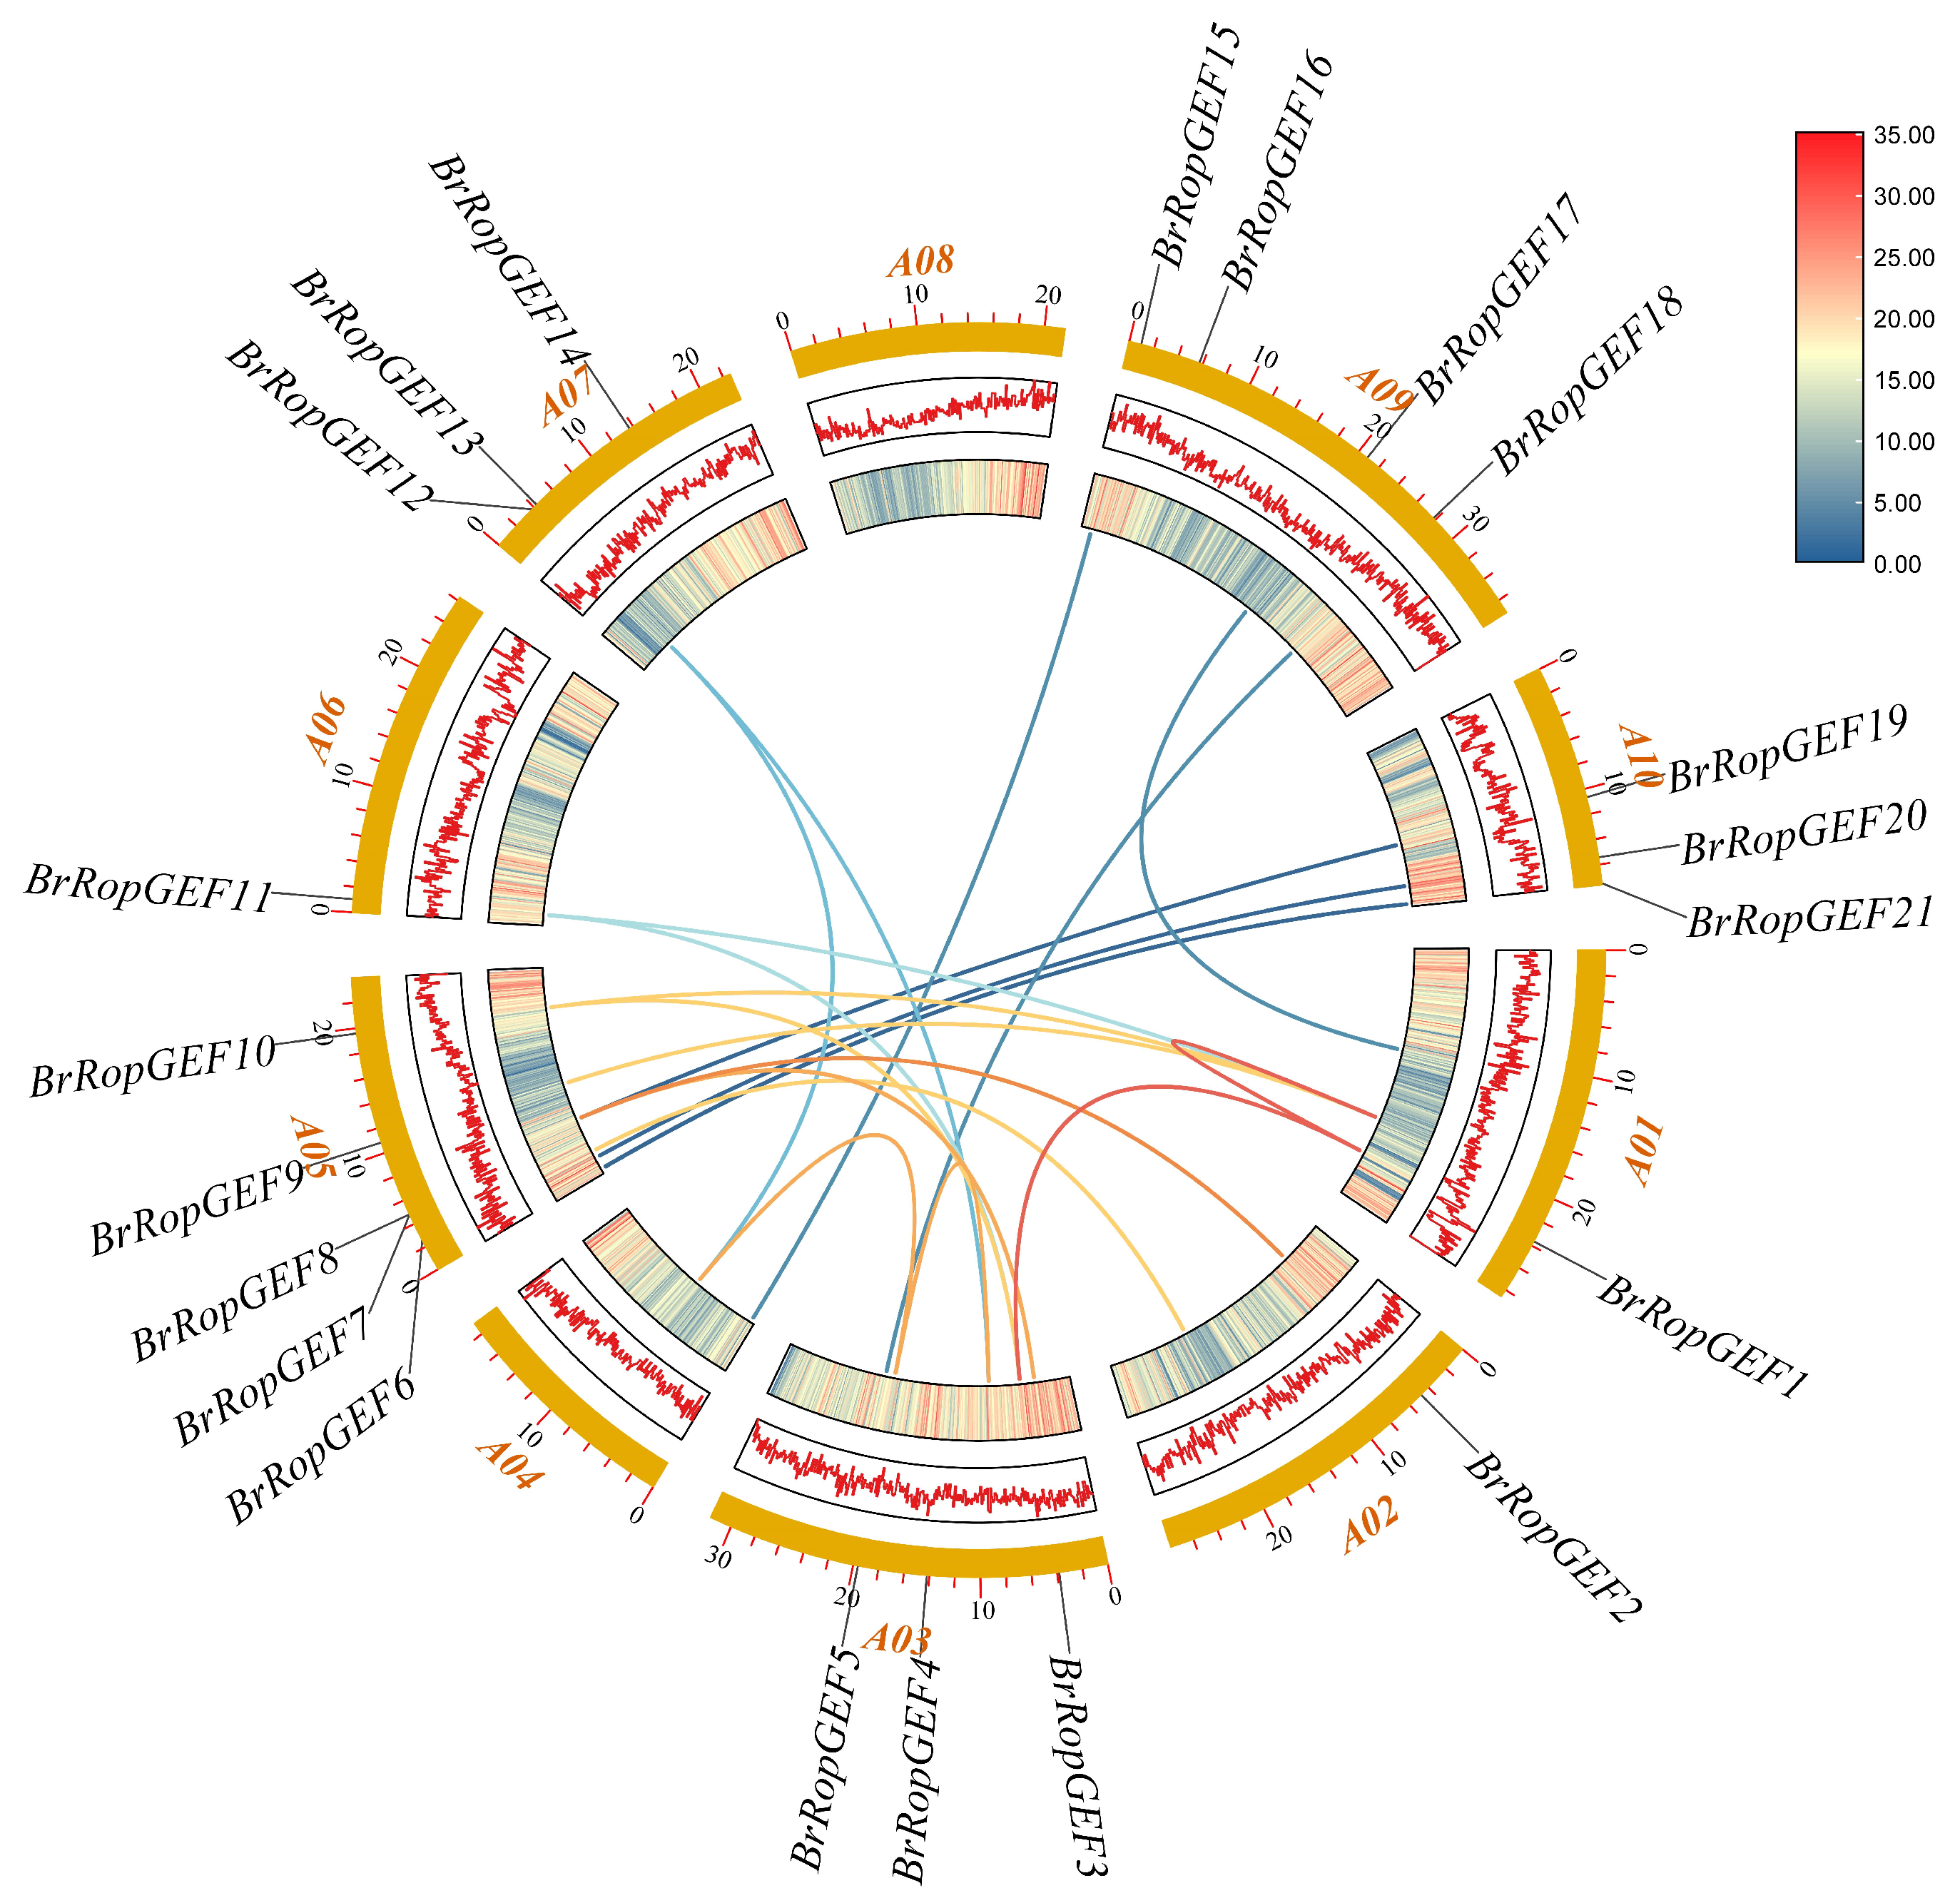
2.2. Chromosomal Mapping Analysis of BrRopGEF Genes in B. rapa

Chromosome mapping analysis of BrRopGEF genes revealed that a total of 21 BrRopGEFs were distributed across eight chromosomes (Figure 1). The greatest number of BrRopGEF genes (5) was observed on Chromosome 5. Four BrRopFEG genes were observed on Chromosome 9. Chromosomes 3, 7, 9, and 10 each had three BrRopGEF genes, and Chromosomes 3 and 6 each contained two BrRopGEF genes. Chromosomes 1, 2, and 6 each contained a single BrRopGEF gene. BrRopGEF7 and BrRopGEF8 were located next to each other on Chromosome 5, suggesting that these genes are tandemly duplicated pairs.
One of the aims of our study was to elucidate the phylogenetic relationships among BrRopGEF genes; we constructed a phylogenetic tree using genes from B. rapa, A. thaliana, and O. sativa. B. rapa was more closely related to A. thaliana than to O. sativa (Figure 2A). Based on the phylogenetic tree, we categorized the 21 BrRopGEFs into six distinct groups (I–VI). Group I comprised six B. rapa genes, including two from A. thaliana. Group II comprised eight genes, including five from B. rapa and three from A. thaliana. Group III comprised eight members, three from B. rapa, three from O. sativa, and one from A. thaliana. Group IV was the largest group, comprising eleven members, including four from B. rapa, three from O. sativa, and four from A. thaliana. Therefore, the phylogenetic analysis suggested that RopGEFs in B. rapa were more closely related to those in A. thaliana than to those in O. sativa.
We examined collinearity relationships between BrRopGEF genes and genes of A. thaliana and O. sativa (Figure 2B). Strong collinearity relationships were observed between 18 BrRopGEFs and 14 genes in A. thaliana and between 3 BrRopGEF genes and 2 genes in O. sativa.

2.3. Analysis of Promoter Cis-Regulatory Elements of RopGEFs in B. rapa

We conducted a comprehensive analysis to elucidate the potential mechanisms underlying the regulation of BrRopGEF genes, as well as the influence of phytohormones and stress-responsive elements on their regulation. The PlantCARE web server was used to identify putative cis-elements specific to the promoters of BrRopGEF genes. A total of 18 prominent regulatory cis-acting regulatory elements (CAREs) were identified. These elements have been shown to play a role in various physiological processes, including auxin responses, abscisic acid (ABA) responses, gibberellin (GA) responses, methyl-jasmonate (MeJA) responses, low-temperature responses, and drought responses (Figure 3). The promoters of all BrRopGEF genes, with the exception of the promoters of BrRopGEF11 and BrRopGEF13, contained anaerobic-inducible regulatory elements. Further examination revealed that approximately 67% of the CAREs contained ABA elements, 62% contained MeJA-response elements, around 52% contained GA-responsive elements, approximately 43% contained drought-induced response elements, and 33% contained low-temperature-responsive elements.

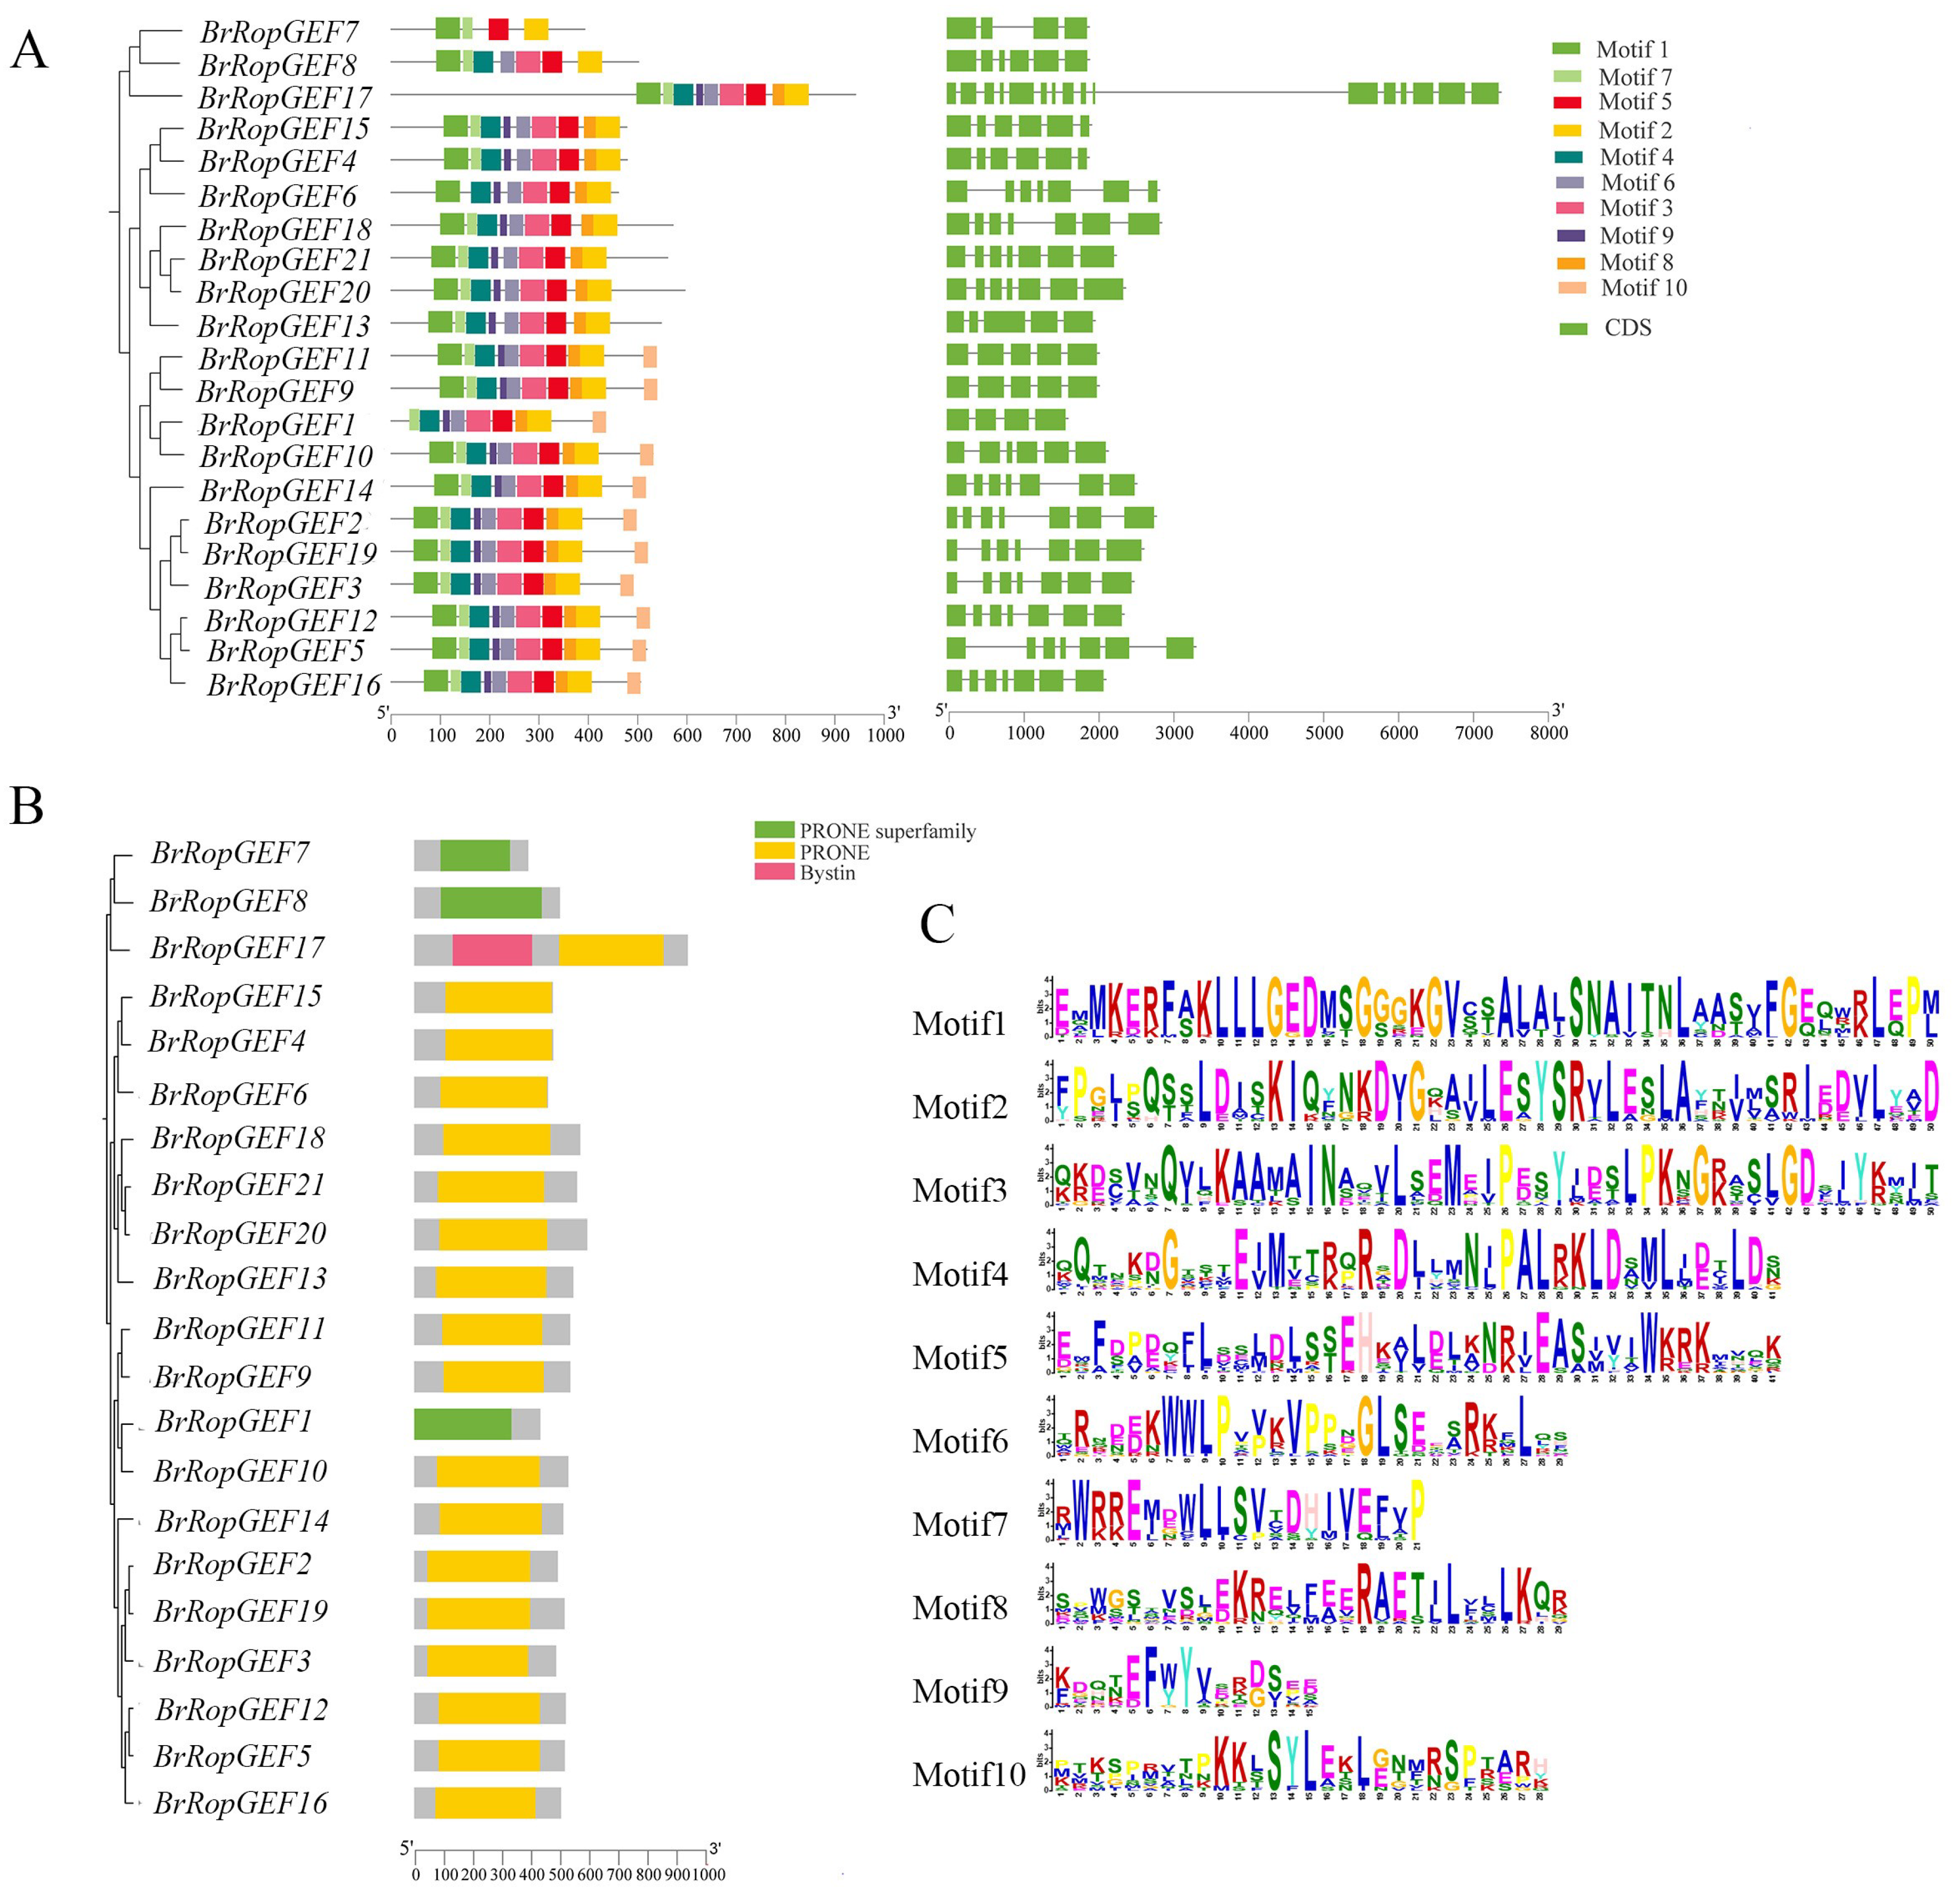
2.4. Analysis of BrRopGEF Gene Structure and the Domain Distribution of Their Encoded Proteins

A comprehensive analysis was conducted to investigate the structural characteristics of BrRopGEFs through examination of their exon architectures (Figure 4A). Substantial variation in exon architecture was observed among BrRopGEF genes, and the number of exons ranged from 4 to 16, indicating that considerable divergence was observed within the BrRopGEF family.
Phylogenetic analysis revealed that BrRopGEFs can be classified into two main groups with distinct conserved motifs (Figure 4A). Class 1 contained three BrRopGEF genes; BrRopGEF7 contained Motif 1, Motif 2, Motif 5, and Motif 7; BrRopGEF8 contained Motif 1 to Motif 7; and BrRopGEF17 contained Motif 1 to Motif 8. Category 2 contained 18 genes, and these could be further subdivided into two distinct groups: Group 1, which contained seven BrRopGEF genes containing Motif 1 to Motif 9, and Group 2, which contained 11 BrRopGEF genes, all of which lacked Motif 1, with the exception of BrRopGEF1. The remaining 10 genes in Group 2 contained 10 motifs (Motif 1 to Motif 10).
The number of conserved motifs within each BrRopGEF gene ranged from 4 to 10. Most BrRopGEF genes had 7 to 10 motifs; however, BrRopGEF7 had only 4 conserved motifs. All BrRopGEF genes had Motif 1, with the exception of BrRopGEF1; thus, 95.2% of the BrRopGEF genes contained Motif 1. Additionally, all BrRopGEF genes contained Motif 2, Motif 5, and Motif 7. These findings strongly suggest that Motif 1, Motif 2, Motif 5, and Motif 7 are the most conserved motifs within the BrRopGEF gene family (Figure 4A). Consequently, the arrangement of structural motifs varies among members of the BrRopGEF family, but is highly similar among closely related genes.
BrRopGEF genes encode proteins with two primary conserved domains, including PRONE domains (or the PRONE superfamily). The presence of PRONE domains is essential for AtRopGEF to catalyze the conversion of GDP to GTP (Figure 4B) [9]. Similar protein structures were observed within the BrRopGEF family, as evidenced by their placement in the same phylogenetic branch, which suggests that they have shared functions. Examination of motif logos and information regarding the motifs of BrRopGEFs (Figure 4C and Table 2) revealed a prevalence of conserved amino acids within all motifs, which underscores their importance for protein function.

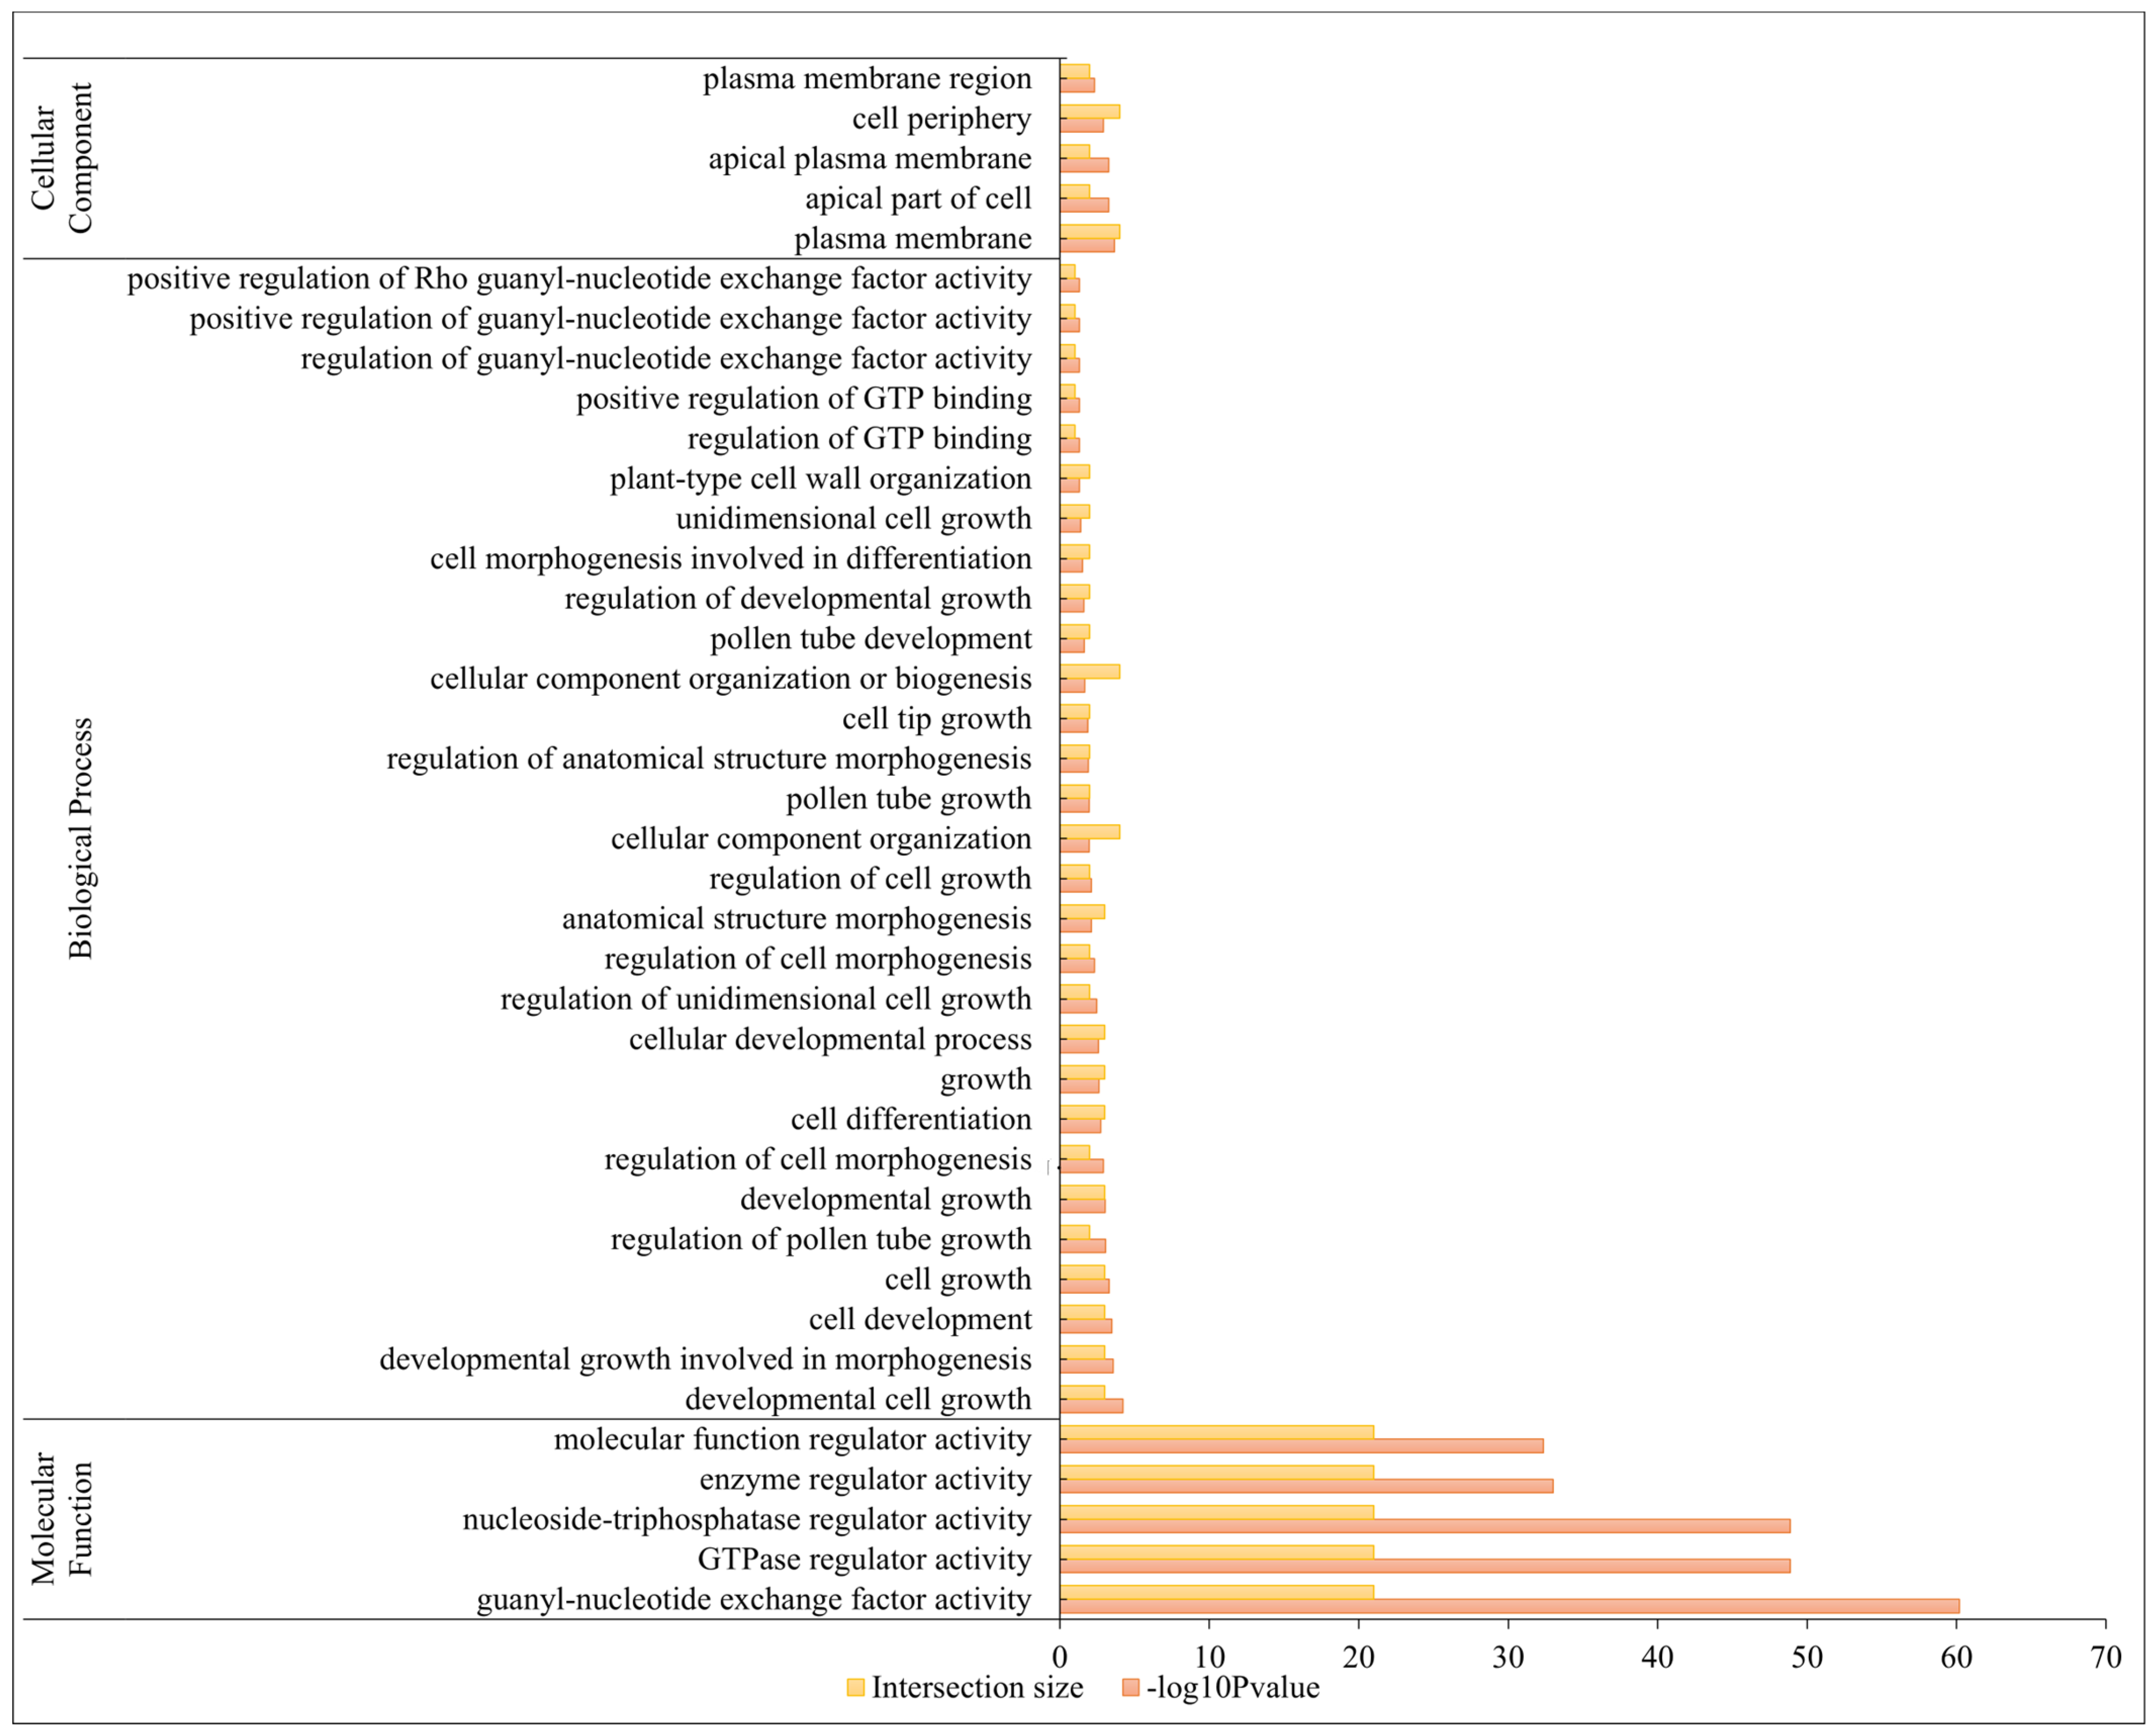
2.5. Gene Ontology (GO) Annotation Analysis of BrRopGEFs

We conducted a GO analysis of BrRopGEF genes to elucidate their potential functions. BrRopGEF genes were enriched in 39 GO terms in three categories: “Biological Processes, GO-BPs”, “Cell Components, GO-CCs”, and “Molecular Functions, GO-MFs” (Figure 5, Table S1). The most enriched GO terms were guanyl-nucleotide exchange factors (GO:0005085), GTPase regulators (GO:0030695), nucleoside-triphosphatase regulator activity (GO:0060589), and enzyme regulator activity (GO:0030234). In the cellular component (CC) category, the most enriched GO terms were plasma membrane (GO:0005886), apical part of the cell (GO:0045177), and cell periphery (GO:0071944), and this was consistent with subcellular localization prediction. The main GO terms in the biological process category were cellular component organization (GO:0016043), cellular component organization or biogenesis (GO:0071840), and other related processes. Overall, the GO data indicated that BrRopGEFs play a key role in the regulation of gene expression.

2.6. Gene Expression Analysis of BrRopGEFs

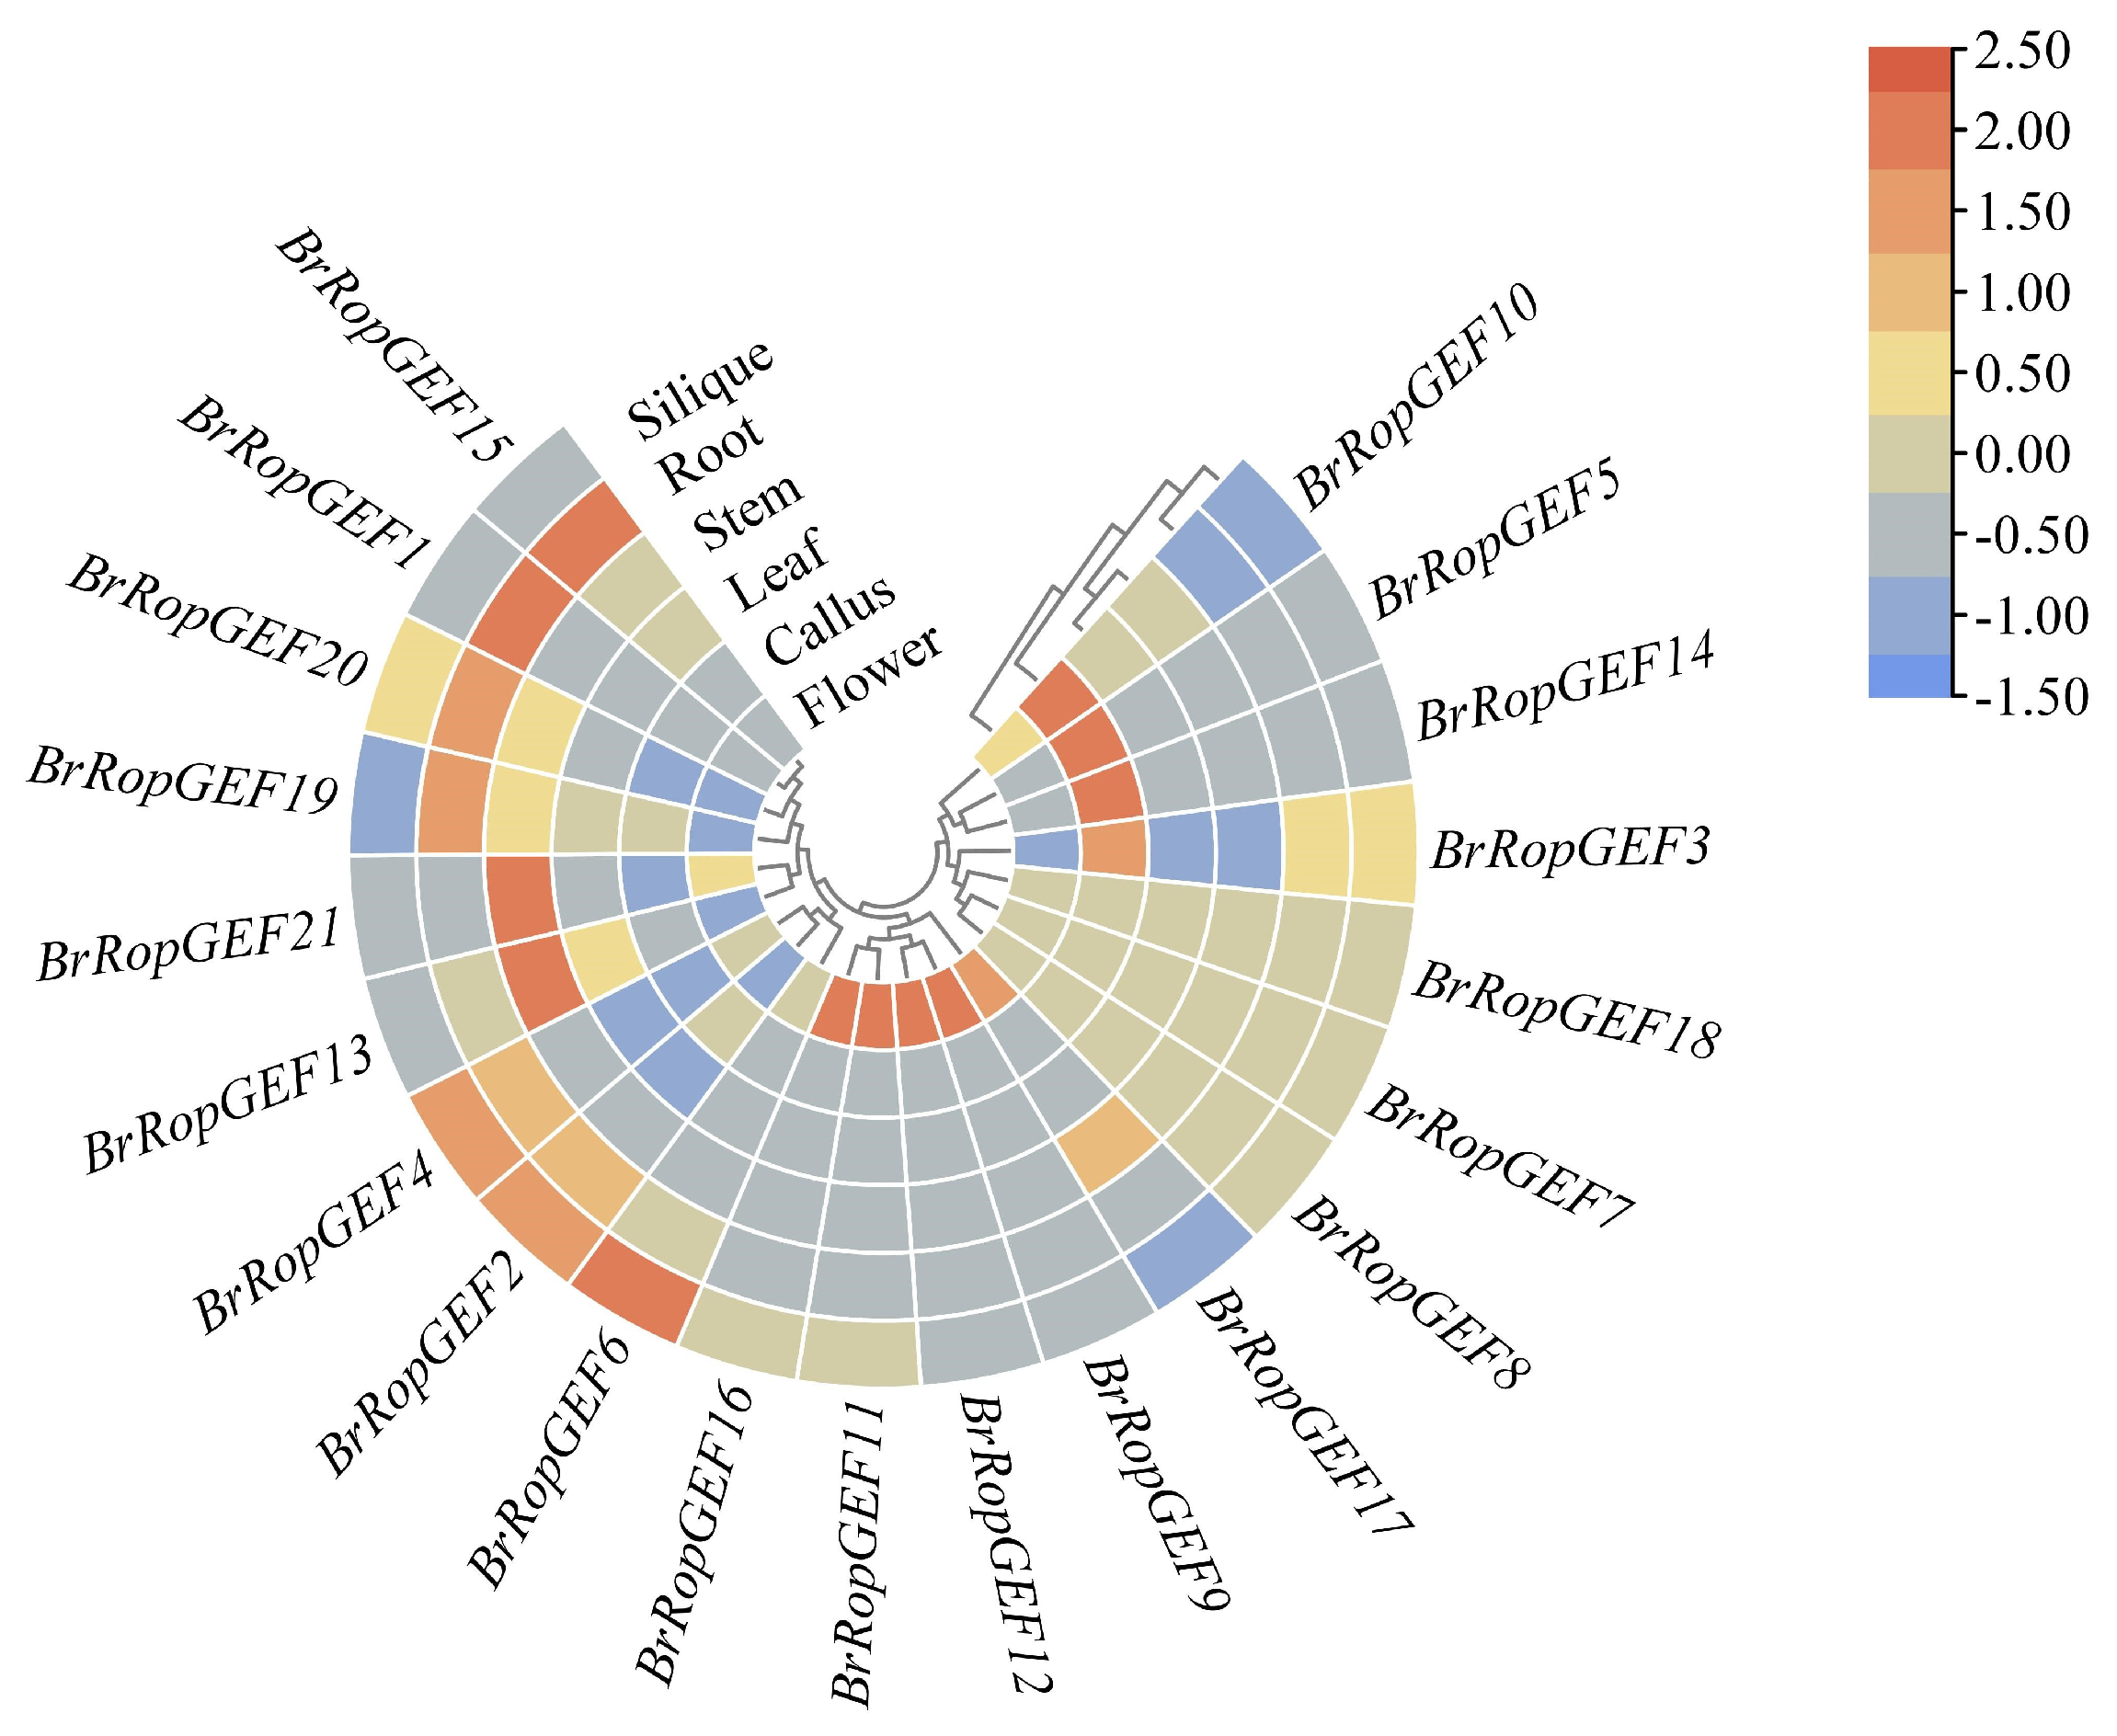
2.6.1. Analysis of the Organ-Specific Expression of BrRopGEF Genes in Organs

Expression patterns of the 21 BrRopGEFs in five organs of B. rapa (root, stem, leaf, flower, and callus) were investigated (Figure 6, Table S2). The similarity of the expression patterns among genes was positively associated with their sequence similarity. BrRopGEF1, BrRopGEF15, BrRopGEF19, and BrRopGEF20 were highly expressed in roots. Only BrRopGEF13 and BrRopGEF21 were significantly expressed in stems, suggesting that they play a role in stem growth and development processes. Moreover, several BrRopGEF genes were highly expressed in flowers, suggesting that they play a role in regulating flowering-related traits, such as flowering time and duration. Overall, these findings highlight the diverse roles of different BrRopGEFs in the developmental processes of various organs.

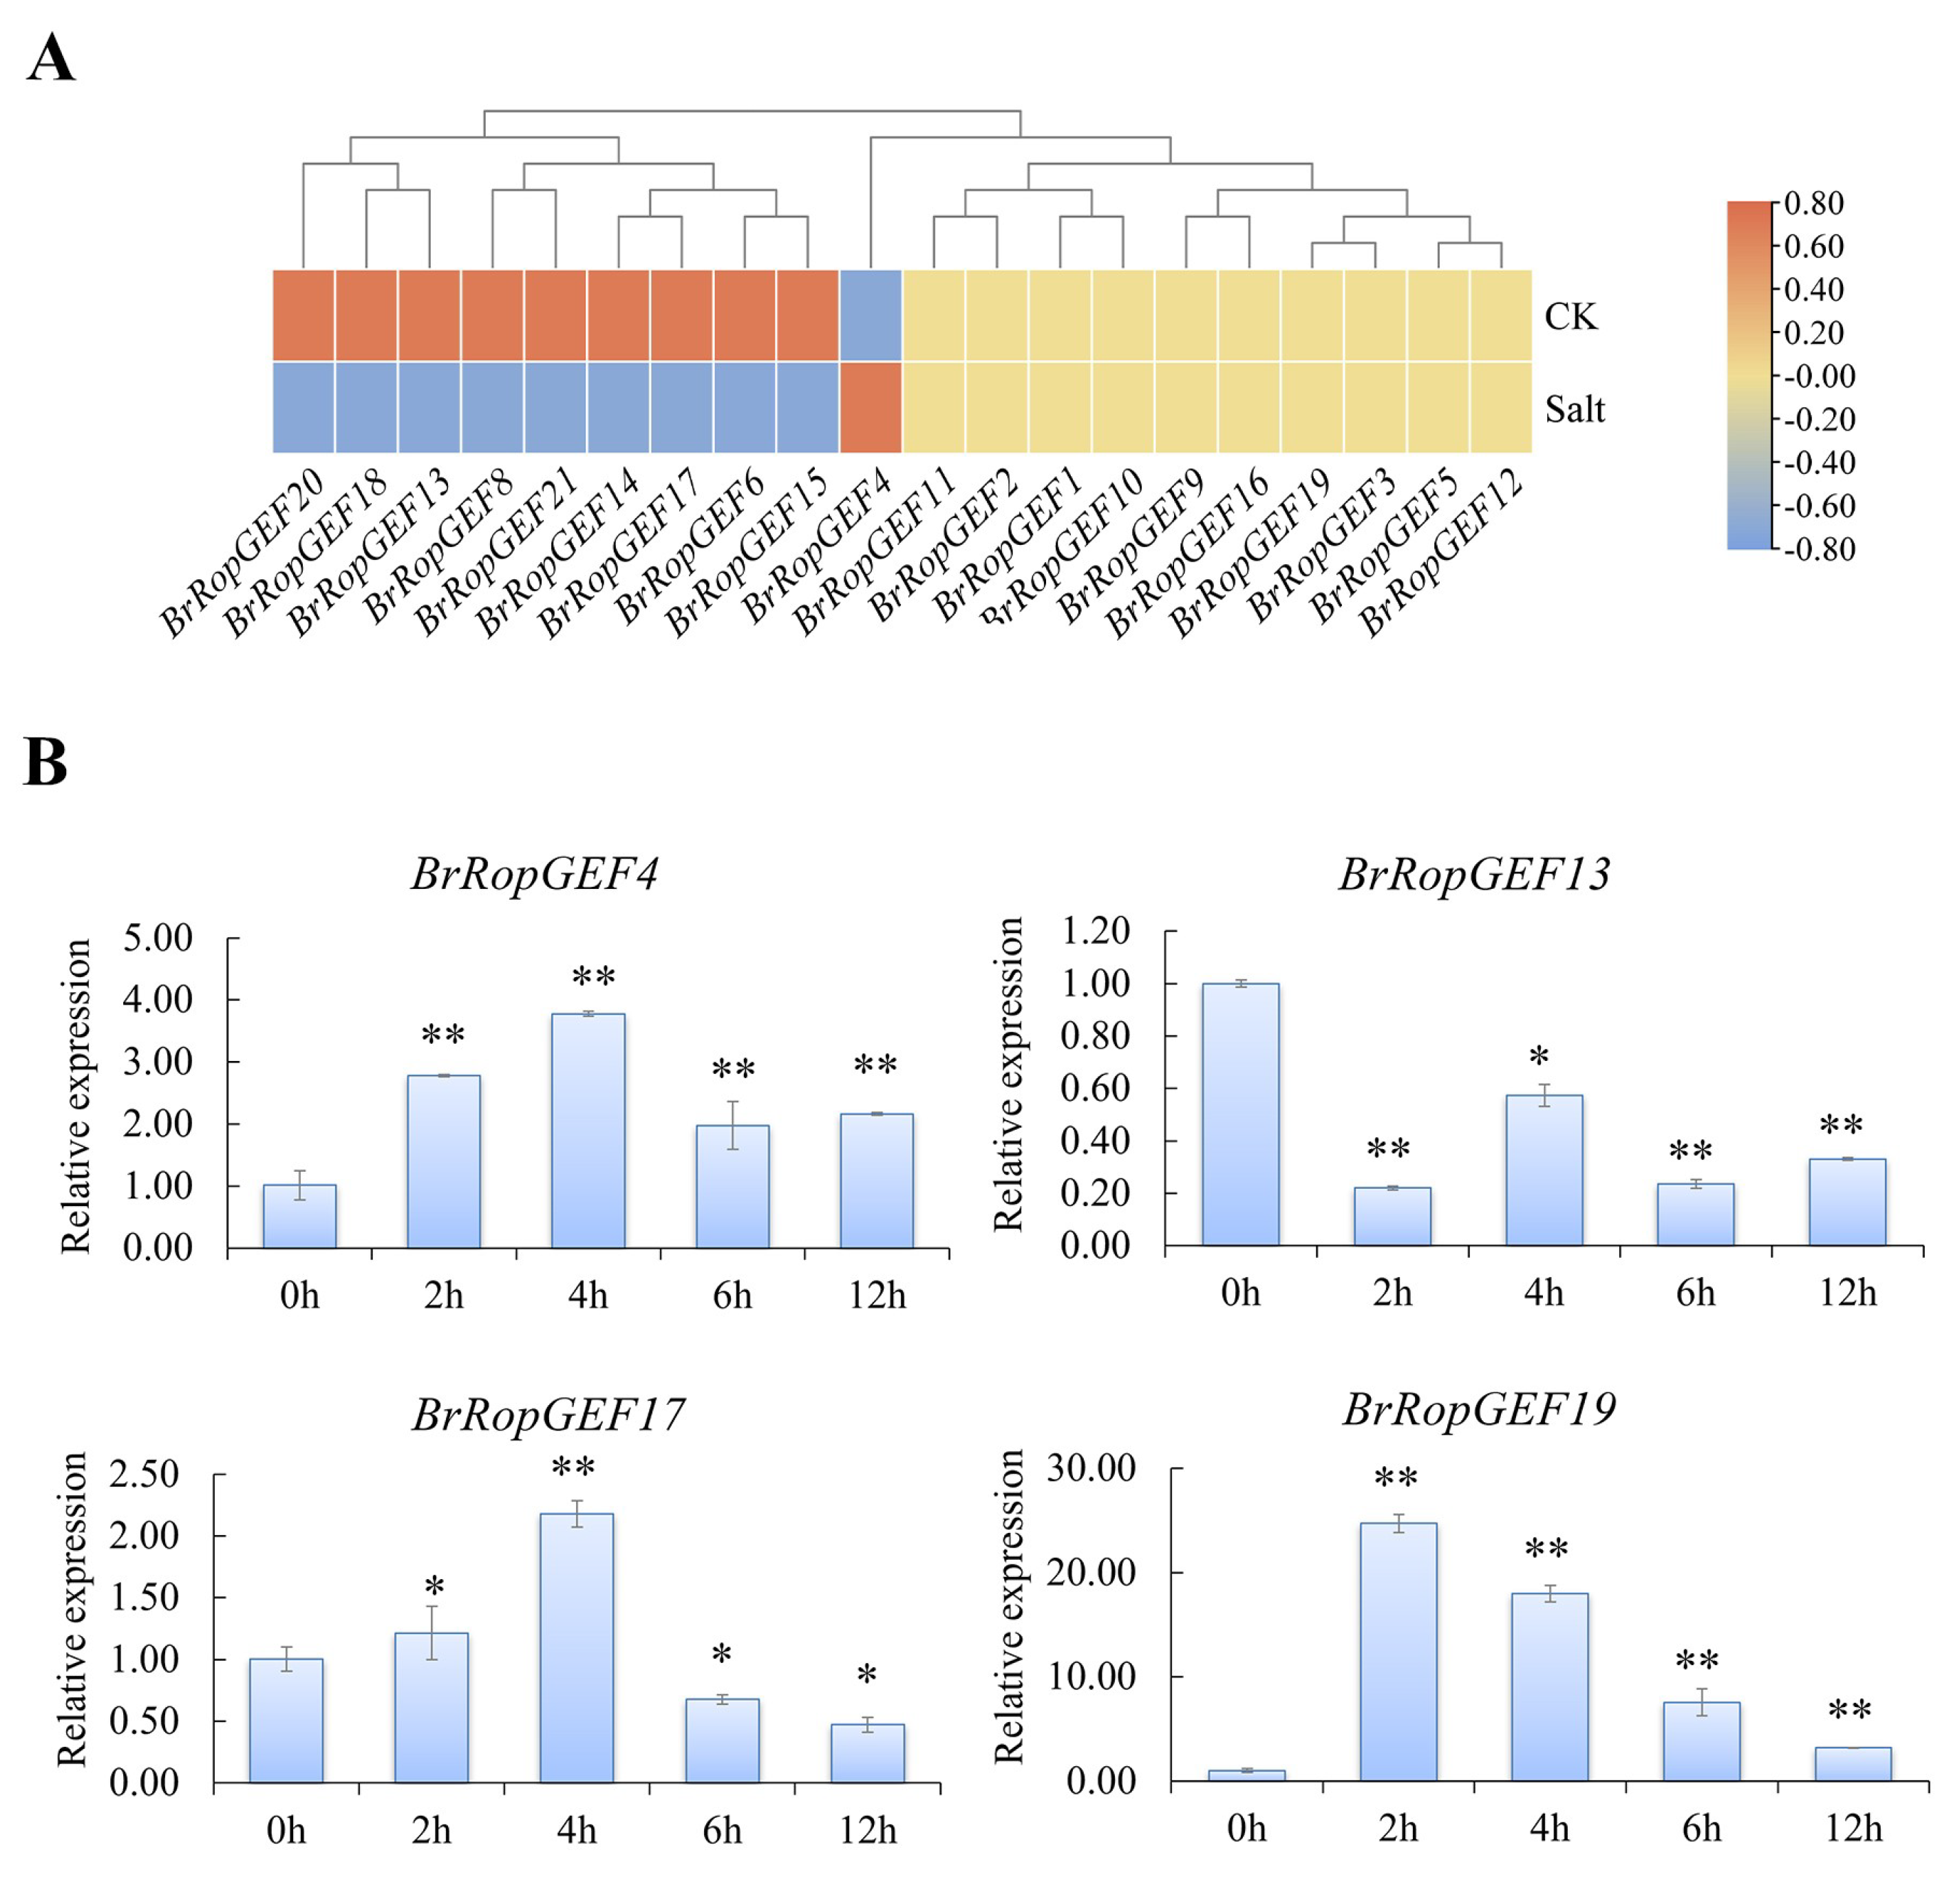
2.6.2. Analysis of BrRopGEFs Involved in Responses to Abiotic Stress

The growth and yield of plants and crops are hampered by the osmotic stress caused by drought and high salinity [21]. We used transcriptome analysis, proteomic assays, and RT-qPCR analysis to determine changes in the expression of BrRopGEFs under osmotic stress and salt stress.
Analysis of transcriptomic data from drought-sensitive (DS) and drought-tolerant (DT) plants revealed differential expression patterns, especially for BrRopGEF13, 17, 20, and 21 (Figure 7A, Table S3). The expression levels of BrRopGEF13, BrRopGEF20, and BrRopGEF21 were lower in DT plants than in DS plants. Both BrRopGEF13 and BrRopGEF20 contain GA-response elements, and BrRopGEF20 and BrRopGEF21 also contain ABA-response elements. These findings support the hypothesis that the up-regulation of these genes in response to osmotic stress is associated with GA and ABA metabolism [22].
We investigated the expression levels of BrRopGEFs under control conditions (0 h) and osmotic stress (6 h) using RNA-seq analysis (Figure 7B, Table S4). Our findings revealed that the expression of nine genes was up-regulated, and the expression of two genes was down-regulated. The expression of the other genes was not significantly altered under osmotic stress compared with control (CK) conditions. We analyzed the expression of several genes using quantitative real-time PCR (RT-qPCR) based on their expression patterns in roots and stems under osmotic stress, which were inferred from RNA-seq analysis. The expression of BrRopGEFs was generally up-regulated at 2–4 h, and no significant differences in the expression of BrRopGEFs were observed between treatments and the control at 12 h (Figure 7C, Table S5). The expression of BrRopGEF17 was substantially up-regulated 10–20-fold at 4–6 h compared with the control. Conversely, the expression of BrRopGEF13 and 21 decreased after being initially up-regulated, and their expression at 12 h under osmotic stress was lower than that under control conditions; this was consistent with the results of the RNA-seq analyses.
We found that the expression of nine genes was down-regulated under salt stress conditions. In contrast, the expression of BrRopGEF4 was up-regulated under salt stress conditions (Figure 8A, Table S4).
We also performed RT-qPCR analysis (Figure 8B, Table S5). The results revealed that the expression of BrRopGEF4 and 19 was significantly up-regulated under salt stress compared with the CK. The expression of BrRopGEF13 and BrRopGEF17 was significantly down-regulated under salt stress. These RT-qPCR findings are consistent with the transcriptome data, confirming their reliability.

2.7. Analysis of the Protein Secondary and Tertiary Structures of BrRopGEFs

The protein secondary structures of BrRopGEFs in B. rapa, including α-helixes, extended chains, β-turns, and random coil components, were analyzed. The most common secondary structures in the RopGEF proteins were α-helixes and random coil components; β-turns were the least common components (Figure 9A).
Furthermore, the tertiary structures of proteins are determined by additional coiling and folding processes based on the secondary structures. Visualization of the tertiary conformations can provide insights into the structural characteristics of these proteins and their evolutionary relationships. We used computational techniques to predict the three-dimensional protein structure of RopGEF1, using proteins encoded by homologs of BrRopGEF in A. thaliana as a representative model. Two different angles of the resulting model are shown, and the distinct colors denote the various secondary structures and labeling of specific structural domains (Figure 9B). Additionally, homology modeling was used to predict the tertiary structures of ROPGEFs in B. rapa (Figure 9C), and this revealed a notable degree of structural similarity among members of the same subgroup. This observation indicates that homologous structures have been evolutionarily maintained.
The PRONE domain is divided into three subdomains that are highly conserved and separated by two short segments of variable amino acid residues [1,7]. The molecule is approximately 370 residues in length and mainly consists of alpha-helices, with the exception of a beta-turn that protrudes from the main body of the molecule. The PRONE domain’s structure is divided into two subdomains: SD1, which includes the helices alpha1-5 and alpha13, and SD2, which includes the helices alpha6-12 [3]. The interaction between the PRONE domain and the nucleotide binding site of the RopGEF protein leads to the release and exchange of nucleotides [23].

2.8. Protein–Protein Interaction (PPI) Network Analysis of BrRopGEFs

Proteins play a key role in carrying out cellular and tissue functions, and they are involved in diverse life activities [24]. PPI networks consist of proteins that interact with each other and participate in various life processes, such as biological signaling, gene expression regulation, energy and material metabolism, and cell cycle regulation [24,25,26,27]. Identifying the links between unknown functional proteins and PPI interaction networks can provide insights into the complex biological functions of proteins and the dynamic regulation of network interactions among biomolecules within cells [28,29]. We constructed predicted PPI network maps for ROPGEFs using the integrated resources and algorithms available in the STRING database. Strong interactions of ROPGEF members in A. thaliana with RAC10, PRK2A, ROP1, RAC2, and ARAC5 were detected (Figure 10A, Table S6). BrRopGEF13 was orthologous to AtROPGEF1, and BrROPGEF9 and BrROPGEF11 were orthologous to AtROPGEF1. In A. thaliana, AtRopGEF1 specifically regulates the function of ROP11 in ABA-mediated stomatal closure [30].
Analysis of the PPI network revealed an intriguing similarity between the predicted PPI networks of RopGEF13 in A. thaliana and RopGEF1, which suggests that transcription factors involved in ABA signaling, including ABSCYACID INSENSITIVE1 (ABI1), HYPERSENSITIVE TO ABA1 (HAB1), and protein phosphatase 2CA (PP2CA), interact with the proteins encoded by homologs of BrRopGEF13 (Figure 10B). Furthermore, the protein encoded by the homolog of BrRopGEF9 and BrRopGEF11 (AtRopGEF11) was found to interact with phosphatidylinositol 3-kinase (AtVSP34) in A. thaliana (Figure 10C). These findings suggest that the proteins encoded by BrRopGEFs engage in diverse interactions with proteins encoded by different gene families to mediate responses to abiotic stresses.

3. Discussion

RopGEFs are a highly conserved protein family specific to plants, and they play key roles in mediating the adaptation of plants to abiotic stress. In this study, we aimed to identify RopGEFs and analyze their structure and expression patterns, as well as the sequences of their encoded proteins, conserved structural domains, and evolutionary relationships. The aim was to elucidate the role of BrRopGEFs in the responses of B. rapa to abiotic stress.
BrRopGEF13 potentially plays a role in regulating the response of B. rapa to osmotic stress. Comprehensive analysis of its promoter elements revealed GA-responsive motifs within the BrRopGEF13 promoter region. Previous studies have revealed that osmotic conditions result in the deactivation of GA, which induces premature stomatal closure in response to soil desiccation. This, in turn, inhibits the synthesis of GA within leaf tissues, thereby restricting the transpirational surface area [31]. ABA plays a role in the abscission of plant leaves and responses to osmotic stress [32]. These findings indicate that GA and ABA play a role in adaptation to osmotic stress. The down-regulation of these genes was observed in both the RNA-seq and RT-qPCR analyses.
According to the PPI network analysis, the homolog of BrRopGEF13, AtRopGEF1, interacted with protein phosphatases, such as ABI1, HAB1, and PP2CA, as well as calcium-dependent protein kinases (CPKs) [33]. Active CPKs phosphorylate GEF1, which mediates the transport and degradation of GEF1. The removal of GEF1 leads to the deactivation of ROP10 and ROP11, which serve as negative regulators in the ABA signal transduction pathway [34,35,36]. Hence, the removal of ABA-induced GEF by CPKs promotes ABA signal transduction by dismantling the negative regulatory loop composed of PP2C-GEF-ROP10/ROP11 [30,34,35,36]. In conclusion, the BrRopGEF gene might play a role in the response to osmotic stress.
BrRopGEF9 likely plays a key role in the response of B. rapa to osmotic stress and salt stress. Analysis of cis-acting elements within the promoter region of BrRopGEF9 reveals the presence of SA and ABA-responsive elements. Under osmotic conditions, ABA, which acts as a chemical signal, induces stomatal closure, thereby promoting the responses of plants to osmotic stress and salt stress [37]. The biosynthesis of SA can also enhance the tolerance of plants to osmotic conditions [38]. The transcriptome data and RT-qPCR results consistently indicated that the expression of BrRopGEF9 is up-regulated in response to changes in salt levels.
In A. thaliana, the homologous gene AtRopGEF11 has been demonstrated to interact with VSP34 (phosphatidylinositol 3-kinase). GO analysis suggests that VSP34 is involved in processes related to stomatal closure, ROS metabolism, and salt stress response regulation. AtRopGEF11 is a component of the COP9 Signalosome (CSN), which is associated with various cellular and developmental processes, including photomorphogenesis, auxin, JA responses, and PPIs [39]. Previous studies have indicated that JA effectively mitigates salt-stress-induced damage in plants [40,41]. RopGEF11 can interact with ROPs and induce their activation, which regulates light signaling and maintains normal root development [8]. Based on these findings, we suggest that BrRopGEF9 might play a key role in the response of B. rapa to osmotic stress and salt stress through its effects on root development, osmotic response elements, hormone regulation, and protein interactions.

4. Materials and Methods

4.1. Identification of RopGEF Genes and Analysis of the Physical-Chemical Properties and Subcellular Localization of Their Encoded Proteins

A. thaliana genomic data were acquired from TAIR (https://www.arabidopsis.org/ (accessed on 14 December 2022)), and B. rapa genomic data were downloaded from BRAD (http://brassicadb.cn/ (accessed on 23 December 2022)) to construct a local BLAST database [42]. Through bidirectional BLAST searches (E-value < 1 × 10⁻¹⁰, Identity > 40%), 21 known BrRopGEFs were identified. A conserved domain database from NCBI was used to analyze the conserved domains of the selected members. (https://www.ncbi.nlm.nih.gov/cdd (accessed on 24 December 2022)) [43], and the domains were verified using Pfam (E-value < 1.0) (http://pfam.xfam.org/ (accessed on 24 December 2022)) [44]. Members that did not contain typical domains for BrRopGEFs were eliminated.
The Bioinformatics Resource Portal ExPASy server (http://web.expasy.org/protparam/ (accessed on 3 January 2023)) with default parameters was used to determine biochemical properties, such as amino acid composition, molecular weight (MW), and theoretical pI, for BrRopGEF proteins [45]. The SWISS-MODEL (https://swissmodel.expasy.org/ (accessed on 15 January 2023)) online program was used to predict the structure of BrRopGEF proteins using default parameters [46].
The WOLF PSORT website (https://www.genscript.com/wolf-psort.html (accessed on 21 January 2023)) was used to conduct subcellular localization analysis [47].

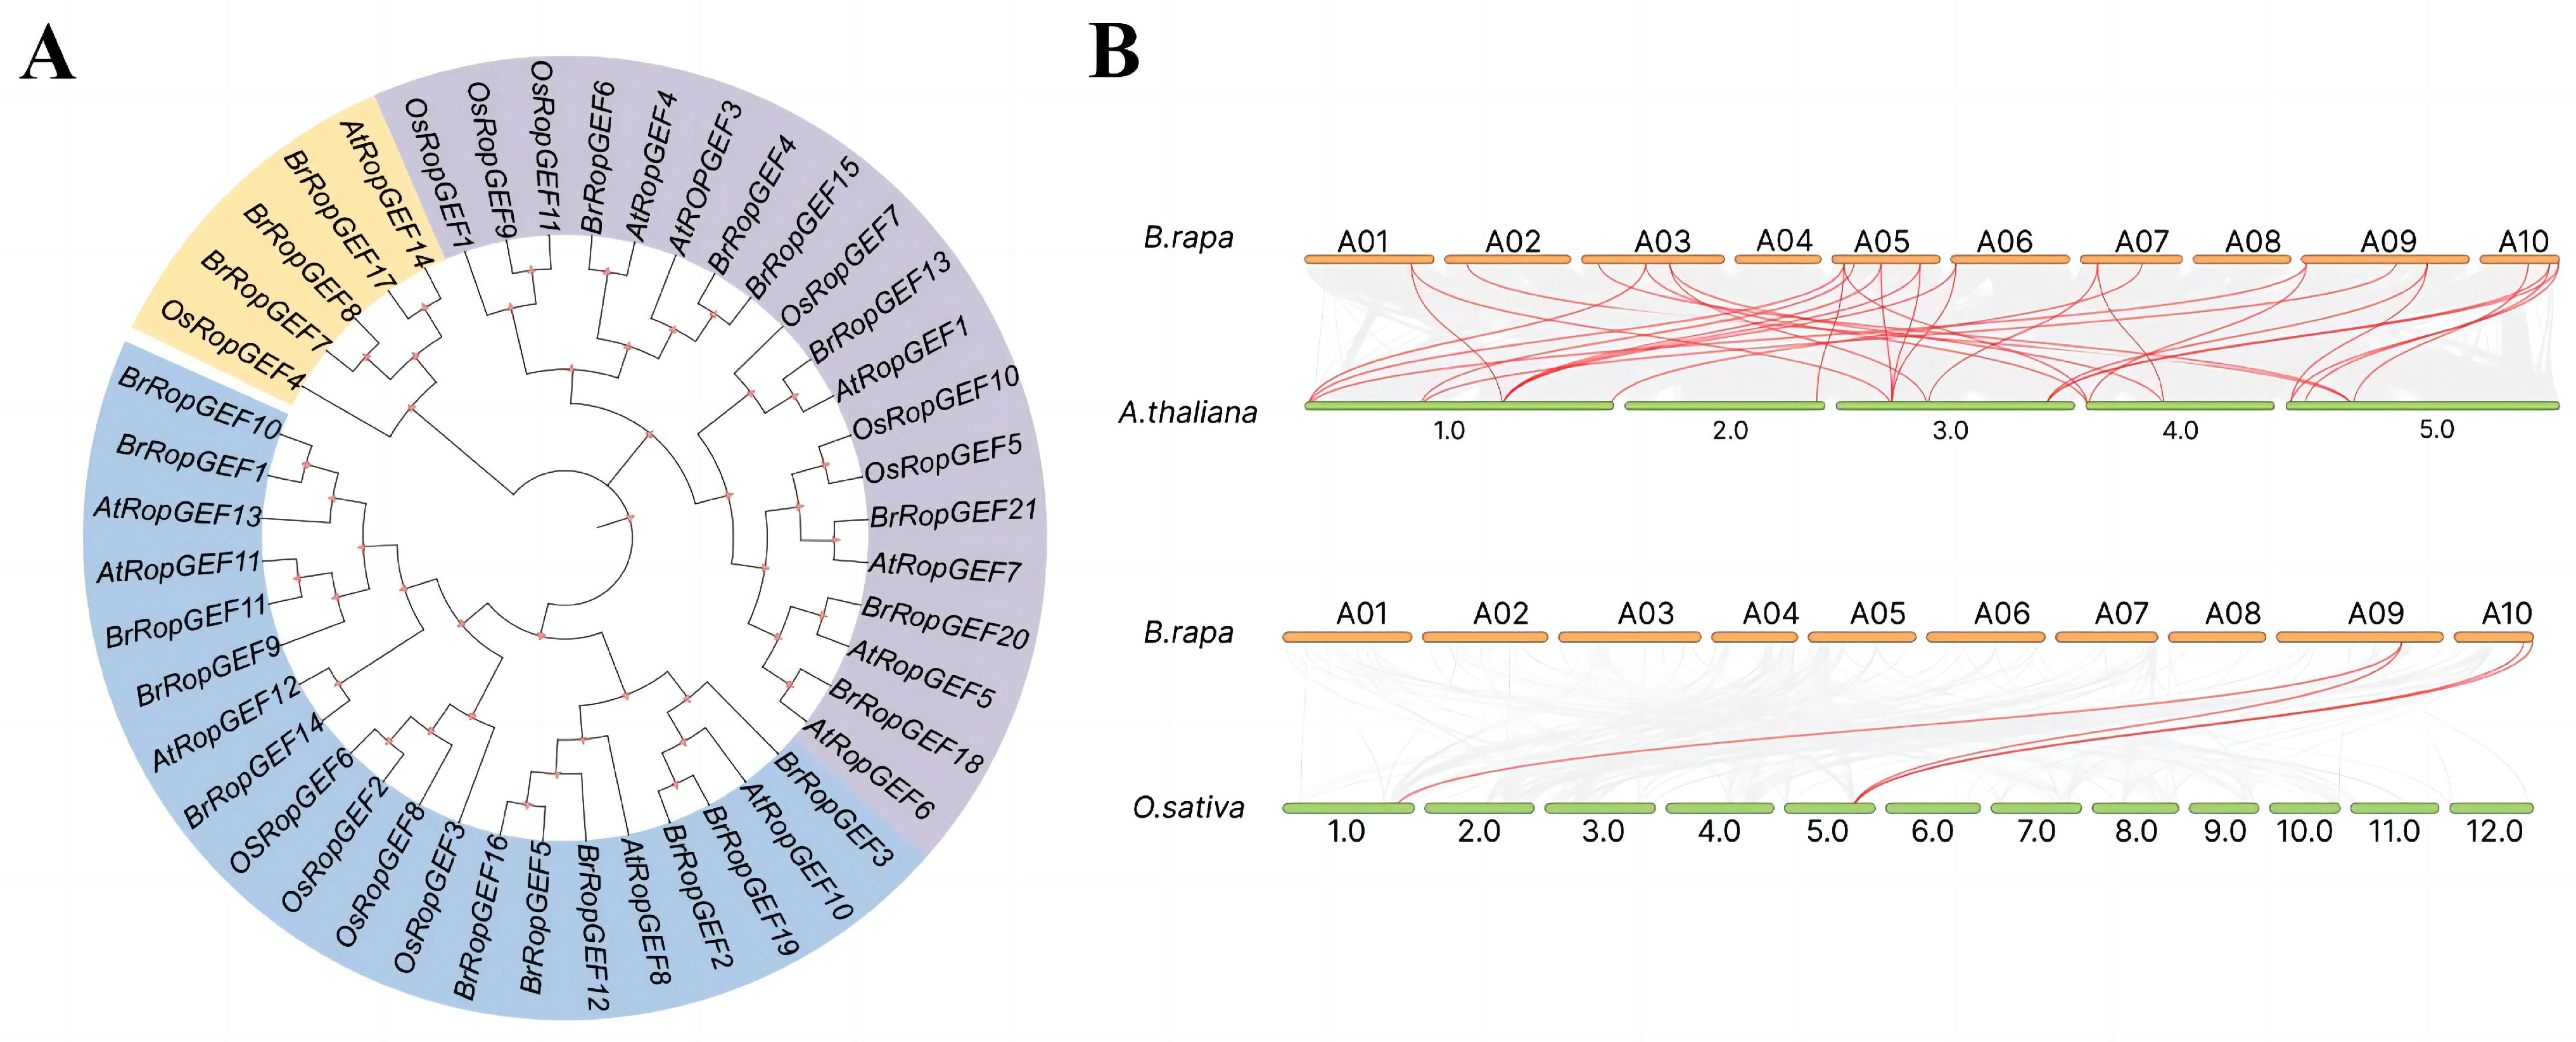
4.2. Chromosome Localization, Multiple Sequence Alignment, and Phylogenetic Analysis

According to the B. rapa genome information available on BRAD (http://www.brassicadb.cn/ (accessed on 14 February 2023)), the chromosomal locations and duplications of BrRopGEF genes were mapped, and the gene density information of each chromosome was obtained using TBtools (v1.120). The chromosomal distribution of genes and gene duplication events were analyzed using the Multiple Collinearity Scan toolkit (One Step MCscanX-Super Fast) in TBtools (v1.120) [42].
AtRopGEFs were retrieved from The Arabidopsis Information Resource (TAIR) database (https://www.arabidopsis.org/ (accessed on 28 February 2023)). Multiple sequence alignment of BrRopGEFs and AtRopGEFs was performed using Clustal X version 2.1. Subsequently, phylogenetic trees were constructed using the maximum likelihood (ML) method in MEGA 11.0 [48]. ML analyses were performed, and statistical support for each node was estimated using bootstrap analysis with 1000 replicates. The phylogenetic tree was generated using Interactive Tree of Life (IToL) v. 4 (https://itol.embl.de/ (accessed on 11 March 2023)), and scale bars represent substitutions of 0.1 [49]. The proteins encoded by AtRopGEFs and OsRopGEFs were used as outgroups. We downloaded protein sequences from the TAIR (https://www.arabidopsis.org/ (accessed on 18 March 2023)) and Phytozome 13 (https://phytozome-next.jgi.doe.gov/ (accessed on 18 March 2023)) databases for Arabidopsis and rice, respectively [50].

4.3. Analysis of CAREs

To identify CAREs, 2000 bp upstream sequences of BrRopGEFs were downloaded from Ensemble Plants and analyzed using PlantCARE (http://bioinformatics.psb.ugent.be/webtools/plantcare/html (accessed on 26 March 2023)) [51]. The most common CAREs were identified using TBtools (v1.120). After determining the number of cis-acting elements on each promoter, the expected cis-acting elements were classified according to their function, and tables were created using Excel 2021.

4.4. Motif Analysis and GO

The MEME program (http://meme-suite.org/tools/meme (accessed on 8 April 2023)) was used for the identification of conserved motifs using the following parameters: number of repetitions, any; maximum number of motifs, 10. The results were displayed using TBtools (v1.120) [52].
The GO is an internationally standardized ontology of terms for describing the functions of genes and gene products in organisms. Our functional enrichment tests of the candidate genes were conducted using the GO analysis online server g:Profiler (https://biit.cs.ut.ee/gprofiler/gost (accessed on 19 April 2023)) [53].

4.5. Expression Profiling of BrRopGEF Genes

RNA-seq data with organ-specific expression (GEO: GSE43245) and gene expression profiles of drought-tolerant and sensitive B. rapa under control and drought stress conditions (GEO: GSE73963) were obtained via transcriptome sequencing of B. rapa (http://brassicadb.cn (accessed on 12 May 2023)). All transcriptome expression data were log2-transformed (Tables S2 and S3). Cluster heatmaps and bar graphs were made to visualize the differential expression of gene family members under control and osmotic stress conditions. The above were mapped using TBtools (v1.120) and Excel 2021 [54,55].

4.6. Total RNA Extraction and RT-qPCR

In the RNA-seq analysis, two-week-old, stable, self-incompatible Chinese cabbage seedlings cultivated in Hoagland nutrient solution (Coolaber, Beijing, China) were subjected to stress conditions. Specifically, they were treated with 15% PEG 6000 and 150 mM NaCl for 12 h to simulate osmotic stress and salt stress, respectively. Untreated two-week-old Chinese cabbage seedlings were used as control samples.
B. rapa with stable self-incompatibility was utilized for the stress treatments. The plump seeds were seeded in MS modified medium (with vitamins, sucrose, and agar) and cultivated in a plant incubator. Seedlings with six leaves and similar growth statuses were selected for the stress treatments. Subsequently, they were subjected to stress conditions through treatment with 15% PEG 6000 and 150 mM NaCl for 2, 4, 6, and 12 h to simulate osmotic stress and salt stress, respectively. A control group of Chinese cabbage seedlings was maintained under normal conditions. Each treatment comprised three biological replicates, and all samples were cryopreserved at −80 °C for subsequent RNA extraction.
Total RNA was extracted using a FastPure® Cell/Tissue Total RNA Isolation Kit V2 (Vazyme Biotech Co., Ltd., Nanjing, China); RT-qPCR was performed using the TransScript Uni All-in-One First-Strand cDNA Synthesis SuperMix (TransGen. AU341-02, Beijing, China). RT-qPCR primer sequences were designed using the qPrimerDB-qPCR primer database (https://biodb.swu.edu.cn/qprimerdb/ (accessed on 31 May 2023)) [56]. RT-qPCR was performed on a qTOWER3 qPCR machine using TransStart® Green qPCR SuperMix (TransGen Biotech, Beijing, China) and BrActin2 as the reference gene; expression levels were determined using the 2−ΔΔCt method. Reactions were performed with three technical replicates, and data were analyzed using Excel 2021. The specific primer sequences are listed in Table S5.

4.7. Analysis of Protein Secondary Structure, Tertiary Structure, and PPI Networks

PRABI was used to analyze the secondary structure of BrRopGEF proteins (https://prabi.ibcp.fr/htm/site/web/app.php/home (accessed on 15 June 2023)), and the results were analyzed using Excel 2021.
The tertiary structure of BrRopGEF proteins was predicted and analyzed using SWISS-MODEL (https://swissmodel.expasy.org/ (accessed on 7 July 2023)), and tertiary structure images of each member were compiled using Adobe Photoshop CC 2023 [57].
For PPI network analysis, the PPI network prediction website (https://cn.string-db.org/ (accessed on 22 July 2023)) was used to obtain B. rapa PPI network maps (minimum interaction score = 0.150; default parameters were used for other parameters) [58].
To examine the BrRopGEF PPI network, we used the STRING online server with default parameters [58]. The PPI network was constructed using Cytoscape v3.9.1 [59].

5. Conclusions

In this study, a total of 21 BrRopGEFs were identified within the B. rapa genome. Sequence analysis, cis-element identification, expression profiling across various organs, assessment of abiotic stress tolerance, and a thorough review of previous studies indicated that BrRopGEF9 could play a key role in regulating salt stress tolerance. Our findings also indicate that BrRopGEF13 plays a key role in the response to osmotic stress and salt stress.

Supplementary Materials

The supporting information can be downloaded at: https://www.mdpi.com/article/10.3390/ijms25063541/s1.

Author Contributions

Y.C. planned the project and designed the experiments; M.Z. and X.W. performed the bioinformatics analysis and experiments with the help of L.C. and X.C.; L.Y. and X.W. analyzed the data and wrote the manuscript. Y.C. revised the manuscript. All authors have read and agreed to the published version of the manuscript.

Funding

This work was supported by National Natural Science Foundation of China (32002045), National Natural Science Foundation of China (32272745).

Institutional Review Board Statement

Not applicable.

Informed Consent Statement

Not applicable.

Data Availability Statement

Data are contained within the article/Supplementary Materials.

Acknowledgments

We are grateful for the support of Shan Dong College Students’ Innovative Entrepreneurial Training Plan Program.

Conflicts of Interest

The authors declare no conflicts of interest.

References

  1. Berken, A.; Thomas, C.; Wittinghofer, A. A new family of RhoGEFs activates the Rop molecular switch in plants. Nature 2005, 436, 1176–1180. [Google Scholar] [CrossRef]
  2. Berken, A.; Wittinghofer, A. Structure and function of Rho-type molecular switches in plants. Plant Physiol. Biochem. 2008, 46, 380–393. [Google Scholar] [CrossRef]
  3. Thomas, C.; Fricke, I.; Scrima, A.; Berken, A.; Wittinghofer, A. Structural Evidence for a Common Intermediate in Small G Protein-GEF Reactions. Mol. Cell 2007, 25, 141–149. [Google Scholar] [CrossRef]
  4. Chang, F.; Gu, Y.; Ma, H.; Yang, Z. AtPRK2 promotes ROP1 activation via RopGEFs in the control of polarized pollen tube growth. Mol. Plant 2013, 6, 1187–1201. [Google Scholar] [CrossRef]
  5. Zhang, Y.; McCormick, S. A distinct mechanism regulating a pollen-specific guanine nucleotide exchange factor for the small GTPase Rop in Arabidopsis thaliana. Proc. Natl. Acad. Sci. USA 2007, 104, 18830–18835. [Google Scholar] [CrossRef]
  6. Shin, D.H.; Kim, T.-L.; Kwon, Y.-K.; Cho, M.-H.; Yoo, J.; Jeon, J.-S.; Hahn, T.-R.; Bhoo, S.H. Characterization of Arabidopsis RopGEF family genes in response to abiotic stresses. Plant Biotechnol. Rep. 2009, 3, 183–190. [Google Scholar] [CrossRef]
  7. Gu, Y.; Li, S.; Lord, E.M.; Yang, Z. Members of a novel class of Arabidopsis Rho guanine nucleotide exchange factors control Rho GTPase-dependent polar growth. Plant Cell 2006, 18, 366–381. [Google Scholar] [CrossRef]
  8. Shin, D.H.; Cho, M.-H.; Kim, T.-L.; Yoo, J.; Kim, J.-I.; Han, Y.-J.; Song, P.-S.; Jeon, J.-S.; Bhoo, S.H.; Hahn, T.-R. A Small GTPase Activator Protein Interacts with Cytoplasmic Phytochromes in Regulating Root Development. J. Biol. Chem. 2010, 285, 32151–32159. [Google Scholar] [CrossRef]
  9. Li, Z.; Liu, D. ROPGEF1 and ROPGEF4 are functional regulators of ROP11 GTPase in ABA-mediated stomatal closure in Arabidopsis. FEBS Lett. 2012, 586, 1253–1258. [Google Scholar] [CrossRef]
  10. Chen, M.; Liu, H.; Kong, J.; Yang, Y.; Zhang, N.; Li, R.; Yue, J.; Huang, J.; Li, C.; Cheung, A.Y.; et al. RopGEF7 regulates PLETHORA-dependent maintenance of the root stem cell niche in Arabidopsis. Plant Cell 2011, 23, 2880–2894. [Google Scholar] [CrossRef]
  11. Liu, Y.; Dong, Q.; Kita, D.; Huang, J.B.; Liu, G.; Wu, X.; Zhu, X.; Cheung, A.Y.; Wu, H.M.; Tao, L.Z. RopGEF1 Plays a Critical Role in Polar Auxin Transport in Early Development. Plant Physiol. 2017, 175, 157–171. [Google Scholar] [CrossRef]
  12. Duan, Q.; Kita, D.; Li, C.; Cheung, A.Y.; Wu, H.-M. FERONIA receptor-like kinase regulates RHO GTPase signaling of root hair development. Proc. Natl. Acad. Sci. USA 2010, 107, 17821–17826. [Google Scholar] [CrossRef]
  13. Yoshida, M.W.; Hakozaki, M.; Goshima, G. Armadillo repeat-containing kinesin represents the versatile plus-end-directed transporter in Physcomitrella. Nat. Plants 2023, 9, 733–748. [Google Scholar] [CrossRef]
  14. Kim, E.J.; Park, S.W.; Hong, W.J.; Silva, J.; Liang, W.; Zhang, D.; Jung, K.H.; Kim, Y.J. Genome-wide analysis of RopGEF gene family to identify genes contributing to pollen tube growth in rice (Oryza sativa). BMC Plant Biol. 2020, 20, 95. [Google Scholar] [CrossRef]
  15. Kim, E.J.; Hong, W.J.; Tun, W.; An, G.; Kim, S.T.; Kim, Y.J.; Jung, K.H. Interaction of OsRopGEF3 Protein With OsRac3 to Regulate Root Hair Elongation and Reactive Oxygen Species Formation in Rice (Oryza sativa). Front. Plant Sci. 2021, 12, 661352. [Google Scholar] [CrossRef]
  16. Ali Shad, M.; Wang, Y.; Zhang, H.; Zhai, S.; Shalmani, A.; Li, Y. Genetic analysis of GEFs and GDIs in rice reveals the roles of OsGEF5, OsGDI1, and OsGEF3 in the regulation of grain size and plant height. Crop J. 2022, 11, 345–360. [Google Scholar] [CrossRef]
  17. Riely, B.K.; He, H.; Venkateshwaran, M.; Sarma, B.; Schraiber, J.; Ane, J.M.; Cook, D.R. Identification of legume RopGEF gene families and characterization of a Medicago truncatula RopGEF mediating polar growth of root hairs. Plant J. 2011, 65, 230–243. [Google Scholar] [CrossRef]
  18. Ruan, J.; Lai, L.; Ou, H.; Yi, P. Two subtypes of GTPase-activating proteins coordinate tip growth and cell size regulation in Physcomitrium patens. Nat. Commun. 2023, 14, 7084. [Google Scholar] [CrossRef]
  19. Salunkhe, D.K.; Kadam, S. Handbook of Vegetable Science and Technology: Production, Compostion, Storage, and Processing; CRC Press: Boca Raton, FL, USA, 1998. [Google Scholar]
  20. Franks, S.J. Plasticity and evolution in drought avoidance and escape in the annual plant Brassica rapa. New Phytol. 2011, 190, 249–257. [Google Scholar] [CrossRef]
  21. Wang, B.; Zhang, H.; Huai, J.; Peng, F.; Wu, J.; Lin, R.; Fang, X. Condensation of SEUSS promotes hyperosmotic stress tolerance in Arabidopsis. Nat. Chem. Biol. 2022, 18, 1361–1369. [Google Scholar] [CrossRef]
  22. Guo, Y.M.; Samans, B.; Chen, S.; Kibret, K.B.; Hatzig, S.; Turner, N.C.; Nelson, M.N.; Cowling, W.A.; Snowdon, R.J. Drought-Tolerant Brassica rapa Shows Rapid Expression of Gene Networks for General Stress Responses and Programmed Cell Death Under Simulated Drought Stress. Plant Mol. Biol. Rep. 2017, 35, 416–430. [Google Scholar] [CrossRef]
  23. Thomas, C.; Fricke, I.; Weyand, M.; Berken, A. 3D structure of a binary ROP-PRONE complex: The final intermediate for a complete set of molecular snapshots of the RopGEF reaction. Biol. Chem. 2009, 390, 427–435. [Google Scholar] [CrossRef]
  24. Liu, C.; Liu, L.; Zhou, C.; Zhuang, J.; Wang, L.; Sun, Y.; Sun, C. Protein-protein interaction networks and different clustering analysis in Burkitt’s lymphoma. Hematology 2018, 23, 391–398. [Google Scholar] [CrossRef] [PubMed]
  25. Bader, G.D.; Hogue, C.W.V. An automated method for finding molecular complexes in large protein interaction networks. BMC Bioinform. 2003, 4, 2. [Google Scholar] [CrossRef] [PubMed]
  26. Wei, H.; Movahedi, A.; Liu, G.; Li, Y.; Liu, S.; Yu, C.; Chen, Y.; Zhong, F.; Zhang, J. Comprehensive Analysis of Carotenoid Cleavage Dioxygenases Gene Family and Its Expression in Response to Abiotic Stress in Poplar. Int. J. Mol. Sci. 2022, 23, 1418. [Google Scholar] [CrossRef]
  27. Alberts, B. The cell as a collection of protein machines: Preparing the next generation of molecular biologists. Cell 1998, 92, 291–294. [Google Scholar] [CrossRef]
  28. Liu, Z.; Li, Y.; Zhu, J.; Ma, W.; Li, Z.; Bi, Z.; Sun, C.; Bai, J.; Zhang, J.; Liu, Y. Genome-Wide Identification and Analysis of the NF-Y Gene Family in Potato (Solanum tuberosum L.). Front. Genet. 2021, 12, 739989. [Google Scholar] [CrossRef]
  29. Li, F.; Guo, X.; Liu, J.; Zhou, F.; Liu, W.; Wu, J.; Zhang, H.; Cao, H.; Su, H.; Wen, R. Genome-Wide Identification, Characterization, and Expression Analysis of the NAC Transcription Factor in Chenopodium quinoa. Genes 2019, 10, 500. [Google Scholar] [CrossRef]
  30. Li, Z.; Waadt, R.; Schroeder, J.I. Release of GTP Exchange Factor Mediated Down-Regulation of Abscisic Acid Signal Transduction through ABA-Induced Rapid Degradation of RopGEFs. PLoS Biol. 2016, 14, e1002461. [Google Scholar] [CrossRef]
  31. Shohat, H.; Cheriker, H.; Kilambi, H.V.; Illouz Eliaz, N.; Blum, S.; Amsellem, Z.; Tarkowská, D.; Aharoni, A.; Eshed, Y.; Weiss, D. Inhibition of gibberellin accumulation by water deficiency promotes fast and long-term ‘drought avoidance’ responses in tomato. New Phytol. 2021, 232, 1985–1998. [Google Scholar] [CrossRef]
  32. Rehman, A.; Azhar, M.T.; Hinze, L.; Qayyum, A.; Li, H.; Peng, Z.; Qin, G.; Jia, Y.; Pan, Z.; He, S.; et al. Insight into abscisic acid perception and signaling to increase plant tolerance to abiotic stress. J. Plant Interact. 2021, 16, 222–237. [Google Scholar] [CrossRef]
  33. Li, Z.; Takahashi, Y.; Scavo, A.; Brandt, B.; Nguyen, D.; Rieu, P.; Schroeder, J.I. Abscisic acid-induced degradation of Arabidopsis guanine nucleotide exchange factor requires calcium-dependent protein kinases. Proc. Natl. Acad. Sci. USA 2018, 115, E4522–E4531. [Google Scholar] [CrossRef] [PubMed]
  34. Li, Z.; Li, Z.; Gao, X.; Chinnusamy, V.; Bressan, R.; Wang, Z.X.; Zhu, J.K.; Wu, J.W.; Liu, D. ROP11 GTPase negatively regulates ABA signaling by protecting ABI1 phosphatase activity from inhibition by the ABA receptor RCAR1/PYL9 in Arabidopsis. J. Integr. Plant Biol. 2012, 54, 180–188. [Google Scholar] [CrossRef]
  35. Yu, F.; Qian, L.; Nibau, C.; Duan, Q.; Kita, D.; Levasseur, K.; Li, X.; Lu, C.; Li, H.; Hou, C.; et al. FERONIA receptor kinase pathway suppresses abscisic acid signaling in Arabidopsis by activating ABI2 phosphatase. Proc. Natl. Acad. Sci. USA 2012, 109, 14693–14698. [Google Scholar] [CrossRef] [PubMed]
  36. Zheng, Z.L.; Nafisi, M.; Tam, A.; Li, H.; Crowell, D.N.; Chary, S.N.; Schroeder, J.I.; Shen, J.; Yang, Z. Plasma membrane-associated ROP10 small GTPase is a specific negative regulator of abscisic acid responses in Arabidopsis. Plant Cell 2002, 14, 2787–2797. [Google Scholar] [CrossRef]
  37. Lim, C.W.; Baek, W.; Jung, J.; Kim, J.H.; Lee, S.C. Function of ABA in Stomatal Defense against Biotic and Drought Stresses. Int. J. Mol. Sci. 2015, 16, 15251–15270. [Google Scholar] [CrossRef]
  38. Okuma, E.; Nozawa, R.; Murata, Y.; Miura, K. Accumulation of endogenous salicylic acid confers drought tolerance to Arabidopsis. Plant Signal. Behav. 2014, 9, e28085. [Google Scholar] [CrossRef]
  39. Shi, H.; Chen, L.; Ye, T.; Liu, X.; Ding, K.; Chan, Z. Modulation of auxin content in Arabidopsis confers improved drought stress resistance. Plant Physiol. Biochem. 2014, 82, 209–217. [Google Scholar] [CrossRef]
  40. Creelman, R.A.; Mullet, J.E. Jasmonic acid distribution and action in plants: Regulation during development and response to biotic and abiotic stress. Proc. Natl. Acad. Sci. USA 1995, 92, 4114–4119. [Google Scholar] [CrossRef]
  41. Javid, M.G.; Sorooshzadeh, A.; Moradi, F.; Sanavy, S.A.M.M.; Allahdadi, I. The Role of Phytohormones in Alleviating Salt Stress in Crop Plants. Aust. J. Crop Sci. 2011, 5, 726–734. [Google Scholar]
  42. Chen, H.; Wang, T.; He, X.; Cai, X.; Lin, R.; Liang, J.; Wu, J.; King, G.; Wang, X. BRAD V3.0: An upgraded Brassicaceae database. Nucleic Acids Res. 2022, 50, D1432–D1441. [Google Scholar] [CrossRef]
  43. Marchler-Bauer, A.; Derbyshire, M.K.; Gonzales, N.R.; Lu, S.; Chitsaz, F.; Geer, L.Y.; Geer, R.C.; He, J.; Gwadz, M.; Hurwitz, D.I.; et al. CDD: NCBI’s conserved domain database. Nucleic Acids Res. 2015, 43, D222–D226. [Google Scholar] [CrossRef]
  44. El-Gebali, S.; Mistry, J.; Bateman, A.; Eddy, S.R.; Luciani, A.; Potter, S.C.; Qureshi, M.; Richardson, L.J.; Salazar, G.A.; Smart, A.; et al. The Pfam protein families database in 2019. Nucleic Acids Res. 2019, 47, D427–D432. [Google Scholar] [CrossRef]
  45. Gasteiger, E.; Gattiker, A.; Hoogland, C.; Ivanyi, I.; Appel, R.D.; Bairoch, A. ExPASy: The proteomics server for in-depth protein knowledge and analysis. Nucleic Acids Res. 2003, 31, 3784–3788. [Google Scholar] [CrossRef]
  46. Waterhouse, A.; Bertoni, M.; Bienert, S.; Studer, G.; Tauriello, G.; Gumienny, R.; Heer, F.T.; de Beer, T.A.P.; Rempfer, C.; Bordoli, L.; et al. SWISS-MODEL: Homology modelling of protein structures and complexes. Nucleic Acids Res. 2018, 46, W296–W303. [Google Scholar] [CrossRef]
  47. Horton, P.; Park, K.J.; Obayashi, T.; Fujita, N.; Harada, H.; Adams-Collier, C.J.; Nakai, K. WoLF PSORT: Protein localization predictor. Nucleic Acids Res. 2007, 35, W585–W587. [Google Scholar] [CrossRef]
  48. Tamura, K.; Stecher, G.; Kumar, S. MEGA11: Molecular Evolutionary Genetics Analysis Version 11. Mol. Biol. Evol. 2021, 38, 3022–3027. [Google Scholar] [CrossRef] [PubMed]
  49. Letunic, I.; Bork, P. Interactive Tree of Life (iTOL) v5: An online tool for phylogenetic tree display and annotation. Nucleic Acids Res. 2021, 49, W293–W296. [Google Scholar] [CrossRef] [PubMed]
  50. Goodstein, D.M.; Shu, S.; Howson, R.; Neupane, R.; Hayes, R.D.; Fazo, J.; Mitros, T.; Dirks, W.; Hellsten, U.; Putnam, N.; et al. Phytozome: A comparative platform for green plant genomics. Nucleic Acids Res. 2011, 40, D1178–D1186. [Google Scholar] [CrossRef] [PubMed]
  51. Lescot, M.; Déhais, P.; Thijs, G.; Marchal, K.; Moreau, Y.; Van de Peer, Y.; Rouzé, P.; Rombauts, S. PlantCARE, a database of plant cis-acting regulatory elements and a portal to tools for in silico analysis of promoter sequences. Nucleic Acids Res. 2002, 30, 325–327. [Google Scholar] [CrossRef] [PubMed]
  52. Bailey, T.L.; Johnson, J.; Grant, C.E.; Noble, W.S. The MEME Suite. Nucleic Acids Res. 2015, 43, W39–W49. [Google Scholar] [CrossRef]
  53. Raudvere, U.; Kolberg, L.; Kuzmin, I.; Arak, T.; Adler, P.; Peterson, H.; Vilo, J. g:Profiler: A web server for functional enrichment analysis and conversions of gene lists (2019 update). Nucleic Acids Res. 2019, 47, W191–W198. [Google Scholar] [CrossRef]
  54. Barrett, T.; Edgar, R. [19] Gene Expression Omnibus: Microarray Data Storage, Submission, Retrieval, and Analysis. In Methods in Enzymology; Academic Press: Cambridge, MA, USA, 2006; Volume 411, pp. 352–369. [Google Scholar]
  55. Tong, C.; Wang, X.; Yu, J.; Wu, J.; Li, W.; Huang, J.; Dong, C.; Hua, W.; Liu, S. Comprehensive analysis of RNA-seq data reveals the complexity of the transcriptome in Brassica rapa. BMC Genom. 2013, 14, 689. [Google Scholar] [CrossRef]
  56. Lu, K.; Li, T.; He, J.; Chang, W.; Zhang, R.; Liu, M.; Yu, M.; Fan, Y.; Ma, J.; Sun, W.; et al. qPrimerDB: A thermodynamics-based gene-specific qPCR primer database for 147 organisms. Nucleic Acids Res. 2017, 46, D1229–D1236. [Google Scholar] [CrossRef]
  57. Biasini, M.; Bienert, S.; Waterhouse, A.; Arnold, K.; Studer, G.; Schmidt, T.; Kiefer, F.; Cassarino, T.G.; Bertoni, M.; Bordoli, L.; et al. SWISS-MODEL: Modelling protein tertiary and quaternary structure using evolutionary information. Nucleic Acids Res. 2014, 42, W252–W258. [Google Scholar] [CrossRef]
  58. Szklarczyk, D.; Gable, A.L.; Nastou, K.C.; Lyon, D.; Kirsch, R.; Pyysalo, S.; Doncheva, N.T.; Legeay, M.; Fang, T.; Bork, P.; et al. The STRING database in 2021: Customizable protein-protein networks, and functional characterization of user-uploaded gene/measurement sets. Nucleic Acids Res. 2021, 49, D605–D612. [Google Scholar] [CrossRef]
  59. Shannon, P.; Markiel, A.; Ozier, O.; Baliga, N.S.; Wang, J.T.; Ramage, D.; Amin, N.; Schwikowski, B.; Ideker, T. Cytoscape: A software environment for integrated models of biomolecular interaction networks. Genome Res. 2003, 13, 2498–2504. [Google Scholar] [CrossRef] [PubMed]
Figure 1. Localization and replication of BrRopGEFs on chromosomes in B. rapa. The outermost blocks, colored yellow, represent the 10 chromosomes of B. rapa. The middle and inner regions show the density of each chromosome in the line and heatmap formats. The colored lines in the middle indicate the collinearity relationships among BrRopGEFs within B. rapa.
Ijms 25 03541 g001
Figure 2. Phylogenetic relationships and synteny analysis of RopGEF genes in B. rapa, A. thaliana, and O. sativa. (A) Analysis of the phylogenetic relationships among RopGEFs of B. rapa, A. thaliana, and O. sativa. Group I is denoted by purple characters, and Group II is represented by blue characters. Yellow characters indicate Group III. (B) Analyses of gene expression patterns between B. rapa and other plants (A. thaliana and O. sativa). Red lines indicate homologous gene pairs.
Ijms 25 03541 g002
Figure 3. Analysis of cis-elements in promoters of BrRopGEFs. Different shades of green indicate the presence of cis-elements involved in different biological processes, and the number in each cell indicates the number of cis-acting elements in each gene. White cells indicate the absence of the cis-acting element. Different shades of green on both sides of the square correspond to distinct biological processes.
Ijms 25 03541 g003
Figure 4. Motifs and gene structures. (A) Structures of BrRopGEF genes and conserved structural domains. Green boxes indicate exons, and a MEME analysis identified the conserved domain of RopGEF in B. rapa. (B) Each color indicates a specific domain. (C) The conserved motifs of RopGEFs in B. rapa. The integral height of each stack indicates the level of conservation at this site, and the amino acid frequency is indicated by the size of each letter.
Ijms 25 03541 g004
Figure 5. GO annotation of BrRopGEFs. The GO terms were derived from three categories: “BP” (biological process), “CC” (cellular component), and “MF” (molecular function). The x-axis denotes the −logPvalue, and the y-axis shows the corresponding GO terms. The size and color of the bars indicate the number of genes associated with each specific GO term.
Ijms 25 03541 g005
Figure 6. Heatmap showing the expression patterns of BrRopGEFs in different organs of B. rapa. Cells indicate the log2-transformed expression levels of genes in different organs, with darker shades of red indicating higher expression levels and bluer shades indicating lower expression levels.
Ijms 25 03541 g006
Figure 7. Transcriptome analysis reveals osmotic stress-induced changes in the expression of BrRopGEFs. (A) Analysis of changes in the expression of BrRopGEFs under osmotic stress. The PEG treatment for drought-tolerant and drought-sensitive plants is denoted by DT-PEG and DS-PEG, respectively. (B) Expression of BrRopGEFs in B. rapa under PEG-6000 treatment for 0 h and 6 h as determined by RNA-seq. (C) Expression of BrRopGEFs according to RT-qPCR analysis. Asterisks above the bars indicate the presence of significant differences (two-tailed t-test * p < 0.05, ** p < 0.01), respectively.
Ijms 25 03541 g007
Figure 8. Analysis of the expression levels of RopGEFs in B. rapa under salt stress. (A) Heatmap of BrRopGEFs under salt stress. (B) Expression of BrRopGEFs inferred by RT-qPCR analysis. Asterisks above the bars indicate the presence of significant differences (two-tailed t-test * p < 0.05, ** p < 0.01), respectively.
Ijms 25 03541 g008
Figure 9. Analysis of the secondary and tertiary structures of ROPGEFs in B. rapa. (A) Secondary structure prediction. (B) Physicochemical predictions of the tertiary structure of ROPGEF1 in A. thaliana, which has a three-dimensional butterfly shape. Each protomer consisted of two subdomains: SD1 and SD2. Lines of different colors and shapes represent the various secondary structure of the protein in different places. (C) Prediction of tertiary structures. Different subunits are shown in different colors.
Ijms 25 03541 g009
Figure 10. Predictive PPI interaction network for ROPGEFs in A. thaliana. (A) Predictive analysis of ROPGEF interaction networks in A. thaliana. (B) Predictive analysis of the ROPGEF1 in A. thaliana. (C) Predictive analysis of the interaction network of ROPGEF11 in A. thaliana. The minimum engagement score requirement is 0.150; default settings were used for other parameters. Network nodes represent proteins, and edges represent protein–protein associations. The circle size indicates the degree value of the node, and the larger the circle, the higher the degree value.
Ijms 25 03541 g010
Table 1. Physicochemical properties of the proteins encoded by BrRopGEF genes.
Gene NameGene IDChromosomepIMW (Da)Protein Length (aa)Subcellular LocationA. thaliana IDA. thaliana Name
BrRopGEF1Bra021162A01:23638077-236396635.8249,216.11434nucleusAT3G16130AtRopGEF13
BrRopGEF2Bra020048A02:4812438-48152055.56565,501494nucleusAT5G19560AtRopGEF10
BrRopGEF3Bra006510A03:3845994-38484627.7556,166.59488nucleus
cytosol
AT5G19560AtRopGEF10
BrRopGEF4Bra000971A03:14185129-141869994.9853,899.85478nucleusAT4G00460AtRopGEF3
BrRopGEF5Bra013249A03:19623928-196272235.6658,016.66518nucleusAT3G24620AtRopGEF8
BrRopGEF6Bra004945A05:2591812-25946234.9551,723.86460nucleusAT2G45890AtRopGEF4
BrRopGEF7Bra005322A05:4825068-48269406.0644,107.32391nucleusAT1G31650AtRopGEF14
BrRopGEF8Bra005323A05:4825068-48269436.656,592.05501nucleusAT1G31650AtRopGEF14
BrRopGEF9Bra030396A05:10855878-108578825.6160,575.65536nucleusAT1G52240AtRopGEF11
BrRopGEF10Bra027189A05:19599734-196018585.6860,452.88530nucleusAT3G16130AtRopGEF13
BrRopGEF11Bra018956A06:1021072-10230775.6460,598.73536nucleusAT1G52240AtRopGEF11
BrRopGEF12Bra015068A07:3804713-38070505.6558,233.8521nucleusAT3G24620AtRopGEF8
BrRopGEF13Bra015010A07:4301480-43034305.8460,516.64547nucleusAT4G38430AtRopGEF1
BrRopGEF14Bra003536A07:13678585-136810925.557,786.29513nucleus
cytosol
AT1G79860AtRopGEF12
BrRopGEF15Bra037342A09:971667-9735695.0353,733.8477nucleus
cytosol
AT4G00460AtRopGEF3
BrRopGEF16Bra036671A09:5723788-57258815.8656,589.91505chloroplastAT3G24620AtRopGEF8
BrRopGEF17Bra023198A09:20826415-208337846.41106,720.03941cytosolAT1G31650AtRopGEF14
BrRopGEF18Bra007183A09:27809243-278120828.8663,303.85571cytosolAT3G55660AtRopGEF6
BrRopGEF19Bra002246A10:10684361-106869616.6559,090.48517chloroplastAT5G19560AtRopGEF10
BrRopGEF20Bra009152A10:15438568-154409239.1266,383.94595nucleusAT5G05940AtRopGEF5
BrRopGEF21Bra009621A10:17469516-174717495.6163,438.88521nucleusAT5G02010AtRopGEF7
Table 2. Information on motifs of RopGEFs in B. rapa.
MotifMotif Consensus
Motif1EMMKERFAKLLLGEDMSGGGKGVCSALALSNAITNLAASVFGEQWRLZPL
Motif2FPGJPQSSLDISKIQYNKDVGKAILESYSRVLESLAYTILSRIEDVLYAD
Motif3QKDSVNQVLKAAMAINAQVLSEMEIPESYJDSLPKNGKASLGDSIYKMJT
Motif4QQTNKBGTSTEIMTTRQRSDLLMNJPALRKLDSMLJDTLDS
Motif5EMFDPDQFLSSLDLSSEHKALDLKNRIEASIVIWKRKMVZK
Motif6QRNDEKWWLPVVKVPPNGLSEESRKFLQS
Motif7RWRREMDWLLSVTDHIVEFVP
Motif8SPWGSAVSLEKRELFEERAETJLVLLKQR
Motif9KDQTEFWYVERDSEE
Motif10PTKSPRVTPKKLSYLEKLENMRSPTARH
Disclaimer/Publisher’s Note: The statements, opinions and data contained in all publications are solely those of the individual author(s) and contributor(s) and not of MDPI and/or the editor(s). MDPI and/or the editor(s) disclaim responsibility for any injury to people or property resulting from any ideas, methods, instructions or products referred to in the content.

