
Identification of bZIP Transcription Factors That Regulate the Development of Leaf Epidermal Cells in Arabidopsis thaliana by Single-Cell RNA Sequencing


 ,
,  ,
,  and
and 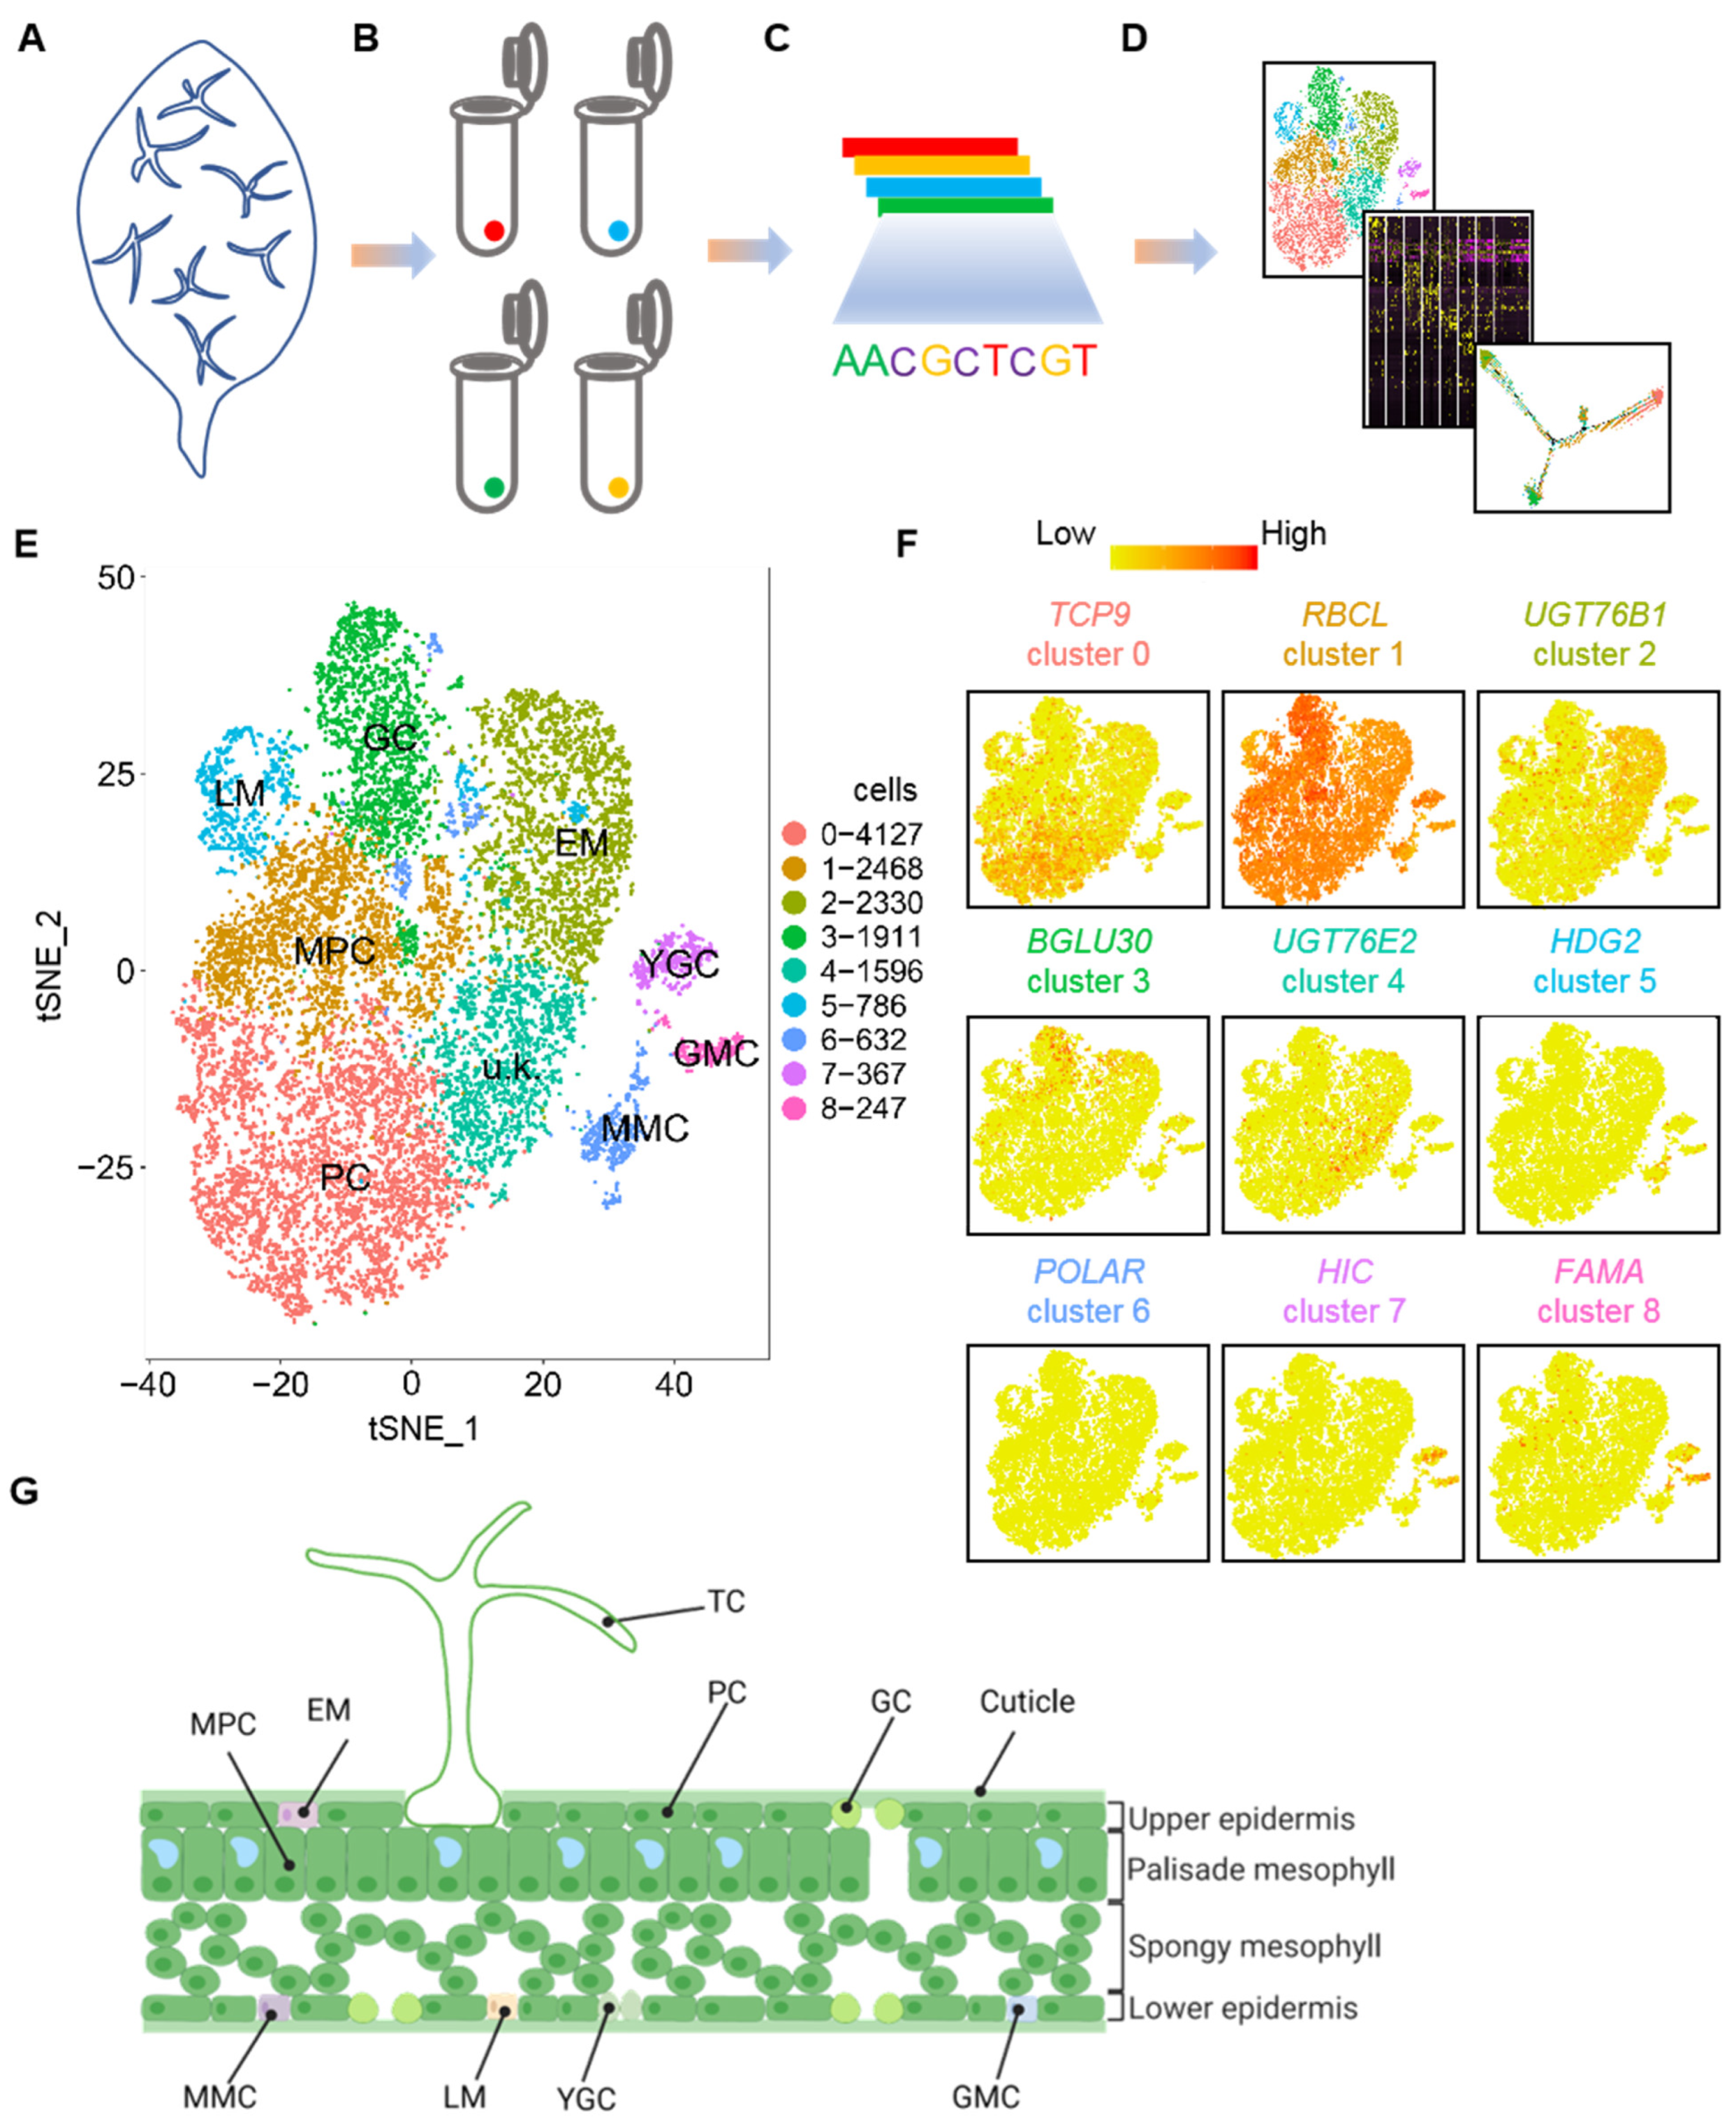
Abstract
1. Introduction
2. Results
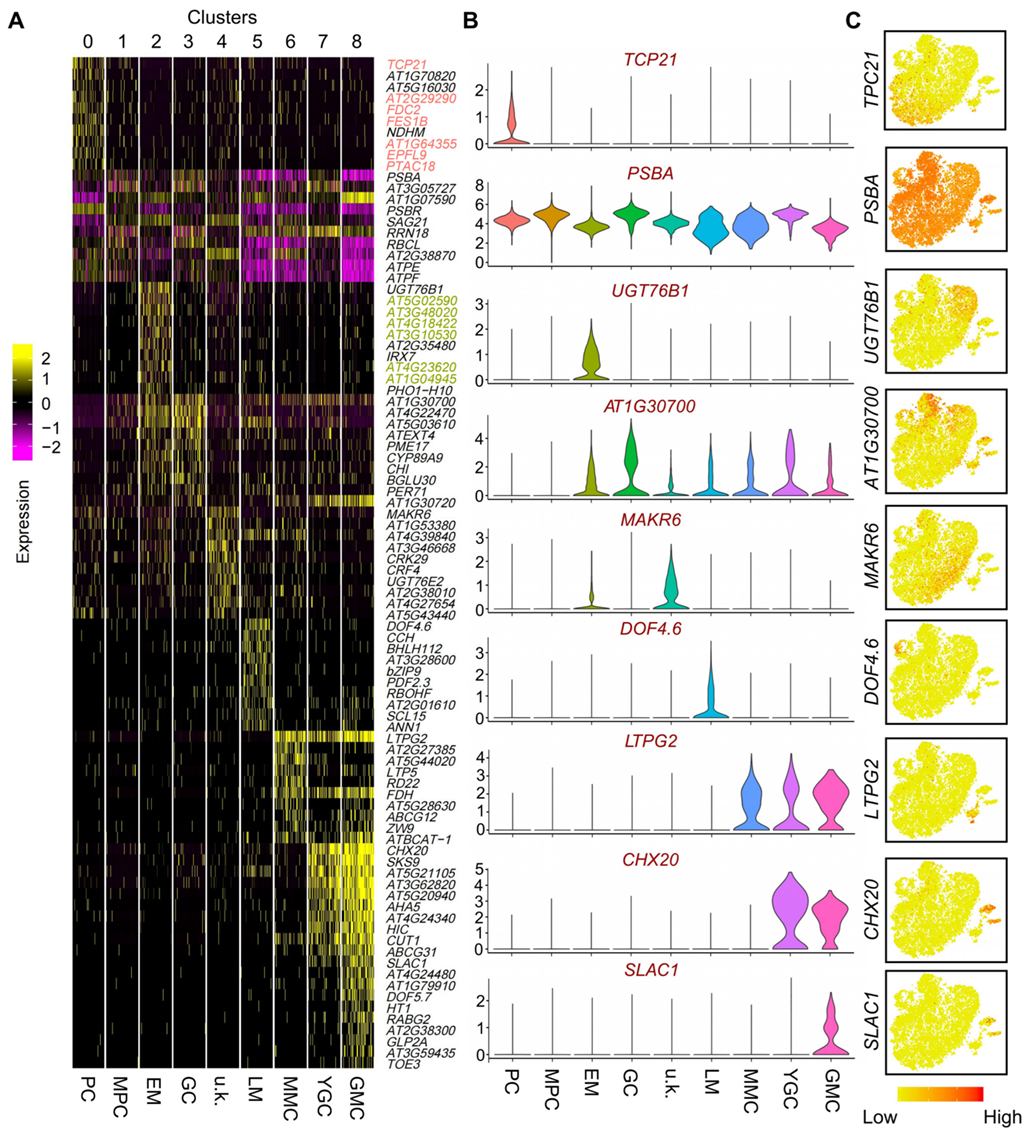
2.1. Single-Cell Transcriptional Profiling of Leaf Epidermal Cells Unravels Different Cell Types and Gene Expression Signatures
2.2. Selection and Characterization of Newly Identified Cell-Type-Specific Expressed Genes in PCs and EM Cells
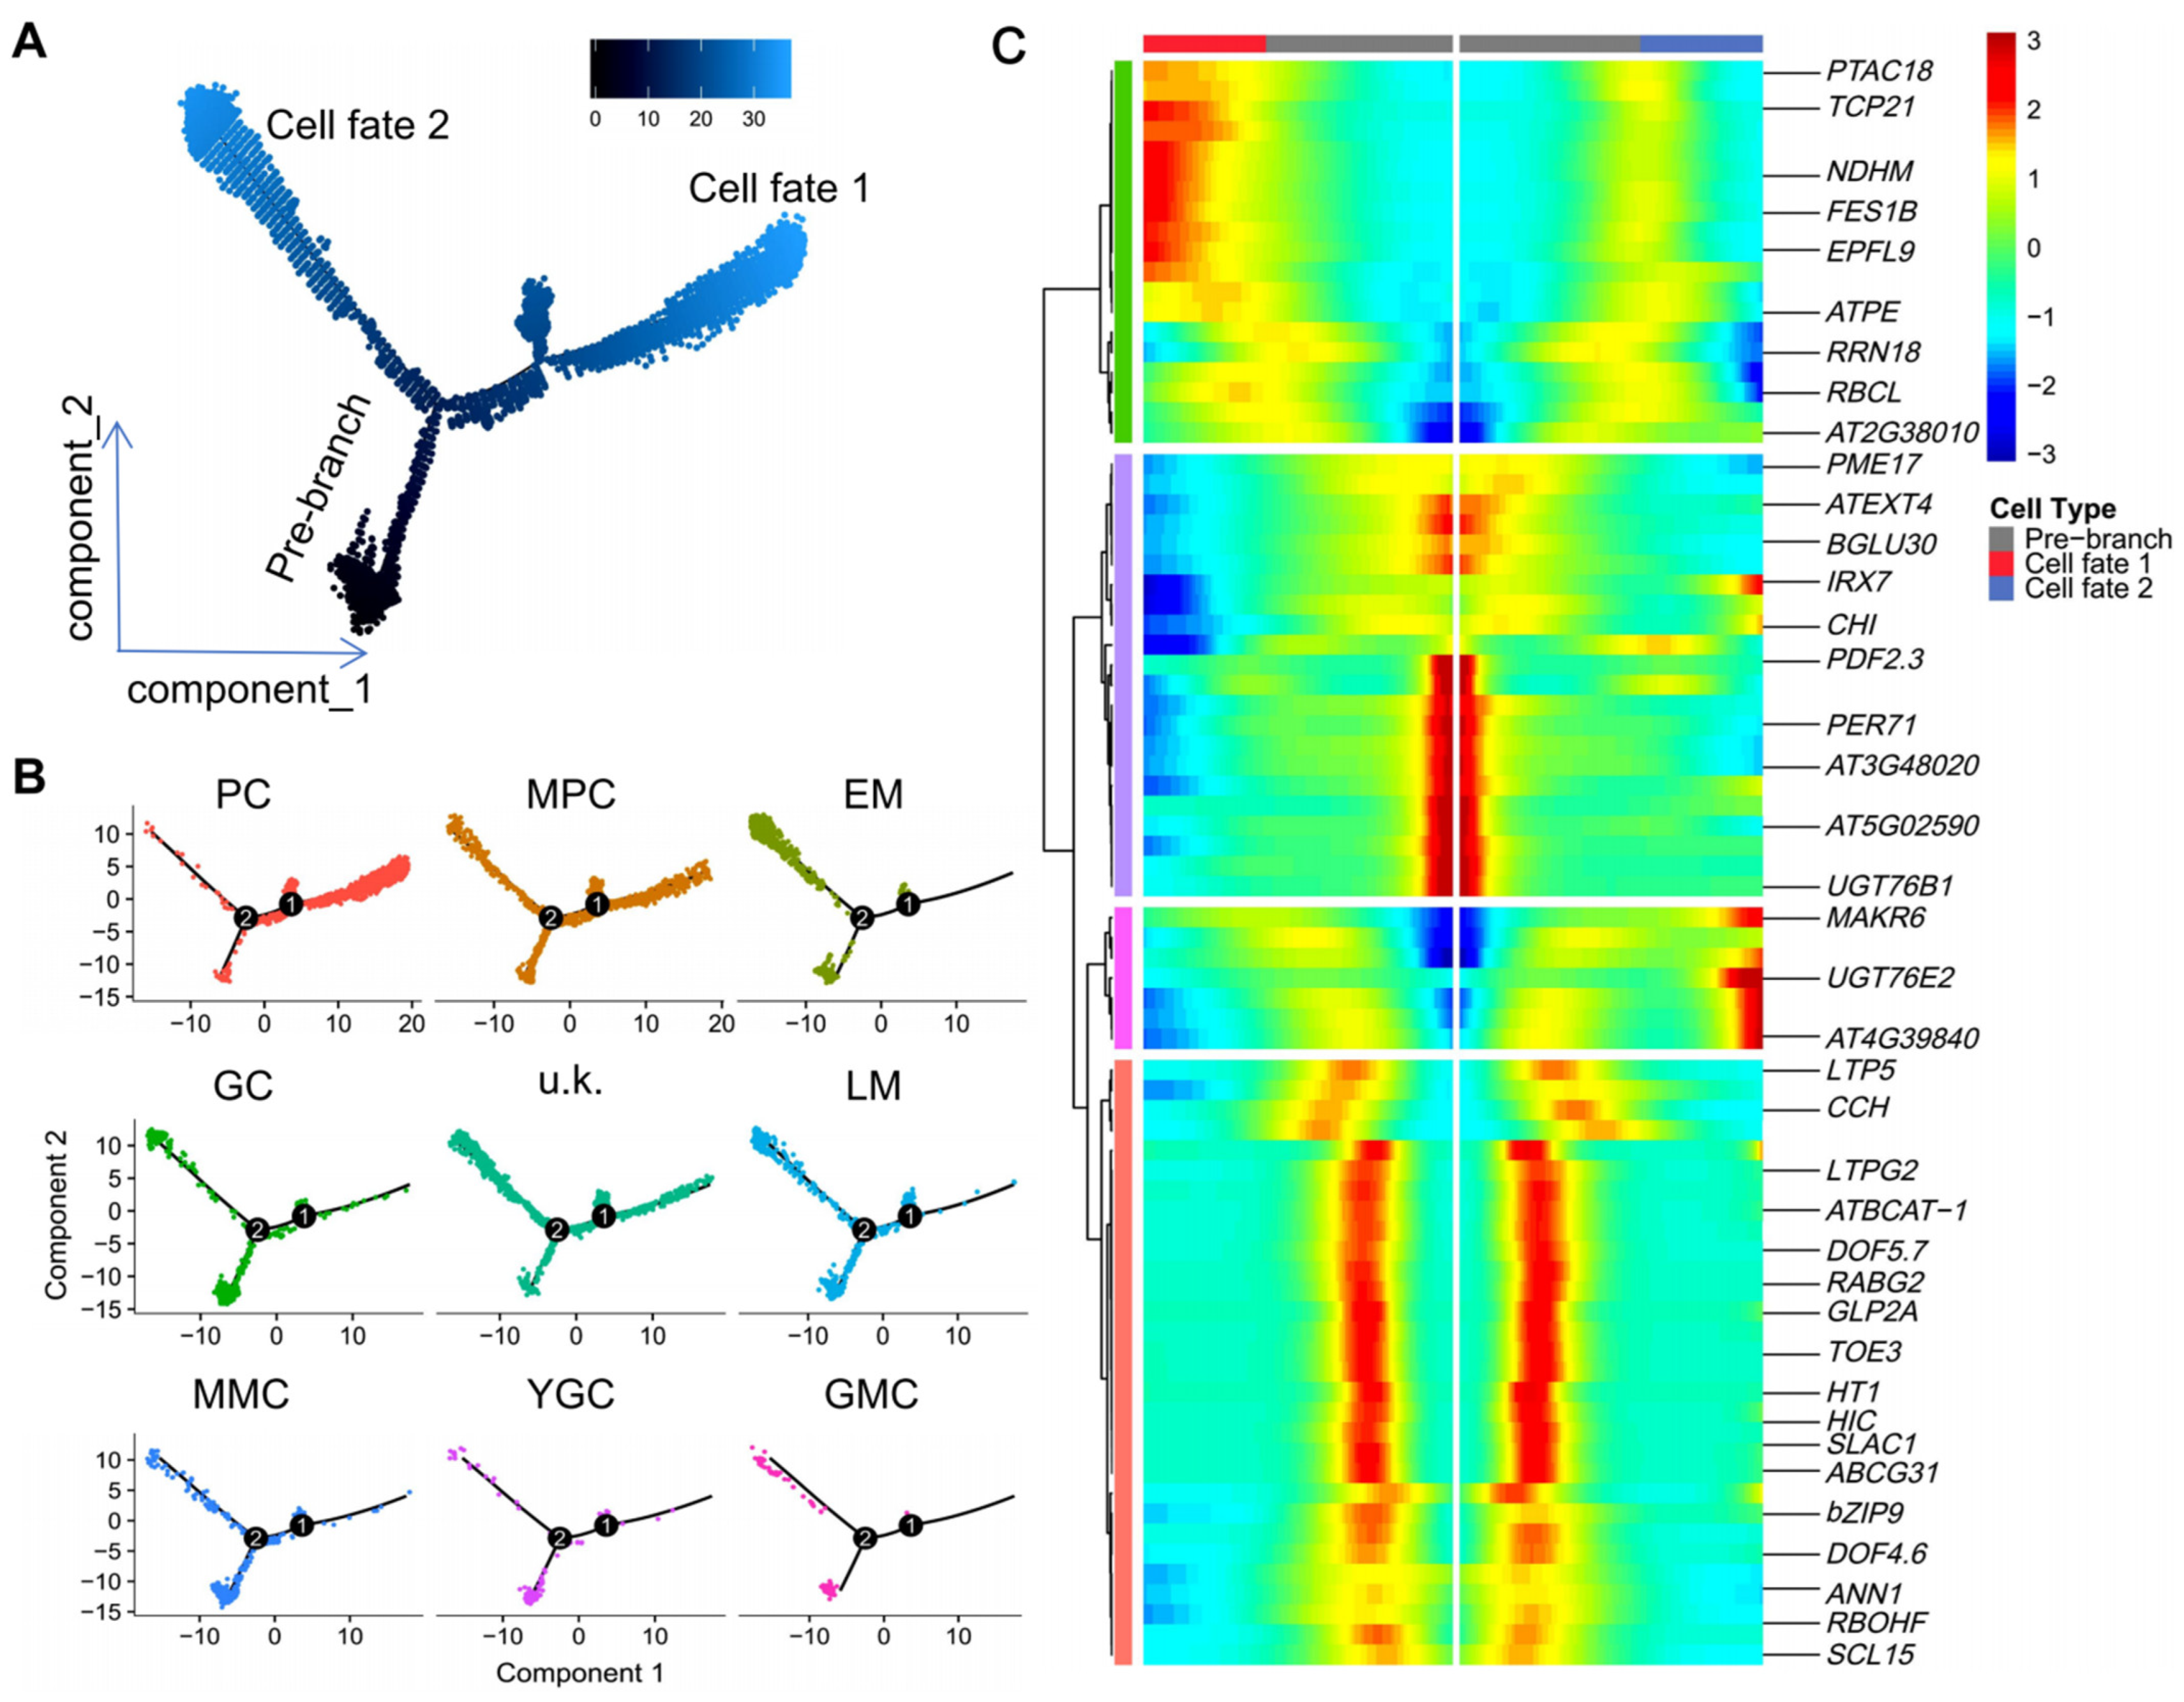
2.3. Pseudo-Time Trajectory Analysis of the Spatiotemporal Dynamics of Epidermal Cell Differentiation
2.4. Analysis of the Effects of JA on the Development of TCs and PCs
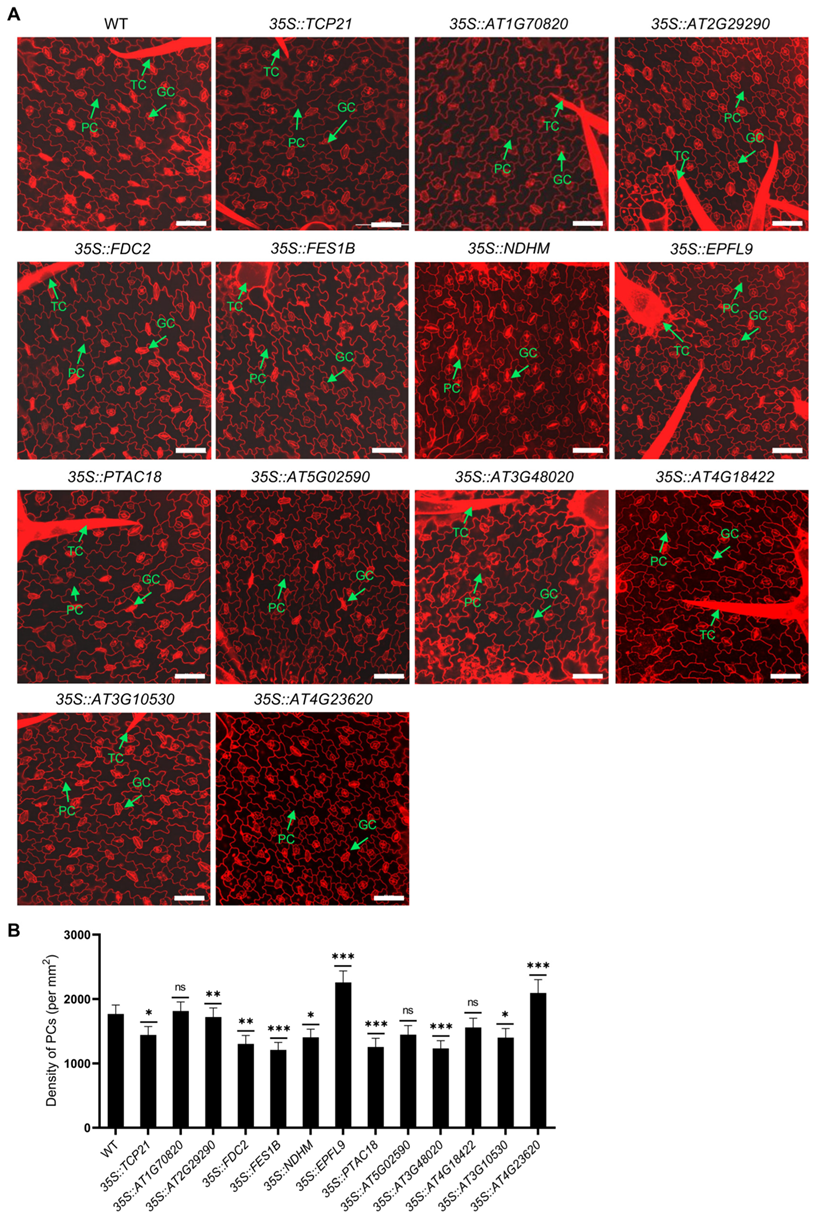
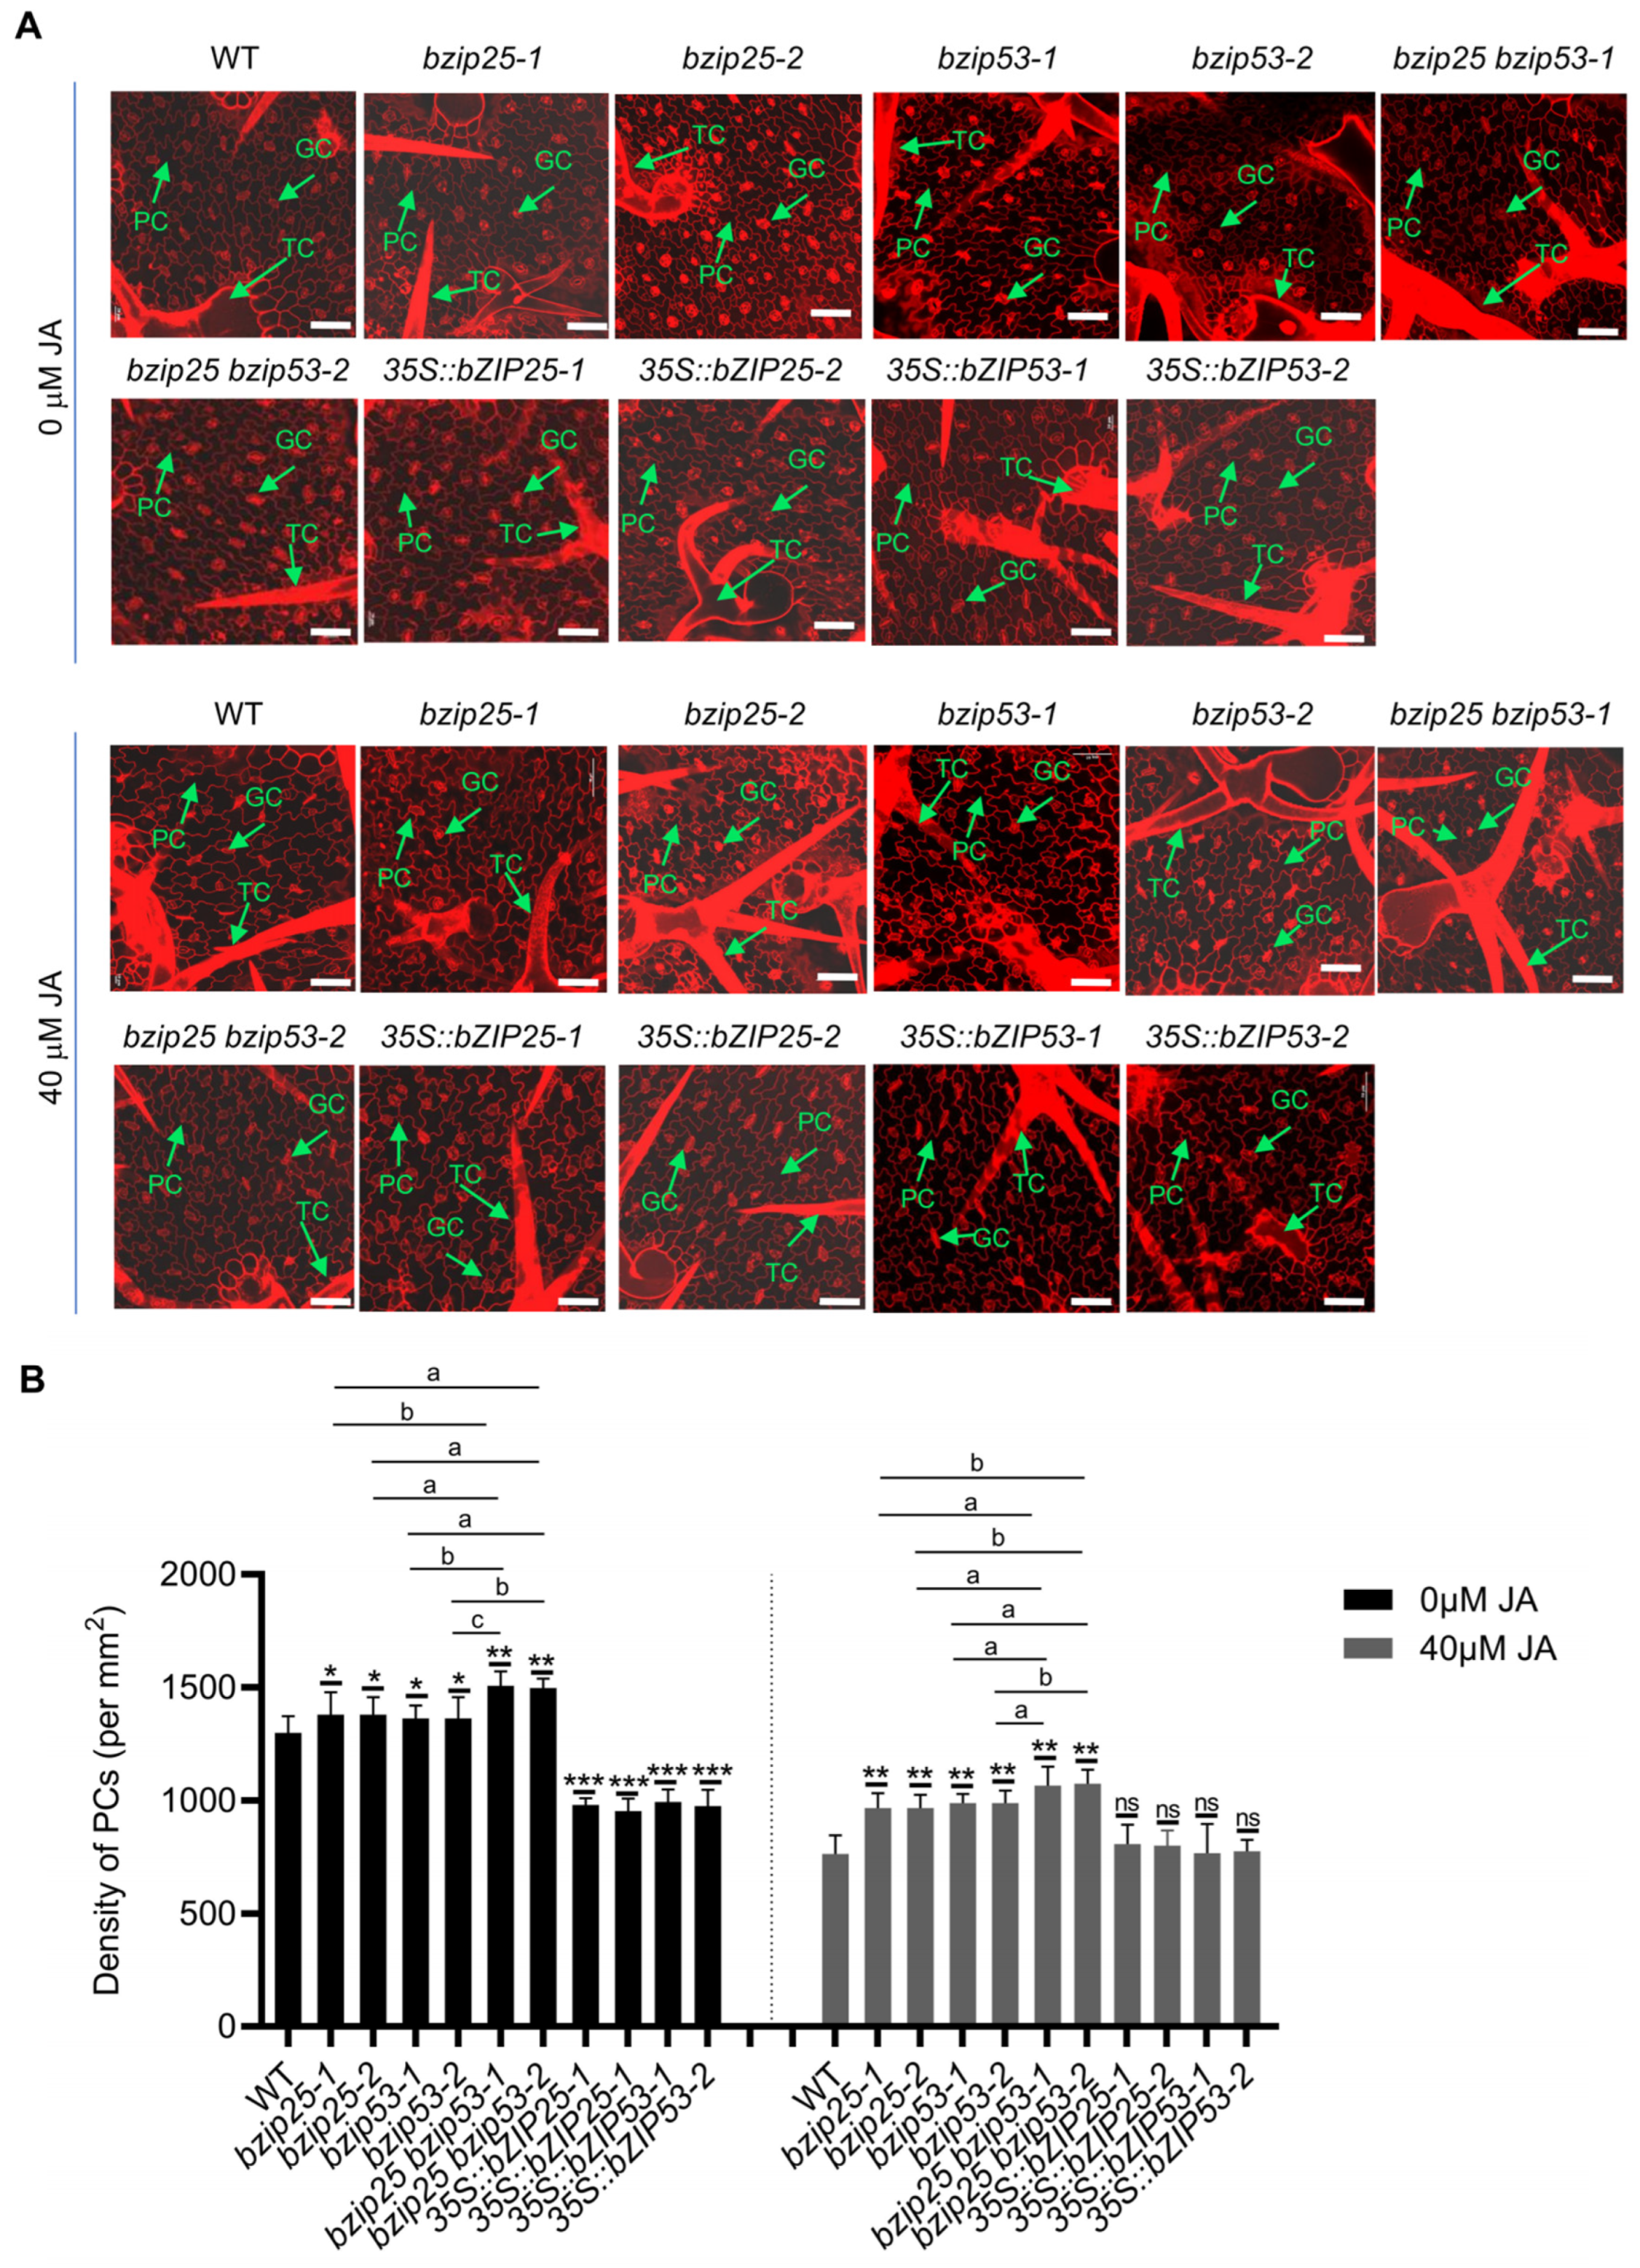
2.5. bZIP TFs Are Involved in Regulating the Fate and Differentiation of PCs and TCs
3. Discussion
4. Materials and Methods
4.1. Screening and Verification of Mutants
4.2. Constructs for Plant Transformation
4.2.1. YFP-Fusion Expression Constructs
4.2.2. GUS Reporter Constructs
4.2.3. CRISPR/Cas9 Constructs
4.3. Plant Transformation
4.4. Sample Collection and Protoplast Preparation
4.5. ScRNA-seq Library Preparation
4.6. ScRNA-seq Data Preprocessing
4.7. Clustering Analysis of scRNA-seq Data
4.8. Pseudo-Time and Trajectory Analysis
4.9. RNA Extraction and qRT-PCR
4.10. GUS Staining and Histological Analysis
4.11. Microscopy
4.12. Gene Ontology (GO) Enrichment Analysis
4.13. Quantification and Statistical Analysis
4.14. Accession Numbers
Supplementary Materials
Author Contributions
Funding
Data Availability Statement
Acknowledgments
Conflicts of Interest
References
- Pathuri, I.P.; Zellerhoff, N.; Schaffrath, U.; Hensel, G.; Kumlehn, J.; Kogel, K.H.; Eichmann, R.; Huckelhoven, R. Constitutively activated barley ROPs modulate epidermal cell size, defense reactions and interactions with fungal leaf pathogens. Plant Cell Rep. 2008, 27, 1877–1887. [Google Scholar] [CrossRef]
- Hauser, M.T. Molecular basis of natural variation and environmental control of trichome patterning. Front. Plant Sci. 2014, 5, 320. [Google Scholar] [CrossRef] [PubMed]
- Marks, M.D. Molecular Genetic Analysis of Trichome Development in Arabidopsis. Annu. Rev. Plant Physiol. Plant Mol. Biol. 1997, 48, 137–163. [Google Scholar] [CrossRef]
- Liu, Z.; Zhou, Y.; Guo, J.; Li, J.; Tian, Z.; Zhu, Z.; Wang, J.; Wu, R.; Zhang, B.; Hu, Y.; et al. Global Dynamic Molecular Profiles of Stomatal Lineage Cell Development by Single-Cell RNA Sequencing. Mol. Plant 2020, 13, 1178–1193. [Google Scholar] [CrossRef] [PubMed]
- Adrian, J.; Chang, J.; Ballenger, C.E.; Bargmann, B.O.; Alassimone, J.; Davies, K.A.; Lau, O.S.; Matos, J.L.; Hachez, C.; Lanctot, A.; et al. Transcriptome dynamics of the stomatal lineage: Birth, amplification, and termination of a self-renewing population. Dev. Cell 2015, 33, 107–118. [Google Scholar] [CrossRef] [PubMed]
- Xu, T.; Wen, M.; Nagawa, S.; Fu, Y.; Chen, J.G.; Wu, M.J.; Perrot-Rechenmann, C.; Friml, J.; Jones, A.M.; Yang, Z. Cell surface- and rho GTPase-based auxin signaling controls cellular interdigitation in Arabidopsis. Cell 2010, 143, 99–110. [Google Scholar] [CrossRef]
- Eng, R.C.; Schneider, R.; Matz, T.W.; Carter, R.; Ehrhardt, D.W.; Jonsson, H.; Nikoloski, Z.; Sampathkumar, A. KATANIN and CLASP function at different spatial scales to mediate microtubule response to mechanical stress in Arabidopsis cotyledons. Curr. Biol. 2021, 31, 3262–3274. [Google Scholar] [CrossRef]
- Liang, H.; Zhang, Y.; Martinez, P.; Rasmussen, C.G.; Xu, T.; Yang, Z. The Microtubule-Associated Protein IQ67 DOMAIN5 Modulates Microtubule Dynamics and Pavement Cell Shape. Plant Physiol. 2018, 177, 1555–1568. [Google Scholar] [CrossRef]
- Wightman, R.; Chomicki, G.; Kumar, M.; Carr, P.; Turner, S.R. SPIRAL2 determines plant microtubule organization by modulating microtubule severing. Curr. Biol. 2013, 23, 1902–1907. [Google Scholar] [CrossRef]
- Ambrose, J.C.; Shoji, T.; Kotzer, A.M.; Pighin, J.A.; Wasteneys, G.O. The Arabidopsis CLASP gene encodes a microtubule-associated protein involved in cell expansion and division. Plant Cell 2007, 19, 2763–2775. [Google Scholar] [CrossRef]
- Lin, D.; Cao, L.; Zhou, Z.; Zhu, L.; Ehrhardt, D.; Yang, Z.; Fu, Y. Rho GTPase signaling activates microtubule severing to promote microtubule ordering in Arabidopsis. Curr. Biol. 2013, 23, 290–297. [Google Scholar] [CrossRef]
- Armour, W.J.; Barton, D.A.; Law, A.M.; Overall, R.L. Differential Growth in Periclinal and Anticlinal Walls during Lobe Formation in Arabidopsis Cotyledon Pavement Cells. Plant Cell 2015, 27, 2484–2500. [Google Scholar] [CrossRef]
- Pesch, M.; Hulskamp, M. Role of TRIPTYCHON in trichome patterning in Arabidopsis. BMC Plant Biol. 2011, 11, 130. [Google Scholar] [CrossRef] [PubMed]
- Larkin, J.C.; Young, N.; Prigge, M.; Marks, M.D. The control of trichome spacing and number in Arabidopsis. Development 1996, 122, 997–1005. [Google Scholar] [CrossRef] [PubMed]
- Hilscher, J.; Schlotterer, C.; Hauser, M.T. A single amino acid replacement in ETC2 shapes trichome patterning in natural Arabidopsis populations. Curr. Biol. 2009, 19, 1747–1751. [Google Scholar] [CrossRef]
- Grebe, M. The patterning of epidermal hairs in Arabidopsis—Updated. Curr. Opin. Plant Biol. 2012, 15, 31–37. [Google Scholar] [CrossRef]
- Balkunde, R.; Pesch, M.; Hulskamp, M. Trichome patterning in Arabidopsis thaliana from genetic to molecular models. Curr. Top. Dev. Biol. 2010, 91, 299–321. [Google Scholar]
- Zhao, M.; Morohashi, K.; Hatlestad, G.; Grotewold, E.; Lloyd, A. The TTG1-bHLH-MYB complex controls trichome cell fate and patterning through direct targeting of regulatory loci. Development 2008, 135, 1991–1999. [Google Scholar] [CrossRef]
- Yanagisawa, M.; Desyatova, A.S.; Belteton, S.A.; Mallery, E.L.; Turner, J.A.; Szymanski, D.B. Patterning mechanisms of cytoskeletal and cell wall systems during leaf trichome morphogenesis. Nat. Plants 2015, 1, 15014. [Google Scholar] [CrossRef]
- Schnittger, A.; Folkers, U.; Schwab, B.; Jurgens, G.; Hulskamp, M. Generation of a spacing pattern: The role of triptychon in trichome patterning in Arabidopsis. Plant Cell 1999, 11, 1105–1116. [Google Scholar] [CrossRef]
- Esch, J.J.; Chen, M.A.; Hillestad, M.; Marks, M.D. Comparison of TRY and the closely related At1g01380 gene in controlling Arabidopsis trichome patterning. Plant J. 2004, 40, 860–869. [Google Scholar] [CrossRef]
- Lloyd, A.M.; Schena, M.; Walbot, V.; Davis, R.W. Epidermal cell fate determination in Arabidopsis: Patterns defined by a steroid-inducible regulator. Science 1994, 266, 436–439. [Google Scholar] [CrossRef]
- Marks, M.D.; Wenger, J.P.; Gilding, E.; Jilk, R.; Dixon, R.A. Transcriptome analysis of Arabidopsis wild-type and gl3-sst sim trichomes identifies four additional genes required for trichome development. Mol. Plant 2009, 2, 803–822. [Google Scholar] [CrossRef] [PubMed]
- Hulskamp, M.; Misra, S.; Jurgens, G. Genetic dissection of trichome cell development in Arabidopsis. Cell 1994, 76, 555–566. [Google Scholar] [CrossRef]
- Ishida, T.; Kurata, T.; Okada, K.; Wada, T. A genetic regulatory network in the development of trichomes and root hairs. Annu. Rev. Plant Biol. 2008, 59, 365–386. [Google Scholar] [CrossRef] [PubMed]
- Pesch, M.; Hulskamp, M. One, two, three…models for trichome patterning in Arabidopsis? Curr. Opin. Plant Biol. 2009, 12, 587–592. [Google Scholar] [CrossRef]
- Herman, P.L.; Marks, M.D. Trichome Development in Arabidopsis thaliana. II. Isolation and Complementation of the GLABROUS1 Gene. Plant Cell 1989, 1, 1051–1055. [Google Scholar] [CrossRef] [PubMed]
- Marks, M.D.; Feldmann, K.A. Trichome Development in Arabidopsis thaliana. I. T-DNA Tagging of the GLABROUS1 Gene. Plant Cell 1989, 1, 1043–1050. [Google Scholar] [CrossRef]
- Kirik, V.; Schnittger, A.; Radchuk, V.; Adler, K.; Hulskamp, M.; Baumlein, H. Ectopic expression of the Arabidopsis AtMYB23 gene induces differentiation of trichome cells. Dev. Biol. 2001, 235, 366–377. [Google Scholar] [CrossRef]
- Kirik, V.; Lee, M.M.; Wester, K.; Herrmann, U.; Zheng, Z.; Oppenheimer, D.; Schiefelbein, J.; Hulskamp, M. Functional diversification of MYB23 and GL1 genes in trichome morphogenesis and initiation. Development 2005, 132, 1477–1485. [Google Scholar] [CrossRef]
- Wada, T.; Tachibana, T.; Shimura, Y.; Okada, K. Epidermal cell differentiation in Arabidopsis determined by a Myb homolog, CPC. Science 1997, 277, 1113–1116. [Google Scholar] [CrossRef]
- Kirik, V.; Simon, M.; Wester, K.; Schiefelbein, J.; Hulskamp, M. ENHANCER of TRY and CPC 2 (ETC2) reveals redundancy in the region-specific control of trichome development of Arabidopsis. Plant Mol. Biol. 2004, 55, 389–398. [Google Scholar] [CrossRef]
- Zhu, H.F.; Fitzsimmons, K.; Khandelwal, A.; Kranz, R.G. CPC, a single-repeat R3 MYB, is a negative regulator of anthocyanin biosynthesis in Arabidopsis. Mol. Plant 2009, 2, 790–802. [Google Scholar] [CrossRef] [PubMed]
- Kirik, V.; Simon, M.; Huelskamp, M.; Schiefelbein, J. The ENHANCER OF TRY AND CPC1 gene acts redundantly with TRIPTYCHON and CAPRICE in trichome and root hair cell patterning in Arabidopsis. Dev. Biol. 2004, 268, 506–513. [Google Scholar] [CrossRef] [PubMed]
- Tian, H.; Wang, X.; Guo, H.; Cheng, Y.; Hou, C.; Chen, J.G.; Wang, S. NTL8 Regulates Trichome Formation in Arabidopsis by Directly Activating R3 MYB Genes TRY and TCL1. Plant Physiol. 2017, 174, 2363–2375. [Google Scholar] [CrossRef] [PubMed]
- Gan, L.; Xia, K.; Chen, J.G.; Wang, S. Functional characterization of TRICHOMELESS2, a new single-repeat R3 MYB transcription factor in the regulation of trichome patterning in Arabidopsis. BMC Plant Biol. 2011, 11, 176. [Google Scholar] [CrossRef]
- An, L.; Zhou, Z.; Yan, A.; Gan, Y. Progress on trichome development regulated by phytohormone signaling. Plant Signal Behav. 2011, 6, 1959–1962. [Google Scholar] [CrossRef] [PubMed]
- Wang, Z.; Yang, Z.; Li, F. Updates on molecular mechanisms in the development of branched trichome in Arabidopsis and nonbranched in cotton. Plant Biotechnol. J. 2019, 17, 1706–1722. [Google Scholar] [CrossRef] [PubMed]
- Zhang, H.; Liu, P.; Wang, B.; Yuan, F. The roles of trichome development genes in stress resistance. Plant Growth Regul. 2021, 95, 137–148. [Google Scholar] [CrossRef]
- Tian, H.; Qi, T.; Li, Y.; Wang, C.; Ren, C.; Song, S.; Huang, H. Regulation of the WD-repeat/bHLH/MYB complex by gibberellin and jasmonate. Plant Signal Behav. 2016, 11, e1204061. [Google Scholar] [CrossRef]
- Yan, T.; Chen, M.; Shen, Q.; Li, L.; Fu, X.; Pan, Q.; Tang, Y.; Shi, P.; Lv, Z.; Jiang, W.; et al. HOMEODOMAIN PROTEIN 1 is required for jasmonate-mediated glandular trichome initiation in Artemisia annua. New Phytol. 2017, 213, 1145–1155. [Google Scholar] [CrossRef]
- Hua, B.; Chang, J.; Wu, M.; Xu, Z.; Zhang, F.; Yang, M.; Xu, H.; Wang, L.J.; Chen, X.Y.; Wu, S. Mediation of JA signalling in glandular trichomes by the woolly/SlMYC1 regulatory module improves pest resistance in tomato. Plant Biotechnol. J. 2021, 19, 375–393. [Google Scholar] [CrossRef]
- Lee, E.S.; Park, J.H.; Hwang, G.Y.; Chi, Y.H.; Kang, C.H.; Chae, H.B.; Paeng, S.K.; Wi, S.D.; Bae, S.B.; Phan, K.A.T.; et al. Nucleoredoxin2 (NRX2) Promotes Jasmonate-Mediated Trichome Formation in Arabidopsis. J. Plant Biol. 2020, 63, 495–503. [Google Scholar] [CrossRef]
- Yoshida, Y.; Sano, R.; Wada, T.; Takabayashi, J.; Okada, K. Jasmonic acid control of GLABRA3 links inducible defense and trichome patterning in Arabidopsis. Development 2009, 136, 1039–1048. [Google Scholar] [CrossRef] [PubMed]
- Huang, H.; Liu, B.; Liu, L.; Song, S. Jasmonate action in plant growth and development. J. Exp. Bot. 2017, 68, 1349–1359. [Google Scholar] [CrossRef] [PubMed]
- Shi, R.X.; Yu, J.L.; Chang, X.R.; Qiao, L.P.; Liu, X.; Lu, L.F. Recent Advances in Research into Jasmonate Biosynthesis and Signaling Pathways in Agricultural Crops and Products. Processes 2023, 11, 736. [Google Scholar] [CrossRef]
- Guo, Q.; Yoshida, Y.; Major, I.T.; Wang, K.; Sugimoto, K.; Kapali, G.; Havko, N.E.; Benning, C.; Howe, G.A. JAZ repressors of metabolic defense promote growth and reproductive fitness in Arabidopsis. Proc. Natl. Acad. Sci. USA 2018, 115, e10768–e10777. [Google Scholar] [CrossRef] [PubMed]
- Wen, J.; Li, Y.; Qi, T.; Gao, H.; Liu, B.; Zhang, M.; Huang, H.; Song, S. The C-terminal domains of Arabidopsis GL3/EGL3/TT8 interact with JAZ proteins and mediate dimeric interactions. Plant Signal Behav. 2018, 13, e1422460. [Google Scholar] [CrossRef] [PubMed]
- Torii, K.U. Stomatal development in the context of epidermal tissues. Ann. Bot. 2021, 128, 137–148. [Google Scholar] [CrossRef] [PubMed]
- Liu, Z.; Wang, J.; Zhou, Y.; Zhang, Y.; Qin, A.; Yu, X.; Zhao, Z.; Wu, R.; Guo, C.; Bawa, G.; et al. Identification of Novel Regulators Required for Early Development of Vein Pattern in the Cotyledons by Single-cell RNA-seq. Plant J. 2022, 110, 7–22. [Google Scholar] [CrossRef]
- Wendrich, J.R.; Yang, B.; Vandamme, N.; Verstaen, K.; Smet, W.; Van de Velde, C.; Minne, M.; Wybouw, B.; Mor, E.; Arents, H.E.; et al. Vascular transcription factors guide plant epidermal responses to limiting phosphate conditions. Science 2020, 370, eaay4970. [Google Scholar] [CrossRef] [PubMed]
- Kim, J.Y.; Symeonidi, E.; Pang, T.Y.; Denyer, T.; Weidauer, D.; Bezrutczyk, M.; Miras, M.; Zollner, N.; Hartwig, T.; Wudick, M.M.; et al. Distinct identities of leaf phloem cells revealed by single cell transcriptomics. Plant Cell 2021, 33, 511–530. [Google Scholar] [CrossRef] [PubMed]
- Serrano-Ron, L.; Perez-Garcia, P.; Sanchez-Corrionero, A.; Gude, I.; Cabrera, J.; Ip, P.L.; Birnbaum, K.D.; Moreno-Risueno, M.A. Reconstruction of lateral root formation through single-cell RNA sequencing reveals order of tissue initiation. Mol. Plant 2021, 14, 1362–1378. [Google Scholar] [CrossRef] [PubMed]
- Zhang, T.Q.; Xu, Z.G.; Shang, G.D.; Wang, J.W. A Single-Cell RNA Sequencing Profiles the Developmental Landscape of Arabidopsis Root. Mol. Plant 2019, 12, 648–660. [Google Scholar] [CrossRef] [PubMed]
- Liu, Q.; Liang, Z.; Feng, D.; Jiang, S.J.; Wang, Y.F.; Du, Z.Y.; Li, R.X.; Hu, G.H.; Zhang, P.X.; Ma, Y.F.; et al. Transcriptional landscape of rice roots at the single-cell resolution. Mol. Plant 2021, 14, 384–394. [Google Scholar] [CrossRef] [PubMed]
- Bawa, G.; Liu, Z.; Yu, X.; Qin, A.; Sun, X. Single-Cell RNA Sequencing for Plant Research: Insights and Possible Benefits. Int. J. Mol. Sci. 2022, 23, 4497. [Google Scholar] [CrossRef]
- Farmer, A.; Thibivilliers, S.; Ryu, K.H.; Schiefelbein, J.; Libault, M. Single-nucleus RNA and ATAC sequencing reveals the impact of chromatin accessibility on gene expression in Arabidopsis roots at the single-cell level. Mol. Plant 2021, 14, 372–383. [Google Scholar] [CrossRef]
- Bawa, G.; Liu, Z.; Yu, X.; Tran, L.P.; Sun, X. Introducing single cell stereo-sequencing technology to transform the plant transcriptome landscape. Trends Plant Sci. 2024, 29, 249–265. [Google Scholar] [CrossRef]
- Yu, X.; Liu, Z.; Sun, X. Single-cell and spatial multi-omics in the plant sciences: Technical advances, applications, and perspectives. Plant Commun. 2023, 4, 100508. [Google Scholar] [CrossRef] [PubMed]
- Liu, Z.; Yu, X.; Qin, A.; Zhao, Z.; Liu, Y.; Sun, S.; Liu, H.; Guo, C.; Wu, R.; Yang, J.; et al. Research strategies for single-cell transcriptome analysis in plant leaves. Plant J. 2022, 112, 27–37. [Google Scholar] [CrossRef] [PubMed]
- Liu, Z.; Guo, C.; Wu, R.; Wang, J.; Zhou, Y.; Yu, X.; Zhang, Y.; Zhao, Z.; Liu, H.; Sun, S.; et al. Identification of the Regulators of Epidermis Development under Drought- and Salt-Stressed Conditions by Single-Cell RNA-Seq. Int. J. Mol. Sci. 2022, 23, 2759. [Google Scholar] [CrossRef]
- Lopez-Anido, C.B.; Vaten, A.; Smoot, N.K.; Sharma, N.; Guo, V.; Gong, Y.; Anleu Gil, M.X.; Weimer, A.K.; Bergmann, D.C. Single-cell resolution of lineage trajectories in the Arabidopsis stomatal lineage and developing leaf. Dev. Cell 2021, 56, 1043–1055.e4. [Google Scholar] [CrossRef] [PubMed]
- Pestana, C.J.; Capelo-Neto, J.; Lawton, L.; Oliveira, S.; Carloto, I.; Linhares, H.P. The effect of water treatment unit processes on cyanobacterial trichome integrity. Sci. Total Environ. 2019, 659, 1403–1414. [Google Scholar] [CrossRef] [PubMed]
- Horstman, A.; Fukuoka, H.; Muino, J.M.; Nitsch, L.; Guo, C.H.; Passarinho, P.; Sanchez-Perez, G.; Immink, R.; Angenent, G.; Boutilier, K. AIL and HDG proteins act antagonistically to control cell proliferation. Development 2015, 142, 454–464. [Google Scholar] [CrossRef]
- Szymanski, D.B.; Jilk, R.A.; Pollock, S.M.; Marks, M.D. Control of GL2 expression in Arabidopsis leaves and trichomes. Development 1998, 125, 1161–1171. [Google Scholar] [CrossRef] [PubMed]
- Peng, S.; Huang, S.; Liu, Z.; Feng, H. Mutation of ACX1, a Jasmonic Acid Biosynthetic Enzyme, Leads to Petal Degeneration in Chinese Cabbage (Brassica campestris ssp. pekinensis). Int. J. Mol. Sci. 2019, 20, 2310. [Google Scholar] [CrossRef]
- Delker, C.; Zolman, B.K.; Miersch, O.; Wasternack, C. Jasmonate biosynthesis in Arabidopsis thaliana requires peroxisomal beta-oxidation enzymes–additional proof by properties of pex6 and aim1. Phytochemistry 2007, 68, 1642–1650. [Google Scholar] [CrossRef]
- Canet, J.V.; Dobon, A.; Fajmonova, J.; Tornero, P. The BLADE-ON-PETIOLE genes of Arabidopsis are essential for resistance induced by methyl jasmonate. BMC Plant Biol. 2012, 12, 199. [Google Scholar] [CrossRef]
- Xie, D.X.; Feys, B.F.; James, S.; Nieto-Rostro, M.; Turner, J.G. COI1: An Arabidopsis gene required for jasmonate-regulated defense and fertility. Science 1998, 280, 1091–1094. [Google Scholar] [CrossRef]
- Thines, B.; Katsir, L.; Melotto, M.; Niu, Y.; Mandaokar, A.; Liu, G.; Nomura, K.; He, S.Y.; Howe, G.A.; Browse, J. JAZ repressor proteins are targets of the SCF(COI1) complex during jasmonate signalling. Nature 2007, 448, 661–665. [Google Scholar] [CrossRef]
- Clarke, J.D.; Aarts, N.; Feys, B.J.; Dong, X.; Parker, J.E. Constitutive disease resistance requires EDS1 in the Arabidopsis mutants cpr1 and cpr6 and is partially EDS1-dependent in cpr5. Plant J. 2001, 26, 409–420. [Google Scholar] [CrossRef] [PubMed]
- Quint, M.; Ito, H.; Zhang, W.; Gray, W.M. Characterization of a novel temperature-sensitive allele of the CUL1/AXR6 subunit of SCF ubiquitin-ligases. Plant J. 2005, 43, 371–383. [Google Scholar] [CrossRef] [PubMed]
- Chung, H.S.; Howe, G.A. A critical role for the TIFY motif in repression of jasmonate signaling by a stabilized splice variant of the JASMONATE ZIM-domain protein JAZ10 in Arabidopsis. Plant Cell 2009, 21, 131–145. [Google Scholar] [CrossRef] [PubMed]
- Caarls, L.; Elberse, J.; Awwanah, M.; Ludwig, N.R.; de Vries, M.; Zeilmaker, T.; Van Wees, S.C.M.; Schuurink, R.C.; Van den Ackerveken, G. Arabidopsis JASMONATE-INDUCED OXYGENASES down-regulate plant immunity by hydroxylation and inactivation of the hormone jasmonic acid. Proc. Natl. Acad. Sci. USA 2017, 114, 6388–6393. [Google Scholar] [CrossRef]
- Bali, S.; Jamwal, V.L.; Kohli, S.K.; Kaur, P.; Tejpal, R.; Bhalla, V.; Ohri, P.; Gandhi, S.G.; Bhardwaj, R.; Al-Huqail, A.A.; et al. Jasmonic acid application triggers detoxification of lead (Pb) toxicity in tomato through the modifications of secondary metabolites and gene expression. Chemosphere 2019, 235, 734–748. [Google Scholar] [CrossRef] [PubMed]
- Overmyer, K.; Tuominen, H.; Kettunen, R.; Betz, C.; Langebartels, C.; Sandermann, H., Jr.; Kangasjarvi, J. Ozone-sensitive arabidopsis rcd1 mutant reveals opposite roles for ethylene and jasmonate signaling pathways in regulating superoxide-dependent cell death. Plant Cell 2000, 12, 1849–1862. [Google Scholar] [CrossRef]
- LeBrasseur, N.D.; MacIntosh, G.C.; Perez-Amador, M.A.; Saitoh, M.; Green, P.J. Local and systemic wound-induction of RNase and nuclease activities in Arabidopsis: RNS1 as a marker for a JA-independent systemic signaling pathway. Plant J. 2002, 29, 393–403. [Google Scholar] [CrossRef]
- Zhou, X.J.; Cooke, P.; Li, L. Eukaryotic release factor 1–2 affects responses to glucose and phytohormones during germination and early seedling development. J. Exp. Bot. 2010, 61, 357–367. [Google Scholar] [CrossRef]
- Byrne, M.; Timmermans, M.; Kidner, C.; Martienssen, R. Development of leaf shape. Curr. Opin. Plant Biol. 2001, 4, 38–43. [Google Scholar] [CrossRef] [PubMed]
- Bar, M.; Ori, N. Leaf development and morphogenesis. Development 2014, 141, 4219–4230. [Google Scholar] [CrossRef] [PubMed]
- Fleming, A.J. The control of leaf development. New Phytol. 2005, 166, 9–20. [Google Scholar] [CrossRef] [PubMed]
- Lu, D.; Wang, T.; Persson, S.; Mueller-Roeber, B.; Schippers, J.H. Transcriptional control of ROS homeostasis by KUODA1 regulates cell expansion during leaf development. Nat. Commun. 2014, 5, 3767. [Google Scholar] [CrossRef] [PubMed]
- Kalve, S.; De Vos, D.; Beemster, G.T. Leaf development: A cellular perspective. Front. Plant Sci. 2014, 5, 362. [Google Scholar] [CrossRef] [PubMed]
- Trapnell, C.; Cacchiarelli, D.; Grimsby, J.; Pokharel, P.; Li, S.; Morse, M.; Lennon, N.J.; Livak, K.J.; Mikkelsen, T.S.; Rinn, J.L. The dynamics and regulators of cell fate decisions are revealed by pseudotemporal ordering of single cells. Nat. Biotechnol. 2014, 32, 381–386. [Google Scholar] [CrossRef] [PubMed]
- Paetzold, H.; Garms, S.; Bartram, S.; Wieczorek, J.; Uros-Gracia, E.M.; Rodriguez-Concepcion, M.; Boland, W.; Strack, D.; Hause, B.; Walter, M.H. The isogene 1-deoxy-D-xylulose 5-phosphate synthase 2 controls isoprenoid profiles, precursor pathway allocation, and density of tomato trichomes. Mol. Plant 2010, 3, 904–916. [Google Scholar] [CrossRef]
- Han, S.K.; Kwak, J.M.; Qi, X. Stomatal Lineage Control by Developmental Program and Environmental Cues. Front. Plant Sci. 2021, 12, 751852. [Google Scholar] [CrossRef]
- Wang, X.; Shen, C.; Meng, P.; Tan, G.; Lv, L. Analysis and review of trichomes in plants. BMC Plant Biol. 2021, 21, 70. [Google Scholar] [CrossRef] [PubMed]
- Qi, X.; Torii, K.U. Hormonal and environmental signals guiding stomatal development. BMC Biol. 2018, 16, 21. [Google Scholar] [CrossRef]
- Qi, T.; Huang, H.; Wu, D.; Yan, J.; Qi, Y.; Song, S.; Xie, D. Arabidopsis DELLA and JAZ proteins bind the WD-repeat/bHLH/MYB complex to modulate gibberellin and jasmonate signaling synergy. Plant Cell 2014, 26, 1118–1133. [Google Scholar] [CrossRef]
- Kazan, K.; Manners, J.M. MYC2: The master in action. Mol. Plant 2013, 6, 686–703. [Google Scholar] [CrossRef]
- Han, X.; Hu, Y.; Zhang, G.; Jiang, Y.; Chen, X.; Yu, D. Jasmonate Negatively Regulates Stomatal Development in Arabidopsis Cotyledons. Plant Physiol. 2018, 176, 2871–2885. [Google Scholar] [CrossRef]
- Song, S.S.; Qi, T.C.; Wasternack, C.; Xie, D.X. Jasmonate signaling and crosstalk with gibberellin and ethylene. Curr. Opin. Plant Biol. 2014, 21, 112–119. [Google Scholar] [CrossRef]
- An, L.; Zhou, Z.; Su, S.; Yan, A.; Gan, Y. GLABROUS INFLORESCENCE STEMS (GIS) is required for trichome branching through gibberellic acid signaling in Arabidopsis. Plant Cell Physiol. 2012, 53, 457–469. [Google Scholar] [CrossRef] [PubMed]
- Brininstool, G.; Kasili, R.; Simmons, L.A.; Kirik, V.; Hulskamp, M.; Larkin, J.C. Constitutive Expressor of Pathogenesis-related Genes5 affects cell wall biogenesis and trichome development. BMC Plant Biol. 2008, 8, 58. [Google Scholar] [CrossRef] [PubMed]
- Marks, M.D.; Betancur, L.; Gilding, E.; Chen, F.; Bauer, S.; Wenger, J.P.; Dixon, R.A.; Haigler, C.H. A new method for isolating large quantities of Arabidopsis trichomes for transcriptome, cell wall and other types of analyses. Plant J. 2008, 56, 483–492. [Google Scholar] [CrossRef]
- Alonso, R.; Onate-Sanchez, L.; Weltmeier, F.; Ehlert, A.; Diaz, I.; Dietrich, K.; Vicente-Carbajosa, J.; Droge-Laser, W. A pivotal role of the basic leucine zipper transcription factor bZIP53 in the regulation of Arabidopsis seed maturation gene expression based on heterodimerization and protein complex formation. Plant Cell 2009, 21, 1747–1761. [Google Scholar] [CrossRef] [PubMed]
- Jain, P.; Shah, K.; Sharma, N.; Kaur, R.; Singh, J.; Vinson, C.; Rishi, V. A-ZIP53, a dominant negative reveals the molecular mechanism of heterodimerization between bZIP53, bZIP10 and bZIP25 involved in Arabidopsis seed maturation. Sci. Rep. 2017, 7, 14343. [Google Scholar] [CrossRef] [PubMed]
- Hartmann, L.; Pedrotti, L.; Weiste, C.; Fekete, A.; Schierstaedt, J.; Gottler, J.; Kempa, S.; Krischke, M.; Dietrich, K.; Mueller, M.J.; et al. Crosstalk between Two bZIP Signaling Pathways Orchestrates Salt-Induced Metabolic Reprogramming in Arabidopsis Roots. Plant Cell 2015, 27, 2244–2260. [Google Scholar] [CrossRef] [PubMed]
- Garg, A.; Kirchler, T.; Fillinger, S.; Wanke, F.; Stadelhofer, B.; Stahl, M.; Chaban, C. Targeted manipulation of bZIP53 DNA-binding properties influences Arabidopsis metabolism and growth. J. Exp. Bot. 2019, 70, 5659–5671. [Google Scholar] [CrossRef] [PubMed]
- Restovic, F.; Espinoza-Corral, R.; Gomez, I.; Vicente-Carbajosa, J.; Jordana, X. An active Mitochondrial Complex II Present in Mature Seeds Contains an Embryo-Specific Iron-Sulfur Subunit Regulated by ABA and bZIP53 and Is Involved in Germination and Seedling Establishment. Front. Plant Sci. 2017, 8, 277. [Google Scholar] [CrossRef]
- Roschzttardtz, H.; Fuentes, I.; Vasquez, M.; Corvalan, C.; Leon, G.; Gomez, I.; Araya, A.; Holuigue, L.; Vicente-Carbajosa, J.; Jordana, X. A Nuclear Gene Encoding the Iron-Sulfur Subunit of Mitochondrial Complex II Is Regulated by B3 Domain Transcription Factors during Seed Development in Arabidopsis. Plant Physiol. 2009, 150, 84–95. [Google Scholar] [CrossRef]
- Noir, S.; Bomer, M.; Takahashi, N.; Ishida, T.; Tsui, T.L.; Balbi, V.; Shanahan, H.; Sugimoto, K.; Devoto, A. Jasmonate Controls Leaf Growth by Repressing Cell Proliferation and the Onset of Endoreduplication while Maintaining a Potential Stand-By Mode. Plant Physiol. 2013, 161, 1930–1951. [Google Scholar] [CrossRef]
- Zhang, X.; Henriques, R.; Lin, S.S.; Niu, Q.W.; Chua, N.H. Agrobacterium-mediated transformation of Arabidopsis thaliana using the floral dip method. Nat. Protoc. 2006, 1, 641–646. [Google Scholar] [CrossRef]
- Sun, X.W.; Xu, D.R.; Liu, Z.X.; Kleine, T.; Leister, D. Functional relationship between mTERF4 and GUN1 in retrograde signaling. J. Exp. Bot. 2016, 67, 3909–3924. [Google Scholar] [CrossRef]
- Yoo, S.D.; Cho, Y.H.; Sheen, J. Arabidopsis mesophyll protoplasts: A versatile cell system for transient gene expression analysis. Nat. Protoc. 2007, 2, 1565–1572. [Google Scholar] [CrossRef]
- Macosko, E.Z.; Basu, A.; Satija, R.; Nemesh, J.; Shekhar, K.; Goldman, M.; Tirosh, I.; Bialas, A.R.; Kamitaki, N.; Martersteck, E.M.; et al. Highly Parallel Genome-wide Expression Profiling of Individual Cells Using Nanoliter Droplets. Cell 2015, 161, 1202–1214. [Google Scholar] [CrossRef]
- Becht, E.; McInnes, L.; Healy, J.; Dutertre, C.A.; Kwok, I.W.H.; Ng, L.G.; Ginhoux, F.; Newell, E.W. Dimensionality reduction for visualizing single-cell data using UMAP. Nature Biotechnol. 2019, 37, 38–44. [Google Scholar] [CrossRef] [PubMed]
- Hughes, T.E.; Langdale, J.A. SCARECROW is deployed in distinct contexts during rice and maize leaf development. Development 2022, 149, dev200410. [Google Scholar] [CrossRef] [PubMed]
- Zhou, Y.; Zhou, B.; Pache, L.; Chang, M.; Khodabakhshi, A.H.; Tanaseichuk, O.; Benner, C.; Chanda, S.K. Metascape provides a biologist-oriented resource for the analysis of systems-level datasets. Nat. Commun. 2019, 10, 1523. [Google Scholar] [CrossRef] [PubMed]


Disclaimer/Publisher’s Note: The statements, opinions and data contained in all publications are solely those of the individual author(s) and contributor(s) and not of MDPI and/or the editor(s). MDPI and/or the editor(s) disclaim responsibility for any injury to people or property resulting from any ideas, methods, instructions or products referred to in the content. |
© 2024 by the authors. Licensee MDPI, Basel, Switzerland. This article is an open access article distributed under the terms and conditions of the Creative Commons Attribution (CC BY) license (https://creativecommons.org/licenses/by/4.0/).
Share and Cite
Wu, R.; Liu, Z.; Sun, S.; Qin, A.; Liu, H.; Zhou, Y.; Li, W.; Liu, Y.; Hu, M.; Yang, J.; et al. Identification of bZIP Transcription Factors That Regulate the Development of Leaf Epidermal Cells in Arabidopsis thaliana by Single-Cell RNA Sequencing. Int. J. Mol. Sci. 2024, 25, 2553. https://doi.org/10.3390/ijms25052553
Wu R, Liu Z, Sun S, Qin A, Liu H, Zhou Y, Li W, Liu Y, Hu M, Yang J, et al. Identification of bZIP Transcription Factors That Regulate the Development of Leaf Epidermal Cells in Arabidopsis thaliana by Single-Cell RNA Sequencing. International Journal of Molecular Sciences. 2024; 25(5):2553. https://doi.org/10.3390/ijms25052553
Chicago/Turabian StyleWu, Rui, Zhixin Liu, Susu Sun, Aizhi Qin, Hao Liu, Yaping Zhou, Weiqiang Li, Yumeng Liu, Mengke Hu, Jincheng Yang, and et al. 2024. "Identification of bZIP Transcription Factors That Regulate the Development of Leaf Epidermal Cells in Arabidopsis thaliana by Single-Cell RNA Sequencing" International Journal of Molecular Sciences 25, no. 5: 2553. https://doi.org/10.3390/ijms25052553
APA StyleWu, R., Liu, Z., Sun, S., Qin, A., Liu, H., Zhou, Y., Li, W., Liu, Y., Hu, M., Yang, J., Rochaix, J.-D., An, G., Herrera-Estrella, L., Tran, L.-S. P., & Sun, X. (2024). Identification of bZIP Transcription Factors That Regulate the Development of Leaf Epidermal Cells in Arabidopsis thaliana by Single-Cell RNA Sequencing. International Journal of Molecular Sciences, 25(5), 2553. https://doi.org/10.3390/ijms25052553