

The Screening of microRNAs in Chronic Myeloid Leukemia: A Clinical Evaluation

 , , and
Abstract
1. Introduction
2. Results
2.1. Epidemiological Description
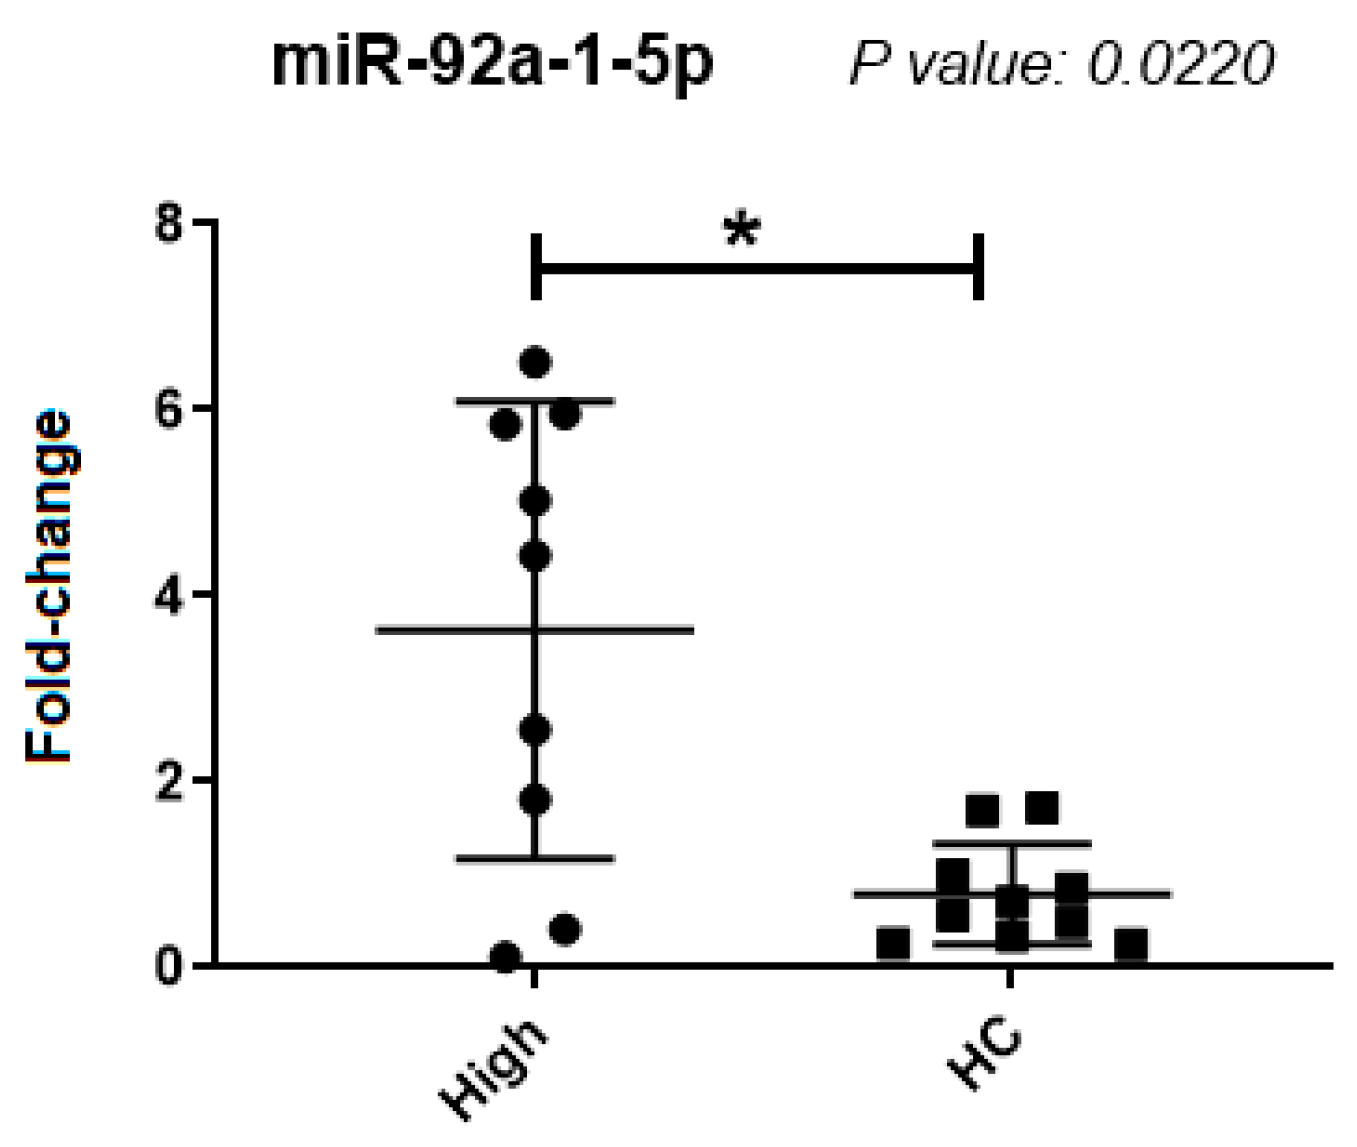
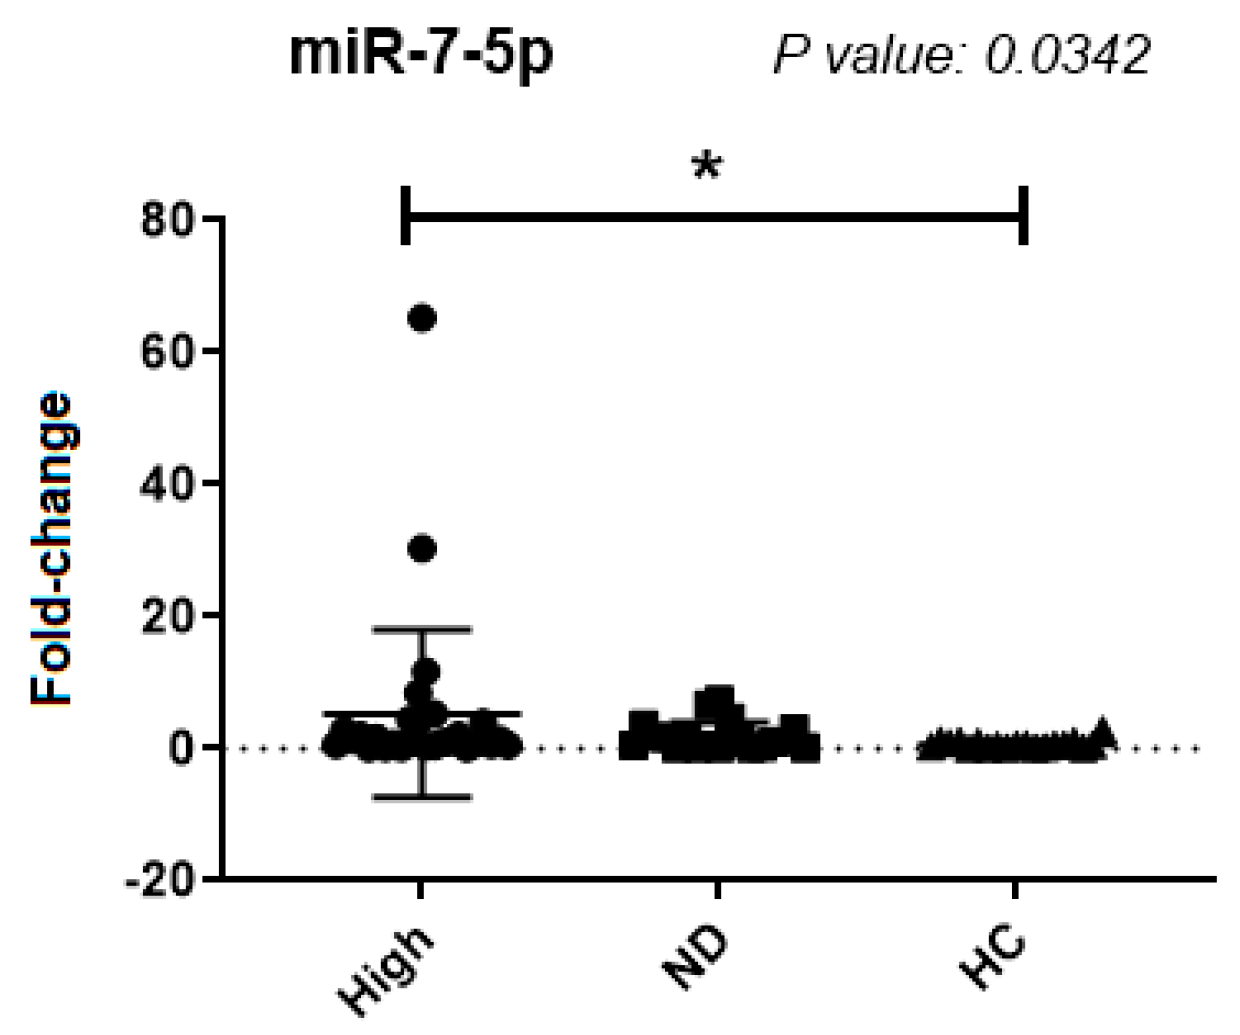
2.2. Single-Point Plasma Analysis
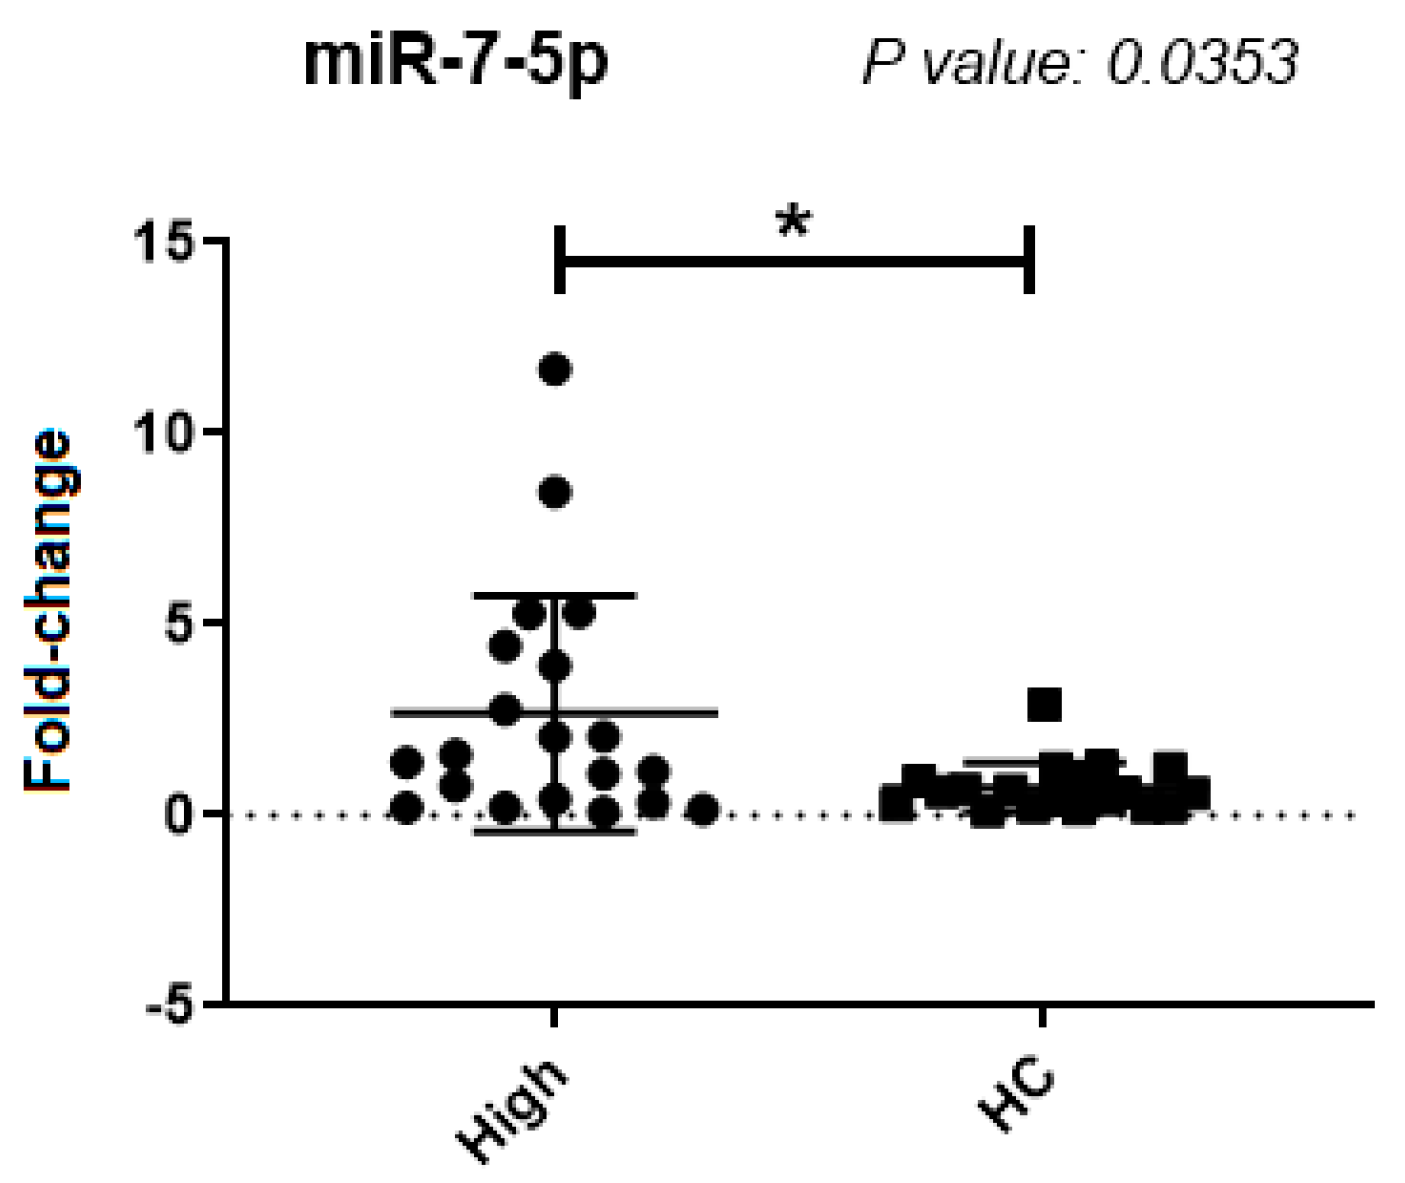
2.3. Buffy Coat Single-Point Analysis
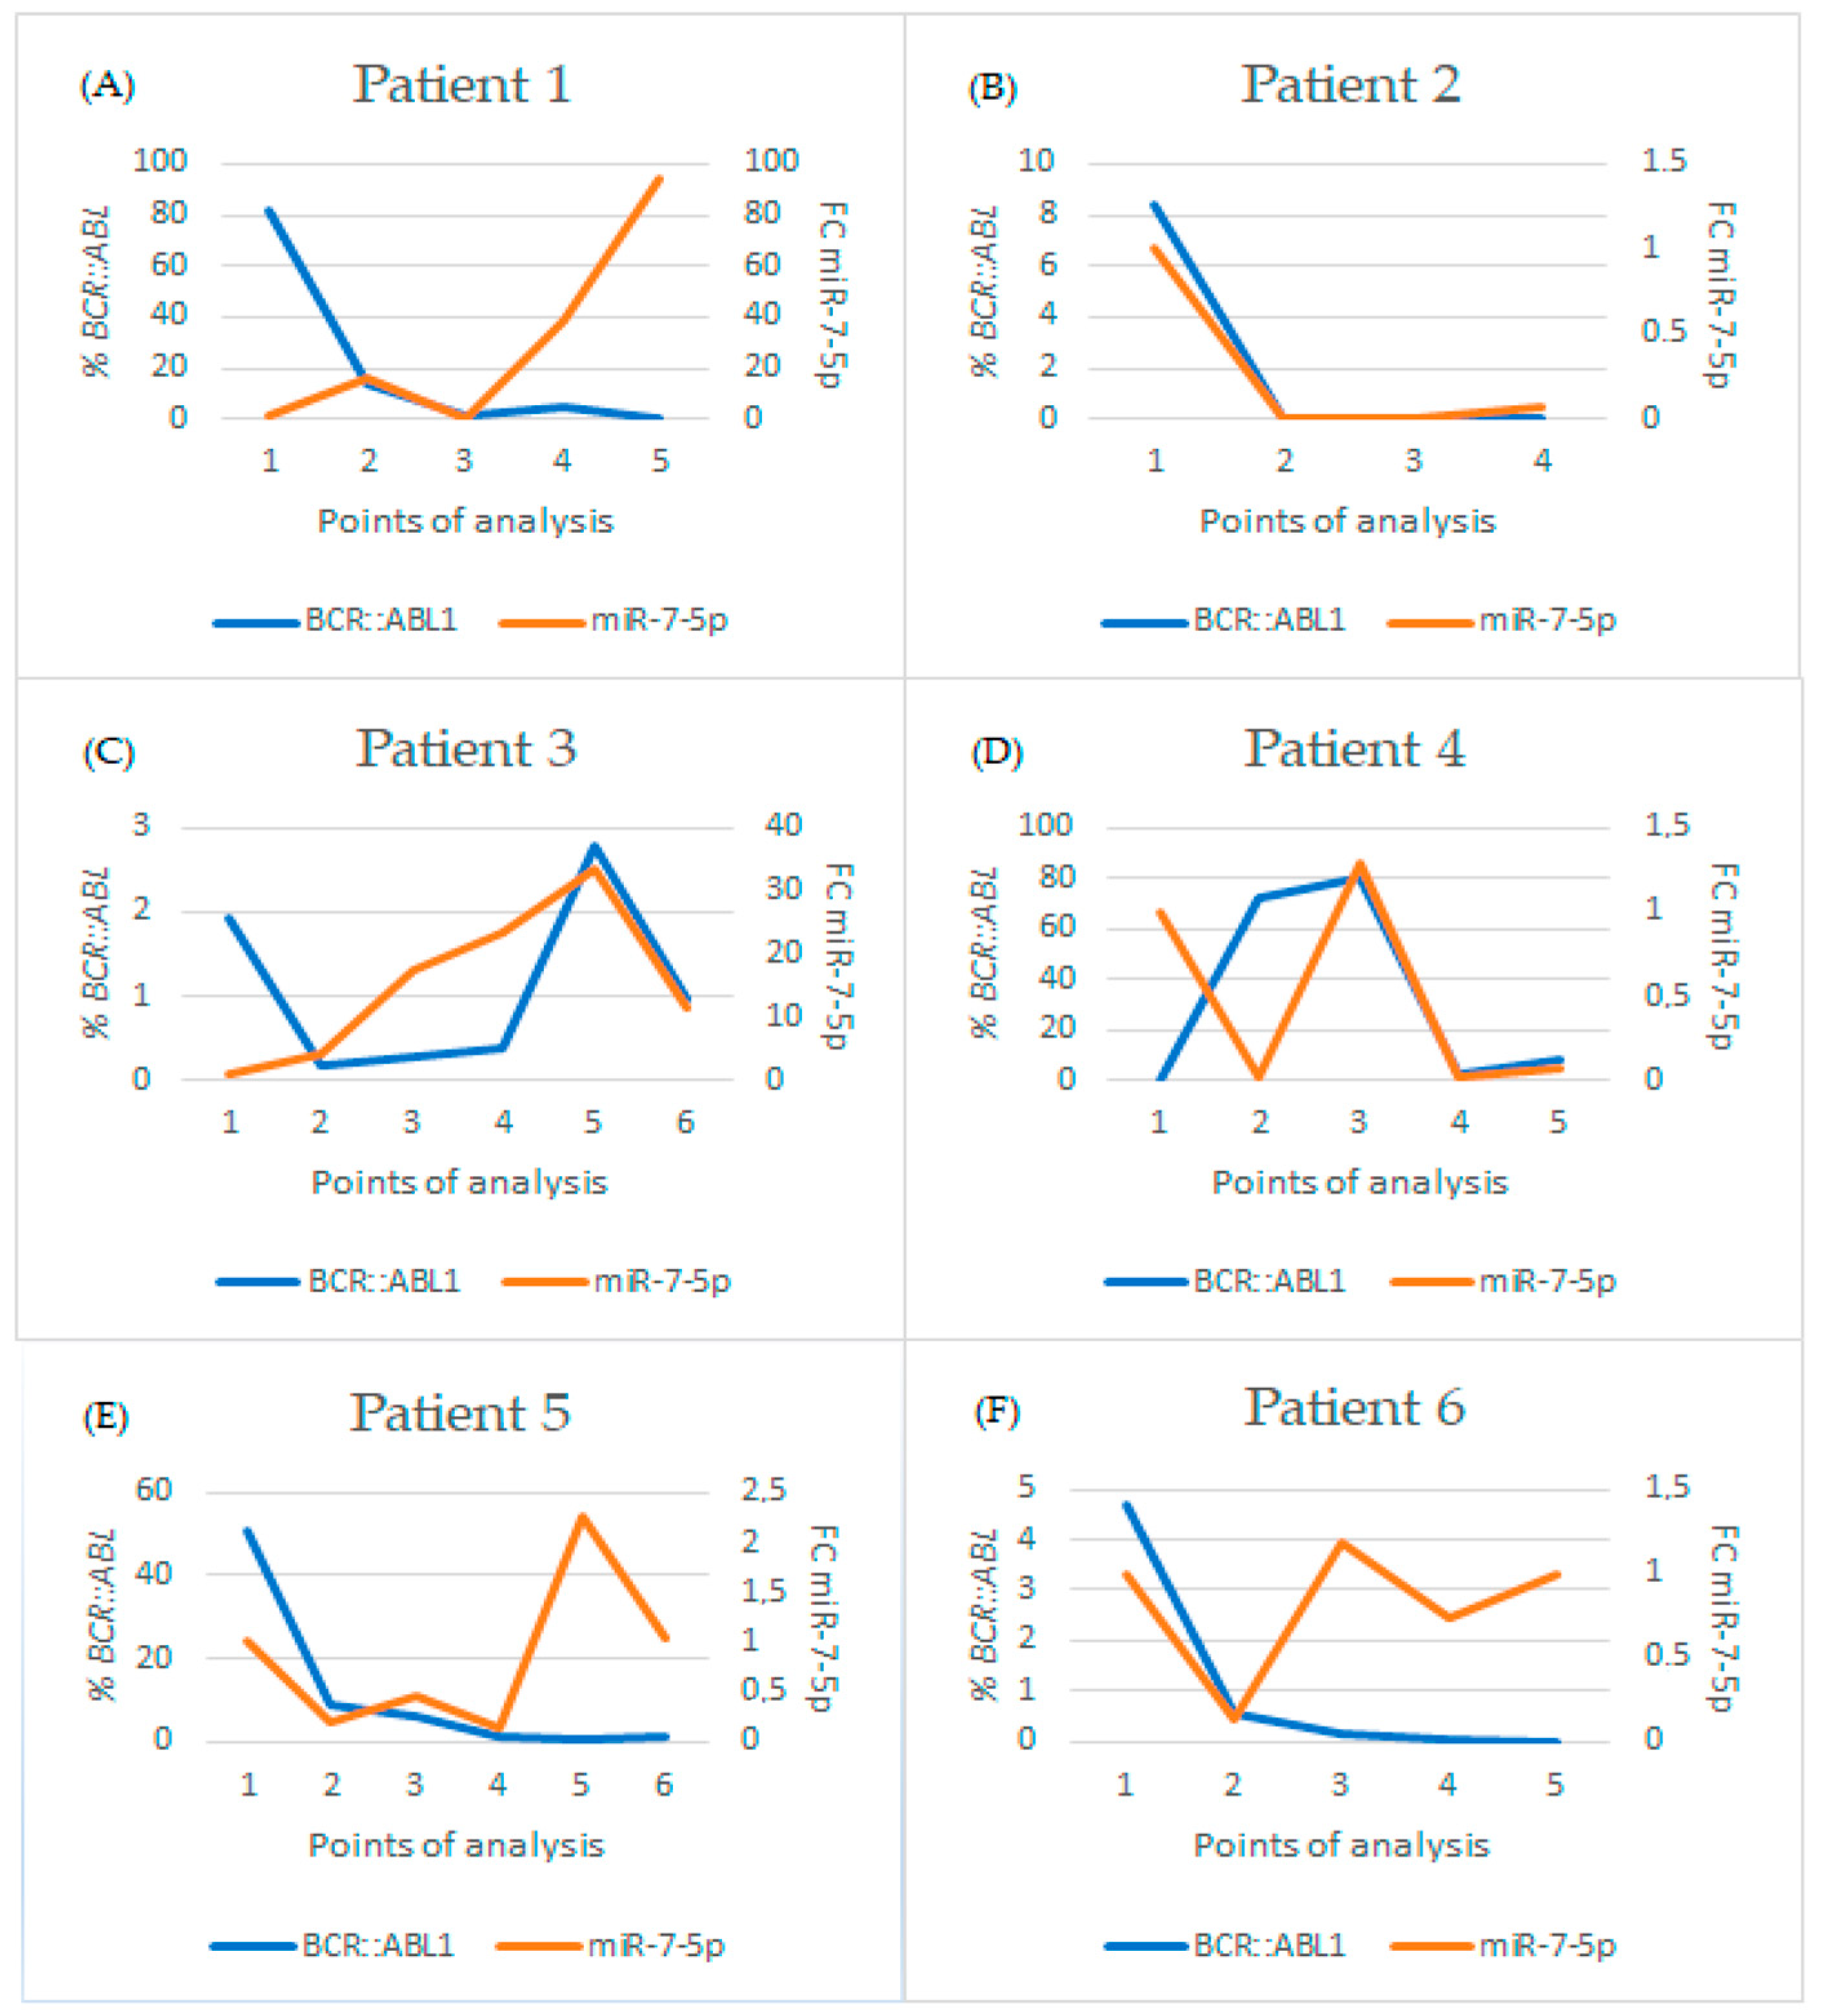
2.4. Follow-Up Analysis
2.4.1. Group 1: Patients Undergoing Treatment
2.4.2. Patients in Treatment-Free Remission
3. Discussion
4. Materials and Methods
4.1. Casuistry
4.2. Buffy Coat RNA Extraction
4.3. Quantification of BCR::ABL1
4.4. Synthesis of Endogenous cDNA from Buffy Coat Samples
4.5. Extraction of Plasma RNA
4.6. cDNA Synthesis of Free MicroRNAs in Plasma
4.7. Real-Time PCR of microRNAs
4.8. Statistical Analyses
5. Conclusions
Author Contributions
Funding
Institutional Review Board Statement
Informed Consent Statement
Data Availability Statement
Acknowledgments
Conflicts of Interest
References
- Zhang, X.T.; Dong, S.H.; Zhang, J.Y.; Shan, B. MicroRNA-577 Promotes the Sensitivity of Chronic Myeloid Leukemia Cells to Imatinib by Targeting NUP160. Eur. Rev. Med. Pharmacol. Sci. 2019, 23, 7008–7015. [Google Scholar]
- Luo, J.; Gao, Y.; Lin, X.; Guan, X. Systematic Analysis Reveals a Lncrna-Mirna-Mrna Network Associated with Dasatinib Resistance in Chronic Myeloid Leukemia. Ann. Palliat. Med. 2021, 10, 1727–1738. [Google Scholar] [CrossRef]
- Cumbo, C.; Anelli, L.; Specchia, G.; Albano, F. Monitoring of Minimal Residual Disease (Mrd) in Chronic Myeloid Leukemia: Recent Advances. Cancer Manag. Res. 2020, 12, 3175–3189. [Google Scholar] [CrossRef]
- Zhou, T.; Medeiros, L.J.; Hu, S. Chronic Myeloid Leukemia: Beyond BCR-ABL1. Curr. Hematol. Malig. Rep. 2018, 13, 435–445. [Google Scholar] [CrossRef] [PubMed]
- Osman, A.E.G.; Deininger, M.W. Chronic Myeloid Leukemia: Modern Therapies, Current Challenges and Future Directions. Blood Rev. 2021, 49, 100825. [Google Scholar] [CrossRef] [PubMed]
- Rencelj, A.; Gvozdenovic, N.; Cemazar, M. MitomiRs: Their Roles in Mitochondria and Importance in Cancer Cell Metabolism. Radiol. Oncol. 2021, 55, 379–392. [Google Scholar] [CrossRef] [PubMed]
- Anelli, L.; Zagaria, A.; Specchia, G.; Musto, P.; Albano, F. Dysregulation of Mirna in Leukemia: Exploiting Mirna Expression Profiles as Biomarkers. Int. J. Mol. Sci. 2021, 22, 7156. [Google Scholar] [CrossRef] [PubMed]
- Bhatnagar, B.; Garzon, R. Clinical Applications of MicroRNAs in Acute Myeloid Leukemia: A Mini-Review. Front. Oncol. 2021, 11, 679022. [Google Scholar] [CrossRef] [PubMed]
- Wallace, J.A.; O’Connell, R.M. MicroRNAs and Acute Myeloid Leukemia: Therapeutic Implications and Emerging Concepts. Blood 2017, 130, 1290–1301. [Google Scholar] [CrossRef] [PubMed]
- Scherr, M.; Elder, A.; Battmer, K.; Barzan, D.; Bomken, S.; Ricke-Hoch, M.; Schröder, A.; Venturini, L.; Blair, H.J.; Vormoor, J.; et al. Differential Expression of MiR-17~92 Identifies BCL2 as a Therapeutic Target in BCR-ABL-Positive B-Lineage Acute Lymphoblastic Leukemia. Leukemia 2014, 28, 554–565. [Google Scholar] [CrossRef]
- Mian, Y.A.; Zeleznik-Le, N.J. The MiR-17~92 Cluster Contributes to MLL Leukemia through the Repression of MEIS1 Competitor PKNOX1. Leuk. Res. 2016, 46, 51–60. [Google Scholar] [CrossRef]
- Mi, S.; Li, Z.; Chen, P.; He, C.; Cao, D.; Elkahloun, A.; Lu, J.; Pelloso, L.A.; Wunderlich, M.; Huang, H.; et al. Aberrant Overexpression and Function of the MiR-17-92 Cluster in MLL-Rearranged Acute Leukemia. Proc. Natl. Acad. Sci. USA 2010, 107, 3710–3715. [Google Scholar] [CrossRef]
- Chocholska, S.; Zarobkiewicz, M.; Szymańska, A.; Lehman, N.; Woś, J.; Bojarska-Junak, A. Prognostic Value of the MiR-17~92 Cluster in Chronic Lymphocytic Leukemia. Int. J. Mol. Sci. 2023, 24, 1705. [Google Scholar] [CrossRef]
- Wang, X.; Gao, X.; Tian, J.; Zhang, R.; Qiao, Y.; Hua, X.; Shi, G. LINC00261 Inhibits Progression of Pancreatic Cancer by Down-Regulating MiR-23a-3p. Arch. Biochem. Biophys. 2020, 689, 108469. [Google Scholar] [CrossRef] [PubMed]
- Quan, J.; Pan, X.; Li, Y.; Hu, Y.; Tao, L.; Li, Z.; Zhao, L.; Wang, J.; Li, H.; Lai, Y.; et al. MiR-23a-3p Acts as an Oncogene and Potential Prognostic Biomarker by Targeting PNRC2 in RCC. Biomed. Pharmacother. 2019, 110, 656–666. [Google Scholar] [CrossRef] [PubMed]
- Lee, Y.; Kim, S.J.; Choo, J.; Heo, G.; Yoo, J.-W.; Jung, Y.; Rhee, S.H.; Im, E. MiR-23a-3p Is a Key Regulator of IL-17C-Induced Tumor Angiogenesis in Colorectal Cancer. Cells 2020, 9, 1363. [Google Scholar] [CrossRef] [PubMed]
- Yang, M.; Xiao, R.; Wang, X.; Xiong, Y.; Duan, Z.; Li, D.; Kan, Q. MiR-93-5p Regulates Tumorigenesis and Tumor Immunity by Targeting PD-L1/CCND1 in Breast Cancer. Ann. Transl. Med. 2022, 10, 203. [Google Scholar] [CrossRef]
- Xiang, Y.; Liao, X.-H.; Yu, C.-X.; Yao, A.; Qin, H.; Li, J.-P.; Hu, P.; Li, H.; Guo, W.; Gu, C.-J.; et al. MiR-93-5p Inhibits the EMT of Breast Cancer Cells via Targeting MKL-1 and STAT3. Exp. Cell Res. 2017, 357, 135–144. [Google Scholar] [CrossRef]
- Jia, J.; Zhang, X.; Zhan, D.; Li, J.; Li, Z.; Li, H.; Qian, J. LncRNA H19 Interacted with MiR-130a-3p and MiR-17-5p to Modify Radio-Resistance and Chemo-Sensitivity of Cardiac Carcinoma Cells. Cancer Med. 2019, 8, 1604–1618. [Google Scholar] [CrossRef]
- Klümper, T.; Bruckmueller, H.; Diewock, T.; Kaehler, M.; Haenisch, S.; Pott, C.; Bruhn, O.; Cascorbi, I. Expression Differences of MiR-142-5p between Treatment-Naïve Chronic Myeloid Leukemia Patients Responding and Non-Responding to Imatinib Therapy Suggest a Link to Oncogenic ABL2, SRI, CKIT and MCL1 Signaling Pathways Critical for Development of Therapy Resistance. Exp. Hematol. Oncol. 2020, 9, 26. [Google Scholar] [CrossRef]
- Galka-Marciniak, P.; Kanduła, Z.; Tire, A.; Wegorek, W.; Gwozdz-Bak, K.; Handschuh, L.; Giefing, M.; Lewandowski, K.; Kozlowski, P. Mutations in the MiR-142 Gene Are Not Common in Myeloproliferative Neoplasms. Sci. Rep. 2022, 12, 10924. [Google Scholar] [CrossRef] [PubMed]
- Jiang, X.; Jing, Y.; Lei, L.; Peng, M.; Xiao, Q.; Ren, J.; Tao, Y.; Huang, J.; Zhang, L. [MiR-148b-3p Inhibits the Proliferation and Autophagy of Acute Myeloid Leukemia Cells by Targeting ATG14]. Xi Bao Yu Fen. Zi Mian Yi Xue Za Zhi 2021, 37, 881–890. [Google Scholar] [PubMed]
- Yuan, L.; Liu, Y.; Qu, Y.; Liu, L.; Li, H. Exosomes Derived From MicroRNA-148b-3p-Overexpressing Human Umbilical Cord Mesenchymal Stem Cells Restrain Breast Cancer Progression. Front. Oncol. 2019, 9, 1076. [Google Scholar] [CrossRef]
- Yin, J.; Hou, P.; Wu, Z.; Wang, T.; Nie, Y. Circulating MiR-375 and MiR-199a-3p as Potential Biomarkers for the Diagnosis of Hepatocellular Carcinoma. Tumor Biol. 2015, 36, 4501–4507. [Google Scholar] [CrossRef] [PubMed]
- Liu, X.; Cui, M.-M.; Zhu, H.-Z.; Fu, P.-Y.; Wang, G.-C.; Huang, L. MiR-199a-3p Overexpression Suppressed Cell Proliferation and Sensitized Chronic Myeloid Leukaemia Cells to Imatinib by Inhibiting MTOR Signalling. Acta Haematol. 2022, 145, 484–498. [Google Scholar] [CrossRef]
- Feng, D.D.; Zhang, H.; Zhang, P.; Zheng, Y.S.; Zhang, X.J.; Han, B.W.; Luo, X.Q.; Xu, L.; Zhou, H.; Qu, L.H.; et al. Down-Regulated MiR-331-5p and MiR-27a Are Associated with Chemotherapy Resistance and Relapse in Leukaemia. J. Cell Mol. Med. 2011, 15, 2164–2175. [Google Scholar] [CrossRef]
- Wang, X.; Tang, S.; Le, S.-Y.; Lu, R.; Rader, J.S.; Meyers, C.; Zheng, Z.-M. Aberrant Expression of Oncogenic and Tumor-Suppressive MicroRNAs in Cervical Cancer Is Required for Cancer Cell Growth. PLoS ONE 2008, 3, e2557. [Google Scholar] [CrossRef]
- Wei, R.; Huang, G.-L.; Zhang, M.-Y.; Li, B.-K.; Zhang, H.-Z.; Shi, M.; Chen, X.-Q.; Huang, L.; Zhou, Q.-M.; Jia, W.-H.; et al. Clinical Significance and Prognostic Value of MicroRNA Expression Signatures in Hepatocellular Carcinoma. Clin. Cancer Res. 2013, 19, 4780–4791. [Google Scholar] [CrossRef]
- Kristina Gregory, N.; Hema Sundar, M.; Drazer, M.; Maness, L.; Fred and Pamela Buffett Cancer Center Leland Metheny; Mohan, S.; Moore, J.O.; Oehler, V.; Pratz, K.; Pusic, I.; et al. NCCN Guidelines Version 2.2024 Chronic Myeloid Leukemia Continue NCCN Guidelines Panel Disclosures; National Comprehensive Cancer Network: Plymouth Meeting, PA, USA, 2023. [Google Scholar]
- Chakraborty, C.; Ranjan Sharma, A.; Patra, B.C.; Bhattacharya, M.; Sharma, G.; Lee, S.-S. MicroRNAs Mediated Regulation of MAPK Signaling Pathways in Chronic Myeloid Leukemia. Oncotarget 2016, 7, 42683. [Google Scholar] [CrossRef]
- Zhu, X.; Lin, Z.; Du, J.; Zhou, X.; Yang, L.; Liu, G. Studies on MicroRNAs That Are Correlated with the Cancer Stem Cells in Chronic Myeloid Leukemia. Mol. Cell Biochem. 2014, 390, 75–84. [Google Scholar] [CrossRef] [PubMed]
- Li, G.; Gao, L.; Zhao, J.; Liu, D.; Li, H.; Hu, M. LncRNA ANRIL/MiR-7-5p/TCF4 Axis Contributes to the Progression of T Cell Acute Lymphoblastic Leukemia. Cancer Cell Int. 2020, 20, 335. [Google Scholar] [CrossRef]
- Morales-Martinez, M.; Vega, G.G.; Neri, N.; Nambo, M.J.; Alvarado, I.; Cuadra, I.; Duran-Padilla, M.A.; Huerta-Yepez, S.; Vega, M.I. MicroRNA-7 Regulates Migration and Chemoresistance in Non-Hodgkin Lymphoma Cells Through Regulation of KLF4 and YY1. Front. Oncol. 2020, 10, 588893. [Google Scholar] [CrossRef]
- Ye, F. MicroRNA Expression and Activity in T-Cell Acute Lymphoblastic Leukemia. Oncotarget 2018, 9, 5445–5458. [Google Scholar] [CrossRef]
- Liu, H.; Huang, J.; Peng, J.; Wu, X.; Zhang, Y.; Zhu, W.; Guo, L. Upregulation of the Inwardly Rectifying Potassium Channel Kir2.1 (KCNJ2) Modulates Multidrug Resistance of Small-Cell Lung Cancer under the Regulation of MiR-7 and the Ras/MAPK Pathway. Mol. Cancer 2015, 14, 59. [Google Scholar] [CrossRef]
- Sun, X.; Li, J.; Sun, Y.; Zhang, Y.; Dong, L.; Shen, C.; Yang, L.; Yang, M.; Li, Y.; Shen, G.; et al. MiR-7 Reverses the Resistance to BRAFi in Melanoma by Targeting EGFR/IGF-1R/CRAF and Inhibiting the MAPK and PI3K/AKT Signaling Pathways. Oncotarget 2016, 7, 53558–53570. [Google Scholar] [CrossRef]
- Luo, H.; Liang, H.; Chen, Y.; Chen, S.; Xu, Y.; Xu, L.; Liu, J.; Zhou, K.; Peng, J.; Guo, G.; et al. MiR-7-5p Overexpression Suppresses Cell Proliferation and Promotes Apoptosis through Inhibiting the Ability of DNA Damage Repair of PARP-1 and BRCA1 in TK6 Cells Exposed to Hydroquinone. Chem. Biol. Interact. 2018, 283, 84–90. [Google Scholar] [CrossRef] [PubMed]
- Cheng, J.; Guo, S.; Chen, S.; Mastriano, S.J.; Liu, C.; D’Alessio, A.C.; Hysolli, E.; Guo, Y.; Yao, H.; Megyola, C.M.; et al. An Extensive Network of TET2-Targeting MicroRNAs Regulates Malignant Hematopoiesis. Cell Rep. 2013, 5, 471–481. [Google Scholar] [CrossRef] [PubMed]
- Jiang, M.; Dai, J.; Gu, D.; Huang, Q.; Tian, L. MicroRNA-7 Inhibits Cell Proliferation of Chronic Myeloid Leukemia and Sensitizes It to Imatinib In Vitro. Biochem. Biophys. Res. Commun. 2017, 494, 372–378. [Google Scholar] [CrossRef] [PubMed]
- Marin, A.M.; Wosniaki, D.K.; Sanchuki, H.B.S.; Munhoz, E.C.; Nardin, J.M.; Soares, G.S.; Espinace, D.C.; Farias, J.S.d.H.; Veroneze, B.; Becker, L.F.; et al. Molecular BCR::ABL1 Quantification and ABL1 Mutation Detection as Essential Tools for the Clinical Management of Chronic Myeloid Leukemia Patients: Results from a Brazilian Single-Center Study. Int. J. Mol. Sci. 2023, 24, 10118. [Google Scholar] [CrossRef] [PubMed]
- Pfaffl, M.W. A New Mathematical Model for Relative Quantification in Real-Time RT-PCR. Nucleic Acids Res. 2001, 29, e45. [Google Scholar] [CrossRef] [PubMed]

| Group | BCR::ABL1 | Sex | Treatment Time in Months (Mean ± Deviation) | Age (Mean ± Deviation) | Age Differences between Groups (p Value and Significance) | |||
|---|---|---|---|---|---|---|---|---|
| M | F | High vs. ND | High vs. HC | ND vs. HC | ||||
| 1 | High | 18 | 12 | 15.3 ± 29.4 | 50.4 ± 20.7 | 0.1291 | >0.9999 | 0.1606 |
| 2 | ND | 10 | 10 | 54 ± 23.6 | 62 ± 13.4 | ns | ns | ns |
| 3 | HC | 10 | 10 | - | 51.8 ± 6.9 | - | - | - |
| miRNA | General Rank | Multiple Comparisons (p Value) | Mean ± Deviation | ||||
|---|---|---|---|---|---|---|---|
| High vs. ND | High vs. HC | ND vs. HC | High | ND | HC | ||
| miR-93-5p | 0.9979 | >0.9999 | >0.9999 | >0.9999 | 12.1 ± 37.1 | 1.8 ± 2.2 | 5.6 ± 18.8 |
| miR-23a-3p | 0.8934 | >0.9999 | >0.9999 | >0.9999 | 9.3 ± 28.1 | 1.1 ± 1.6 | 1.2 ± 2.6 |
| miR-199a-3p | 0.9534 | >0.9999 | >0.9999 | >0.9999 | 12.2 ± 38.6 | 1.9 ± 2.6 | 3.1 ± 8.05 |
| miR-17-5p | 0.9005 | >0.9999 | >0.9999 | >0.9999 | 1.5 ± 3.5 | 0.4 ± 0.8 | 0.6 ± 1.7 |
| miR-148b-3p | 0.5818 | >0.9999 | 0.9747 | >0.9999 | 19.8 ± 54.4 | 4.5 ± 7.9 | 10.3 ± 35.5 |
| miR-142-5p | 0.5077 | >0.9999 | >0.9999 | >0.9999 | 1.9 ± 1.0 | 12.1 ± 15.9 | 21.3 ± 51.0 |
| miR-130a-3p | 0.8636 | >0.9999 | >0.9999 | >0.9999 | 248.3 ± 653.1 | 60.9 ± 136.7 | 122.3 ± 410.9 |
| miR-331-5p | 0.5376 | >0.9999 | >0.9999 | 0.7997 | 3.7 ± 1.3 | 2.4 ± 5.7 | 5.1 ± 2.0 |
| miRNA | General Rank (p Value) | Mean ± Deviation | ||
|---|---|---|---|---|
| Mann-Whitney | Significance | High | HC | |
| miR-7-5p | 0.2475 | ns | 1.6 ± 1.7 | 0.6 ± 0.3 |
| miR-19b-3p | 0.9118 | ns | 10.1 ± 18.2 | 3.3 ± 3.1 |
| miR-20a-5p | 0.8534 | ns | 2.9 ± 5.0 | 1.2 ± 0.9 |
| miR-21-5p | 0.6842 | ns | 7.9 ± 13.2 | 2.6 ± 2.3 |
| miR-25-3p | 0.9118 | ns | 1.9 ± 3.7 | 0.8 ± 0.7 |
| miR-27b-3p | 0.8534 | ns | 13.7 ± 24.4 | 4.3 ± 3.8 |
| miR-29a-3p | 0.9705 | ns | 7.6 ± 12.5 | 2.2 ± 1.7 |
| miR-29b-3p | >0.9999 | ns | 6.4 ± 10.8 | 1.8 ± 1.3 |
| miR-92a-1-5p | 0.0220 | s | 3.2 ± 2.5 | 0.7 ± 0.5 |
| miR-103a-3p | 0.7394 | ns | 4.2 ± 7.4 | 1.2 ± 1.4 |
| miR-106b-5p | 0.9705 | ns | 3.3 ± 5.4 | 1.5 ± 1.2 |
| miR-122-5p | 0.4813 | ns | 1.4 ± 2.2 | 2.4 ± 3.6 |
| miR-125b-5p | 0.6842 | ns | 2.0 ± 3.5 | 1.2 ± 1.2 |
| miR-130a-5p | No amplification | ns | - | - |
| miR-150-5p | 0.6305 | ns | 3.7 ± 9.6 | 0.8 ± 0.5 |
| miR-155-5p | 0.4173 | ns | 42.3 ± 99.2 | 30.2 ± 45.9 |
| miR-186-5p | 0.5787 | ns | 4.3 ± 7.7 | 1.9 ± 1.8 |
| miR-192-5p | 0.5787 | ns | 3.2 ± 3.9 | 1.5 ± 1.0 |
| miR-193b-3p | 0.6048 | ns | 1.3 ± 1.6 | 0.9 ± 1.0 |
| miR-205-5p | 0.2176 | ns | 5.5 ± 6.2 | 2.1 ± 1.1 |
| miR-214-5p | No amplification | ns | - | - |
| miR-221-3p | 0.7394 | ns | 6.7 ± 10.7 | 1.8 ± 1.5 |
| miR-221-5p | 0.8125 | ns | 24.2 ± 51.1 | 5.3 ± 6.6 |
| miR-361-5p | 0.4359 | ns | 6.8 ± 10.3 | 2.6 ± 3.2 |
| miR-451 | >0.9999 | ns | 1.9 ± 3.2 | 0.7 ± 0.4 |
| miR-486-5p | 0.6305 | ns | 2.1 ± 3.7 | 0.8 ± 0.6 |
| miR-494-3p | 0.8286 | ns | 36.6 ± 72.0 | 16.1 ± 17.4 |
| miRNA | General Rank | Mean ± Deviation | ||
|---|---|---|---|---|
| Mann-Whitney | Significance | High | HC | |
| miR-92a-1-5p | 0.057 | ns | 909.1 ± 4049.7 | 1.7 ± 5.1 |
| miR-7-5p | 0.0353 | s | 2.6 ± 3.1 | 9.5 ± 39.2 |
| miR-486-5p | 0.0829 | ns | 3.6 ± 5.8 | 6.2 ± 23.8 |
| miR-361-5p | 0.1494 | ns | 16.4 ± 36.4 | 7.4 ± 19.7 |
| miRNA | General Rank | Multiple Comparisons | Mean ± Deviation | ||||
|---|---|---|---|---|---|---|---|
| High vs. ND | High vs. HC | ND vs. HC | High | ND | HC | ||
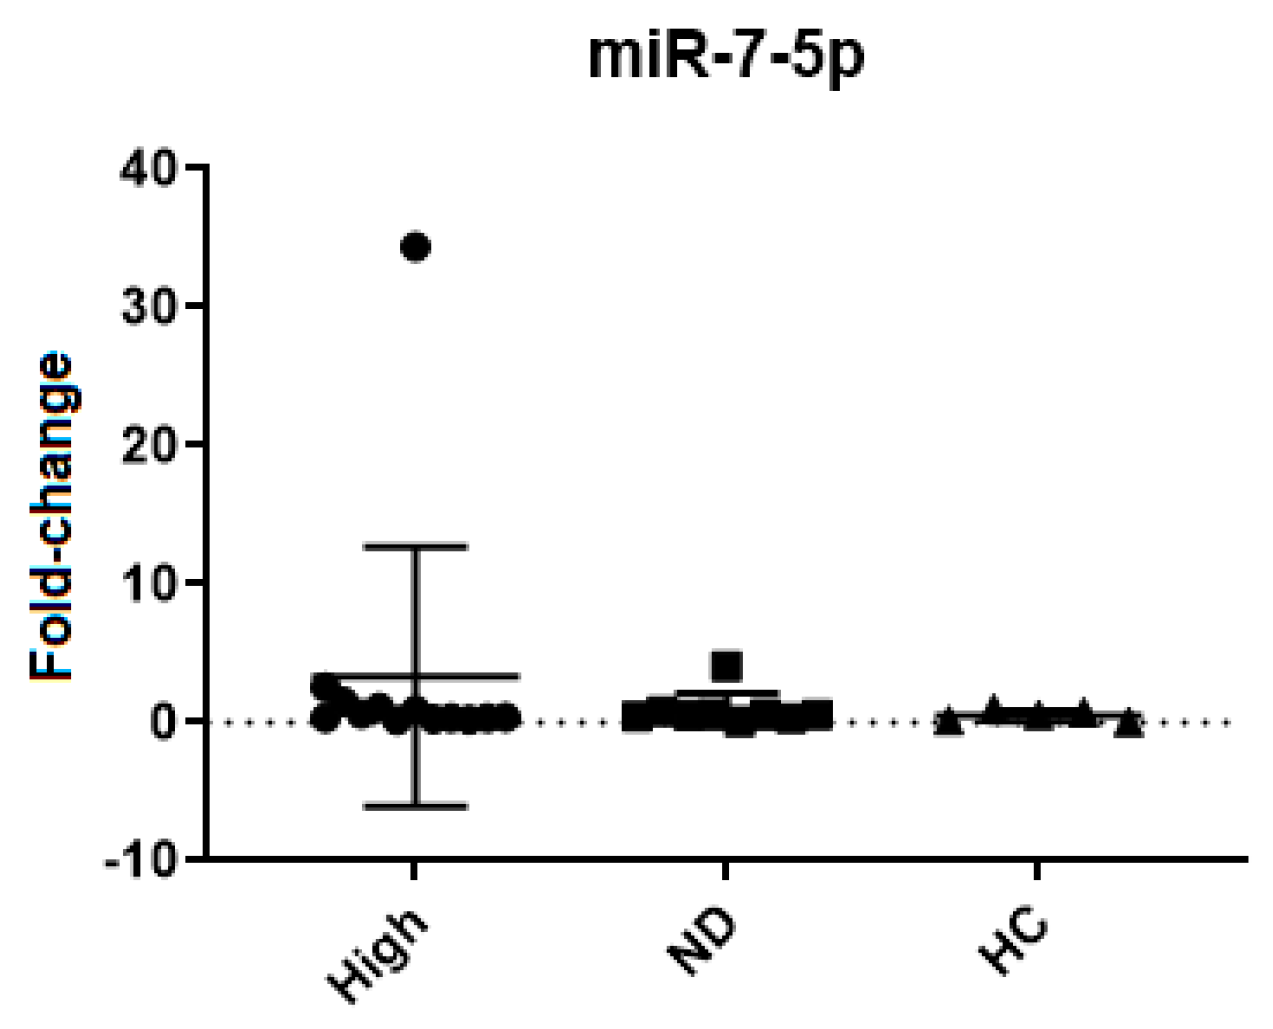
| miR-7-5p | 0.7897 | >0.9999 | >0.9999 | >0.9999 | 3.3 ± 9.3 | 0.9 ± 1.2 | 0.5 ± 0.4 |
| Months of Treatment | BCR::ABL1 % | FC miR-7-5p | Treatment | ||
|---|---|---|---|---|---|
| Patient 1 | 0 | Point 1 | 81.74 | 1 | Imatinib |
| 4 | Point 2 | 13.68 | 15.637 | Imatinib | |
| 12 | Point 3 | 1.854 | 0.282 | Imatinib | |
| 14 | Point 4 | 5.291 | 38.241 | Imatinib | |
| 5 | Point 5 | 0 | 93.641 | Dasatinib | |
| Patient 2 | 3 | Point 1 | 8.39 | 1 | Imatinib |
| 6 | Point 2 | 0.000 | 0.003 | Imatinib | |
| 11 | Point 3 | 0.003 | 0.013 | Imatinib | |
| 15 | Point 4 | 0 | 0.068 | Imatinib | |
| Patient 3 | 8 | Point 1 | 1.943 | 1 | Imatinib |
| 18 | Point 2 | 0.179 | 3.985 | Imatinib | |
| 21 | Point 3 | 0.268 | 1.624 | Imatinib | |
| 23 | Point 4 | 0.364 | 23.589 | Imatinib | |
| 26 | Point 5 | 2.774 | 33.697 | Imatinib | |
| 27 | Point 6 | 0.96 | 11.446 | Imatinib | |
| Patient 4 | 0 | Point 1 | 0.143 | 1 | Imatinib |
| 6 | Point 2 | 72.738 | 0.020 | Imatinib | |
| 9 | Point 3 | 80.616 | 1.290 | Imatinib | |
| 3 | Point 4 | 2.239 | 0.025 | Dasatinib | |
| 5 | Point 5 | 8.192 | 0.071 | Dasatinib | |
| Patient 5 | 0 | Point 1 | 50.64 | 1 | Imatinib |
| 3 | Point 2 | 9.138 | 0.208 | Imatinib | |
| 6 | Point 3 | 6.288 | 0.447 | Imatinib | |
| 15 | Point 4 | 1.202 | 0.133 | Imatinib | |
| 22 | Point 5 | 0.902 | 2.251 | Imatinib | |
| 24 | Point 6 | 1.159 | 1.028 | Imatinib | |
| Patient 6 | 6 | Point 1 | 4.67 | 1 | Imatinib |
| 13 | Point 2 | 0.578 | 0.140 | Imatinib | |
| 16 | Point 3 | 0.141 | 1.188 | Imatinib | |
| 20 | Point 4 | 0.033 | 0.733 | Imatinib | |
| 29 | Point 5 | 0.000 | 1.002 | Imatinib |
| Time | FC miR-7-5p | ||
|---|---|---|---|
| Patient 1 | Point 1 | Pause | 1 |
| Point 2 | 2/3 months | 0.849 | |
| Point 3 | 5/6 months | 2.350 | |
| Point 4 | 14 months | 1.810 | |
| Point 5 | 20 months | 0.682 | |
| Patient 2 | Point 1 | In treatment | 1 |
| Point 2 | 5/6 months | 0.253 | |
| Point 3 | 11/12 months | 0.351 | |
| Point 4 | 14 months | 0.410 | |
| Patient 3 | Point 1 | In treatment | 1 |
| Point 2 | 1 month | 0.150 | |
| Point 3 | 2/3 months | 0.200 | |
| Point 4 | 5/6 months | 0.505 | |
| Point 5 | 7–10 months | 0.299 | |
| Point 6 | 11/12 months | 0.458 | |
| Point 7 | 14 months | 0.504 | |
| Patient 4 | Point 1 | In treatment | 1 |
| Point 2 | 1 months | 0.196 | |
| Point 3 | 2/3 months | 0.282 | |
| Point 4 | 5/6 months | 0.462 | |
| Point 5 | 5/6 months | 0.248 | |
| Point 6 | 5/6 months | 0.209 | |
| Point 7 | 7–10 months | 0.222 | |
| Point 8 | 7–10 months | 1.472 | |
| Point 9 | 7–10 months | 0.027 | |
| Point 10 | 11/12 months | 0.100 |
Disclaimer/Publisher’s Note: The statements, opinions and data contained in all publications are solely those of the individual author(s) and contributor(s) and not of MDPI and/or the editor(s). MDPI and/or the editor(s) disclaim responsibility for any injury to people or property resulting from any ideas, methods, instructions or products referred to in the content. |
© 2024 by the authors. Licensee MDPI, Basel, Switzerland. This article is an open access article distributed under the terms and conditions of the Creative Commons Attribution (CC BY) license (https://creativecommons.org/licenses/by/4.0/).
Share and Cite
Wosniaki, D.K.; Marin, A.M.; Oliveira, R.N.; Koerich, G.M.; Munhoz, E.C.; Farias, J.S.d.H.; Beltrame, M.P.; Zanette, D.L.; Aoki, M.N. The Screening of microRNAs in Chronic Myeloid Leukemia: A Clinical Evaluation. Int. J. Mol. Sci. 2024, 25, 3363. https://doi.org/10.3390/ijms25063363
Wosniaki DK, Marin AM, Oliveira RN, Koerich GM, Munhoz EC, Farias JSdH, Beltrame MP, Zanette DL, Aoki MN. The Screening of microRNAs in Chronic Myeloid Leukemia: A Clinical Evaluation. International Journal of Molecular Sciences. 2024; 25(6):3363. https://doi.org/10.3390/ijms25063363
Chicago/Turabian StyleWosniaki, Denise Kusma, Anelis Maria Marin, Rafaela Noga Oliveira, Gabriela Marino Koerich, Eduardo Cilião Munhoz, João Samuel de Holanda Farias, Miriam Perlingeiro Beltrame, Dalila Luciola Zanette, and Mateus Nóbrega Aoki. 2024. "The Screening of microRNAs in Chronic Myeloid Leukemia: A Clinical Evaluation" International Journal of Molecular Sciences 25, no. 6: 3363. https://doi.org/10.3390/ijms25063363
APA StyleWosniaki, D. K., Marin, A. M., Oliveira, R. N., Koerich, G. M., Munhoz, E. C., Farias, J. S. d. H., Beltrame, M. P., Zanette, D. L., & Aoki, M. N. (2024). The Screening of microRNAs in Chronic Myeloid Leukemia: A Clinical Evaluation. International Journal of Molecular Sciences, 25(6), 3363. https://doi.org/10.3390/ijms25063363