
Physiological and Molecular Modulations to Drought Stress in the Brassica Species

 , ,
, , 
Abstract
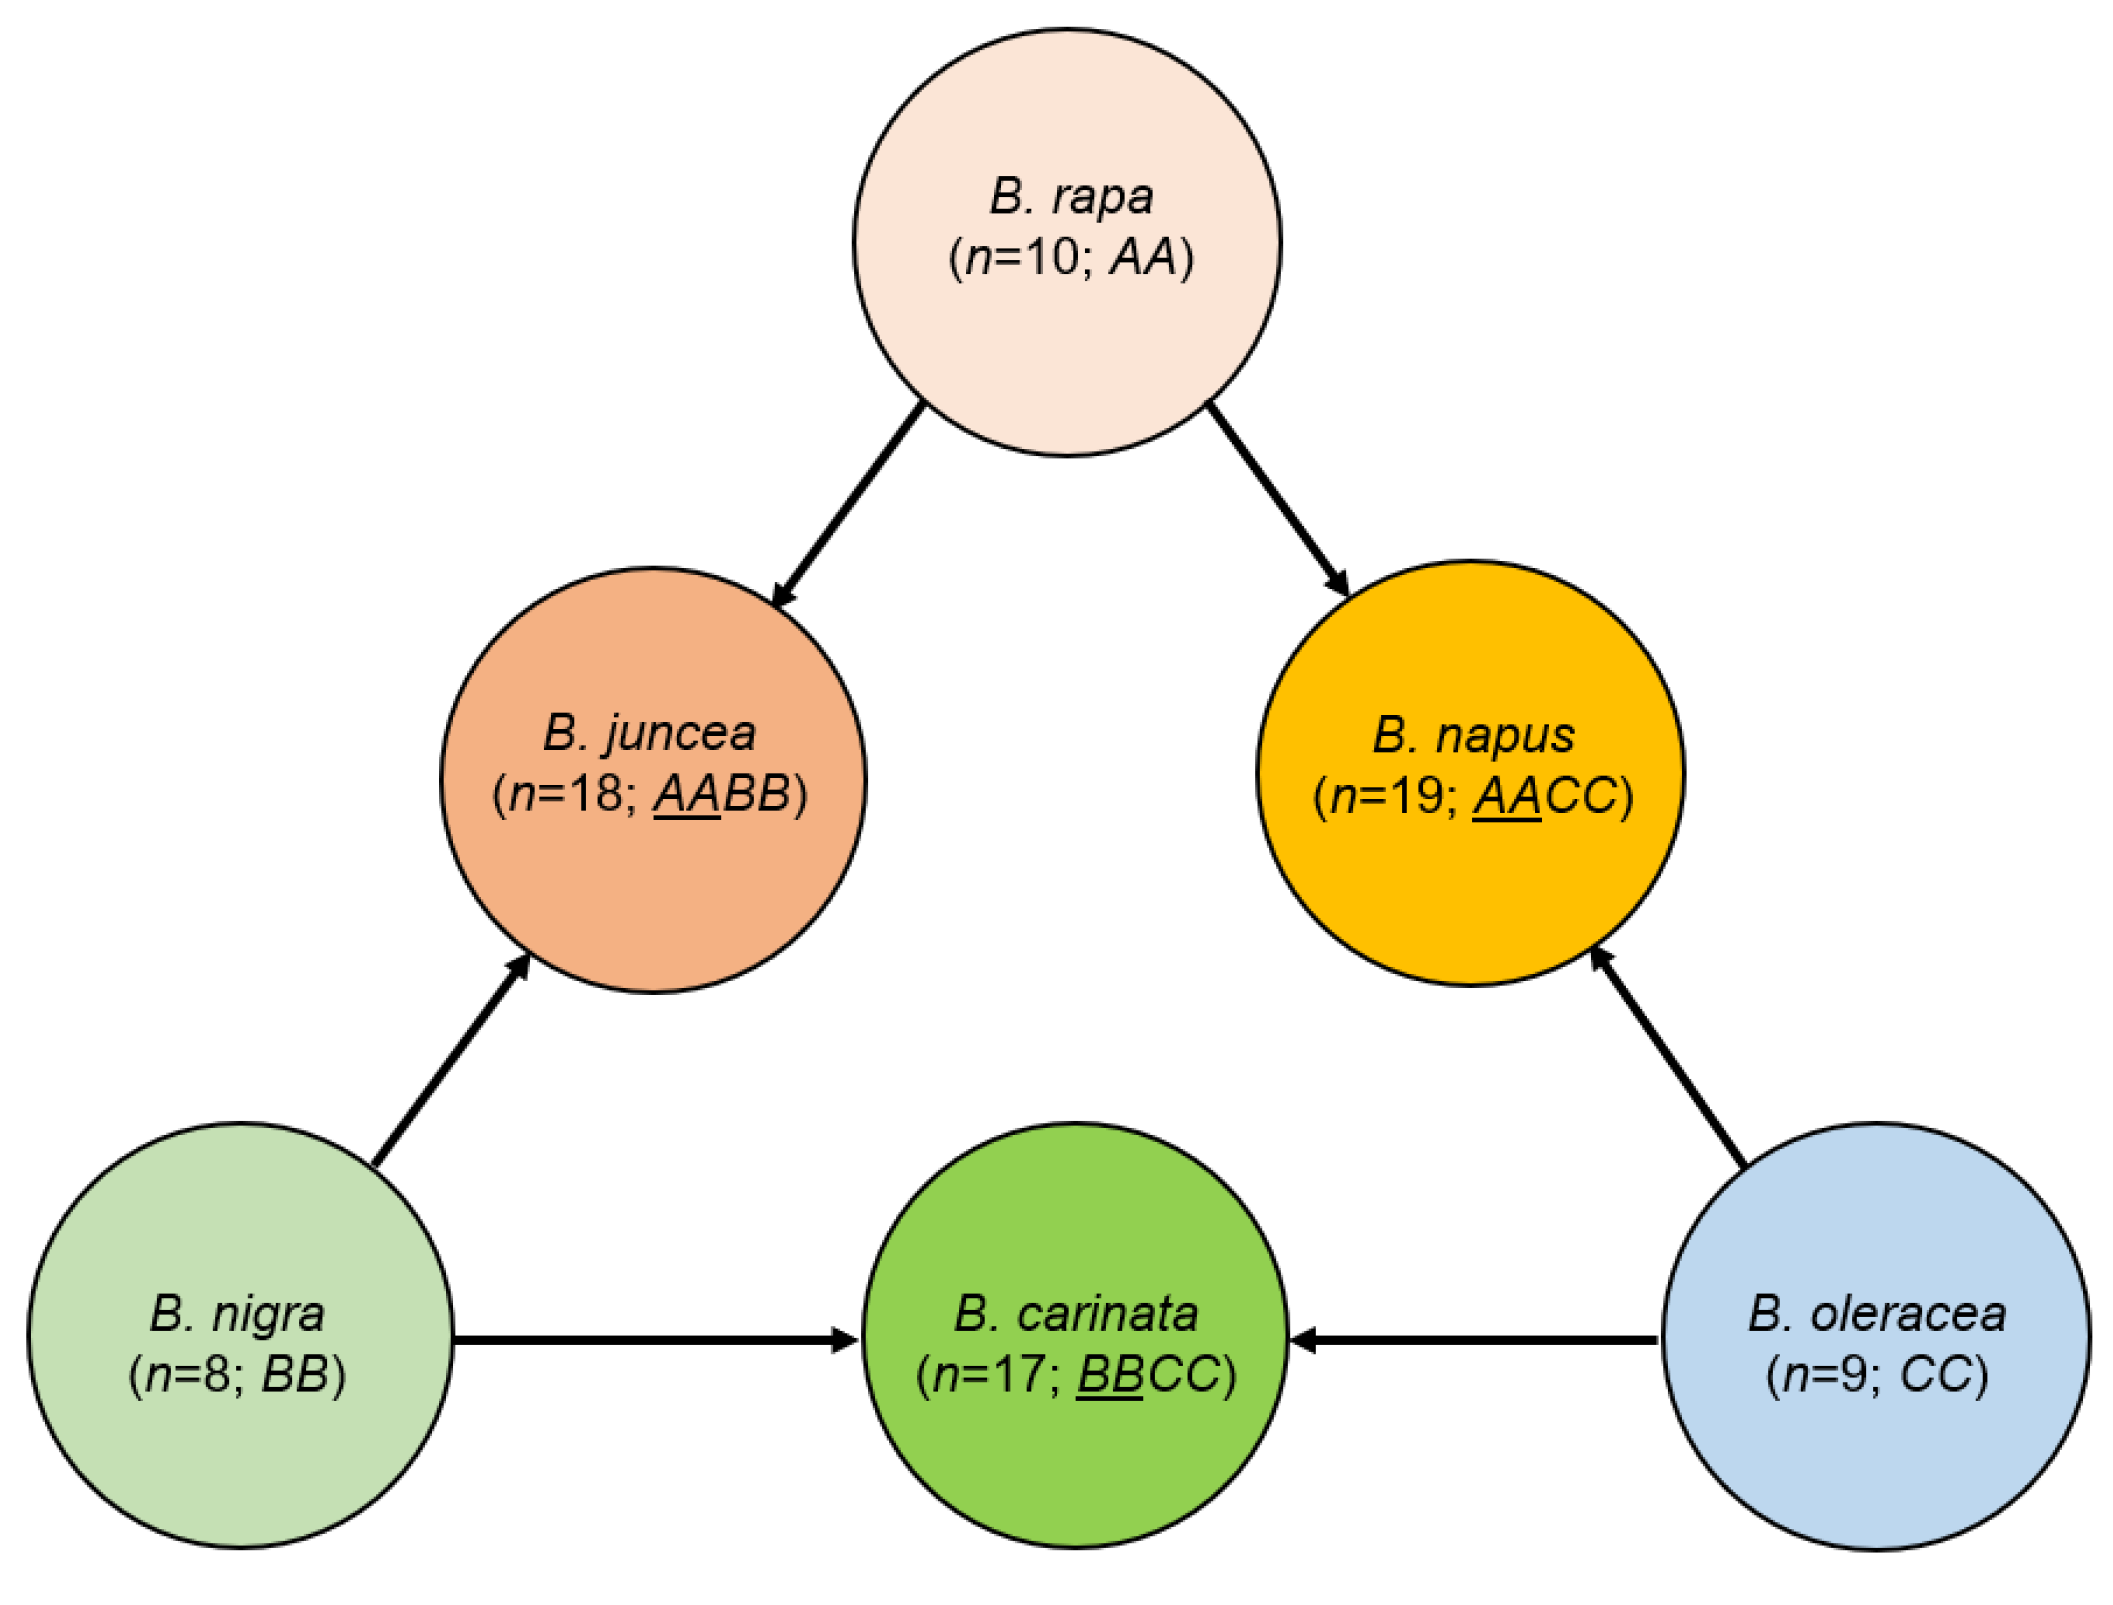
1. Introduction
2. Results
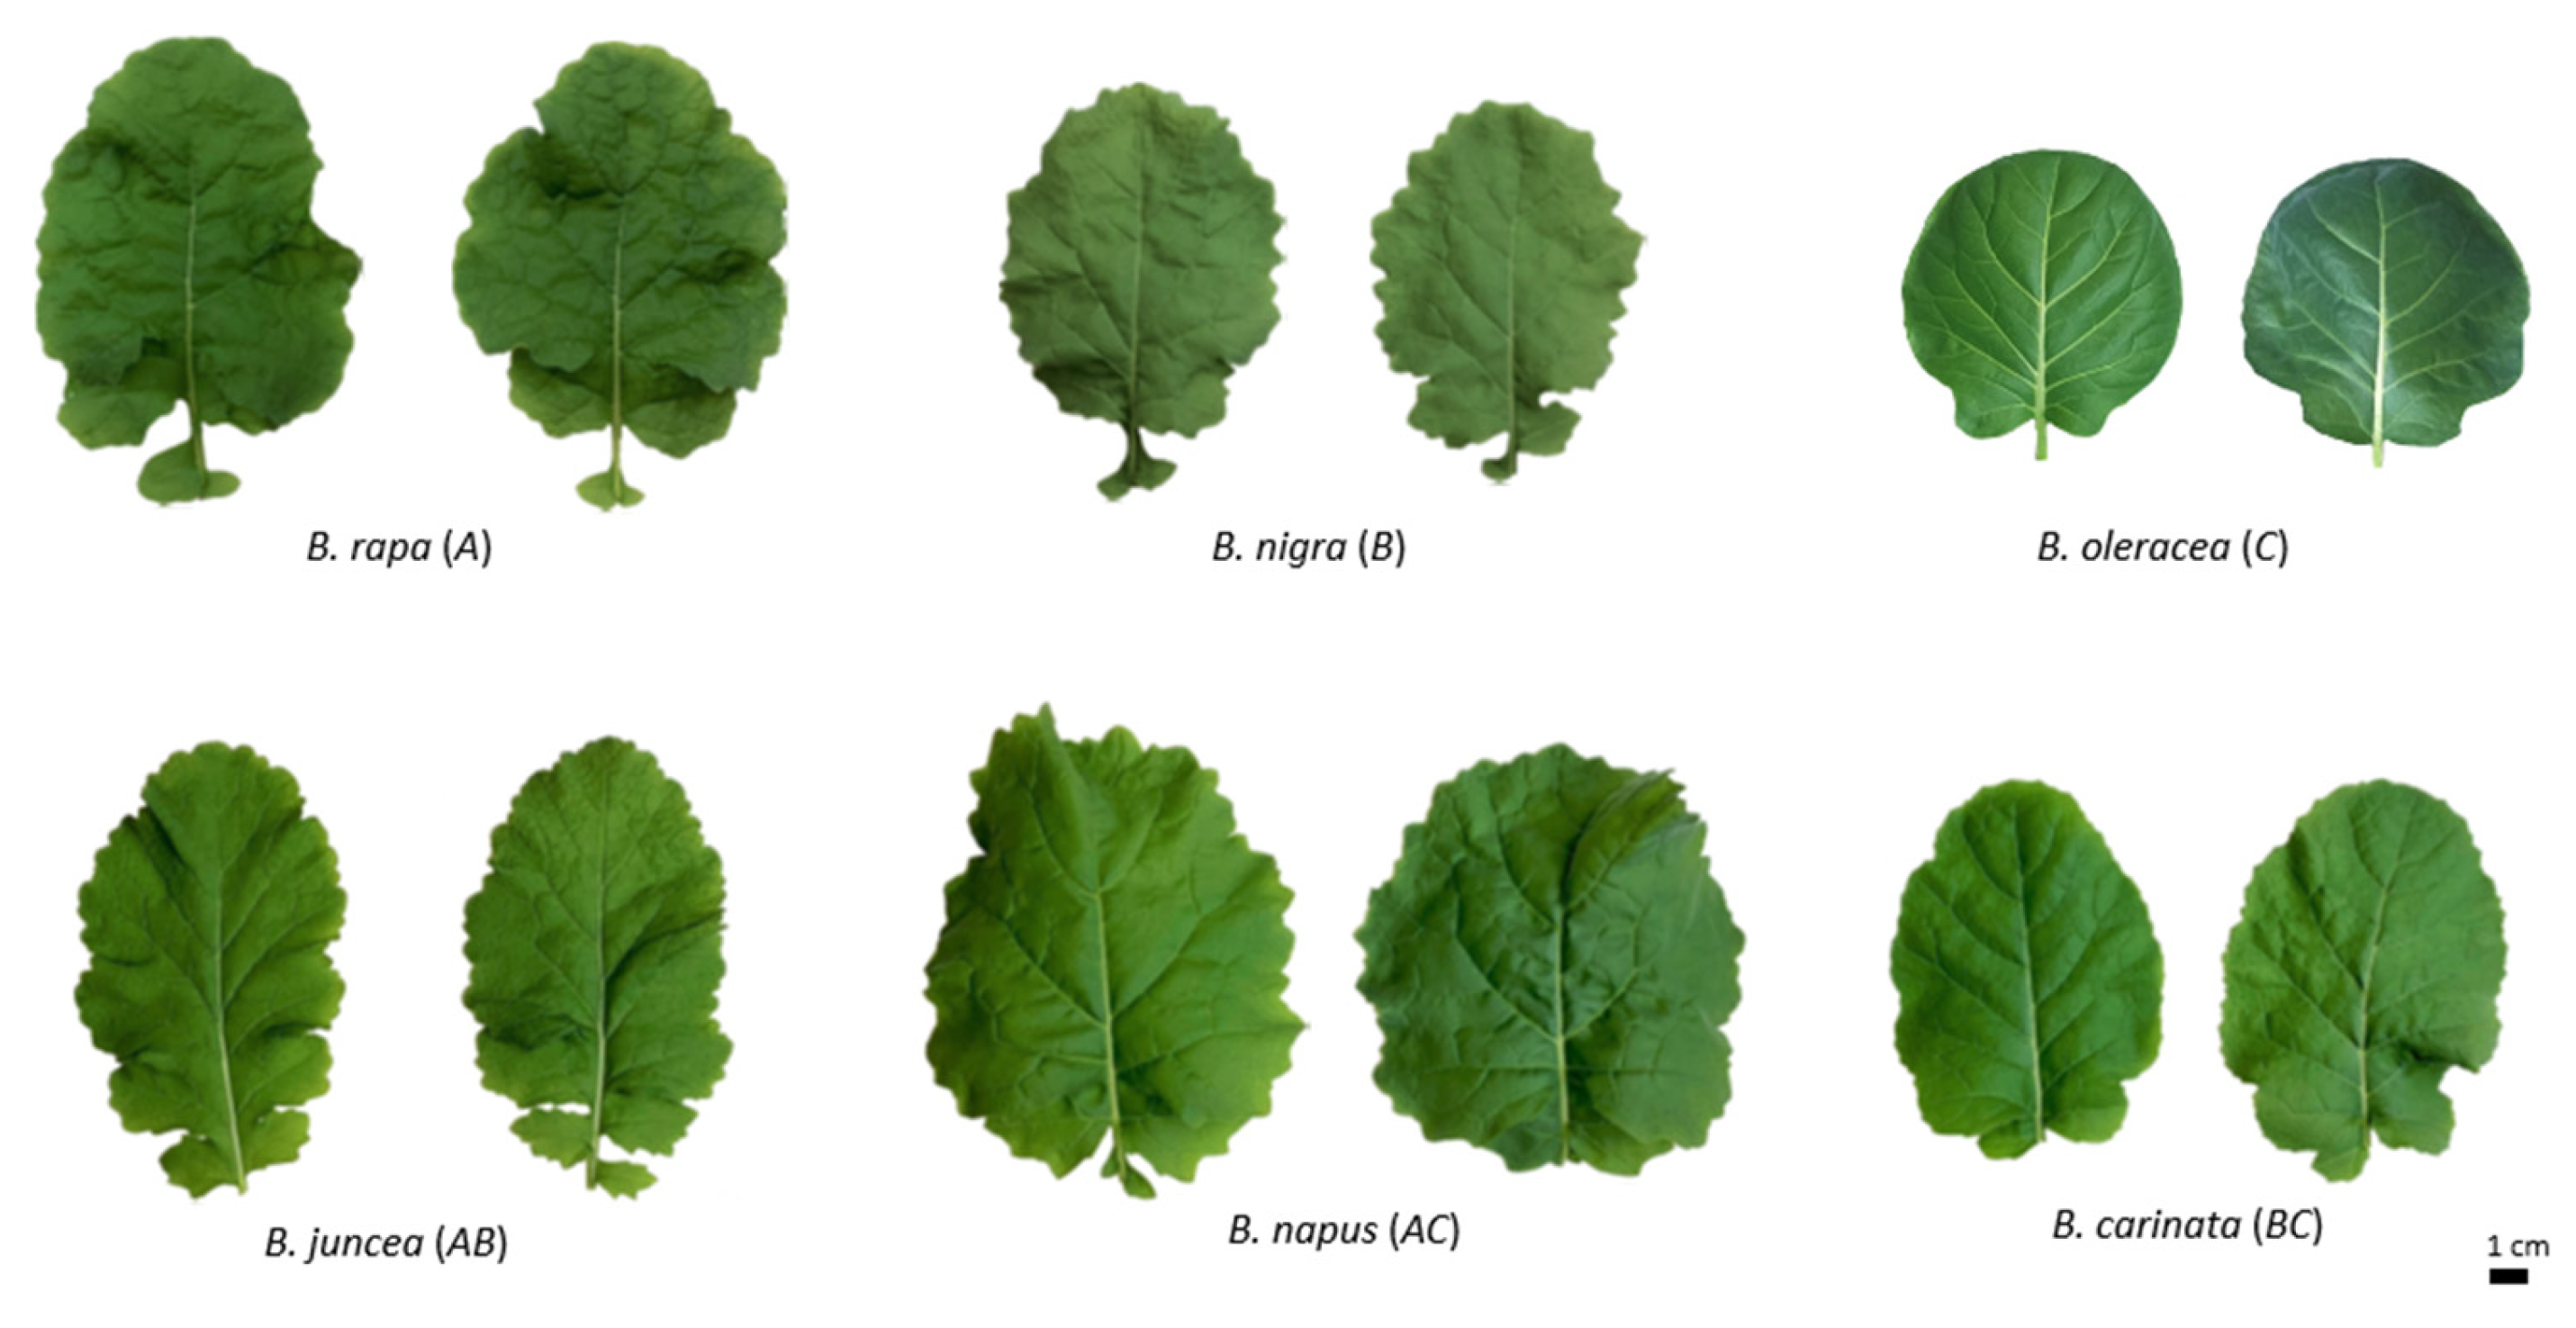
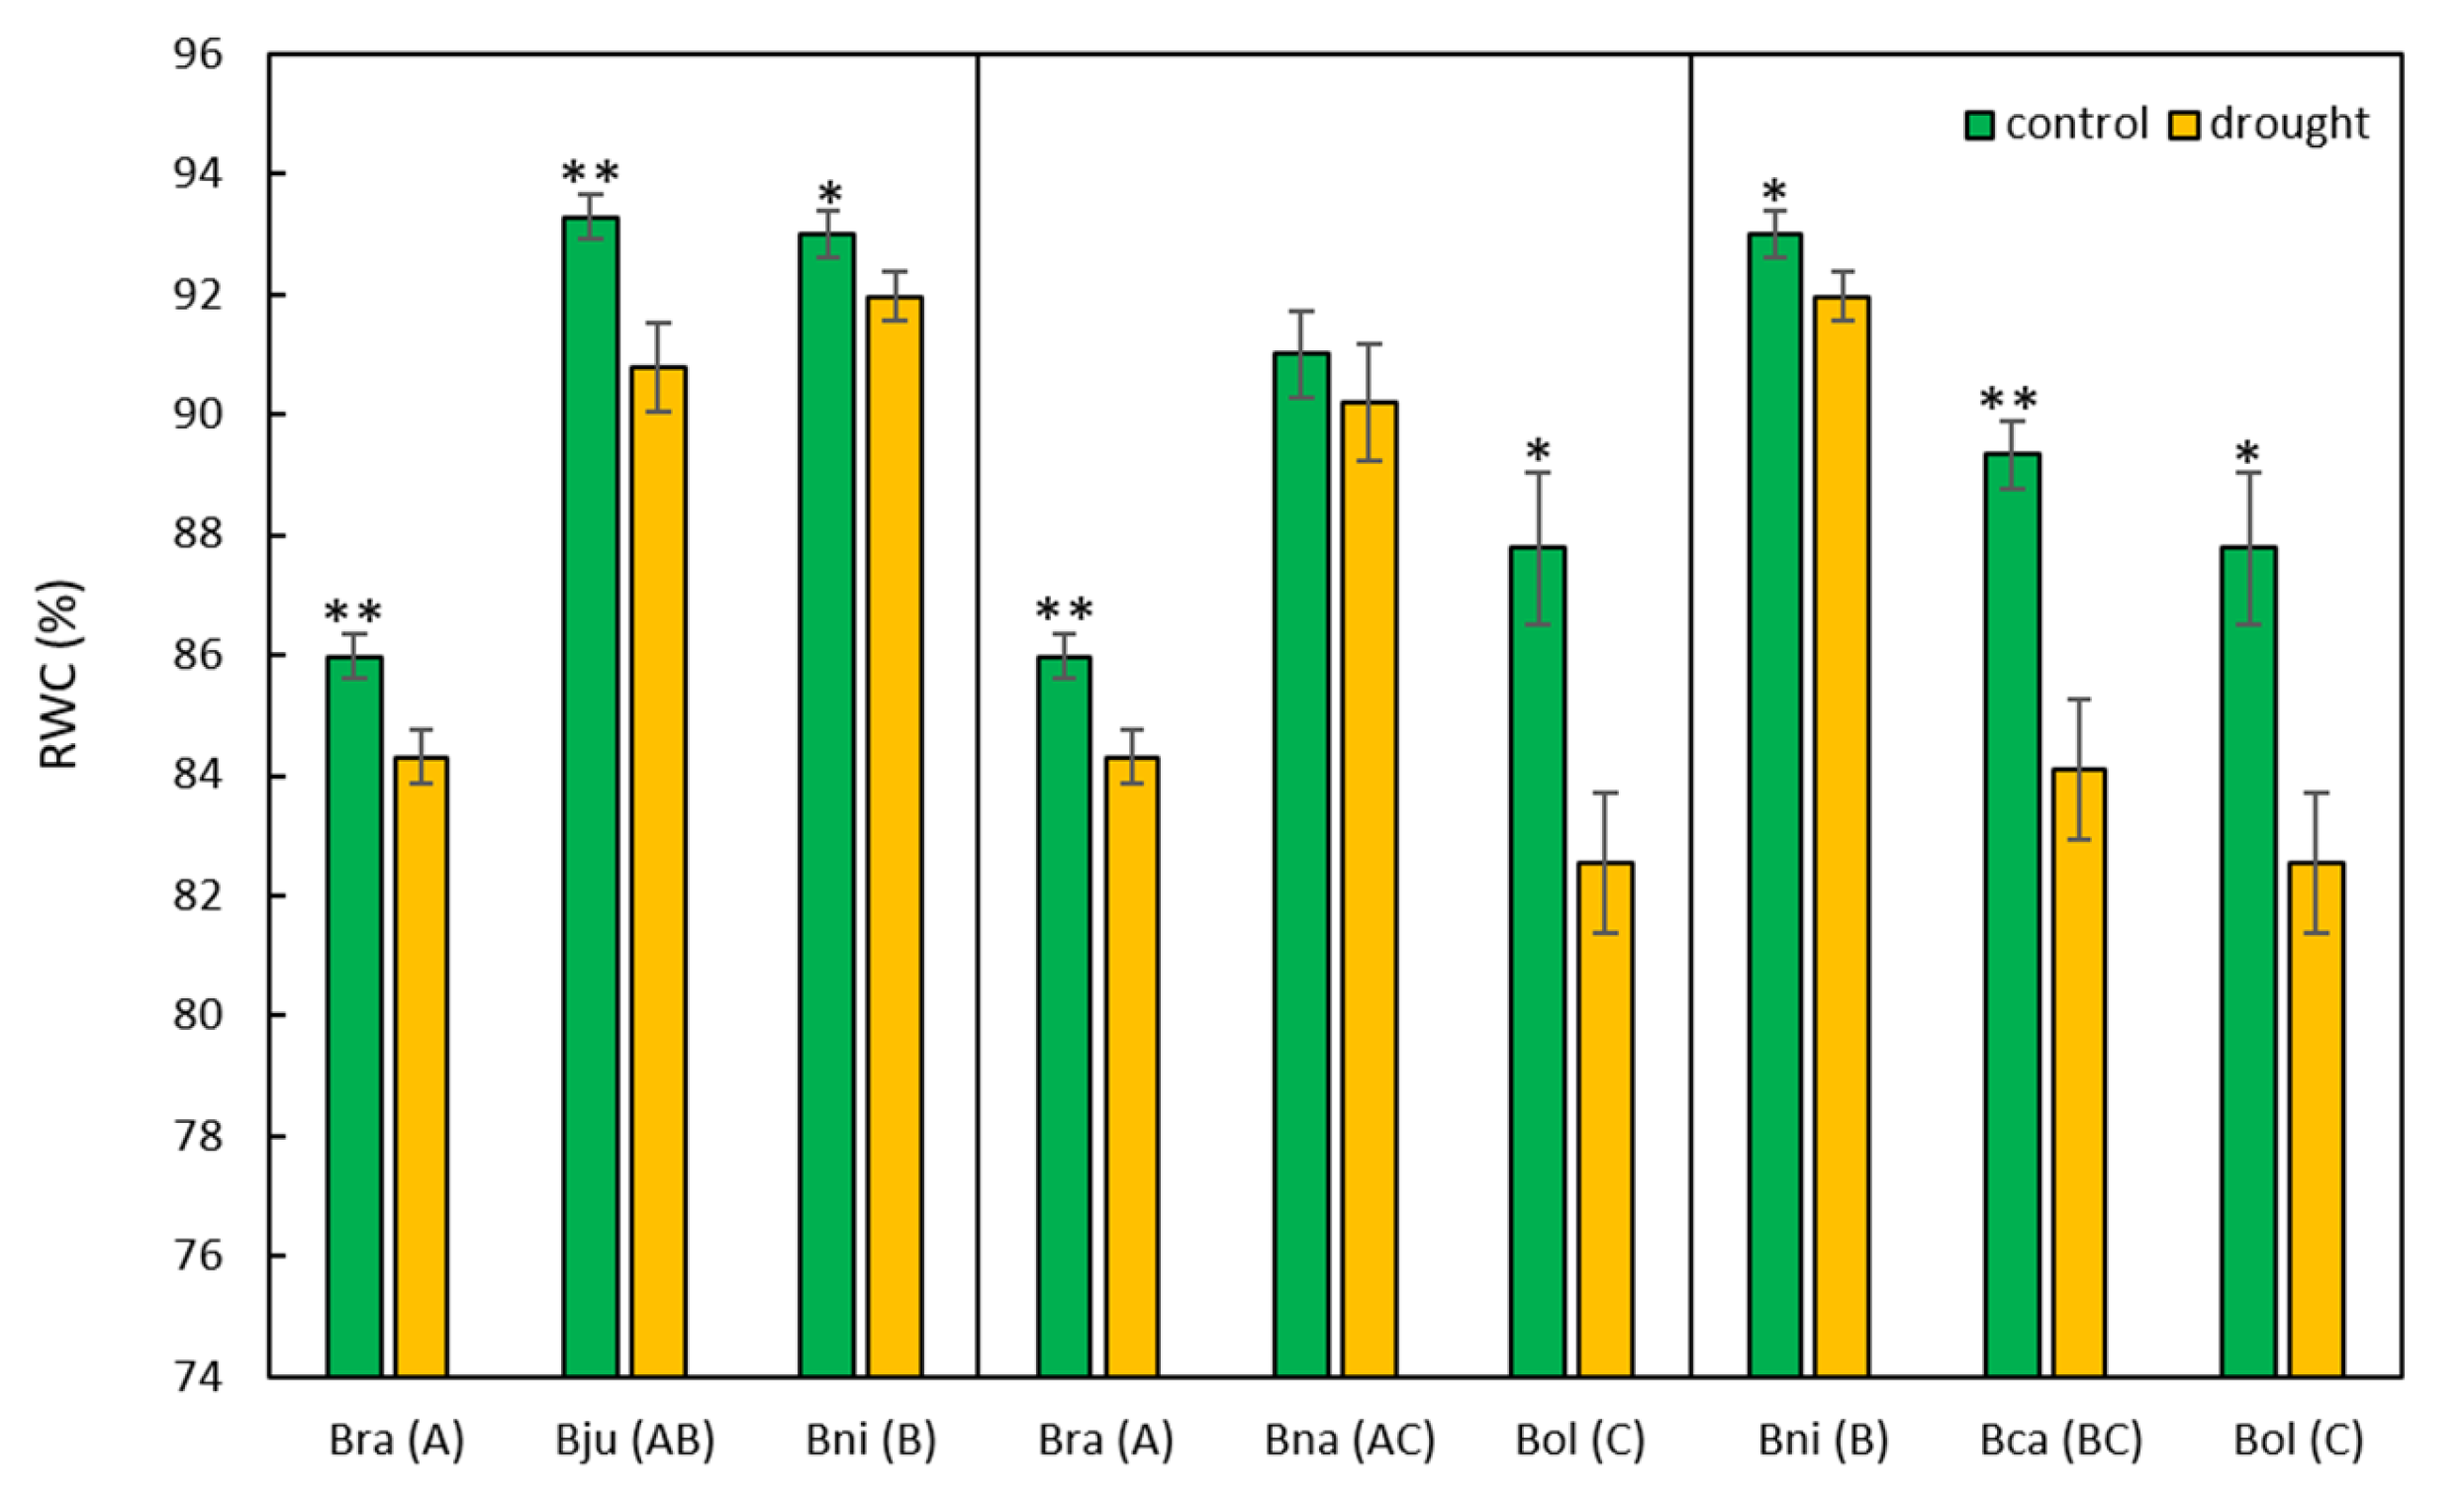
2.1. Morphological and Physiological Responses to Drought Stress
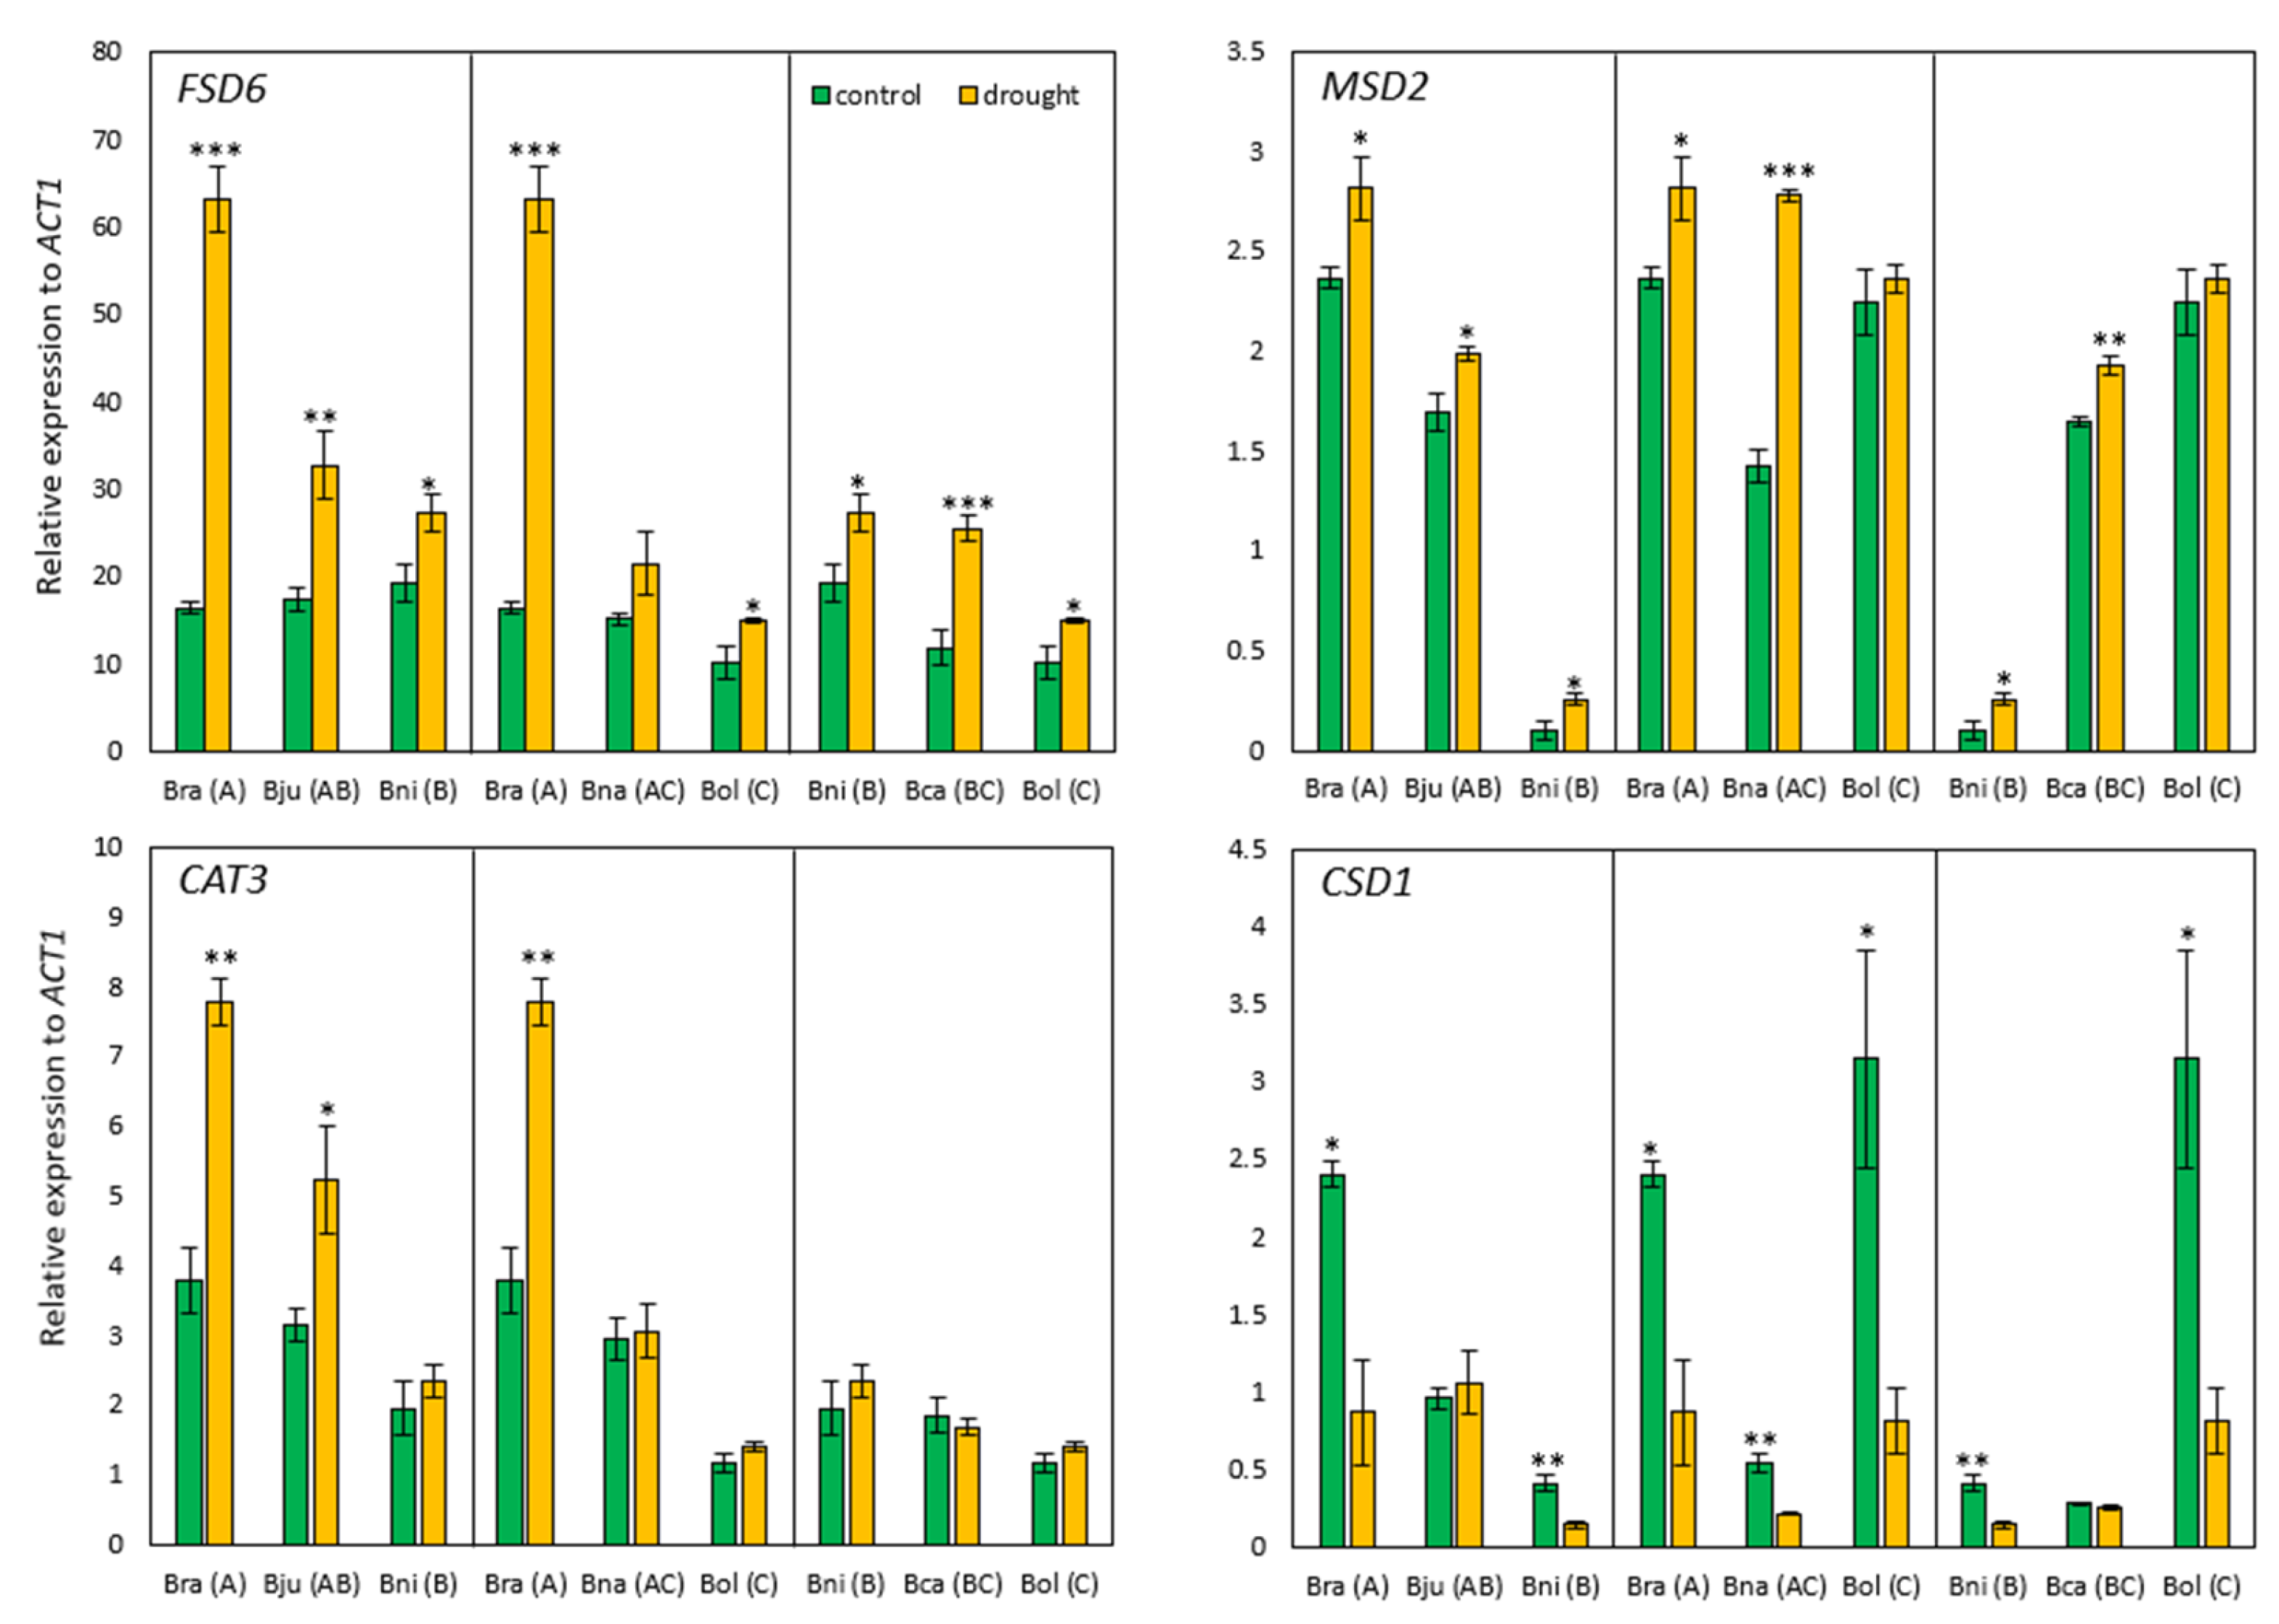
2.2. Molecular Responses to Drought Stress
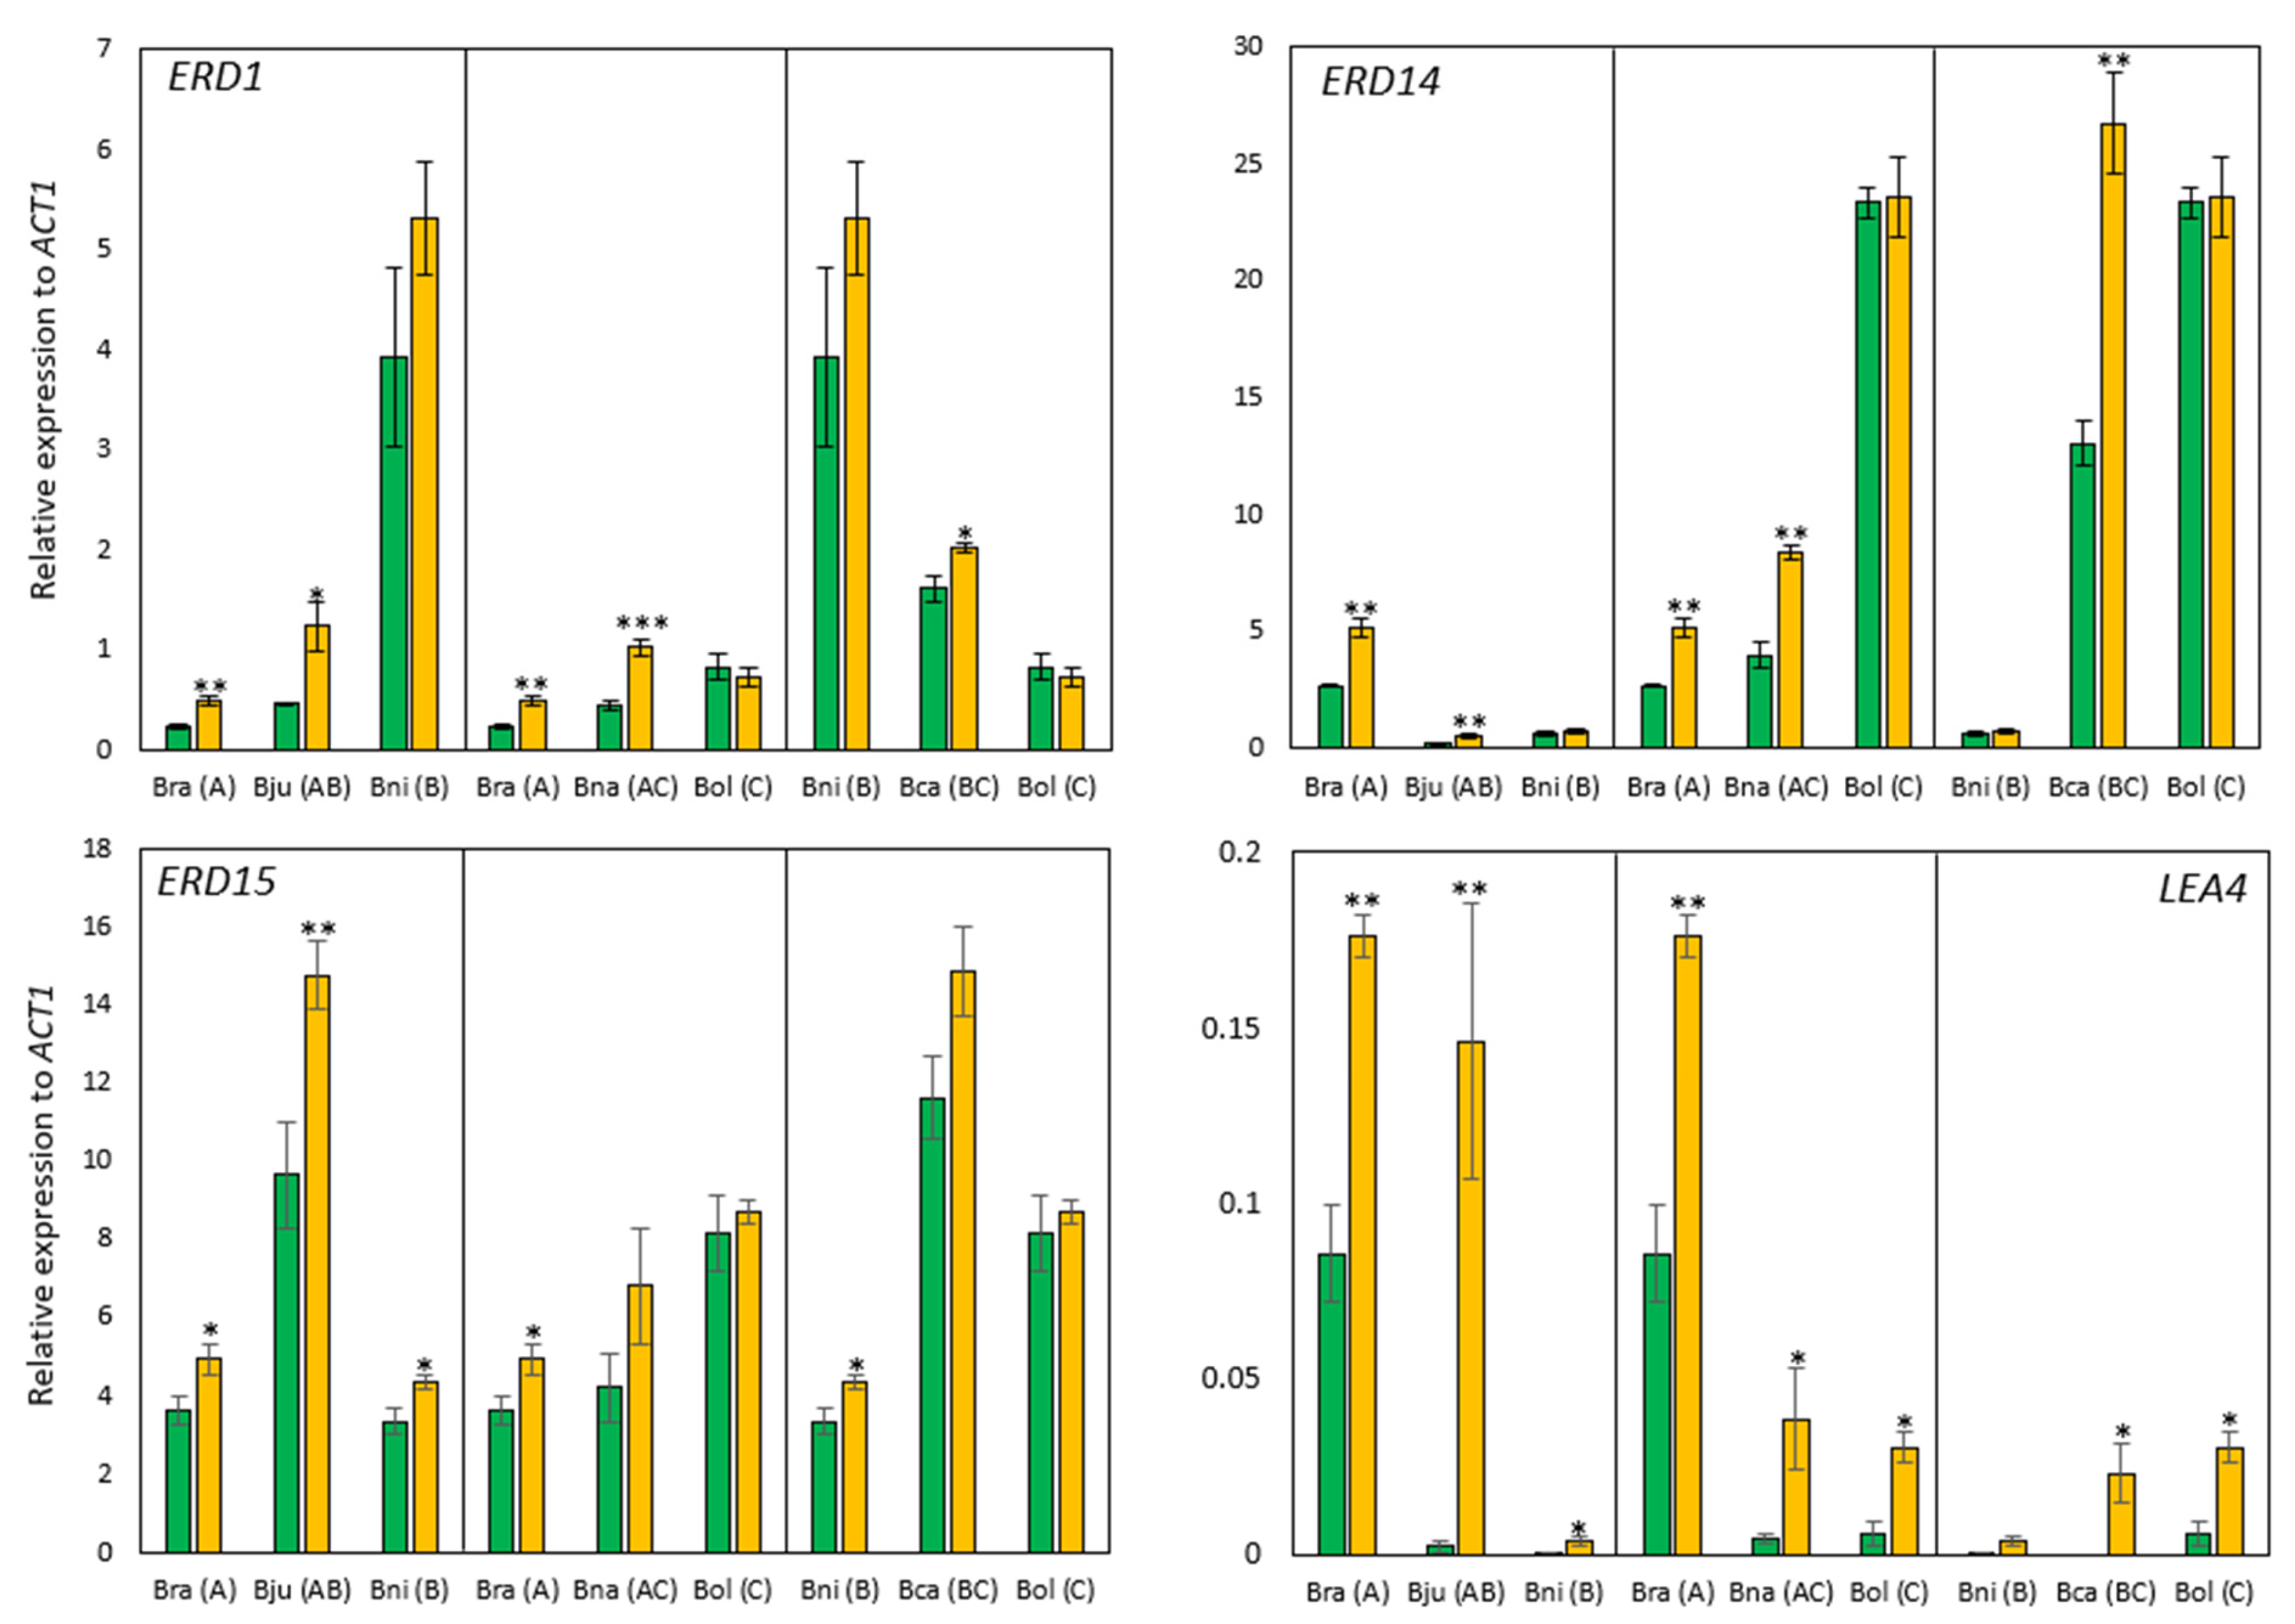
2.2.1. Drought-Responsive Gene Expression
2.2.2. Drought-Responsive Metabolite Accumulation
3. Discussion
3.1. Wide Range of Variation in Response to Drought Stress across Six Species
3.2. Novel Approach in Assessing Drought Response
4. Materials and Methods
4.1. Plant Materials and Drought Stress Treatment
4.2. Determination of Relative Water Content
4.3. Photosynthetic Pigments Determination
4.4. Measurement of MDA
4.5. Measurement of Reactive Oxygen Species Content (Hydrogen Peroxide, Superoxide)
4.6. Assay of Expression of Drought-Responsive Genes Using Quantitative Real-Time PCR (qRT-PCR)
4.7. Measurement of Metabolites Using MRM
4.7.1. Sample Preparation
4.7.2. Optimization and Quantitation Using LC-MSMS
4.7.3. Data Process of Metabolites
4.8. Data Analysis
5. Conclusions
Supplementary Materials
Author Contributions
Funding
Institutional Review Board Statement
Informed Consent Statement
Data Availability Statement
Acknowledgments
Conflicts of Interest
References
- Rodell, M.; Li, B. Changing intensity of hydroclimatic extreme events revealed by GRACE and GRACE-FO. Nat. Water 2023, 1, 241–248. [Google Scholar] [CrossRef]
- National Centers for Environmental Information (NCEI). U.S. Billion-Dollar Weather and Climate Disasters. Available online: https://www.ncei.noaa.gov/access/billions/ (accessed on 18 July 2023).
- Lafitte, H.R.; Yongsheng, G.; Yan, S.; Li, Z.K. Whole plant responses, key processes, and adaptation to drought stress: The case of rice. J. Exp. Bot 2007, 58, 169–175. [Google Scholar] [CrossRef]
- Basu, S.; Ramegowda, V.; Kumar, A.; Pereira, A. Plant adaptation to drought stress. F1000Res 2016, 5, 1554. [Google Scholar] [CrossRef]
- Seleiman, M.F.; Al-Suhaibani, N.; Ali, N.; Akmal, M.; Alotaibi, M.; Refay, Y.; Dindaroglu, T.; Abdul-Wajid, H.H.; Battaglia, M.L. Drought Stress Impacts on Plants and Different Approaches to Alleviate Its Adverse Effects. Plants 2021, 10, 259. [Google Scholar] [CrossRef] [PubMed]
- Zhang, H.; Zhu, J.; Gong, Z.; Zhu, J.K. Abiotic stress responses in plants. Nat. Rev. Genet. 2022, 23, 104–119. [Google Scholar] [CrossRef]
- Zhang, Y.; Xu, J.; Li, R.; Ge, Y.; Li, Y.; Li, R. Plants’ Response to Abiotic Stress: Mechanisms and Strategies. Int. J. Mol. Sci. 2023, 24, 10915. [Google Scholar] [CrossRef] [PubMed]
- Yang, X.; Lu, M.; Wang, Y.; Wang, Y.; Liu, Z.; Chen, S. Response Mechanism of Plants to Drought Stress. Horticulturae 2021, 7, 50. [Google Scholar] [CrossRef]
- Singh, M.; Kumar, J.; Singh, S.; Singh, V.P.; Prasad, S.M. Roles of osmoprotectants in improving salinity and drought tolerance in plants: A review. Rev. Environ. Sci. Bio/Technol. 2015, 14, 407–426. [Google Scholar] [CrossRef]
- Sato, H.; Mizoi, J.; Shinozaki, K.; Yamaguchi-Shinozaki, K. Complex plant responses to drought and heat stress under climate change. Plant J. 2024. [Google Scholar] [CrossRef]
- Zulfiqar, F.; Akram, N.A.; Ashraf, M. Osmoprotection in plants under abiotic stresses: New insights into a classical phenomenon. Planta 2019, 251, 3. [Google Scholar] [CrossRef]
- Movahedi, A.; Dzinyela, R.; Aghaei-Dargiri, S.; Alhassan, A.R.; Yang, L.; Xu, C. Advanced Study of Drought-Responsive Protein Pathways in Plants. Agronomy 2023, 13, 849. [Google Scholar] [CrossRef]
- Van de Peer, Y.; Fawcett, J.A.; Proost, S.; Sterck, L.; Vandepoele, K. The flowering world: A tale of duplications. Trends Plant Sci. 2009, 14, 680–688. [Google Scholar] [CrossRef]
- Van de Peer, Y.; Ashman, T.L.; Soltis, P.S.; Soltis, D.E. Polyploidy: An evolutionary and ecological force in stressful times. Plant Cell 2021, 33, 11–26. [Google Scholar] [CrossRef]
- Soltis, P.S.; Marchant, D.B.; Van de Peer, Y.; Soltis, D.E. Polyploidy and genome evolution in plants. Curr. Opin. Genet. Dev. 2015, 35, 119–125. [Google Scholar] [CrossRef] [PubMed]
- Soltis, P.S.; Soltis, D.E. Ancient WGD events as drivers of key innovations in angiosperms. Curr. Opin. Plant Biol. 2016, 30, 159–165. [Google Scholar] [CrossRef]
- Baker, R.L.; Yarkhunova, Y.; Vidal, K.; Ewers, B.E.; Weinig, C. Polyploidy and the relationship between leaf structure and function: Implications for correlated evolution of anatomy, morphology, and physiology in Brassica. BMC Plant Biol. 2017, 17, 3. [Google Scholar] [CrossRef] [PubMed]
- Wendel, J.F.; Jackson, S.A.; Meyers, B.C.; Wing, R.A. Evolution of plant genome architecture. Genome Biol. 2016, 17, 37. [Google Scholar] [CrossRef]
- Van de Peer, Y.; Mizrachi, E.; Marchal, K. The evolutionary significance of polyploidy. Nat. Rev. Genet. 2017, 18, 411–424. [Google Scholar] [CrossRef] [PubMed]
- Te Beest, M.; Le Roux, J.J.; Richardson, D.M.; Brysting, A.K.; Suda, J.; Kubesova, M.; Pysek, P. The more the better? The role of polyploidy in facilitating plant invasions. Ann. Bot. 2012, 109, 19–45. [Google Scholar] [CrossRef] [PubMed]
- Madlung, A. Polyploidy and its effect on evolutionary success: Old questions revisited with new tools. Heredity 2013, 110, 99–104. [Google Scholar] [CrossRef]
- Rensing, S.A. Gene duplication as a driver of plant morphogenetic evolution. Curr. Opin. Plant Biol. 2014, 17, 43–48. [Google Scholar] [CrossRef]
- Soltis, P.S.; Liu, X.; Marchant, D.B.; Visger, C.J.; Soltis, D.E. Polyploidy and novelty: Gottlieb’s legacy. Philos. Trans. R. Soc. B Biol. Sci. 2014, 369, 20130351. [Google Scholar] [CrossRef] [PubMed]
- Edger, P.P.; Heidel-Fischer, H.M.; Bekaert, M.; Rota, J.; Glockner, G.; Platts, A.E.; Heckel, D.G.; Der, J.P.; Wafula, E.K.; Tang, M.; et al. The butterfly plant arms-race escalated by gene and genome duplications. Proc. Natl. Acad. Sci. USA 2015, 112, 8362–8366. [Google Scholar] [CrossRef] [PubMed]
- Shi, X.; Zhang, C.; Ko, D.K.; Chen, Z.J. Genome-wide dosage-dependent and -independent regulation contributes to gene expression and evolutionary novelty in plant polyploids. Mol. Biol. Evol. 2015, 32, 2351–2366. [Google Scholar] [CrossRef] [PubMed]
- Marchant, D.B.; Soltis, D.E.; Soltis, P.S. Patterns of abiotic niche shifts in allopolyploids relative to their progenitors. N. Phytol. 2016, 212, 708–718. [Google Scholar] [CrossRef] [PubMed]
- Landis, J.B.; Soltis, D.E.; Li, Z.; Marx, H.E.; Barker, M.S.; Tank, D.C.; Soltis, P.S. Impact of whole-genome duplication events on diversification rates in angiosperms. Am. J. Bot. 2018, 105, 348–363. [Google Scholar] [CrossRef] [PubMed]
- Baniaga, A.E.; Marx, H.E.; Arrigo, N.; Barker, M.S. Polyploid plants have faster rates of multivariate niche differentiation than their diploid relatives. Ecol. Lett. 2020, 23, 68–78. [Google Scholar] [CrossRef] [PubMed]
- Wu, S.; Han, B.; Jiao, Y. Genetic Contribution of Paleopolyploidy to Adaptive Evolution in Angiosperms. Mol. Plant 2020, 13, 59–71. [Google Scholar] [CrossRef]
- Tossi, V.E.; Martinez Tosar, L.J.; Laino, L.E.; Iannicelli, J.; Regalado, J.J.; Escandon, A.S.; Baroli, I.; Causin, H.F.; Pitta-Alvarez, S.I. Impact of polyploidy on plant tolerance to abiotic and biotic stresses. Front. Plant Sci. 2022, 13, 869423. [Google Scholar] [CrossRef]
- Wendel, J.F. The wondrous cycles of polyploidy in plants. Am. J. Bot. 2015, 102, 1753–1756. [Google Scholar] [CrossRef]
- Jiao, Y.; Wickett, N.J.; Ayyampalayam, S.; Chanderbali, A.S.; Landherr, L.; Ralph, P.E.; Tomsho, L.P.; Hu, Y.; Liang, H.; Soltis, P.S.; et al. Ancestral polyploidy in seed plants and angiosperms. Nature 2011, 473, 97–100. [Google Scholar] [CrossRef] [PubMed]
- Barker, M.S.; Arrigo, N.; Baniaga, A.E.; Li, Z.; Levin, D.A. On the relative abundance of autopolyploids and allopolyploids. N. Phytol. 2016, 210, 391–398. [Google Scholar] [CrossRef] [PubMed]
- Lourkisti, R.; Froelicher, Y.; Morillon, R.; Berti, L.; Santini, J. Enhanced Photosynthetic Capacity, Osmotic Adjustment and Antioxidant Defenses Contribute to Improve Tolerance to Moderate Water Deficit and Recovery of Triploid Citrus Genotypes. Antioxidants 2022, 11, 562. [Google Scholar] [CrossRef] [PubMed]
- Li, M.; Zhang, C.; Hou, L.; Yang, W.; Liu, S.; Pang, X.; Li, Y. Multiple responses contribute to the enhanced drought tolerance of the autotetraploid Ziziphus jujuba Mill. var. spinosa. Cell Biosci. 2021, 11, 119. [Google Scholar] [CrossRef] [PubMed]
- Rao, S.; Tian, Y.; Xia, X.; Li, Y.; Chen, J. Chromosome doubling mediates superior drought tolerance in Lycium ruthenicum via abscisic acid signaling. Hortic. Res. 2020, 7, 40. [Google Scholar] [CrossRef]
- Guo, W.; Yang, J.; Sun, X.D.; Chen, G.J.; Yang, Y.P.; Duan, Y.W. Divergence in Eco-Physiological Responses to Drought Mirrors the Distinct Distribution of Chamerion angustifolium Cytotypes in the Himalaya-Hengduan Mountains Region. Front. Plant Sci. 2016, 7, 1329. [Google Scholar] [CrossRef]
- Ashraf, M.; Mehmood, S. Response of four Brassica species to drought stress. Environ. Exp. Bot. 1990, 30, 93–100. [Google Scholar] [CrossRef]
- Alam, M.M.; Nahar, K.; Hasanuzzaman, M.; Fujita, M. Alleviation of osmotic stress in Brassica napus, B. campestris, and B. juncea by ascorbic acid application. Biol. Plant. 2014, 58, 697–708. [Google Scholar]
- Chakraborty, K.; Bose, J.; Shabala, L.; Eyles, A.; Shabala, S. Evaluating relative contribution of osmotolerance and tissue tolerance mechanisms toward salinity stress tolerance in three Brassica species. Physiol. Plant. 2016, 158, 135–151. [Google Scholar] [CrossRef]
- Ashraf, M. Relationships between growth and gas exchange characteristics in some salt-tolerant amphidiploid Brassica species in relation to their diploid parents. Environ. Exp. Bot. 2001, 45, 155–163. [Google Scholar] [CrossRef]
- Nagaharu, U.; Nagaharu, N. Genome analysis in Brassica with special reference to the experimental formation of B. napus and peculiar mode of fertilization. Jpn. J. Bot. 1935, 7, 389–452. [Google Scholar]
- Allender, C.J.; King, G.J. Origins of the amphiploid species Brassica napus L. investigated by chloroplast and nuclear molecular markers. BMC Plant Biol. 2010, 10, 54. [Google Scholar] [CrossRef]
- Li, P.; Zhang, S.; Li, F.; Zhang, S.; Zhang, H.; Wang, X.; Sun, R.; Bonnema, G.; Borm, T.J. A Phylogenetic Analysis of Chloroplast Genomes Elucidates the Relationships of the Six Economically Important Brassica Species Comprising the Triangle of U. Front. Plant Sci. 2017, 8, 111. [Google Scholar] [CrossRef] [PubMed]
- Liu, H.; Zhao, W.; Hua, W.; Liu, J. A large-scale population based organelle pan-genomes construction and phylogeny analysis reveal the genetic diversity and the evolutionary origins of chloroplast and mitochondrion in Brassica napus L. BMC Genom. 2022, 23, 339. [Google Scholar] [CrossRef] [PubMed]
- Verkerk, R.; Schreiner, M.; Krumbein, A.; Ciska, E.; Holst, B.; Rowland, I.; De Schrijver, R.; Hansen, M.; Gerhauser, C.; Mithen, R.; et al. Glucosinolates in Brassica vegetables: The influence of the food supply chain on intake, bioavailability and human health. Mol. Nutr Food Res. 2009, 53 (Suppl. S2), S219. [Google Scholar] [CrossRef] [PubMed]
- Syed, R.U.; Moni, S.S.; Break, M.K.B.; Khojali, W.M.A.; Jafar, M.; Alshammari, M.D.; Abdelsalam, K.; Taymour, S.; Alreshidi, K.S.M.; Elhassan Taha, M.M.; et al. Broccoli: A Multi-Faceted Vegetable for Health: An In-Depth Review of Its Nutritional Attributes, Antimicrobial Abilities, and Anti-inflammatory Properties. Antibiotics 2023, 12, 1157. [Google Scholar] [CrossRef]
- Neugart, S.; Baldermann, S.; Hanschen, F.S.; Klopsch, R.; Wiesner-Reinhold, M.; Schreiner, M. The intrinsic quality of brassicaceous vegetables: How secondary plant metabolites are affected by genetic, environmental, and agronomic factors. Sci. Hortic. 2018, 233, 460–478. [Google Scholar] [CrossRef]
- Wang, X.; Wang, H.; Wang, J.; Sun, R.; Wu, J.; Liu, S.; Bai, Y.; Mun, J.H.; Bancroft, I.; Cheng, F.; et al. The genome of the mesopolyploid crop species Brassica rapa. Nat. Genet. 2011, 43, 1035–1039. [Google Scholar] [CrossRef] [PubMed]
- Chalhoub, B.; Denoeud, F.; Liu, S.; Parkin, I.A.; Tang, H.; Wang, X.; Chiquet, J.; Belcram, H.; Tong, C.; Samans, B.; et al. Plant genetics. Early allopolyploid evolution in the post-Neolithic Brassica napus oilseed genome. Science 2014, 345, 950–953. [Google Scholar] [CrossRef]
- Liu, S.; Liu, Y.; Yang, X.; Tong, C.; Edwards, D.; Parkin, I.A.; Zhao, M.; Ma, J.; Yu, J.; Huang, S.; et al. The Brassica oleracea genome reveals the asymmetrical evolution of polyploid genomes. Nat. Commun. 2014, 5, 3930. [Google Scholar] [CrossRef]
- Yang, J.; Liu, D.; Wang, X.; Ji, C.; Cheng, F.; Liu, B.; Hu, Z.; Chen, S.; Pental, D.; Ju, Y.; et al. The genome sequence of allopolyploid Brassica juncea and analysis of differential homoeolog gene expression influencing selection. Nat. Genet. 2016, 48, 1225–1232. [Google Scholar] [CrossRef]
- Perumal, S.; Koh, C.S.; Jin, L.; Buchwaldt, M.; Higgins, E.E.; Zheng, C.; Sankoff, D.; Robinson, S.J.; Kagale, S.; Navabi, Z.K.; et al. A high-contiguity Brassica nigra genome localizes active centromeres and defines the ancestral Brassica genome. Nat. Plants 2020, 6, 929–941. [Google Scholar] [CrossRef] [PubMed]
- Song, X.; Wei, Y.; Xiao, D.; Gong, K.; Sun, P.; Ren, Y.; Yuan, J.; Wu, T.; Yang, Q.; Li, X.; et al. Brassica carinata genome characterization clarifies U’s triangle model of evolution and polyploidy in Brassica. Plant Physiol. 2021, 186, 388–406. [Google Scholar] [CrossRef] [PubMed]
- Zhang, L.; Cai, X.; Wu, J.; Liu, M.; Grob, S.; Cheng, F.; Liang, J.; Cai, C.; Liu, Z.; Liu, B.; et al. Improved Brassica rapa reference genome by single-molecule sequencing and chromosome conformation capture technologies. Hortic. Res. 2018, 5, 50. [Google Scholar] [CrossRef] [PubMed]
- Rousseau-Gueutin, M.; Belser, C.; Da Silva, C.; Richard, G.; Istace, B.; Cruaud, C.; Falentin, C.; Boideau, F.; Boutte, J.; Delourme, R.; et al. Long-read assembly of the Brassica napus reference genome Darmor-bzh. Gigascience 2020, 9, giaa137. [Google Scholar] [CrossRef] [PubMed]
- Song, J.M.; Guan, Z.; Hu, J.; Guo, C.; Yang, Z.; Wang, S.; Liu, D.; Wang, B.; Lu, S.; Zhou, R.; et al. Eight high-quality genomes reveal pan-genome architecture and ecotype differentiation of Brassica napus. Nat. Plants 2020, 6, 34–45. [Google Scholar] [CrossRef] [PubMed]
- Chen, X.; Tong, C.; Zhang, X.; Song, A.; Hu, M.; Dong, W.; Chen, F.; Wang, Y.; Tu, J.; Liu, S.; et al. A high-quality Brassica napus genome reveals expansion of transposable elements, subgenome evolution and disease resistance. Plant Biotechnol. J. 2021, 19, 615–630. [Google Scholar] [CrossRef]
- Guo, N.; Wang, S.; Gao, L.; Liu, Y.; Wang, X.; Lai, E.; Duan, M.; Wang, G.; Li, J.; Yang, M.; et al. Genome sequencing sheds light on the contribution of structural variants to Brassica oleracea diversification. BMC Biol. 2021, 19, 93. [Google Scholar] [CrossRef]
- Gluge, J.; Scheringer, M.; Cousins, I.T.; DeWitt, J.C.; Goldenman, G.; Herzke, D.; Lohmann, R.; Ng, C.A.; Trier, X.; Wang, Z. An overview of the uses of per- and polyfluoroalkyl substances (PFAS). Environ. Sci. Process Impacts 2020, 22, 2345–2373. [Google Scholar] [CrossRef]
- Meegoda, J.N.; Kewalramani, J.A.; Li, B.; Marsh, R.W. A Review of the Applications, Environmental Release, and Remediation Technologies of Per- and Polyfluoroalkyl Substances. Int. J. Environ. Res. Public Health 2020, 17, 8117. [Google Scholar] [CrossRef]
- Ghisi, R.; Vamerali, T.; Manzetti, S. Accumulation of perfluorinated alkyl substances (PFAS) in agricultural plants: A review. Environ. Res. 2019, 169, 326–341. [Google Scholar] [CrossRef]
- Smalling, K.L.; Romanok, K.M.; Bradley, P.M.; Morriss, M.C.; Gray, J.L.; Kanagy, L.K.; Gordon, S.E.; Williams, B.M.; Breitmeyer, S.E.; Jones, D.K.; et al. Per- and polyfluoroalkyl substances (PFAS) in United States tapwater: Comparison of underserved private-well and public-supply exposures and associated health implications. Environ. Int. 2023, 178, 108033. [Google Scholar] [CrossRef]
- Blaine, A.C.; Rich, C.D.; Hundal, L.S.; Lau, C.; Mills, M.A.; Harris, K.M.; Higgins, C.P. Uptake of perfluoroalkyl acids into edible crops via land applied biosolids: Field and greenhouse studies. Environ. Sci. Technol. 2013, 47, 14062–14069. [Google Scholar] [CrossRef]
- Wang, W.; Rhodes, G.; Ge, J.; Yu, X.; Li, H. Uptake and accumulation of per- and polyfluoroalkyl substances in plants. Chemosphere 2020, 261, 127584. [Google Scholar] [CrossRef]
- Chen, Z.J. Molecular mechanisms of polyploidy and hybrid vigor. Trends Plant Sci. 2010, 15, 57–71. [Google Scholar] [CrossRef]
- Shahzad, K.; Zhang, X.; Guo, L.; Qi, T.; Tang, H.; Zhang, M.; Zhang, B.; Wang, H.; Qiao, X.; Feng, J.; et al. Comparative transcriptome analysis of inbred lines and contrasting hybrids reveals overdominance mediate early biomass vigor in hybrid cotton. BMC Genom. 2020, 21, 140. [Google Scholar] [CrossRef]
- Yang, C.; Zhao, L.; Zhang, H.; Yang, Z.; Wang, H.; Wen, S.; Zhang, C.; Rustgi, S.; von Wettstein, D.; Liu, B. Evolution of physiological responses to salt stress in hexaploid wheat. Proc. Natl. Acad. Sci. USA 2014, 111, 11882–11887. [Google Scholar] [CrossRef] [PubMed]
- Ma, J.X.; Li, Y.N.; Vogl, C.; Ehrendorfer, F.; Guo, Y.P. Allopolyploid speciation and ongoing backcrossing between diploid progenitor and tetraploid progeny lineages in the Achillea millefolium species complex: Analyses of single-copy nuclear genes and genomic AFLP. BMC Evol. Biol. 2010, 10, 100. [Google Scholar] [CrossRef] [PubMed]
- Jordon-Thaden, I.E.; Spoelhof, J.P.; Viccini, L.F.; Combs, J.; Gomez, F., Jr.; Walker, I.; Soltis, D.E.; Soltis, P.S. Phenotypic trait variation in the North American Tragopogon allopolyploid complex. Am. J. Bot. 2023, 110, e16189. [Google Scholar] [CrossRef] [PubMed]
- Kashyap, A.; Kumari, S.; Garg, P.; Kushwaha, R.; Tripathi, S.; Sharma, J.; Gupta, N.C.; Kumar, R.R.; Yadav, R.; Vishwakarma, H.; et al. Indexing Resilience to Heat and Drought Stress in the Wild Relatives of Rapeseed-Mustard. Life 2023, 13, 738. [Google Scholar] [CrossRef] [PubMed]
- Hasanuzzaman, M.; Nahar, K.; Anee, T.I.; Khan, M.I.R.; Fujita, M. Silicon-mediated regulation of antioxidant defense and glyoxalase systems confers drought stress tolerance in Brassica napus L. S. Afr. J. Bot. 2018, 115, 50–57. [Google Scholar] [CrossRef]
- Raihan, M.R.H.; Rahman, M.; Rastogi, A.; Fujita, M.; Hasanuzzaman, M. Exogenous Allantoin Confers Rapeseed (Brassica campestris) Tolerance to Simulated Drought by Improving Antioxidant Metabolism and Physiology. Antioxidants 2023, 12, 1508. [Google Scholar] [CrossRef] [PubMed]
- Gill, S.S.; Anjum, N.A.; Gill, R.; Yadav, S.; Hasanuzzaman, M.; Fujita, M.; Mishra, P.; Sabat, S.C.; Tuteja, N. Superoxide dismutase—mentor of abiotic stress tolerance in crop plants. Environ. Sci. Pollut. Res. Int. 2015, 22, 10375–10394. [Google Scholar] [CrossRef] [PubMed]
- Jamdhade, A.R.; Sunkar, R.; Hivrale, V.K. Zymographic Method for Distinguishing Different Classes of Superoxide Dismutases in Plants. Methods Mol. Biol. 2017, 1631, 221–227. [Google Scholar] [PubMed]
- Verma, D.; Lakhanpal, N.; Singh, K. Genome-wide identification and characterization of abiotic-stress responsive SOD (superoxide dismutase) gene family in Brassica juncea and B. rapa. BMC Genom. 2019, 20, 227. [Google Scholar] [CrossRef] [PubMed]
- Su, W.; Raza, A.; Gao, A.; Jia, Z.; Zhang, Y.; Hussain, M.A.; Mehmood, S.S.; Cheng, Y.; Lv, Y.; Zou, X. Genome-Wide Analysis and Expression Profile of Superoxide Dismutase (SOD) Gene Family in Rapeseed (Brassica napus L.) under Different Hormones and Abiotic Stress Conditions. Antioxidants 2021, 10, 1182. [Google Scholar] [CrossRef] [PubMed]
- Lim, T.S.; Chitra, T.R.; Tay, B.H.; Pua, E.C.; Yu, H. Molecular characterization of Arabidopsis and Brassica juncea Cu/Zn-superoxide dismutases reveals their regulation of shoot regeneration. J. Plant Growth Regul. 2008, 27, 99–109. [Google Scholar] [CrossRef]
- Mhamdi, A.; Noctor, G.; Baker, A. Plant catalases: Peroxisomal redox guardians. Arch. Biochem. Biophys. 2012, 525, 181–194. [Google Scholar] [CrossRef]
- Mhamdi, A.; Queval, G.; Chaouch, S.; Vanderauwera, S.; Van Breusegem, F.; Noctor, G. Catalase function in plants: A focus on Arabidopsis mutants as stress-mimic models. J. Exp. Bot. 2010, 61, 4197–4220. [Google Scholar] [CrossRef]
- Wu, G.; Tian, N.; She, F.; Cao, A.; Wu, W.; Zheng, S.; Yang, N. Characteristics analysis of Early Responsive to Dehydration genes in Arabidopsis thaliana (AtERD). Plant Signal Behav. 2022, 18, 2105021. [Google Scholar] [CrossRef]
- Nakashima, K.; Kiyosue, T.; Yamaguchi-Shinozaki, K.; Shinozaki, K. A nuclear gene, erd1, encoding a chloroplast-targeted Clp protease regulatory subunit homolog is not only induced by water stress but also developmentally up-regulated during senescence in Arabidopsis thaliana. Plant J. 1997, 12, 851–861. [Google Scholar] [CrossRef]
- Goodstein, D.M.; Shu, S.; Howson, R.; Neupane, R.; Hayes, R.D.; Fazo, J.; Mitros, T.; Dirks, W.; Hellsten, U.; Putnam, N.; et al. Phytozome: A comparative platform for green plant genomics. Nucleic Acids Res. 2012, 40, D1178–D1186. [Google Scholar] [CrossRef]
- Ma, H. Plant reproduction: GABA gradient, guidance and growth. Curr. Biol. 2003, 13, R834–R836. [Google Scholar] [CrossRef]
- Fait, A.; Fromm, H.; Walter, D.; Galili, G.; Fernie, A.R. Highway or byway: The metabolic role of the GABA shunt in plants. Trends Plant Sci. 2008, 13, 14–19. [Google Scholar] [CrossRef]
- Bown, A.W.; Shelp, B.J. Plant GABA: Not Just a Metabolite. Trends Plant Sci. 2016, 21, 811–813. [Google Scholar] [CrossRef]
- Bown, A.W.; Shelp, B.J. Does the GABA Shunt Regulate Cytosolic GABA? Trends Plant Sci. 2020, 25, 422–424. [Google Scholar] [CrossRef]
- Seifikalhor, M.; Aliniaeifard, S.; Hassani, B.; Niknam, V.; Lastochkina, O. Diverse role of gamma-aminobutyric acid in dynamic plant cell responses. Plant Cell Rep. 2019, 38, 847–867. [Google Scholar] [CrossRef] [PubMed]
- Mittler, R.; Vanderauwera, S.; Suzuki, N.; Miller, G.; Tognetti, V.B.; Vandepoele, K.; Gollery, M.; Shulaev, V.; Van Breusegem, F. ROS signaling: The new wave? Trends Plant Sci. 2011, 16, 300–309. [Google Scholar] [CrossRef] [PubMed]
- Del Rio, L.A. ROS and RNS in plant physiology: An overview. J. Exp. Bot. 2015, 66, 2827–2837. [Google Scholar] [CrossRef] [PubMed]
- Mhamdi, A.; Van Breusegem, F. Reactive oxygen species in plant development. Development 2018, 145, dev164376. [Google Scholar] [CrossRef] [PubMed]
- Waszczak, C.; Carmody, M.; Kangasjarvi, J. Reactive Oxygen Species in Plant Signaling. Annu. Rev. Plant Biol. 2018, 69, 209–236. [Google Scholar] [CrossRef]
- Cho, U.-H.; Seo, N.-H. Oxidative stress in Arabidopsis thaliana exposed to cadmium is due to hydrogen peroxide accumulation. Plant Sci. 2005, 168, 113–120. [Google Scholar] [CrossRef]
- Zhou, B.; Wang, J.; Guo, Z.; Tan, H.; Zhu, X. A simple colorimetric method for determination of hydrogen peroxide in plant tissues. Plant Growth Regul. 2006, 49, 113–118. [Google Scholar] [CrossRef]
- Smirnoff, N.; Arnaud, D. Hydrogen peroxide metabolism and functions in plants. New Phytol. 2019, 221, 1197–1214. [Google Scholar] [CrossRef] [PubMed]
- Asaeda, T.; Rahman, M.; Abeynayaka, H.D.L. Hydrogen peroxide can be a plausible biomarker in cyanobacterial bloom treatment. Sci. Rep. 2022, 12, 12. [Google Scholar] [CrossRef]
- Jabs, T.; Dietrich, R.A.; Dangl, J.L. Initiation of runaway cell death in an Arabidopsis mutant by extracellular superoxide. Science 1996, 273, 1853–1856. [Google Scholar] [CrossRef]
- Elstner, E.F.; Heupel, A. Inhibition of nitrite formation from hydroxylammoniumchloride: A simple assay for superoxide dismutase. Anal. Biochem. 1976, 70, 616–620. [Google Scholar] [CrossRef]
- Queval, G.; Hager, J.; Gakière, B.; Noctor, G. Why are literature data for H2O2 contents so variable? A discussion of potential difficulties in the quantitative assay of leaf extracts. J. Exp. Bot. 2008, 59, 135–146. [Google Scholar] [CrossRef]
- Ganesana, M.; Erlichman, J.S.; Andreescu, S. Real-time monitoring of superoxide accumulation and antioxidant activity in a brain slice model using an electrochemical cytochrome c biosensor. Free Radic. Biol. Med. 2012, 53, 2240–2249. [Google Scholar] [CrossRef]
- Deshpande, A.S.; Muraoka, W.; Wait, J.; Colak, A.; Andreescu, S. Direct real-time measurements of superoxide release from skeletal muscles in rat limbs and human blood platelets using an implantable Cytochrome C microbiosensor. Biosens. Bioelectron. 2023, 240, 115664. [Google Scholar] [CrossRef]
- Li, J.; Sun, J.; Li, P. Exposure routes, bioaccumulation and toxic effects of per- and polyfluoroalkyl substances (PFASs) on plants: A critical review. Environ. Int. 2022, 158, 106891. [Google Scholar] [CrossRef]
- Wang, T.T.; Ying, G.G.; Shi, W.J.; Zhao, J.L.; Liu, Y.S.; Chen, J.; Ma, D.D.; Xiong, Q. Uptake and Translocation of Perfluorooctanoic Acid (PFOA) and Perfluorooctanesulfonic Acid (PFOS) by Wetland Plants: Tissue- and Cell-Level Distribution Visualization with Desorption Electrospray Ionization Mass Spectrometry (DESI-MS) and Transmission Electron Microscopy Equipped with Energy-Dispersive Spectroscopy (TEM-EDS). Environ. Sci. Technol. 2020, 54, 6009–6020. [Google Scholar]
- Liu, Z.; Lu, Y.; Song, X.; Jones, K.; Sweetman, A.J.; Johnson, A.C.; Zhang, M.; Lu, X.; Su, C. Multiple crop bioaccumulation and human exposure of perfluoroalkyl substances around a mega fluorochemical industrial park, China: Implication for planting optimization and food safety. Environ. Int. 2019, 127, 671–684. [Google Scholar] [CrossRef]
- Fenton, S.E.; Ducatman, A.; Boobis, A.; DeWitt, J.C.; Lau, C.; Ng, C.; Smith, J.S.; Roberts, S.M. Per- and Polyfluoroalkyl Substance Toxicity and Human Health Review: Current State of Knowledge and Strategies for Informing Future Research. Environ. Toxicol. Chem. 2021, 40, 606–630. [Google Scholar] [CrossRef] [PubMed]
- Jane, L.E.L.; Yamada, M.; Ford, J.; Owens, G.; Prow, T.; Juhasz, A. Health-related toxicity of emerging per- and polyfluoroalkyl substances: Comparison to legacy PFOS and PFOA. Environ. Res. 2022, 212, 113431. [Google Scholar] [CrossRef] [PubMed]
- Hoagland, D.R.; Arnon, D.I. The water-culture method for growing plants without soil. Calif. Agric. Exp. Stn. Circ. 1950, 347, 1–32. [Google Scholar]
- Smart, R.E.; Bingham, G.E. Rapid estimates of relative water content. Plant Physiol. 1974, 53, 258–260. [Google Scholar] [CrossRef] [PubMed]
- Arnon, D.I. Copper enzymes in isolated chloroplasts polyphenal oxidase in Beta vulgaris. Plant Physiol. 1949, 24, 1. [Google Scholar] [CrossRef]
- Lichtenthaler, H.K.; Buschmann, C. Chlorophylls and carotenoids: Measurement and characterization by UV-VIS spectroscopy. In Current Protocols in Food Analytical Chemistry; Wrolstad, R.E., Acree, T.E., An, H., Decker, E.A., Penner, M.H., Reid, D.S., Schwartz, S.J., Shoemaker, C.F., et al., Eds.; John Wiley and Sons: Hoboken, NJ, USA, 2001; Volume 1, pp. F4.3.1–F4.3.8. [Google Scholar]
- Brix, H. Chlorophylls and carotenoids in plant material. In Protokol Plants Chlorophyll ab Carotenoids Ethanol; Aarhus University: Aarhus, Denmark, 2009; pp. 1–3. [Google Scholar]
- Limantara, L.; Dettling, M.; Indrawati, R.; Brotosudarmo, T.H.P. Analysis on the chlorophyll content of commercial green leafy vegetables. Procedia Chem. 2015, 14, 225–231. [Google Scholar] [CrossRef]
- Alche, J.D. A concise appraisal of lipid oxidation and lipoxidation in higher plants. Redox Biol. 2019, 23, 101136. [Google Scholar] [CrossRef]
- Morales, M.; Munne-Bosch, S. Malondialdehyde: Facts and Artifacts. Plant Physiol. 2019, 180, 1246–1250. [Google Scholar] [CrossRef] [PubMed]
- Heath, R.L.; Packer, L. Photoperoxidation in isolated chloroplasts: I. Kinetics and stoichiometry of fatty acid peroxidation. Arch. Biochem. Biophys. 1968, 125, 189–198. [Google Scholar] [CrossRef] [PubMed]
- Noble, R.W.; Gibson, Q.H. The reaction of ferrous horseradish peroxidase with hydrogen peroxide. J. Biol. Chem. 1970, 245, 2409–2413. [Google Scholar] [CrossRef] [PubMed]
- Fiehn, O.; Wohlgemuth, G.; Scholz, M.; Kind, T.; Lee, D.Y.; Lu, Y.; Moon, S.; Nikolau, B. Quality control for plant metabolomics: Reporting MSI-compliant studies. Plant J. 2008, 53, 691–704. [Google Scholar] [CrossRef]
- Shoemaker, J.A.; Tettenhorst, D.R. Method 537.1: Determination of Selected Per- and Polyfluorinated Alky Substances in Drinking Water by Solid Phase Extraction and Liquid Chromatography/Tandem Mass Spectrometry (LC/MS/MS); version 2.0; US Environmental Protection Agency: Washington, DC, USA, 2020.
- US_EPA. Validated Test Method 8327: Per-and Polyfluoroalkyl Substances (PFAS) Using External Standard Calibration and Multiple Reaction Monitoring (MRM) Liquid Chromatography/ Tandem Mass Spectrometry (LC/MS/MS); US Environmental Protection Agency: Washington, DC, USA, 2019.


| Species | ABA | GABA | Leucine | Tryptophan | Phenylalanine | Proline | PFOS |
|---|---|---|---|---|---|---|---|
| B. rapa | 4.83 ** | 1.14 ** | 0.92 n/s | 9.66 ** | 4.70 ** | 2.42 *** | −4.08 ** |
| B. nigra | 6.14 ** | 0.57 * | 2.00 ** | 2.58 ** | 2.27 ** | 1.86 ** | −0.42 * |
| B. oleracea | 1.63 *** | 1.09 n/s | 0.81 n/s | 0.21 ** | −0.12 n/s | 0.59 ** | −0.28 ** |
| B. juncea | 0.31 * | 0.81 ** | 0.91 n/s | 1.48 ** | 0.27 n/s | 0.0057 n/s | −1.24 ** |
| B. napus | 0.39 ** | 0.76 ** | 1.25 ** | 0.40 n/s | 0.61 ** | 0.76 ** | −2.14 * |
| B. carinata | 0.03 n/s | 0.33 ** | 0.96 n/s | 0.24 n/s | 0.13 n/s | 0.63 ** | −0.25 ** |
| Species | Control (ng·g−1 DW) | Drought (ng·g−1 DW) |
|---|---|---|
| B. rapa | 3.735 ± 0.079 | 0.220 ± 0.002 |
| B. nigra | 4.281 ± 0.248 | 3.209 ± 0.032 |
| B. oleracea | 2.046 ± 0.056 | 1.688 ± 0.052 |
| B. juncea | 4.470 ± 0.050 | 1.889 ± 0.123 |
| B. napus | 3.759 ± 0.235 | 0.854 ± 0.028 |
| B. carinata | 5.944 ± 0.037 | 4.985 ± 0.076 |
| Compound | Polarity | Precursor (m/z) | Product (m/z) | Collision Energy (V) | Min Dwell Time (ms) | RF Lens (V) | Use Quan Ion |
|---|---|---|---|---|---|---|---|
| GABA | Positive | 104 | 45 | 21 | 40 | 30 | FALSE |
| GABA | Positive | 104 | 87 | 13 | 40 | 30 | TRUE |
| GABA-d2 | Positive | 106 | 69.92 | 21 | 40 | 30 | FALSE |
| GABA-d2 | Positive | 106 | 88.92 | 13 | 40 | 30 | TRUE |
| DL-proline | Positive | 116.1 | 43 | 29 | 40 | 30 | FALSE |
| DL-proline | Positive | 116.1 | 70 | 16 | 40 | 30 | TRUE |
| L-leucine | Positive | 132.1 | 86 | 11 | 40 | 30 | TRUE |
| L-leucine | Positive | 132.1 | 44 | 24 | 40 | 30 | FALSE |
| L-tryptophan | Positive | 205.1 | 146 | 20 | 40 | 40 | FALSE |
| L-tryptophan | Positive | 205.1 | 188 | 10 | 40 | 40 | TRUE |
| L-phenylalanine | Positive | 166.1 | 120 | 15 | 40 | 31 | TRUE |
| L-phenylalanine | Positive | 166.1 | 103 | 28 | 40 | 31 | FALSE |
| CA | Negative | 231.1 | 79.9 | 32 | 50 | 76 | TRUE |
| CA | Negative | 231.1 | 149.1 | 25 | 50 | 76 | FALSE |
| (+)-Abscisic acid | Negative | 263.3 | 153 | 11 | 50 | 48 | TRUE |
| (+)-Abscisic acid | Negative | 263.3 | 219 | 13 | 50 | 48 | FALSE |
| PFOS | Negative | 499 | 79.9 | 43 | 40 | 200 | TRUE |
| PFOS | Negative | 499 | 98.9 | 41 | 40 | 200 | FALSE |
| PFOS-13C8 | Negative | 507 | 79 | 43 | 40 | 208 | FALSE |
| PFOS-13C8 | Negative | 507 | 99 | 39 | 40 | 208 | TRUE |
Disclaimer/Publisher’s Note: The statements, opinions and data contained in all publications are solely those of the individual author(s) and contributor(s) and not of MDPI and/or the editor(s). MDPI and/or the editor(s) disclaim responsibility for any injury to people or property resulting from any ideas, methods, instructions or products referred to in the content. |
© 2024 by the authors. Licensee MDPI, Basel, Switzerland. This article is an open access article distributed under the terms and conditions of the Creative Commons Attribution (CC BY) license (https://creativecommons.org/licenses/by/4.0/).
Share and Cite
Yoo, M.-J.; Hwang, Y.; Koh, Y.-M.; Zhu, F.; Deshpande, A.S.; Bechard, T.; Andreescu, S. Physiological and Molecular Modulations to Drought Stress in the Brassica Species. Int. J. Mol. Sci. 2024, 25, 3306. https://doi.org/10.3390/ijms25063306
Yoo M-J, Hwang Y, Koh Y-M, Zhu F, Deshpande AS, Bechard T, Andreescu S. Physiological and Molecular Modulations to Drought Stress in the Brassica Species. International Journal of Molecular Sciences. 2024; 25(6):3306. https://doi.org/10.3390/ijms25063306
Chicago/Turabian StyleYoo, Mi-Jeong, Yoojeong Hwang, Yoo-Min Koh, Fanchao Zhu, Aaditya Sunil Deshpande, Tyler Bechard, and Silvana Andreescu. 2024. "Physiological and Molecular Modulations to Drought Stress in the Brassica Species" International Journal of Molecular Sciences 25, no. 6: 3306. https://doi.org/10.3390/ijms25063306
APA StyleYoo, M.-J., Hwang, Y., Koh, Y.-M., Zhu, F., Deshpande, A. S., Bechard, T., & Andreescu, S. (2024). Physiological and Molecular Modulations to Drought Stress in the Brassica Species. International Journal of Molecular Sciences, 25(6), 3306. https://doi.org/10.3390/ijms25063306