

A Nuclear Magnetic Resonance (NMR)- and Mass Spectrometry (MS)-Based Saturation Kinetics Model of a Bryophyllum pinnatum Decoction as a Treatment for Kidney Stones

 ,
, 
Abstract
1. Introduction
2. Results
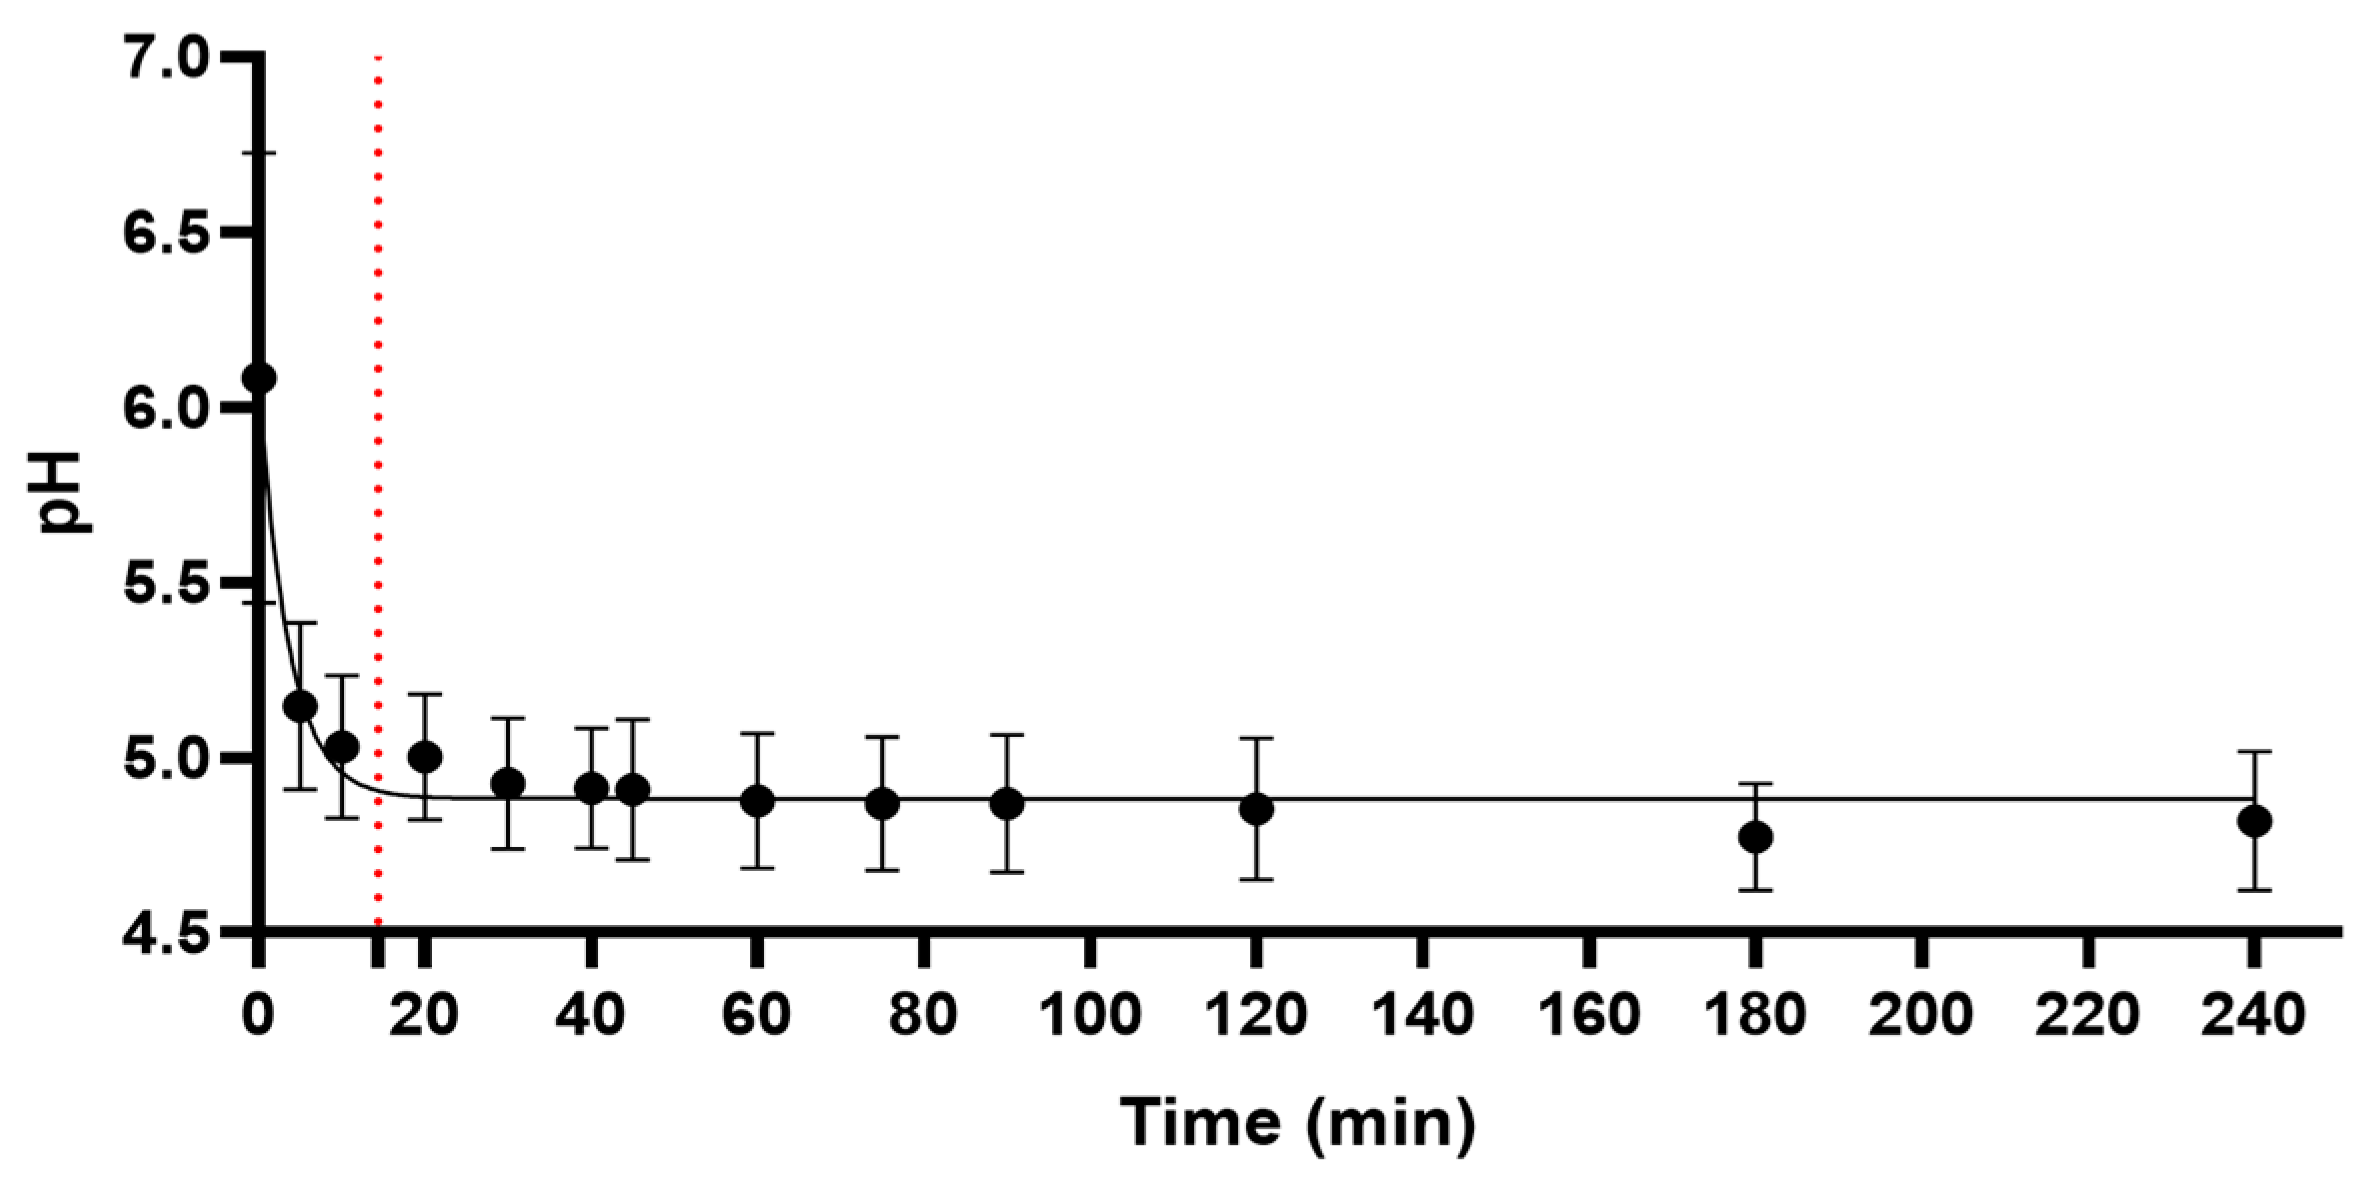
2.1. pH Measurement
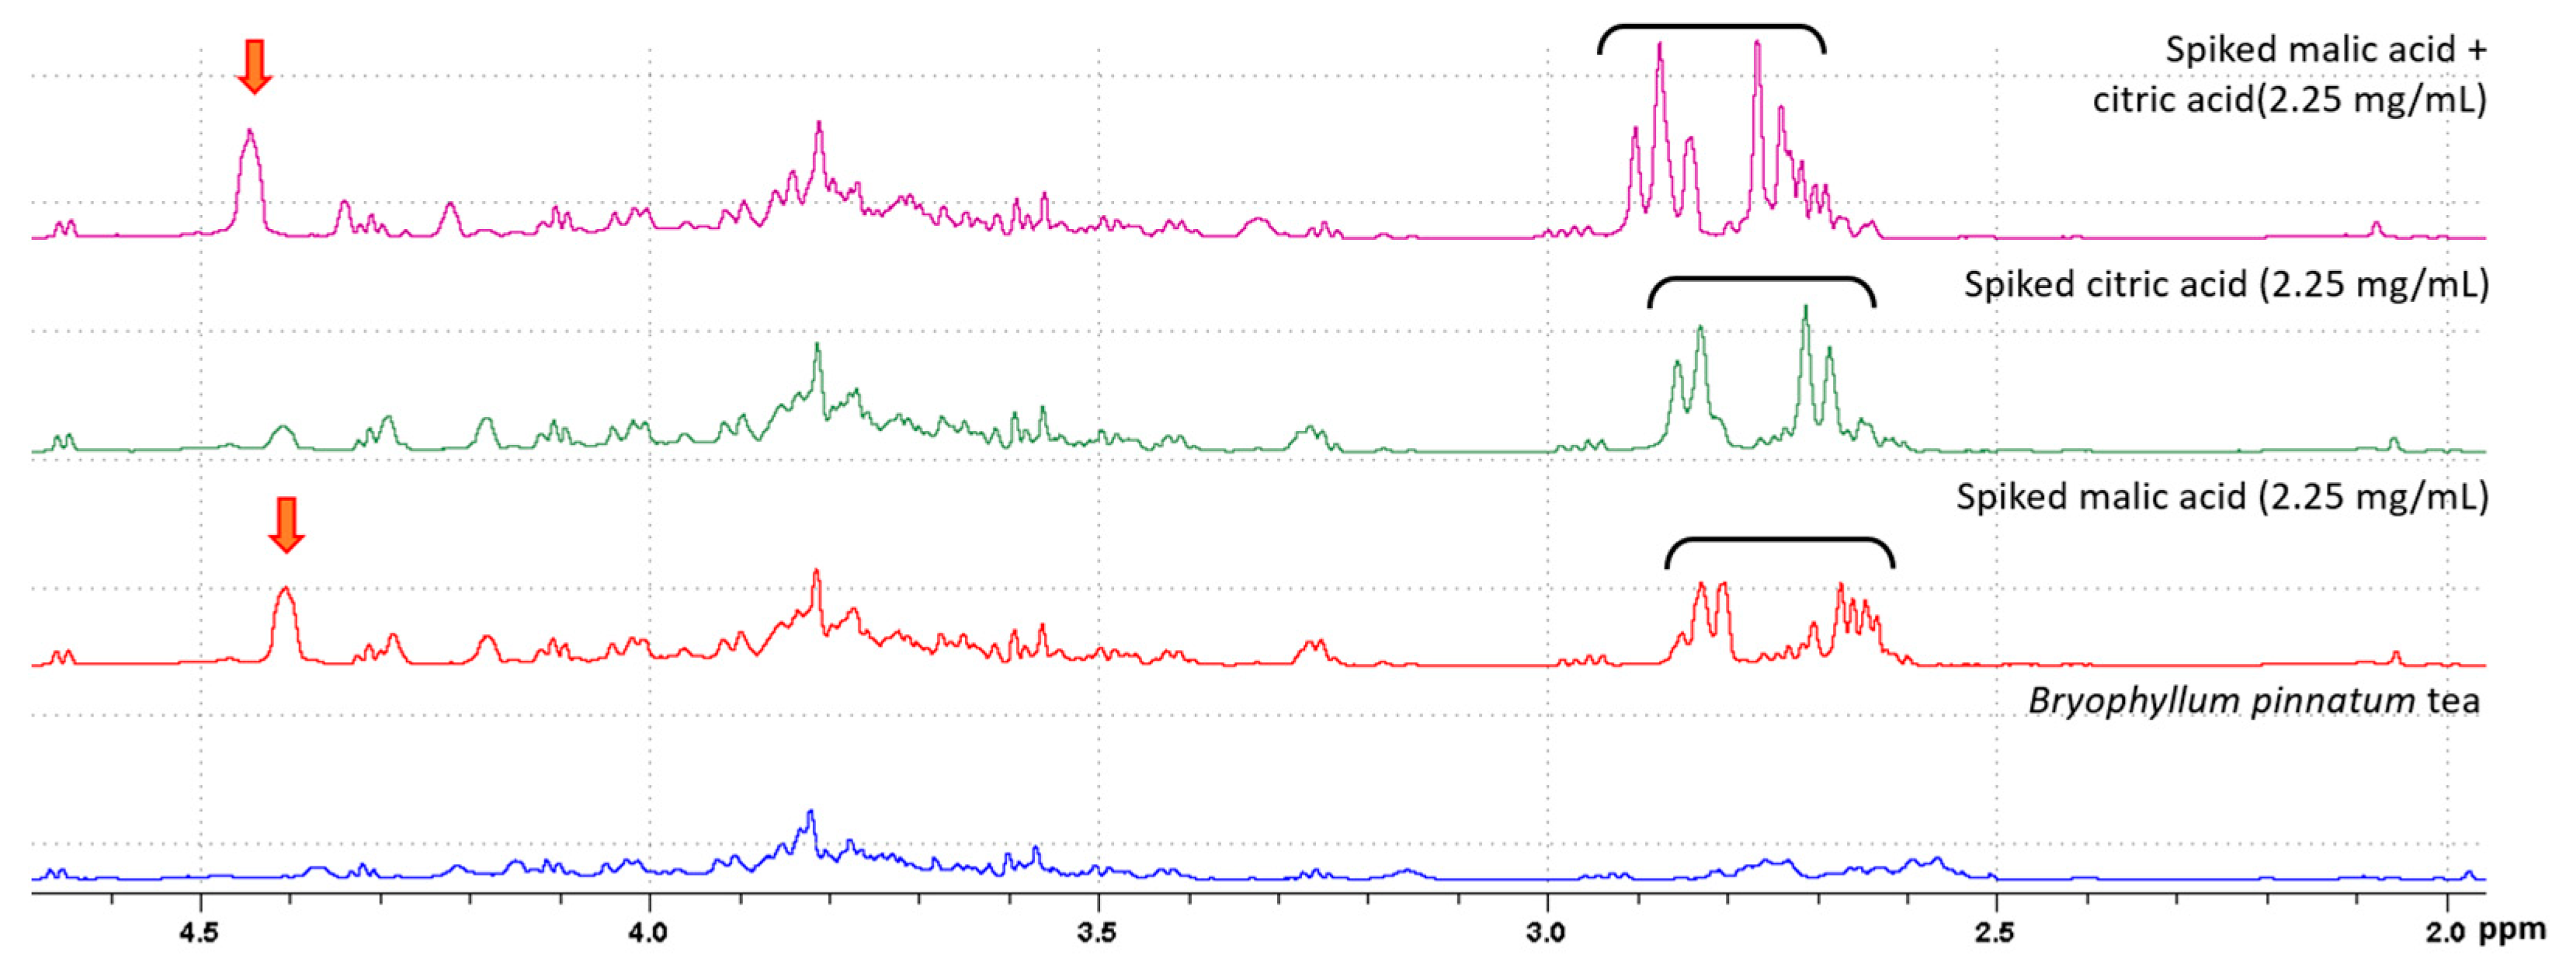
2.2. Identification of Metabolites
2.3. Total Phenolic Content and Total Antioxidant Capacity
2.4. The Metabolic Signature of the Decoction
3. Discussion
4. Materials and Methods
4.1. Source of B. pinnatum
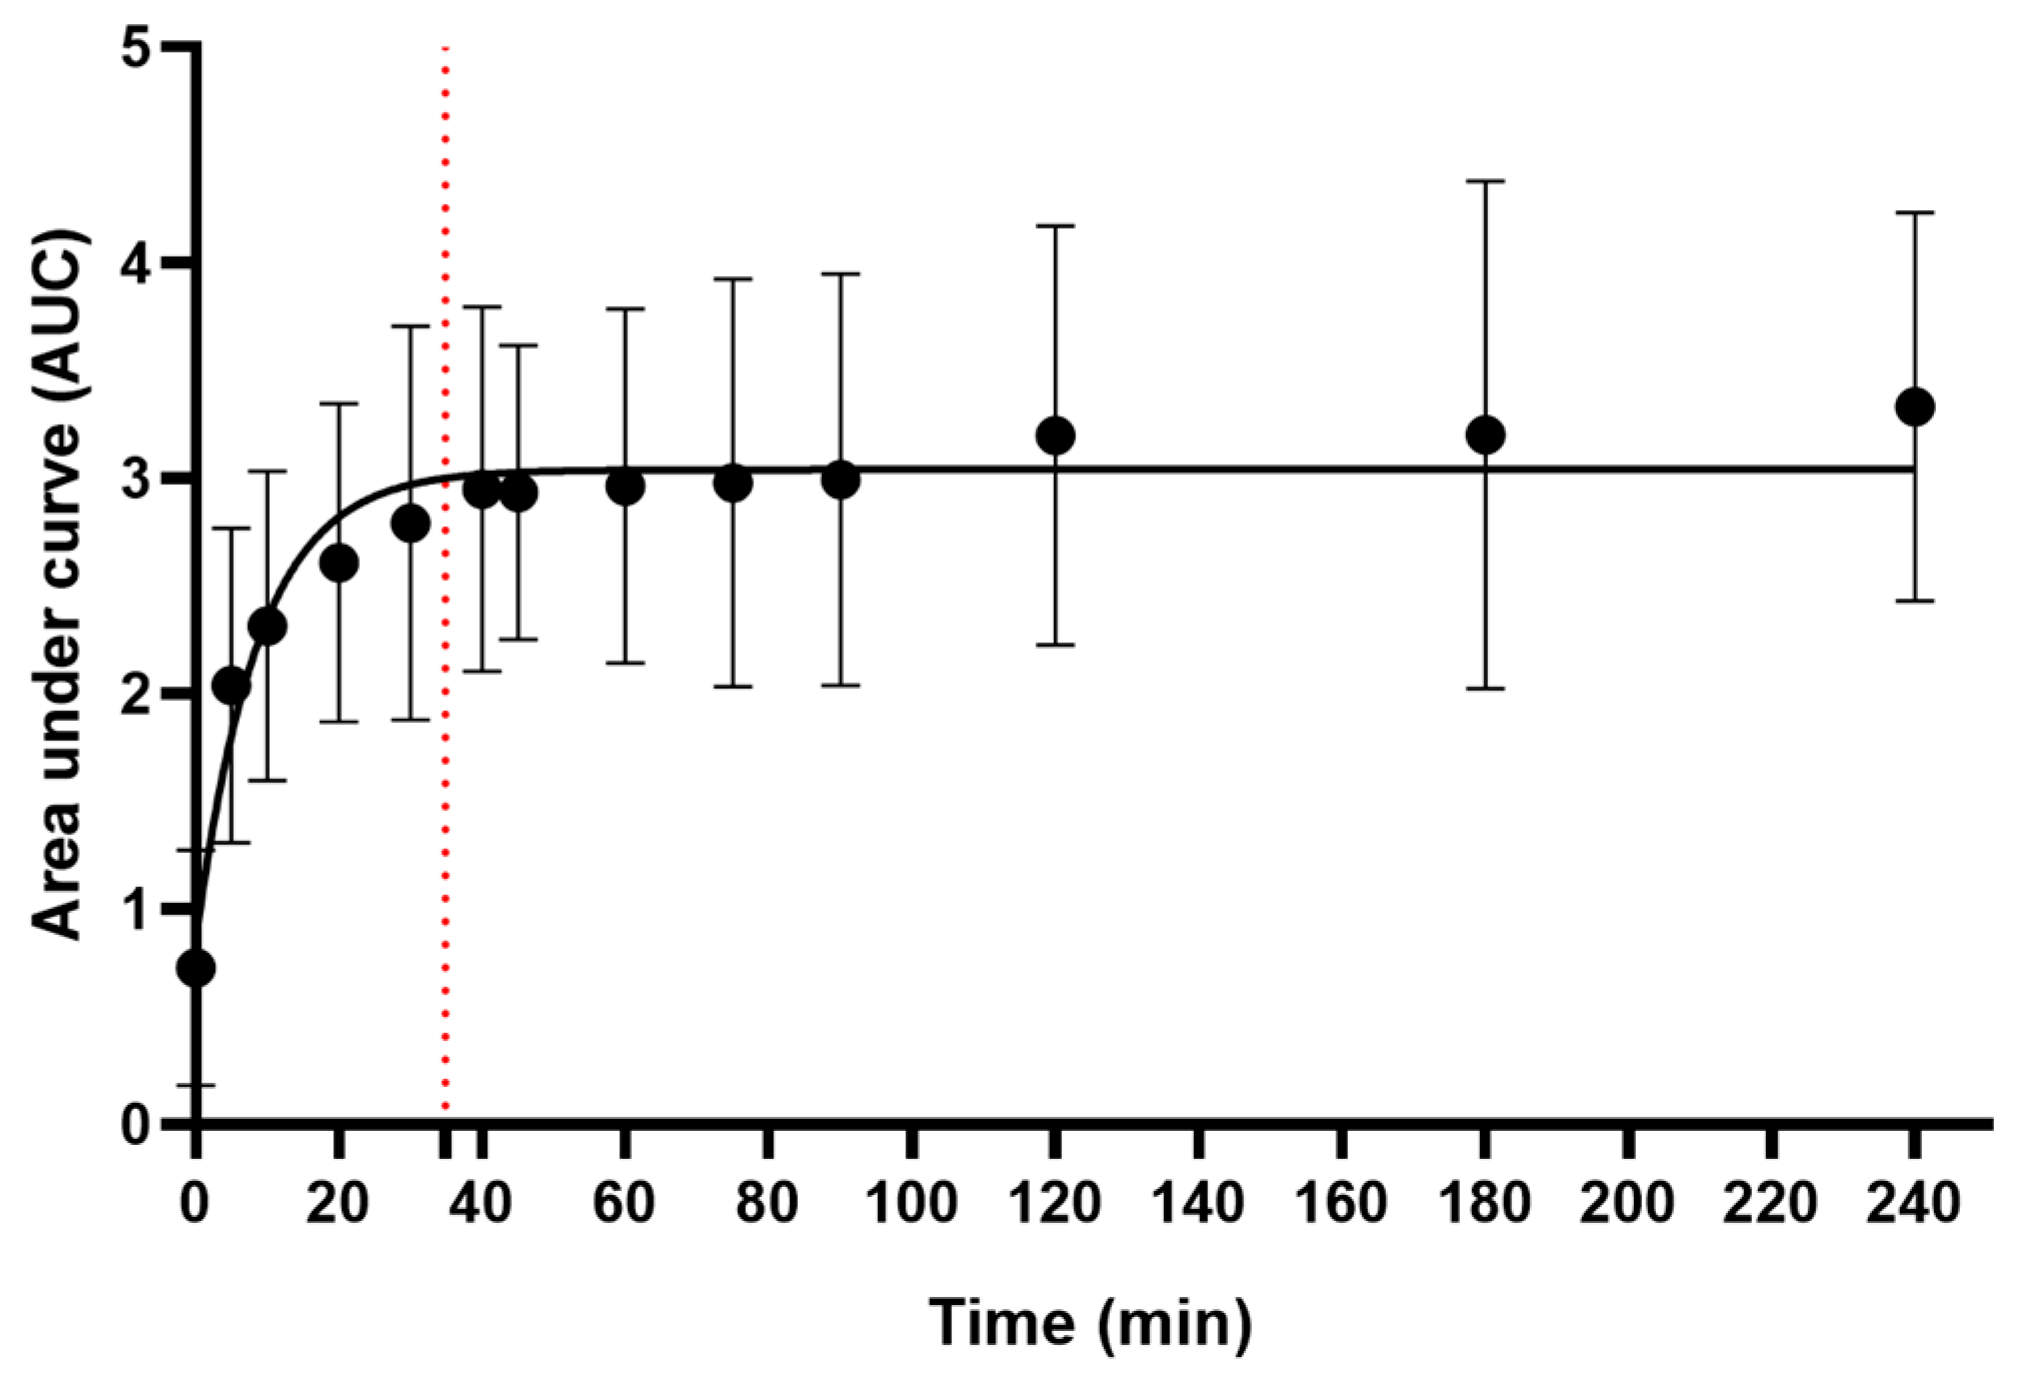
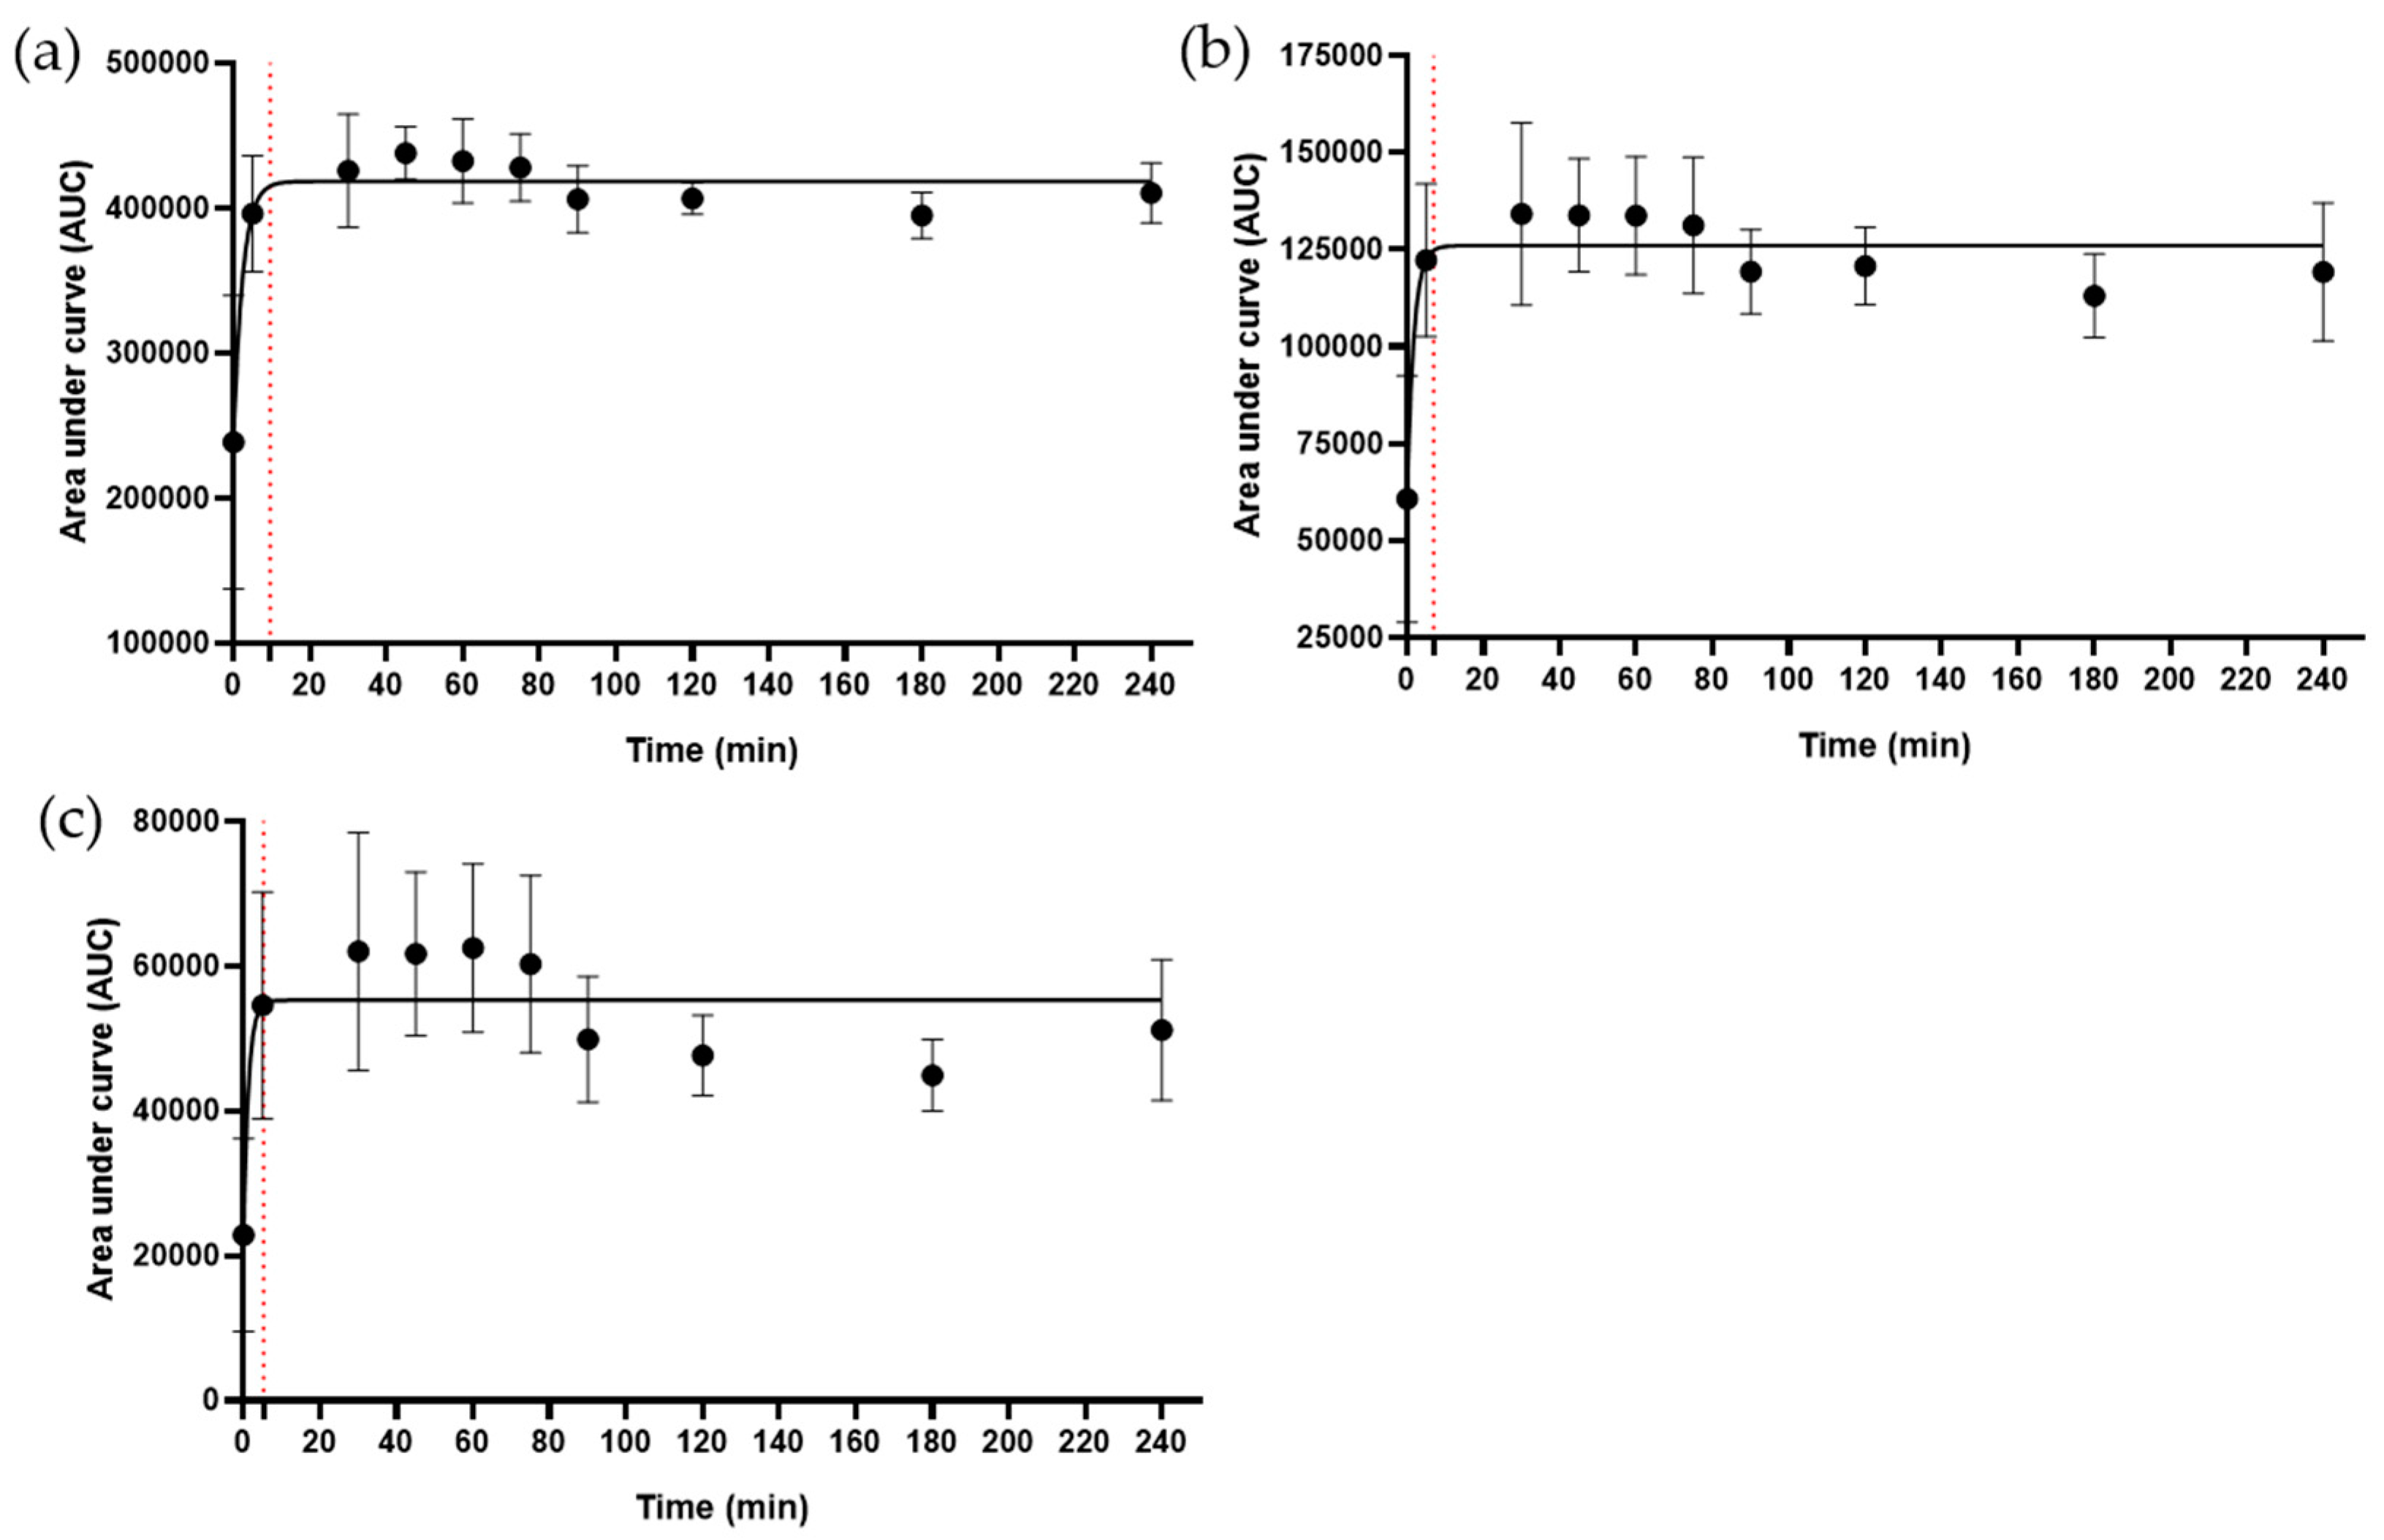
4.2. Kinetics of Metabolite Release in the Decoction
4.3. Kinetics of pH Change
4.4. Identification of Metabolites
4.5. 1H NMR and MS Materials
4.6. 1H NMR Analysis
4.7. LC-MS/MS Analysis
4.8. Total Phenolic Content
4.9. Antioxidant Activity
4.10. Data and Statistical Analysis
5. Conclusions
Supplementary Materials
Author Contributions
Funding
Institutional Review Board Statement
Informed Consent Statement
Data Availability Statement
Acknowledgments
Conflicts of Interest
Appendix A


References
- Najmi, A.; Javed, S.A.; Al Bratty, M.; Alhazmi, H.A. Modern approaches in the discovery and development of plant-based natural products and their analogues as potential therapeutic agents. Molecules 2022, 27, 349. [Google Scholar] [CrossRef] [PubMed]
- Chacko, S.M.; Thambi, P.T.; Kuttan, R.; Nishigaki, I. Beneficial effects of green tea: A literature review. Chin. Med. 2010, 5, 13. [Google Scholar] [CrossRef]
- Suzuki, Y.; Miyoshi, N.; Isemura, M. Health-promoting effects of green tea. Proc. Jpn. Acad. Ser. B 2012, 88, 88–101. [Google Scholar] [CrossRef] [PubMed]
- Toolsee, N.A.; Aruoma, O.I.; Gunness, T.K.; Kowlessur, S.; Dambala, V.; Murad, F.; Googoolye, K.; Daus, D.; Indelicato, J.; Rondeau, P. Effectiveness of green tea in a randomized human cohort: Relevance to diabetes and its complications. BioMed Res. Int. 2013, 2013, 412379. [Google Scholar] [CrossRef] [PubMed]
- Fernandes, J.M.; Cunha, L.M.; Azevedo, E.P.; Lourenço, E.M.; Fernandes-Pedrosa, M.F.; Zucolotto, S.M. Kalanchoe laciniata and Bryophyllum pinnatum: An updated review about ethnopharmacology, phytochemistry, pharmacology and toxicology. Rev. Bras. Farmacogn. 2019, 29, 529–558. [Google Scholar] [CrossRef]
- Motooka, P.; Castro, L.; Nelson, D.; Nagai, G.; Ching, L. Weeds of Hawaii’s Pastures and Natural Areas: An Identification and Management Guide; College of Tropical Agriculture and Human Resources, University of Hawaii at Manoa: Honolulu, HI, USA, 2003. [Google Scholar]
- Betschart, C.; von Mandach, U.; Seifert, B.; Scheiner, D.; Perucchini, D.; Fink, D.; Geissbühler, V. Randomized, double-blind placebo-controlled trial with Bryophyllum pinnatum versus placebo for the treatment of overactive bladder in postmenopausal women. Phytomedicine 2013, 20, 351–358. [Google Scholar] [CrossRef] [PubMed]
- Lambrigger-Steiner, C.; Simões-Wüst, A.P.; Kuck, A.; Fürer, K.; Hamburger, M.; Von Mandach, U. Sleep quality in pregnancy during treatment with Bryophyllum pinnatum: An observational study. Phytomedicine 2014, 21, 753–757. [Google Scholar] [CrossRef] [PubMed]
- Plangger, N.; Rist, L.; Zimmermann, R.; von Mandach, U. Intravenous tocolysis with Bryophyllum pinnatum is better tolerated than beta-agonist application. Eur. J. Obstet. Gynecol. Reprod. Biol. 2006, 124, 168–172. [Google Scholar] [CrossRef]
- Wächter, R.; Brenneisen, R.; Hamburger, M.; Mennet, M.; Schnelle, M.; Worel, A.; Simões-Wüst, A.P.; Von Mandach, U. Leaf press juice from Bryophyllum pinnatum (Lamarck) Oken induces myometrial relaxation. Phytomedicine 2011, 19, 74–82. [Google Scholar] [CrossRef]
- Shukla, A.B.; Mandavia, D.R.; Barvaliya, M.J.; Baxi, S.N.; Tripathi, C.R. Evaluation of anti-urolithiatic effect of aqueous extract of Bryophyllum pinnatum (Lam.) leaves using ethylene glycol-induced renal calculi. Avicenna J. Phytomedicine 2014, 4, 151. [Google Scholar]
- Yadav, M.; Gulkari, V.D.; Wanjari, M.M. Bryophyllum pinnatum leaf extracts prevent formation of renal calculi in lithiatic rats. Anc. Sci. Life 2016, 36, 90. [Google Scholar] [CrossRef] [PubMed]
- Zhu, W.; Xu, Y.-F.; Feng, Y.; Peng, B.; Che, J.-P.; Liu, M.; Zheng, J.-H. Prophylactic effects of quercetin and hyperoside in a calcium oxalate stone forming rat model. Urolithiasis 2014, 42, 519–526. [Google Scholar] [CrossRef] [PubMed]
- Yasir, F.; Waqar, M.A. Effect of indigenous plant extracts on calcium oxalate crystallization having a role in urolithiasis. Urol. Res. 2011, 39, 345–350. [Google Scholar] [CrossRef] [PubMed]
- Gahlaut, A.; Pawar, S.; Mandal, T.; Dabur, R. Evaluation of clinical efficacy of Bryophyllum pinnatum Salisb for treatment of lithiasis. Int. J. Pharm. Sci. 2012, 4, 505–507. [Google Scholar]
- Golomb, D.; Nevo, A.; Goldberg, H.; Ehrlich, Y.; Margel, D.; Lifshitz, D. Long-Term Adherence to Medications in Secondary Prevention of Urinary Tract Stones. J. Endourol. 2019, 33, 469–474. [Google Scholar] [CrossRef] [PubMed]
- Dhayat, N.A.; Bonny, O.; Roth, B.; Christe, A.; Ritter, A.; Mohebbi, N.; Faller, N.; Pellegrini, L.; Bedino, G.; Venzin, R.M. Hydrochlorothiazide and prevention of kidney-stone recurrence. N. Engl. J. Med. 2023, 388, 781–791. [Google Scholar] [CrossRef] [PubMed]
- Teipel, J.C.; Hausler, T.; Sommerfeld, K.; Scharinger, A.; Walch, S.G.; Lachenmeier, D.W.; Kuballa, T. Application of 1H nuclear magnetic resonance spectroscopy as spirit drinks screener for quality and authenticity control. Foods 2020, 9, 1355. [Google Scholar] [CrossRef] [PubMed]
- Fu, L.; Xu, B.-T.; Gan, R.-Y.; Zhang, Y.; Xu, X.-R.; Xia, E.-Q.; Li, H.-B. Total phenolic contents and antioxidant capacities of herbal and tea infusions. Int. J. Mol. Sci. 2011, 12, 2112–2124. [Google Scholar] [CrossRef] [PubMed]
- Rodgers, A.L.; Webber, D.; de Charmoy, R.; Jackson, G.E.; Ravenscroft, N. Malic acid supplementation increases urinary citrate excretion and urinary pH: Implications for the potential treatment of calcium oxalate stone disease. J. Endourol. 2014, 28, 229–236. [Google Scholar] [CrossRef]
- Chung, J.; Taylor, M.G.; Granja, I.; Asplin, J.R.; Mpourmpakis, G.; Rimer, J.D. Factors differentiating the effectiveness of polyprotic acids as inhibitors of calcium oxalate crystallization in kidney stone disease. Cryst. Growth Des. 2018, 18, 5617–5627. [Google Scholar] [CrossRef]
- Sheng, X.; Jung, T.; Wesson, J.A.; Ward, M.D. Adhesion at calcium oxalate crystal surfaces and the effect of urinary constituents. Proc. Natl. Acad. Sci. USA 2005, 102, 267–272. [Google Scholar] [CrossRef] [PubMed]
- Zeng, X.; Xi, Y.; Jiang, W. Protective roles of flavonoids and flavonoid-rich plant extracts against urolithiasis: A review. Crit. Rev. Food Sci. Nutr. 2019, 59, 2125–2135. [Google Scholar] [CrossRef] [PubMed]
- Halperin, M.L.; Dhadli, S.C.; Kamel, K.S. Physiology of acid-base balance: Links with kidney stone prevention. Semin. Nephrol. 2006, 26, 441–446. [Google Scholar] [CrossRef] [PubMed]
- Fernandes, J.M.; Ortiz, S.; Tavares, R.P.M.; Mandova, T.; Araújo, E.R.D.; Andrade, A.W.L.; Michel, S.; Grougnet, R.; Zucolotto, S.M. Bryophyllum pinnatum markers: CPC isolation, simultaneous quantification by a validated UPLC-DAD method and biological evaluations. J. Pharm. Biomed. Anal. 2021, 193, 113682. [Google Scholar] [CrossRef] [PubMed]
- Fernandes, J.M.; Termentzi, A.; Mandova, T.; Hammad, K.; Machera, K.; Magiatis, P.; Michel, S.; Zucolotto, S.M.; Grougnet, R. Detection, Isolation, and 1H NMR Quantitation of the Nitrile Glycoside Sarmentosin from a Bryophyllum pinnatum Hydro-Ethanolic Extract. J. Agric. Food Chem. 2021, 69, 8081–8089. [Google Scholar] [CrossRef] [PubMed]
- Yue, L.; Yi, L.; Yuan-Yuan, Y.; Zhao-Peng, G.; Juan-Ling, L.; Min-Juan, W.; Jun-Li, W. Elucidation of the potential molecular mechanism of the active compounds of Bryophyllum pinnatum (L. f.) oken against gastritis based on network pharmacology. Chin. J. Anal. Chem. 2023, 51, 100193. [Google Scholar]
- Pereira, K.M.; Grecco, S.S.; Figueiredo, C.R.; Hosomi, J.K.; Nakamura, M.U.; Lago, J.H.G. Chemical composition and cytotoxicity of Kalanchoe pinnata leaves extracts prepared using accelerated system extraction (ASE). Nat. Prod. Commun. 2018, 13. [Google Scholar] [CrossRef]
- Yang, D.-J.; Hwang, L.S.; Lin, J.-T. Effects of different steeping methods and storage on caffeine, catechins and gallic acid in bag tea infusions. J. Chromatogr. A 2007, 1156, 312–320. [Google Scholar] [CrossRef]
- Lee, V.S.Y.; Dou, J.; Chen, R.J.Y.; Lin, R.-S.; Lee, M.-R.; Tzen, J.T.C. Massive Accumulation of Gallic Acid and Unique Occurrence of Myricetin, Quercetin, and Kaempferol in Preparing Old Oolong Tea. J. Agric. Food Chem. 2008, 56, 7950–7956. [Google Scholar] [CrossRef]
- Lin, S.; Zhang, H.; Simal-Gandara, J.; Cheng, K.-W.; Wang, M.; Cao, H.; Xiao, J. Investigation of new products of quercetin formed in boiling water via UPLC-Q-TOF-MS-MS analysis. Food Chem. 2022, 386, 132747. [Google Scholar] [CrossRef]
- McKenzie, R.; Franke, F.; Dunster, P. The toxicity to cattle and bufadienolide content of six Bryophyllum species. Aust. Vet. J. 1987, 64, 298–301. [Google Scholar] [CrossRef] [PubMed]
- Oufir, M.; Seiler, C.; Gerodetti, M.; Gerber, J.; Fürer, K.; Mennet-von Eiff, M.; Elsas, S.-M.; Brenneisen, R.; von Mandach, U.; Hamburger, M. Quantification of bufadienolides in Bryophyllum pinnatum leaves and manufactured products by UHPLC-ESIMS/MS. Planta Medica 2015, 81, 1190–1197. [Google Scholar] [PubMed]
- dos Santos Nascimento, L.B.; de Aguiar, P.F.; Leal-Costa, M.V.; Coutinho, M.A.S.; Borsodi, M.P.G.; Rossi-Bergmann, B.; Tavares, E.S.; Costa, S.S. Optimization of aqueous extraction from Kalanchoe pinnata leaves to obtain the highest content of an anti-inflammatory flavonoid using a response surface model. Phytochem. Anal. 2018, 29, 308–315. [Google Scholar] [CrossRef]
- Lourenço, E.M.; Fernandes, J.M.; Carvalho, V.d.F.; Grougnet, R.; Martins, M.A.; Jordão, A.K.; Zucolotto, S.M.; Barbosa, E.G. Identification of a selective PDE4B inhibitor from Bryophyllum pinnatum by target fishing study and in vitro evaluation of quercetin 3-O-α-L-arabinopyranosyl-(1 → 2)-O-α-L-rhamnopyranoside. Front. Pharmacol. 2020, 10, 1582. [Google Scholar] [CrossRef] [PubMed]
- Araújo, E.R.D.; Xavier-Santos, J.B.; Da Silva, V.C.; De Lima, J.B.F.; Schlamb, J.; Fernandes-Pedrosa, M.d.F.; da Silva Júnior, A.A.; de Araújo Júnior, R.F.; Rathinasabapathy, T.; Moncada, M. Gel formulated with Bryophyllum pinnatum leaf extract promotes skin wound healing in vivo by increasing VEGF expression: A novel potential active ingredient for pharmaceuticals. Front. Pharmacol. 2023, 13, 1104705. [Google Scholar] [CrossRef] [PubMed]
- Souness, J.E.; Aldous, D.; Sargent, C. Immunosuppressive and anti-inflammatory effects of cyclic AMP phosphodiesterase (PDE) type 4 inhibitors. Immunopharmacology 2000, 47, 127–162. [Google Scholar] [CrossRef] [PubMed]
- Xiao, J. Dietary flavonoid aglycones and their glycosides: Which show better biological significance? Crit. Rev. Food Sci. Nutr. 2017, 57, 1874–1905. [Google Scholar] [CrossRef] [PubMed]
- Domitrović, R.; Rashed, K.; Cvijanović, O.; Vladimir-Knežević, S.; Škoda, M.; Višnić, A. Myricitrin exhibits antioxidant, anti-inflammatory and antifibrotic activity in carbon tetrachloride-intoxicated mice. Chem.-Biol. Interact. 2015, 230, 21–29. [Google Scholar] [CrossRef]
- Camuesco, D.; Comalada, M.; Rodríguez-Cabezas, M.E.; Nieto, A.; Lorente, M.D.; Concha, A.; Zarzuelo, A.; Gálvez, J. The intestinal anti-inflammatory effect of quercitrin is associated with an inhibition in iNOS expression. Br. J. Pharmacol. 2004, 143, 908–918. [Google Scholar] [CrossRef] [PubMed]
- Liao, Y.; Mai, X.; Wu, X.; Hu, X.; Luo, X.; Zhang, G. Exploring the Inhibition of Quercetin on Acetylcholinesterase by Multispectroscopic and In Silico Approaches and Evaluation of Its Neuroprotective Effects on PC12 Cells. Molecules 2022, 27, 7971. [Google Scholar] [CrossRef]
- Cechinel-Zanchett, C.C.; Bolda Mariano, L.N.; Schlickmann, F.; Cechinel-Filho, V.; de Souza, P. In vitro effects of 2 bioactive compounds, gallic acid and methyl gallate, on urolithiasis. Actas Urol. Esp. (Engl. Ed.) 2021, 45, 604–608. [Google Scholar] [CrossRef] [PubMed]
- Kahkeshani, N.; Farzaei, F.; Fotouhi, M.; Alavi, S.S.; Bahramsoltani, R.; Naseri, R.; Momtaz, S.; Abbasabadi, Z.; Rahimi, R.; Farzaei, M.H.; et al. Pharmacological effects of gallic acid in health and diseases: A mechanistic review. Iran. J. Basic Med. Sci. 2019, 22, 225–237. [Google Scholar] [CrossRef] [PubMed]
- Haslam, E.; Cai, Y. Plant polyphenols (vegetable tannins): Gallic acid metabolism. Nat. Prod. Rep. 1994, 11, 41–66. [Google Scholar] [CrossRef] [PubMed]
- Wang, L.; Tu, Y.-C.; Lian, T.-W.; Hung, J.-T.; Yen, J.-H.; Wu, M.-J. Distinctive antioxidant and antiinflammatory effects of flavonols. J. Agric. Food Chem. 2006, 54, 9798–9804. [Google Scholar] [CrossRef] [PubMed]
- Boonla, C.; Wunsuwan, R.; Tungsanga, K.; Tosukhowong, P. Urinary 8-hydroxydeoxyguanosine is elevated in patients with nephrolithiasis. Urol. Res. 2007, 35, 185–191. [Google Scholar] [CrossRef] [PubMed]
- Huang, H.-S.; Ma, M.-C.; Chen, C.-F.; Chen, J. Lipid peroxidation and its correlations with urinary levels of oxalate, citric acid, and osteopontin in patients with renal calcium oxalate stones. Urology 2003, 62, 1123–1128. [Google Scholar] [CrossRef]
- Tungsanga, K.; Sriboonlue, P.; Futrakul, P.; Yachantha, C.; Tosukhowong, P. Renal tubular cell damage and oxidative stress in renal stone patients and the effect of potassium citrate treatment. Urol. Res. 2005, 33, 65–69. [Google Scholar] [CrossRef] [PubMed]
- Khan, S.R. Is oxidative stress, a link between nephrolithiasis and obesity, hypertension, diabetes, chronic kidney disease, metabolic syndrome? Urol. Res. 2012, 40, 95–112. [Google Scholar] [CrossRef] [PubMed]
- Vu, H.T.; Song, F.V.; Tian, K.V.; Su, H.; Chass, G.A. Systematic characterisation of the structure and radical scavenging potency of Pu′Er tea ( ) polyphenol theaflavin. Org. Biomol. Chem. 2019, 17, 9942–9950. [Google Scholar] [CrossRef]


Disclaimer/Publisher’s Note: The statements, opinions and data contained in all publications are solely those of the individual author(s) and contributor(s) and not of MDPI and/or the editor(s). MDPI and/or the editor(s) disclaim responsibility for any injury to people or property resulting from any ideas, methods, instructions or products referred to in the content. |
© 2024 by the authors. Licensee MDPI, Basel, Switzerland. This article is an open access article distributed under the terms and conditions of the Creative Commons Attribution (CC BY) license (https://creativecommons.org/licenses/by/4.0/).
Share and Cite
Chik, C.; Larroque, A.-L.; Zhuang, Y.; Feinstein, S.; Smith, D.L.; Andonian, S.; Ryan, A.K.; Jean-Claude, B.; Gupta, I.R. A Nuclear Magnetic Resonance (NMR)- and Mass Spectrometry (MS)-Based Saturation Kinetics Model of a Bryophyllum pinnatum Decoction as a Treatment for Kidney Stones. Int. J. Mol. Sci. 2024, 25, 5280. https://doi.org/10.3390/ijms25105280
Chik C, Larroque A-L, Zhuang Y, Feinstein S, Smith DL, Andonian S, Ryan AK, Jean-Claude B, Gupta IR. A Nuclear Magnetic Resonance (NMR)- and Mass Spectrometry (MS)-Based Saturation Kinetics Model of a Bryophyllum pinnatum Decoction as a Treatment for Kidney Stones. International Journal of Molecular Sciences. 2024; 25(10):5280. https://doi.org/10.3390/ijms25105280
Chicago/Turabian StyleChik, Candus, Anne-Laure Larroque, Yuan Zhuang, Shane Feinstein, Donald L. Smith, Sero Andonian, Aimee K. Ryan, Bertrand Jean-Claude, and Indra R. Gupta. 2024. "A Nuclear Magnetic Resonance (NMR)- and Mass Spectrometry (MS)-Based Saturation Kinetics Model of a Bryophyllum pinnatum Decoction as a Treatment for Kidney Stones" International Journal of Molecular Sciences 25, no. 10: 5280. https://doi.org/10.3390/ijms25105280
APA StyleChik, C., Larroque, A.-L., Zhuang, Y., Feinstein, S., Smith, D. L., Andonian, S., Ryan, A. K., Jean-Claude, B., & Gupta, I. R. (2024). A Nuclear Magnetic Resonance (NMR)- and Mass Spectrometry (MS)-Based Saturation Kinetics Model of a Bryophyllum pinnatum Decoction as a Treatment for Kidney Stones. International Journal of Molecular Sciences, 25(10), 5280. https://doi.org/10.3390/ijms25105280