
Investigating Chemokine-Matrix Networks in Breast Cancer: Tenascin-C Sets the Tone for CCL2

 , , , , , , , and
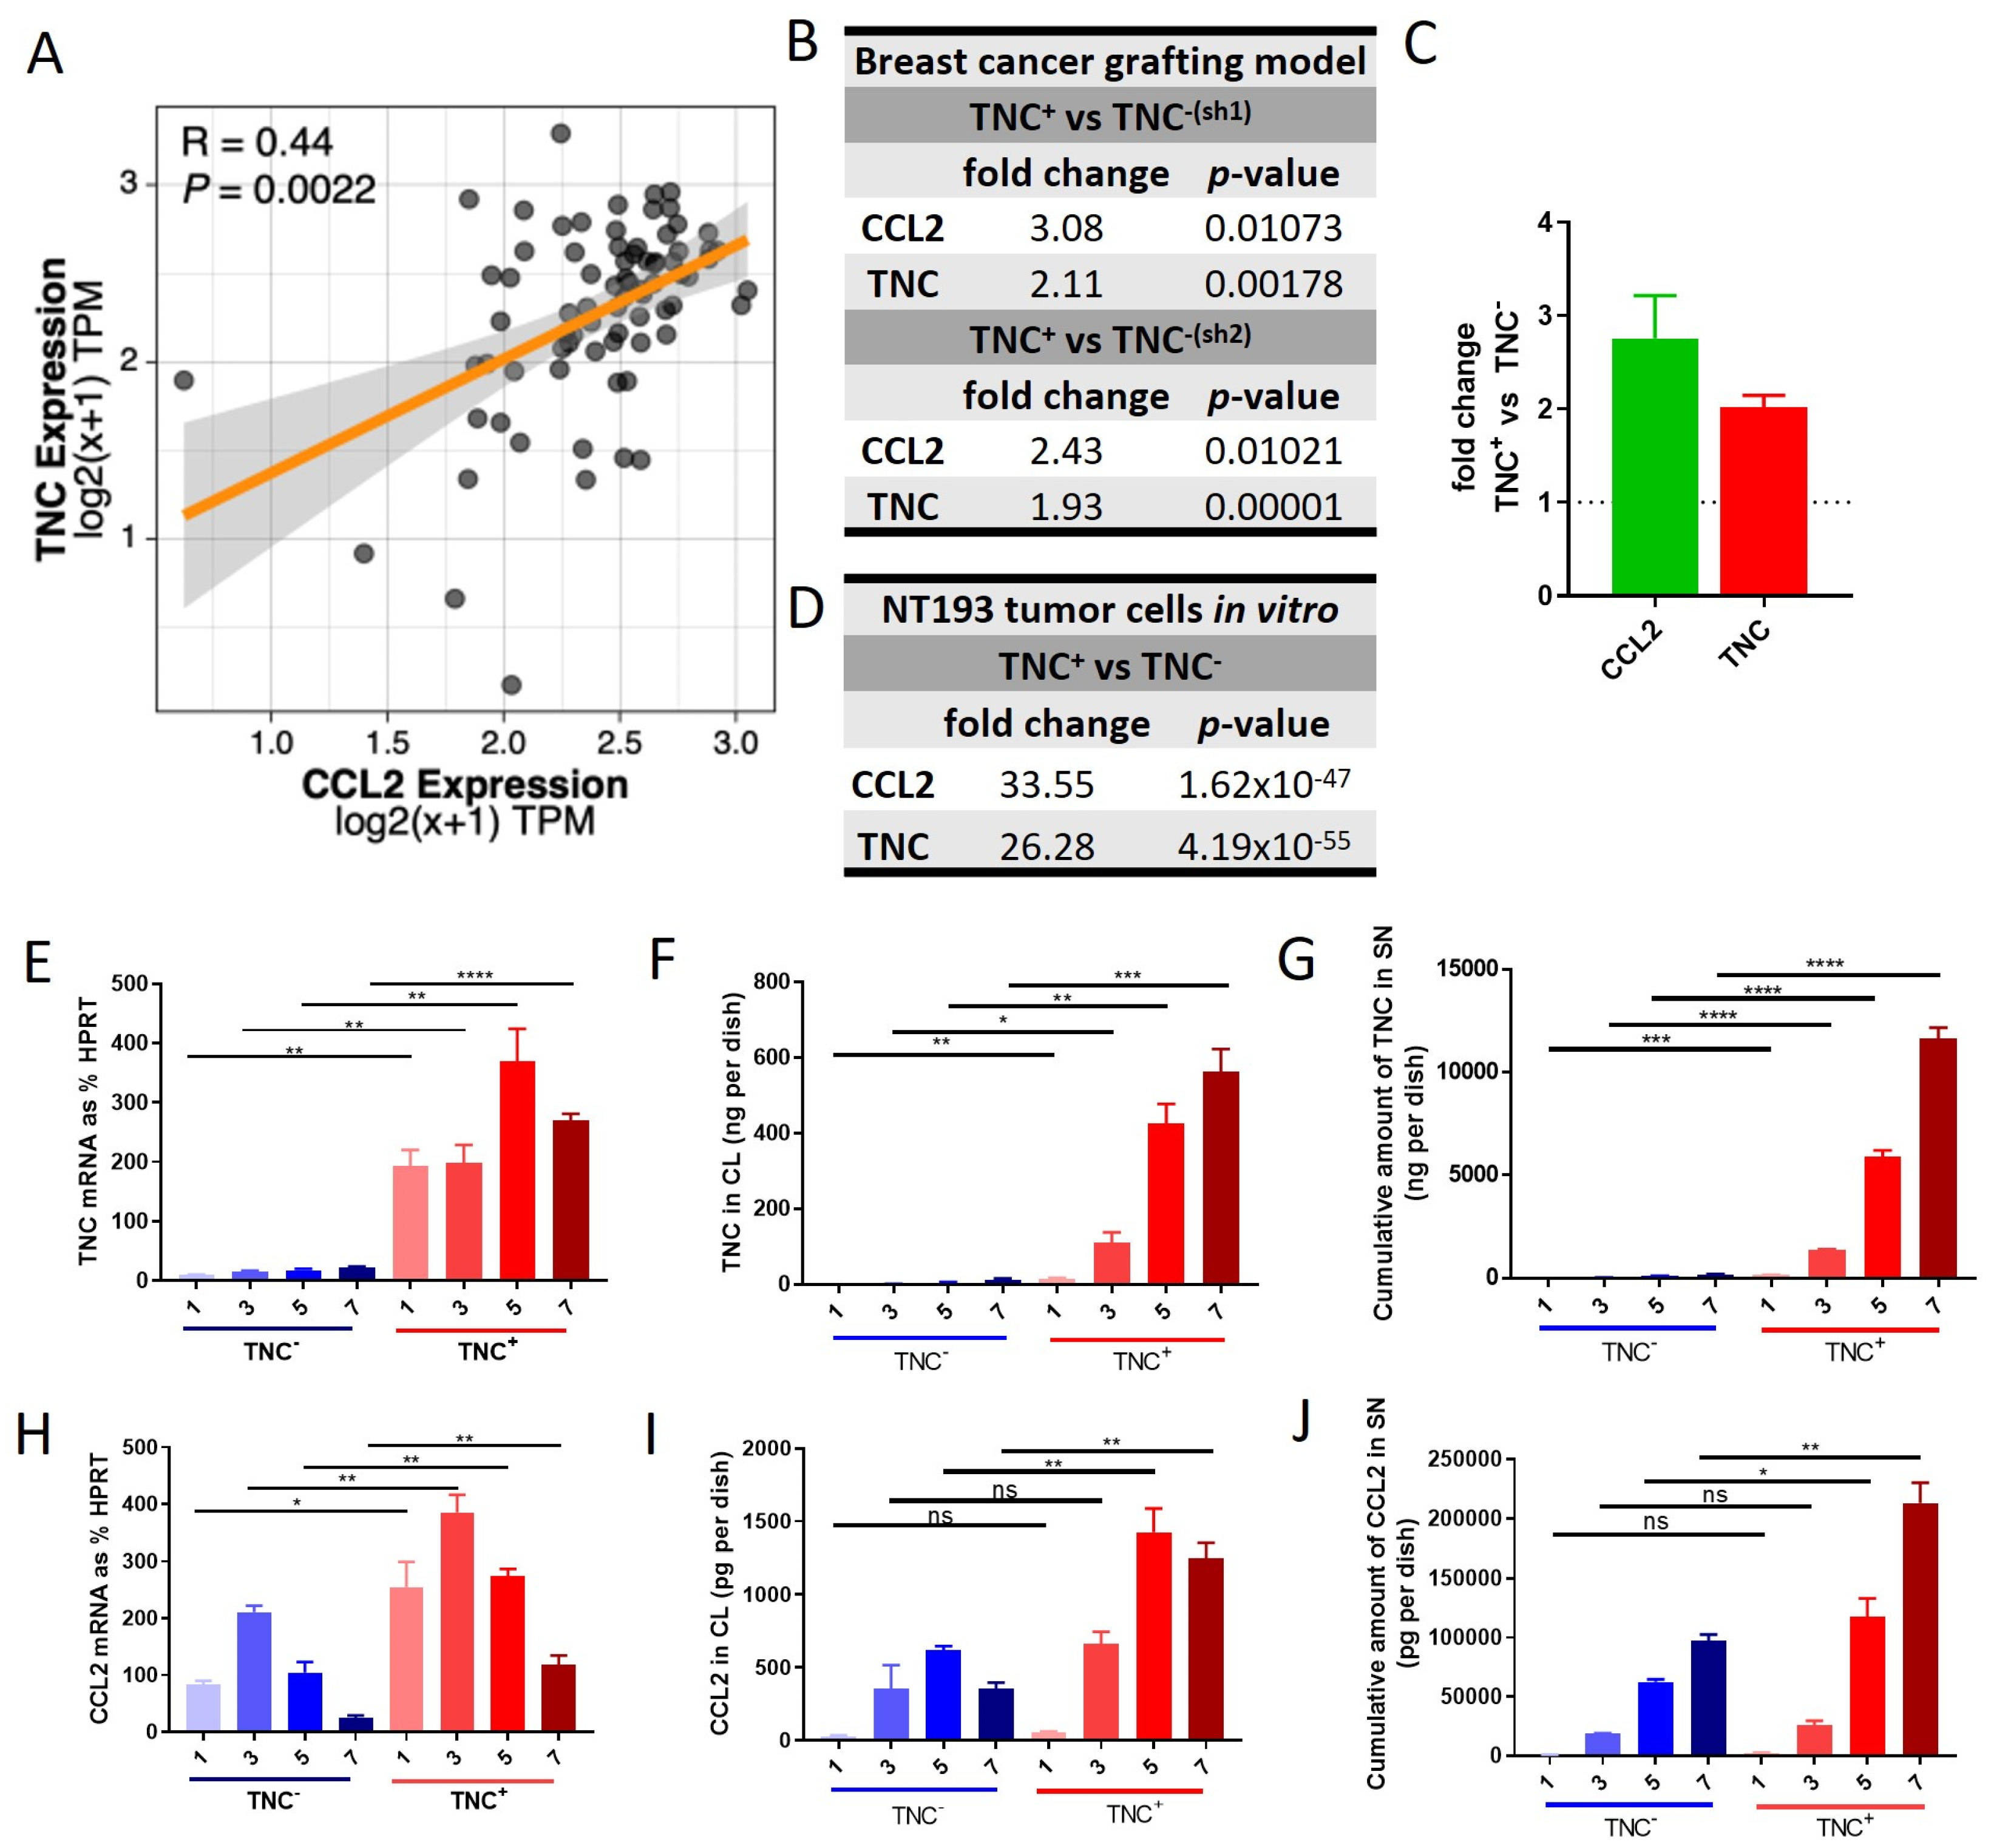
Abstract
1. Introduction
2. Results
2.1. Co-Expression of TNC and CCL2 in HER2+ Breast Cancer
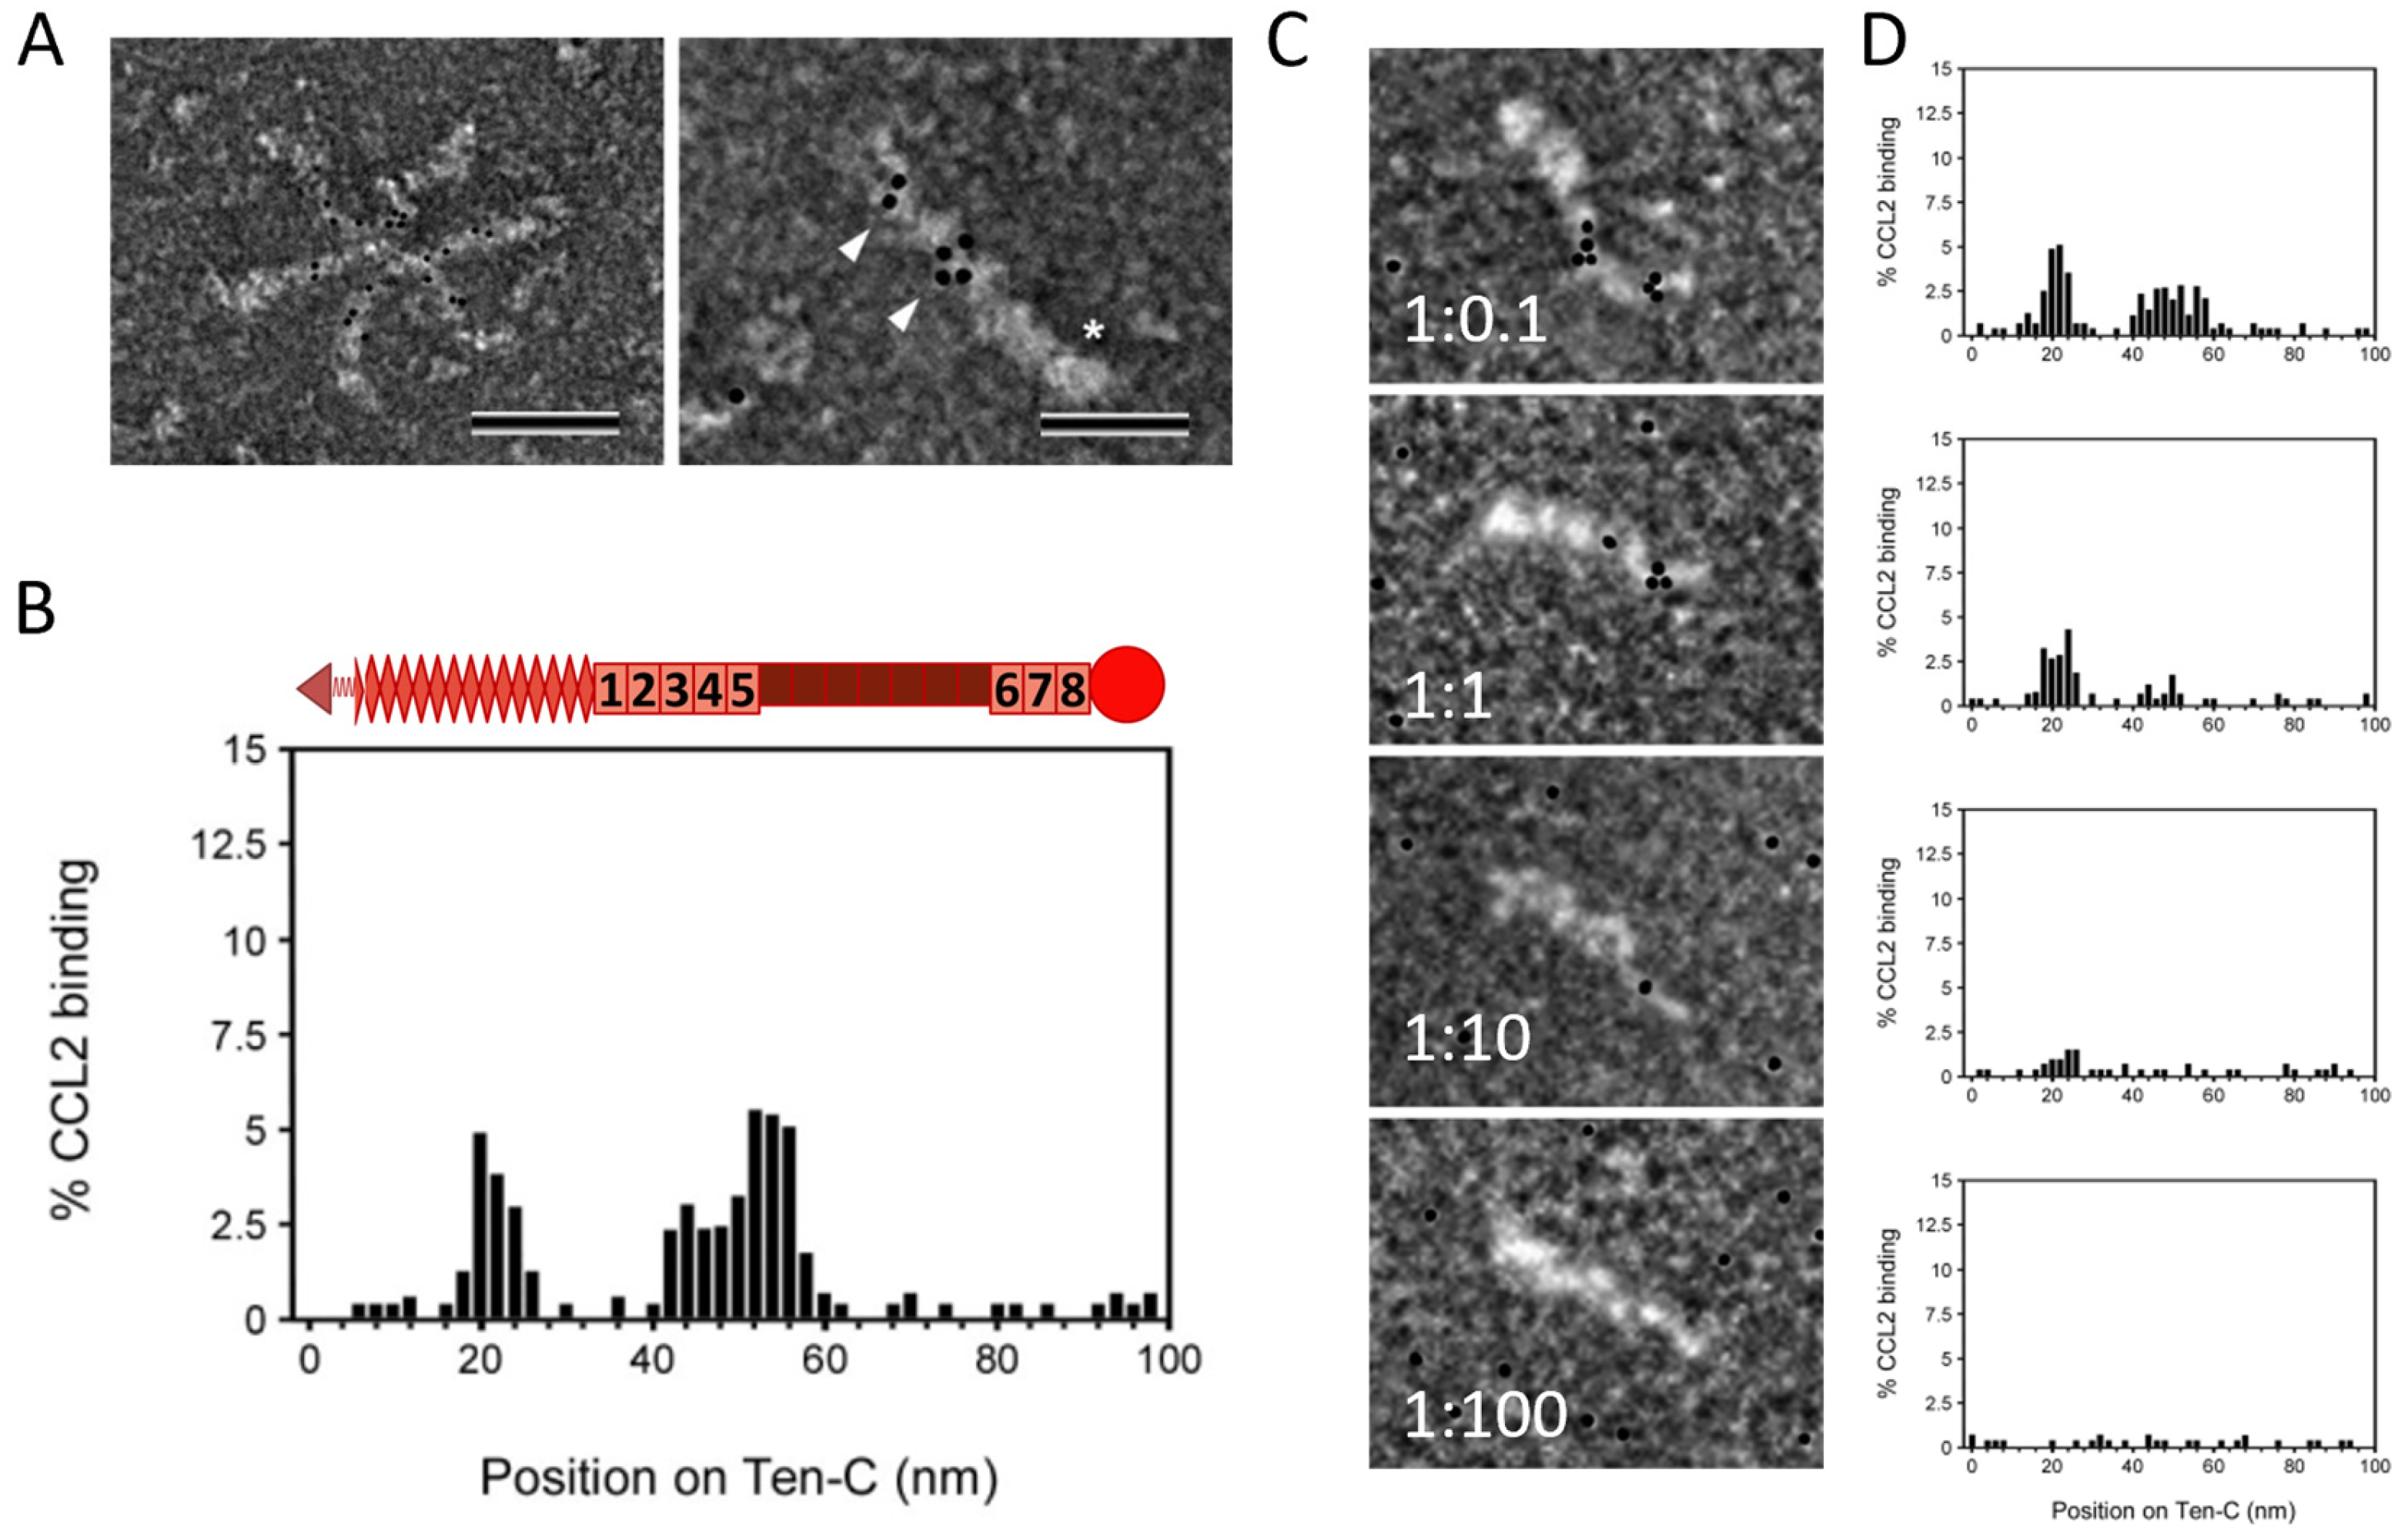
2.2. TNC Binds CCL2 and the GAG Heparin Interferes with Their Interaction
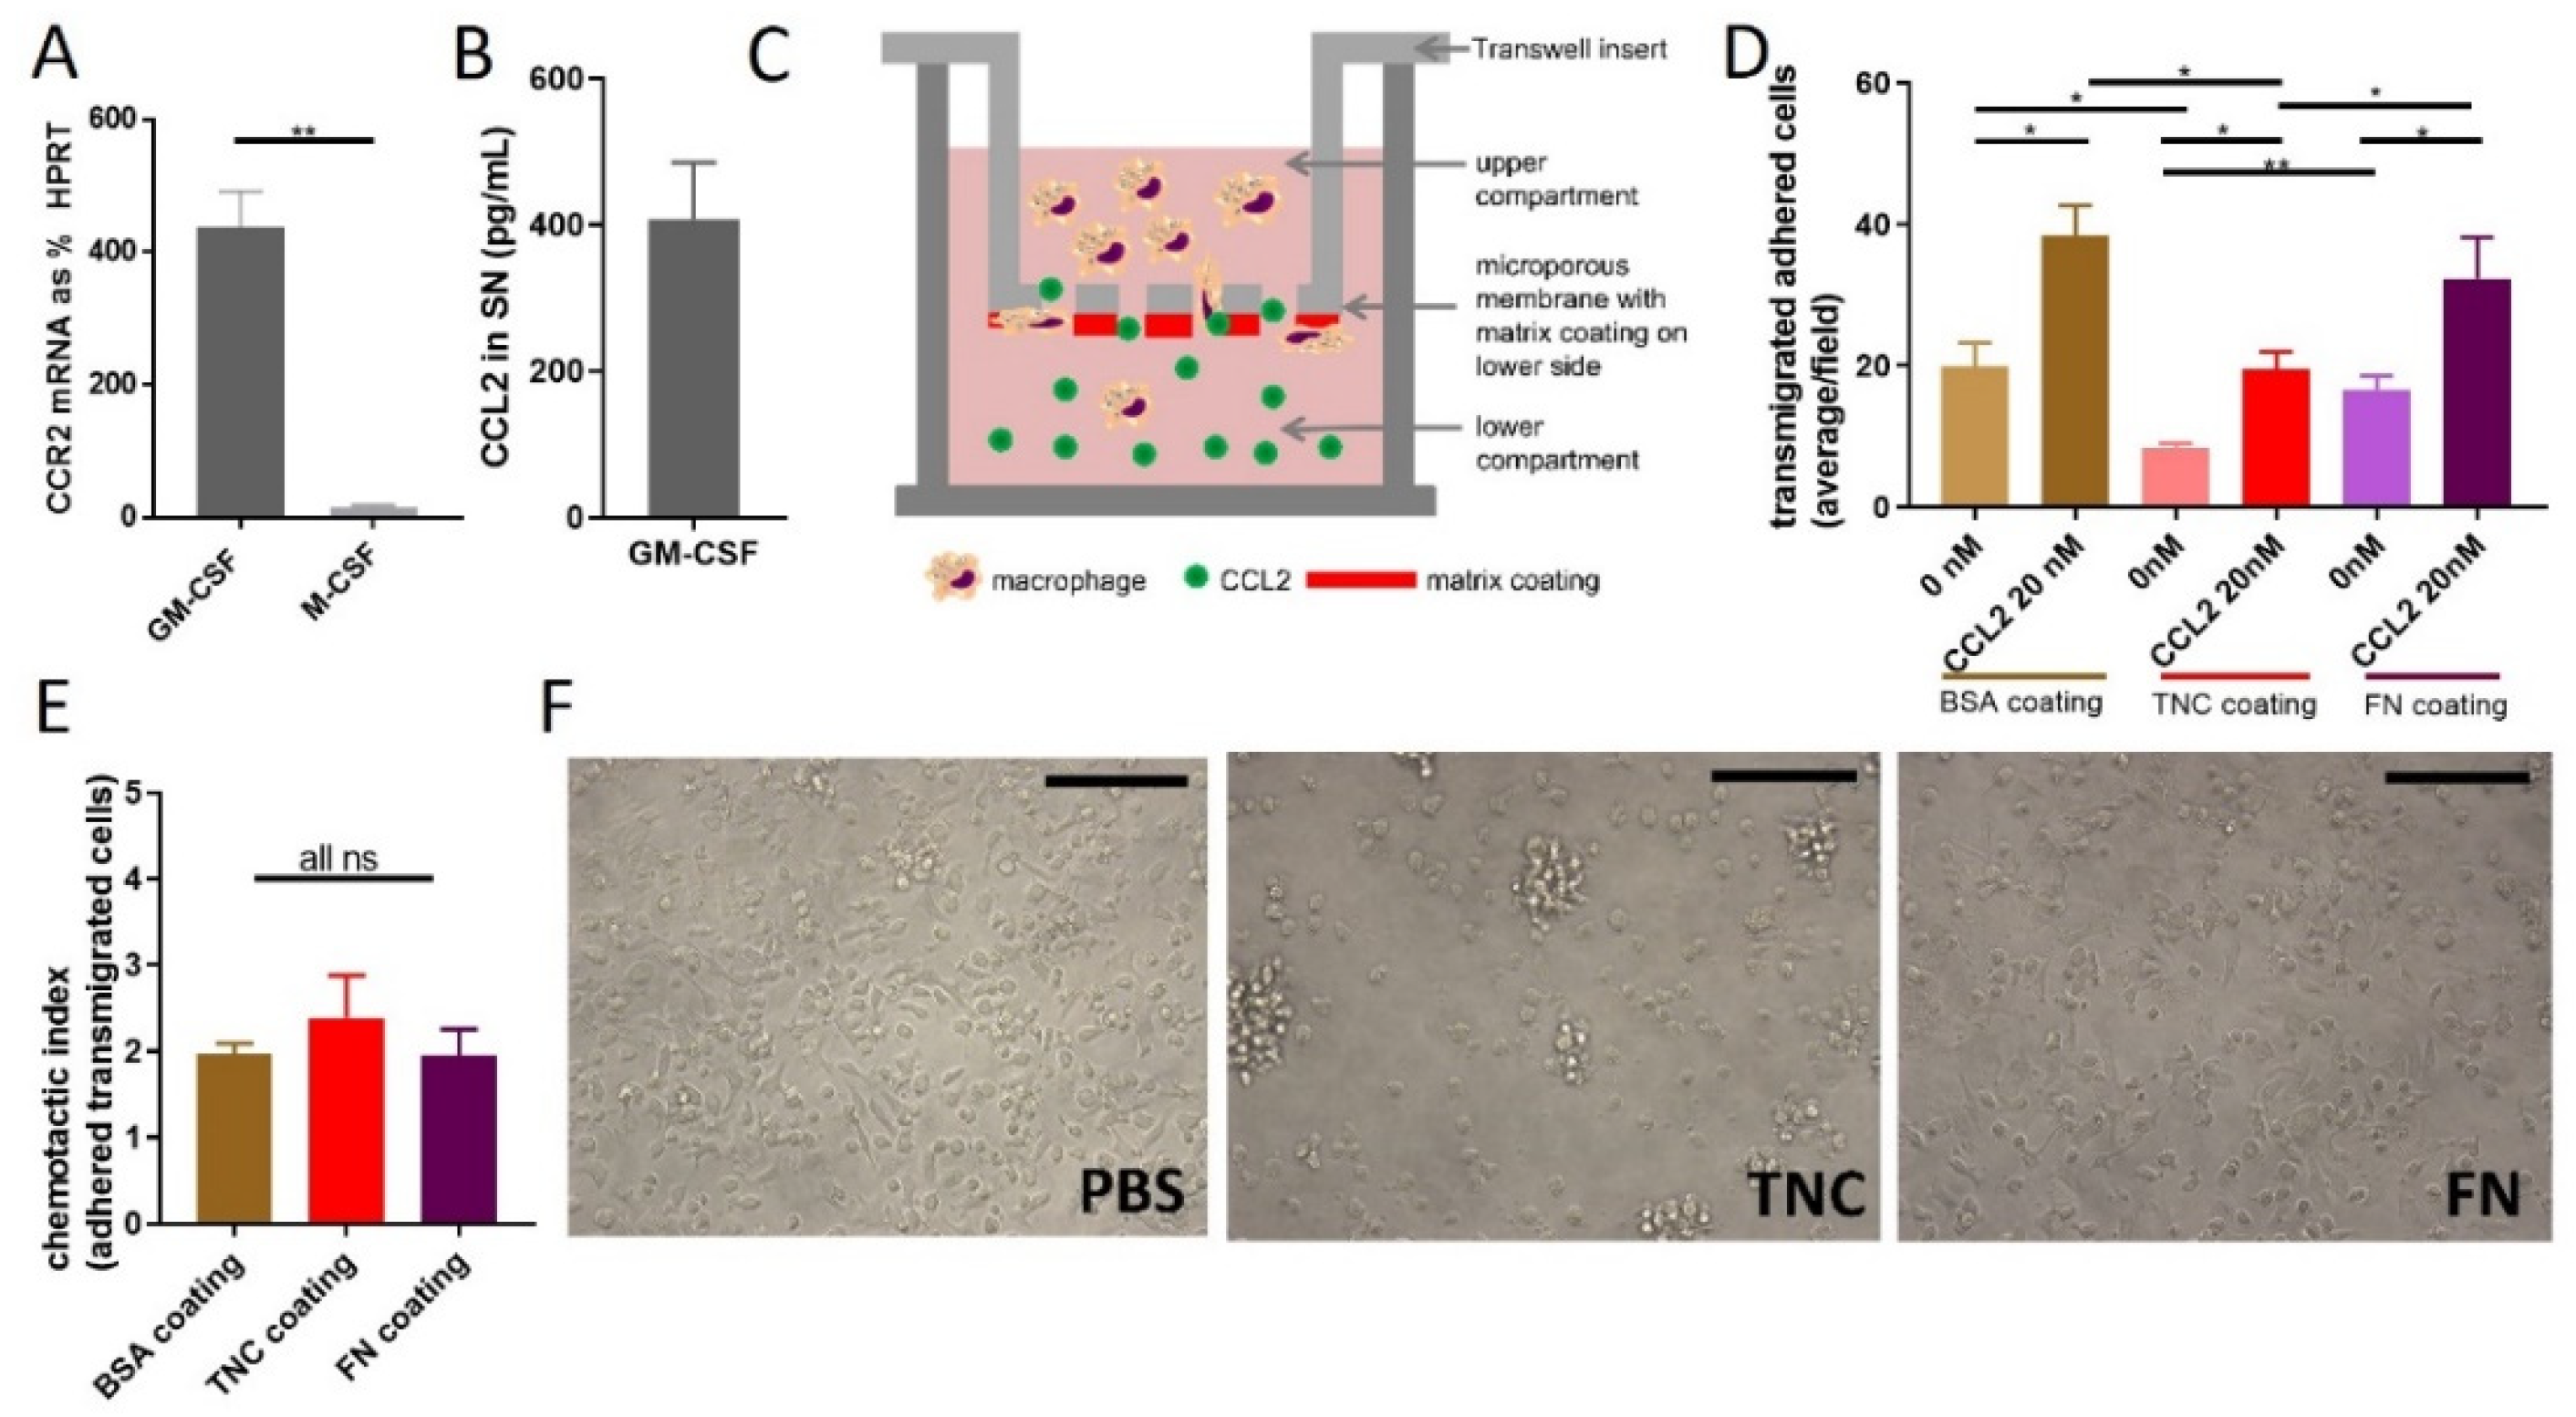
2.3. Does TNC Impact CCL2-Mediated Chemoattraction?
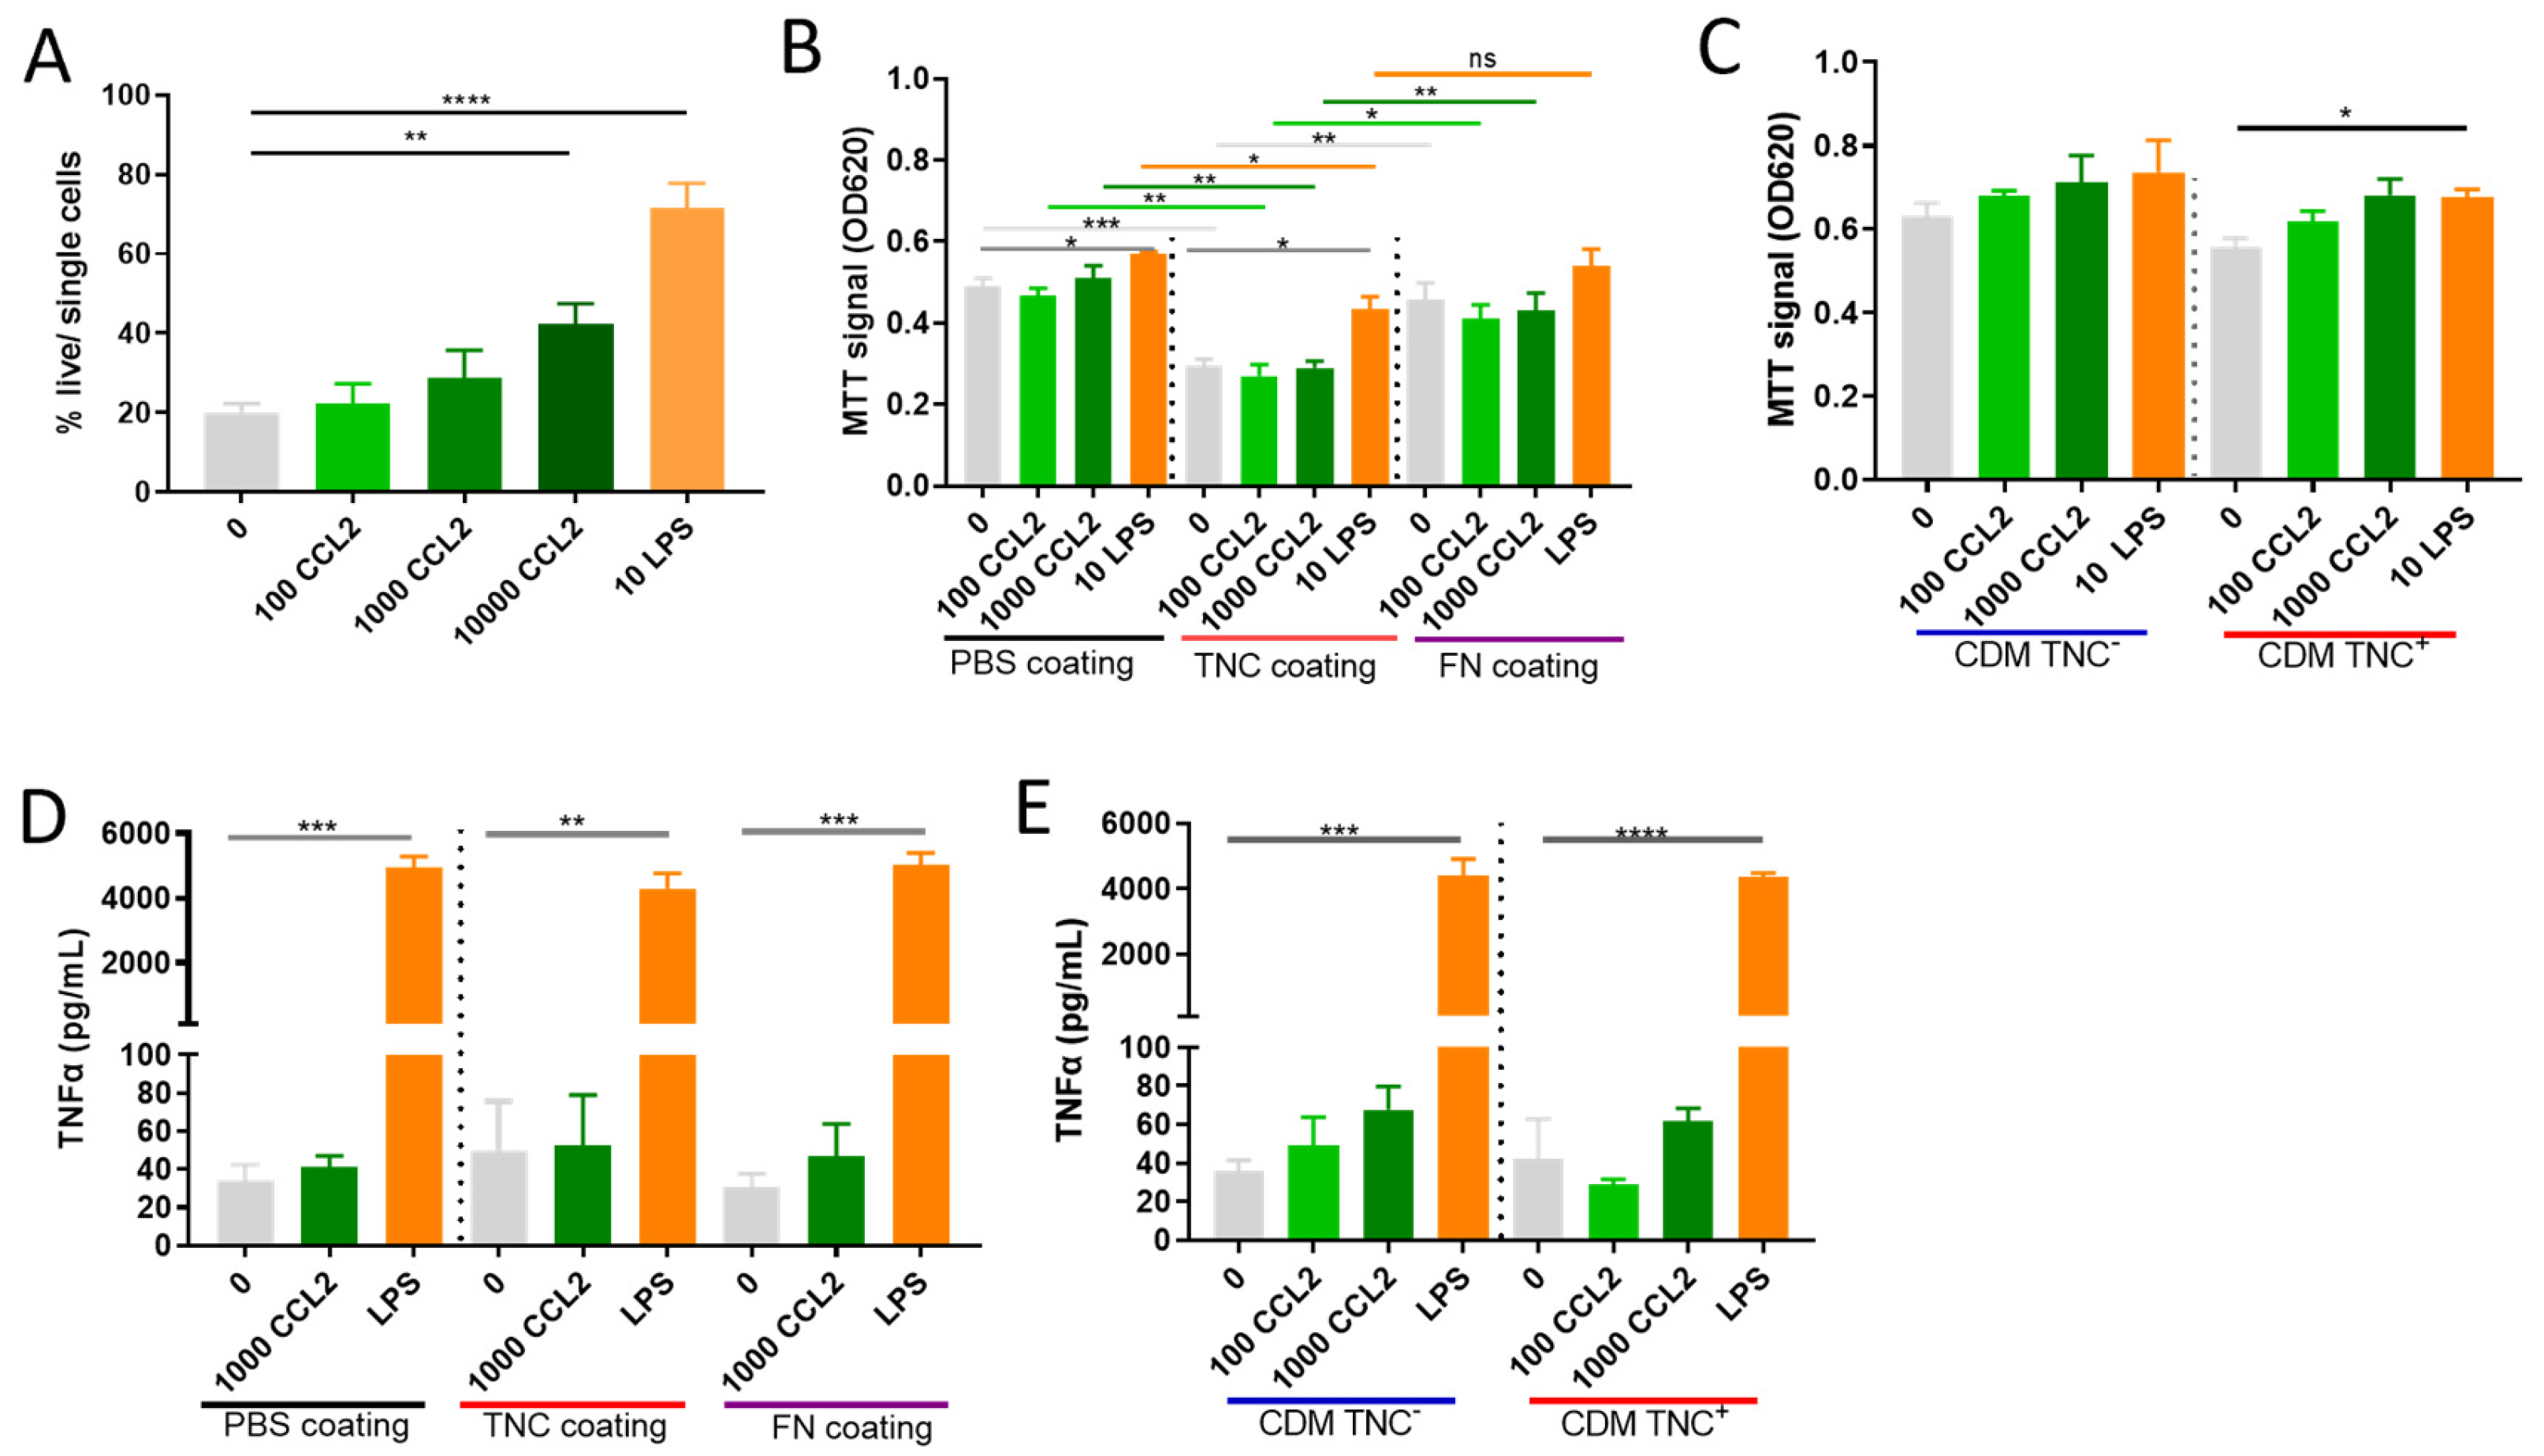
2.4. Does TNC Impact Atypical CCL2 Functions of Macrophage Survival and Activation?
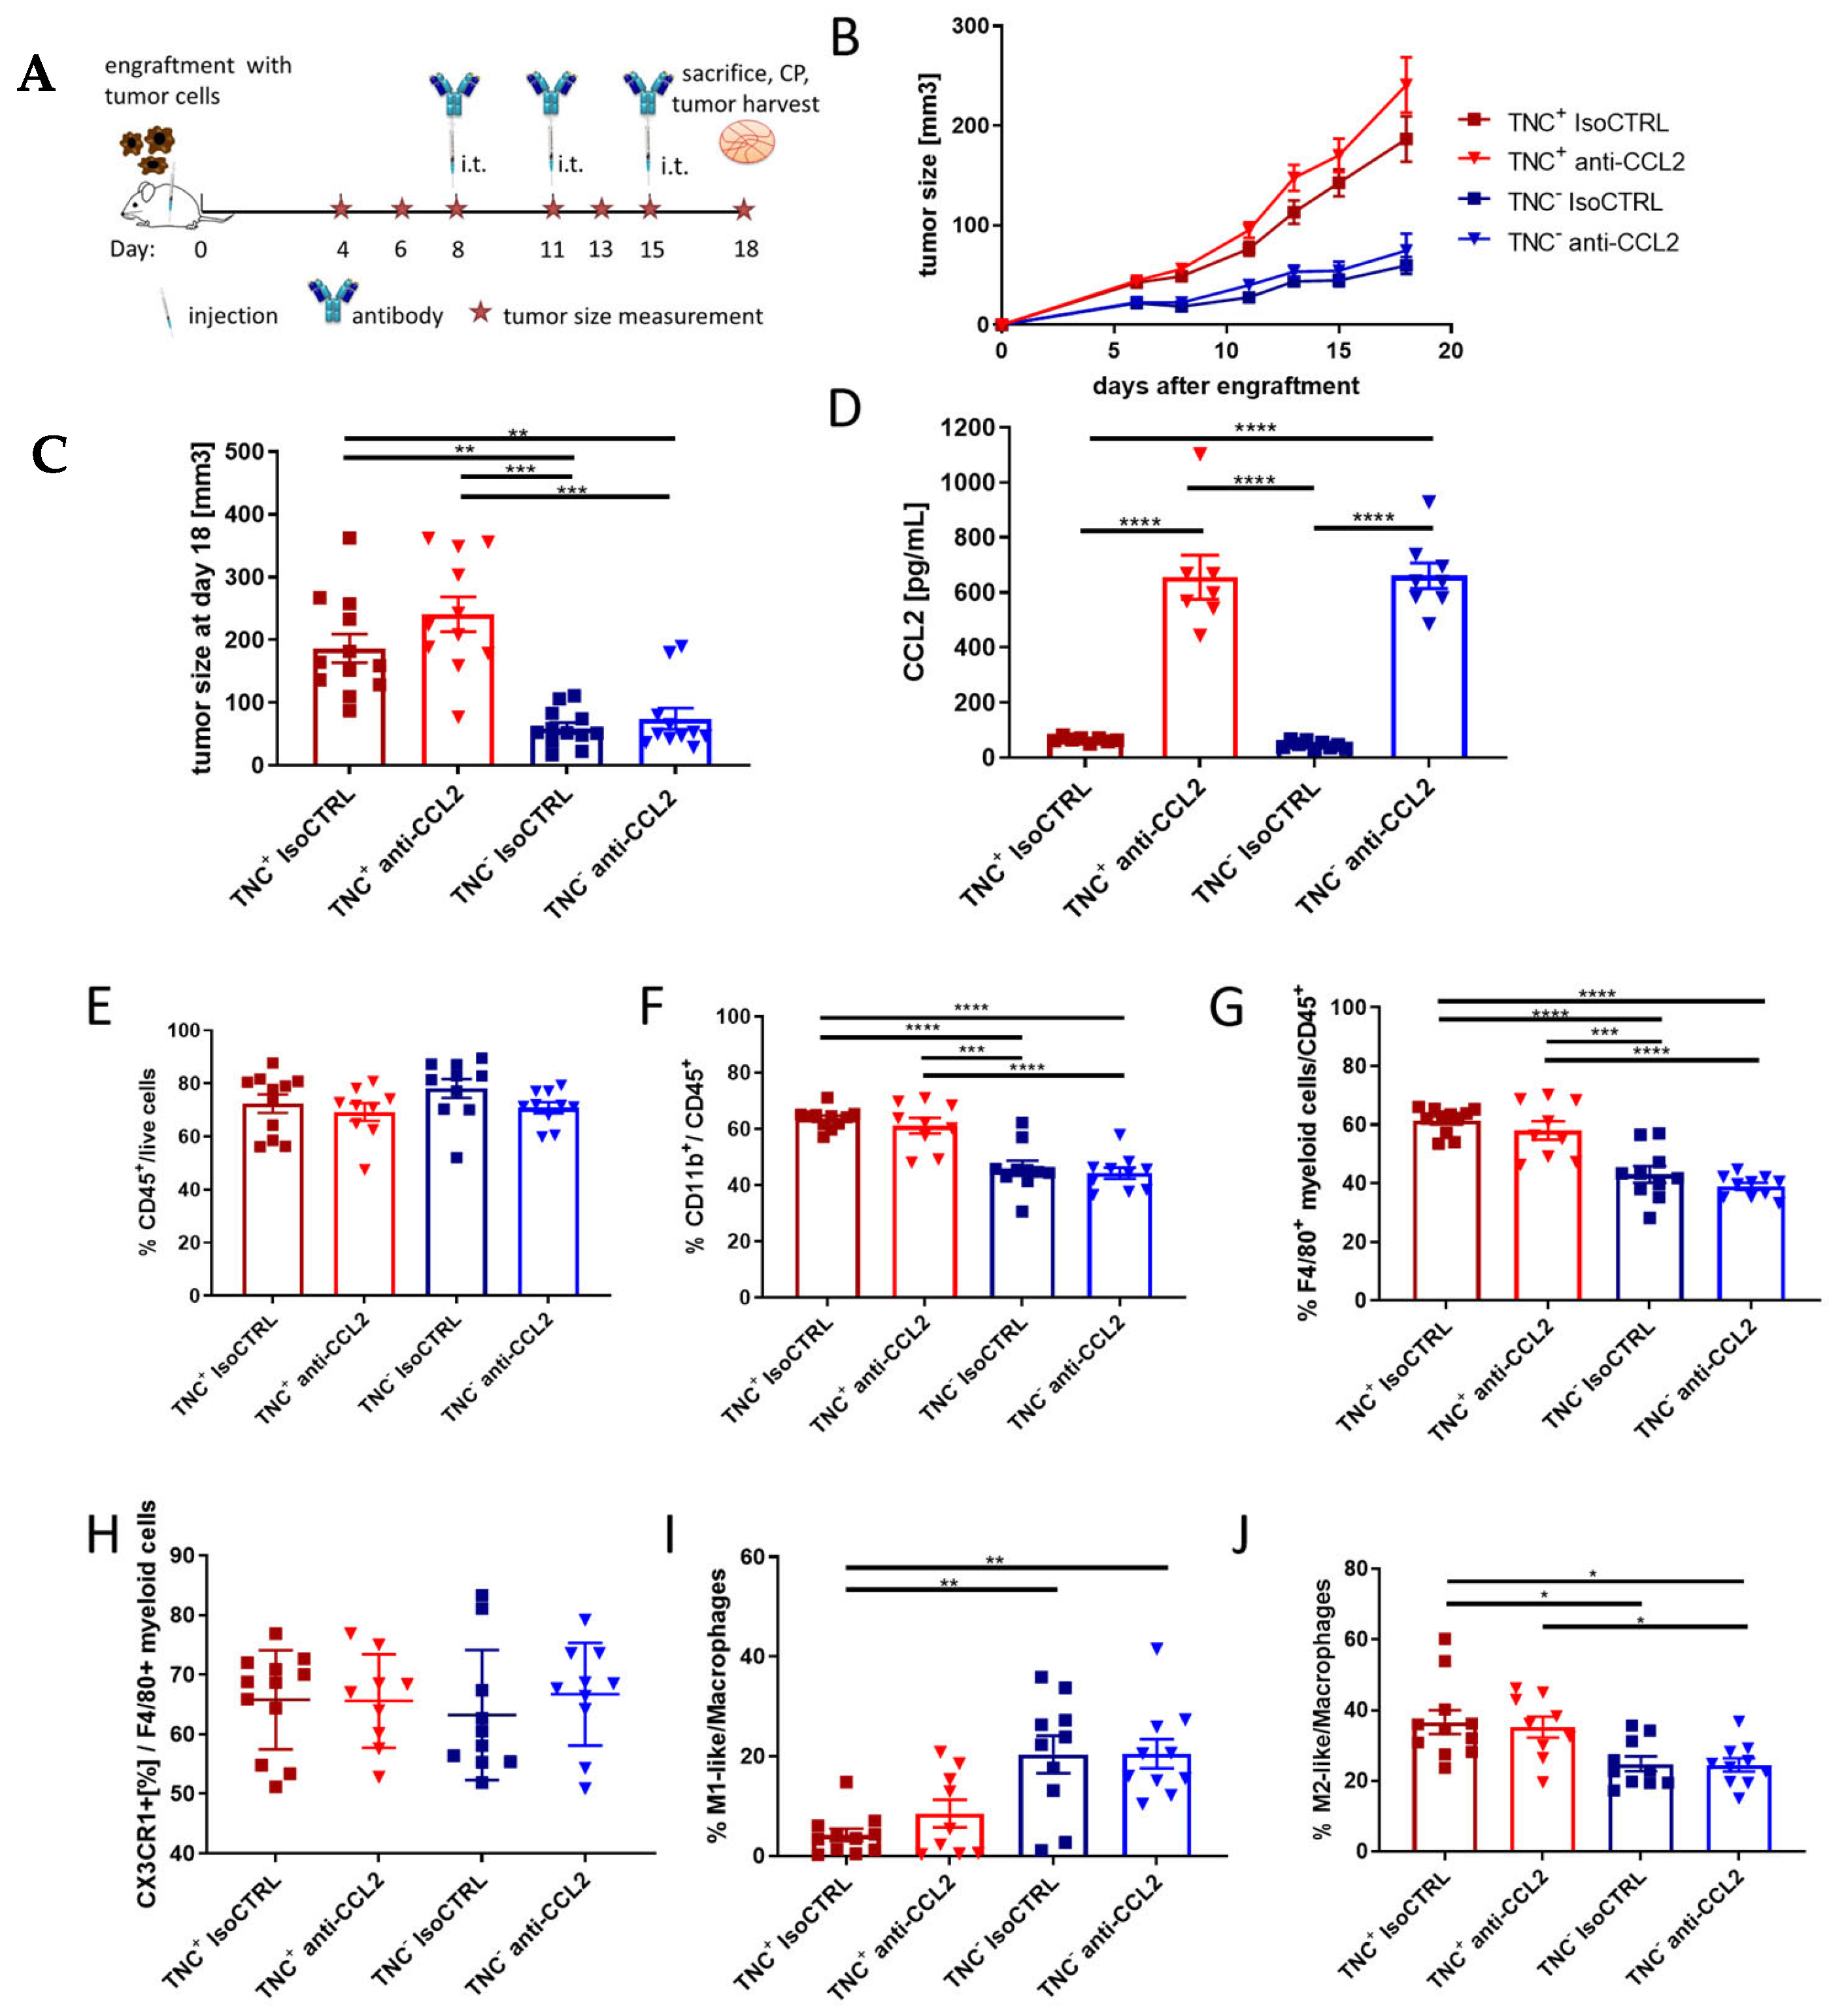
2.5. TNC Dominates Myeloid Cell Behavior Compared to CCL2 in an In Vivo Breast Cancer Progression Model
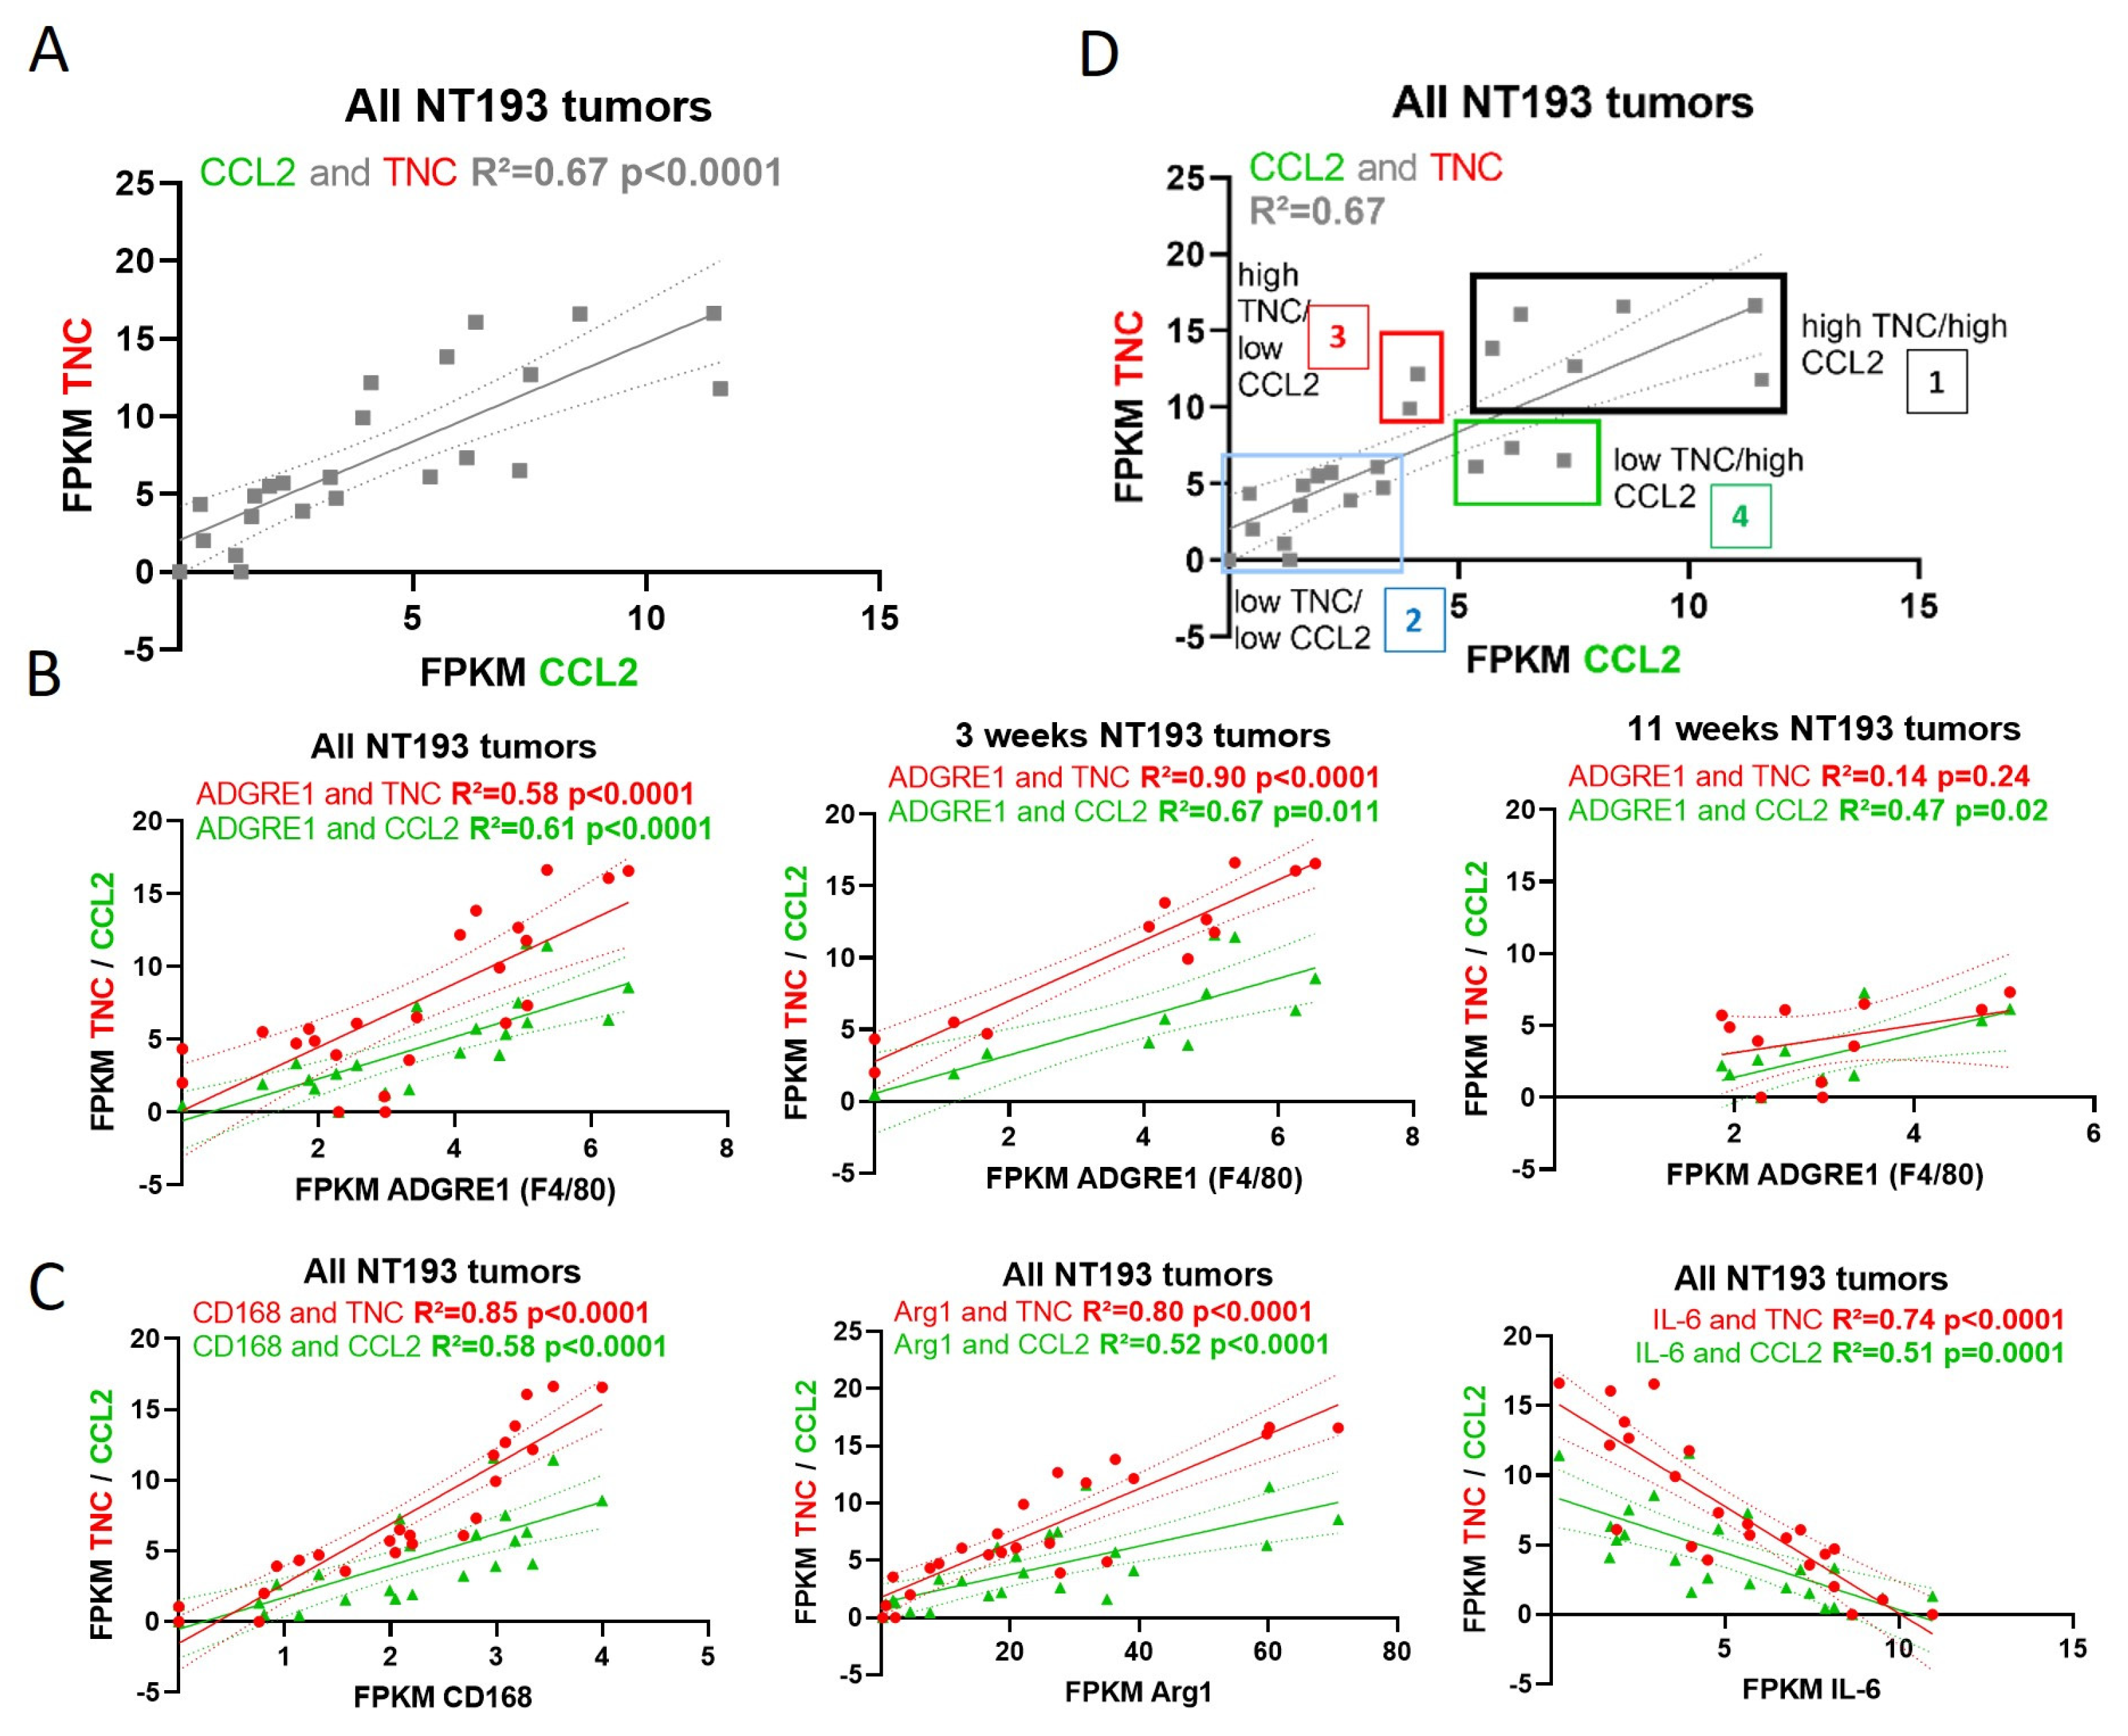
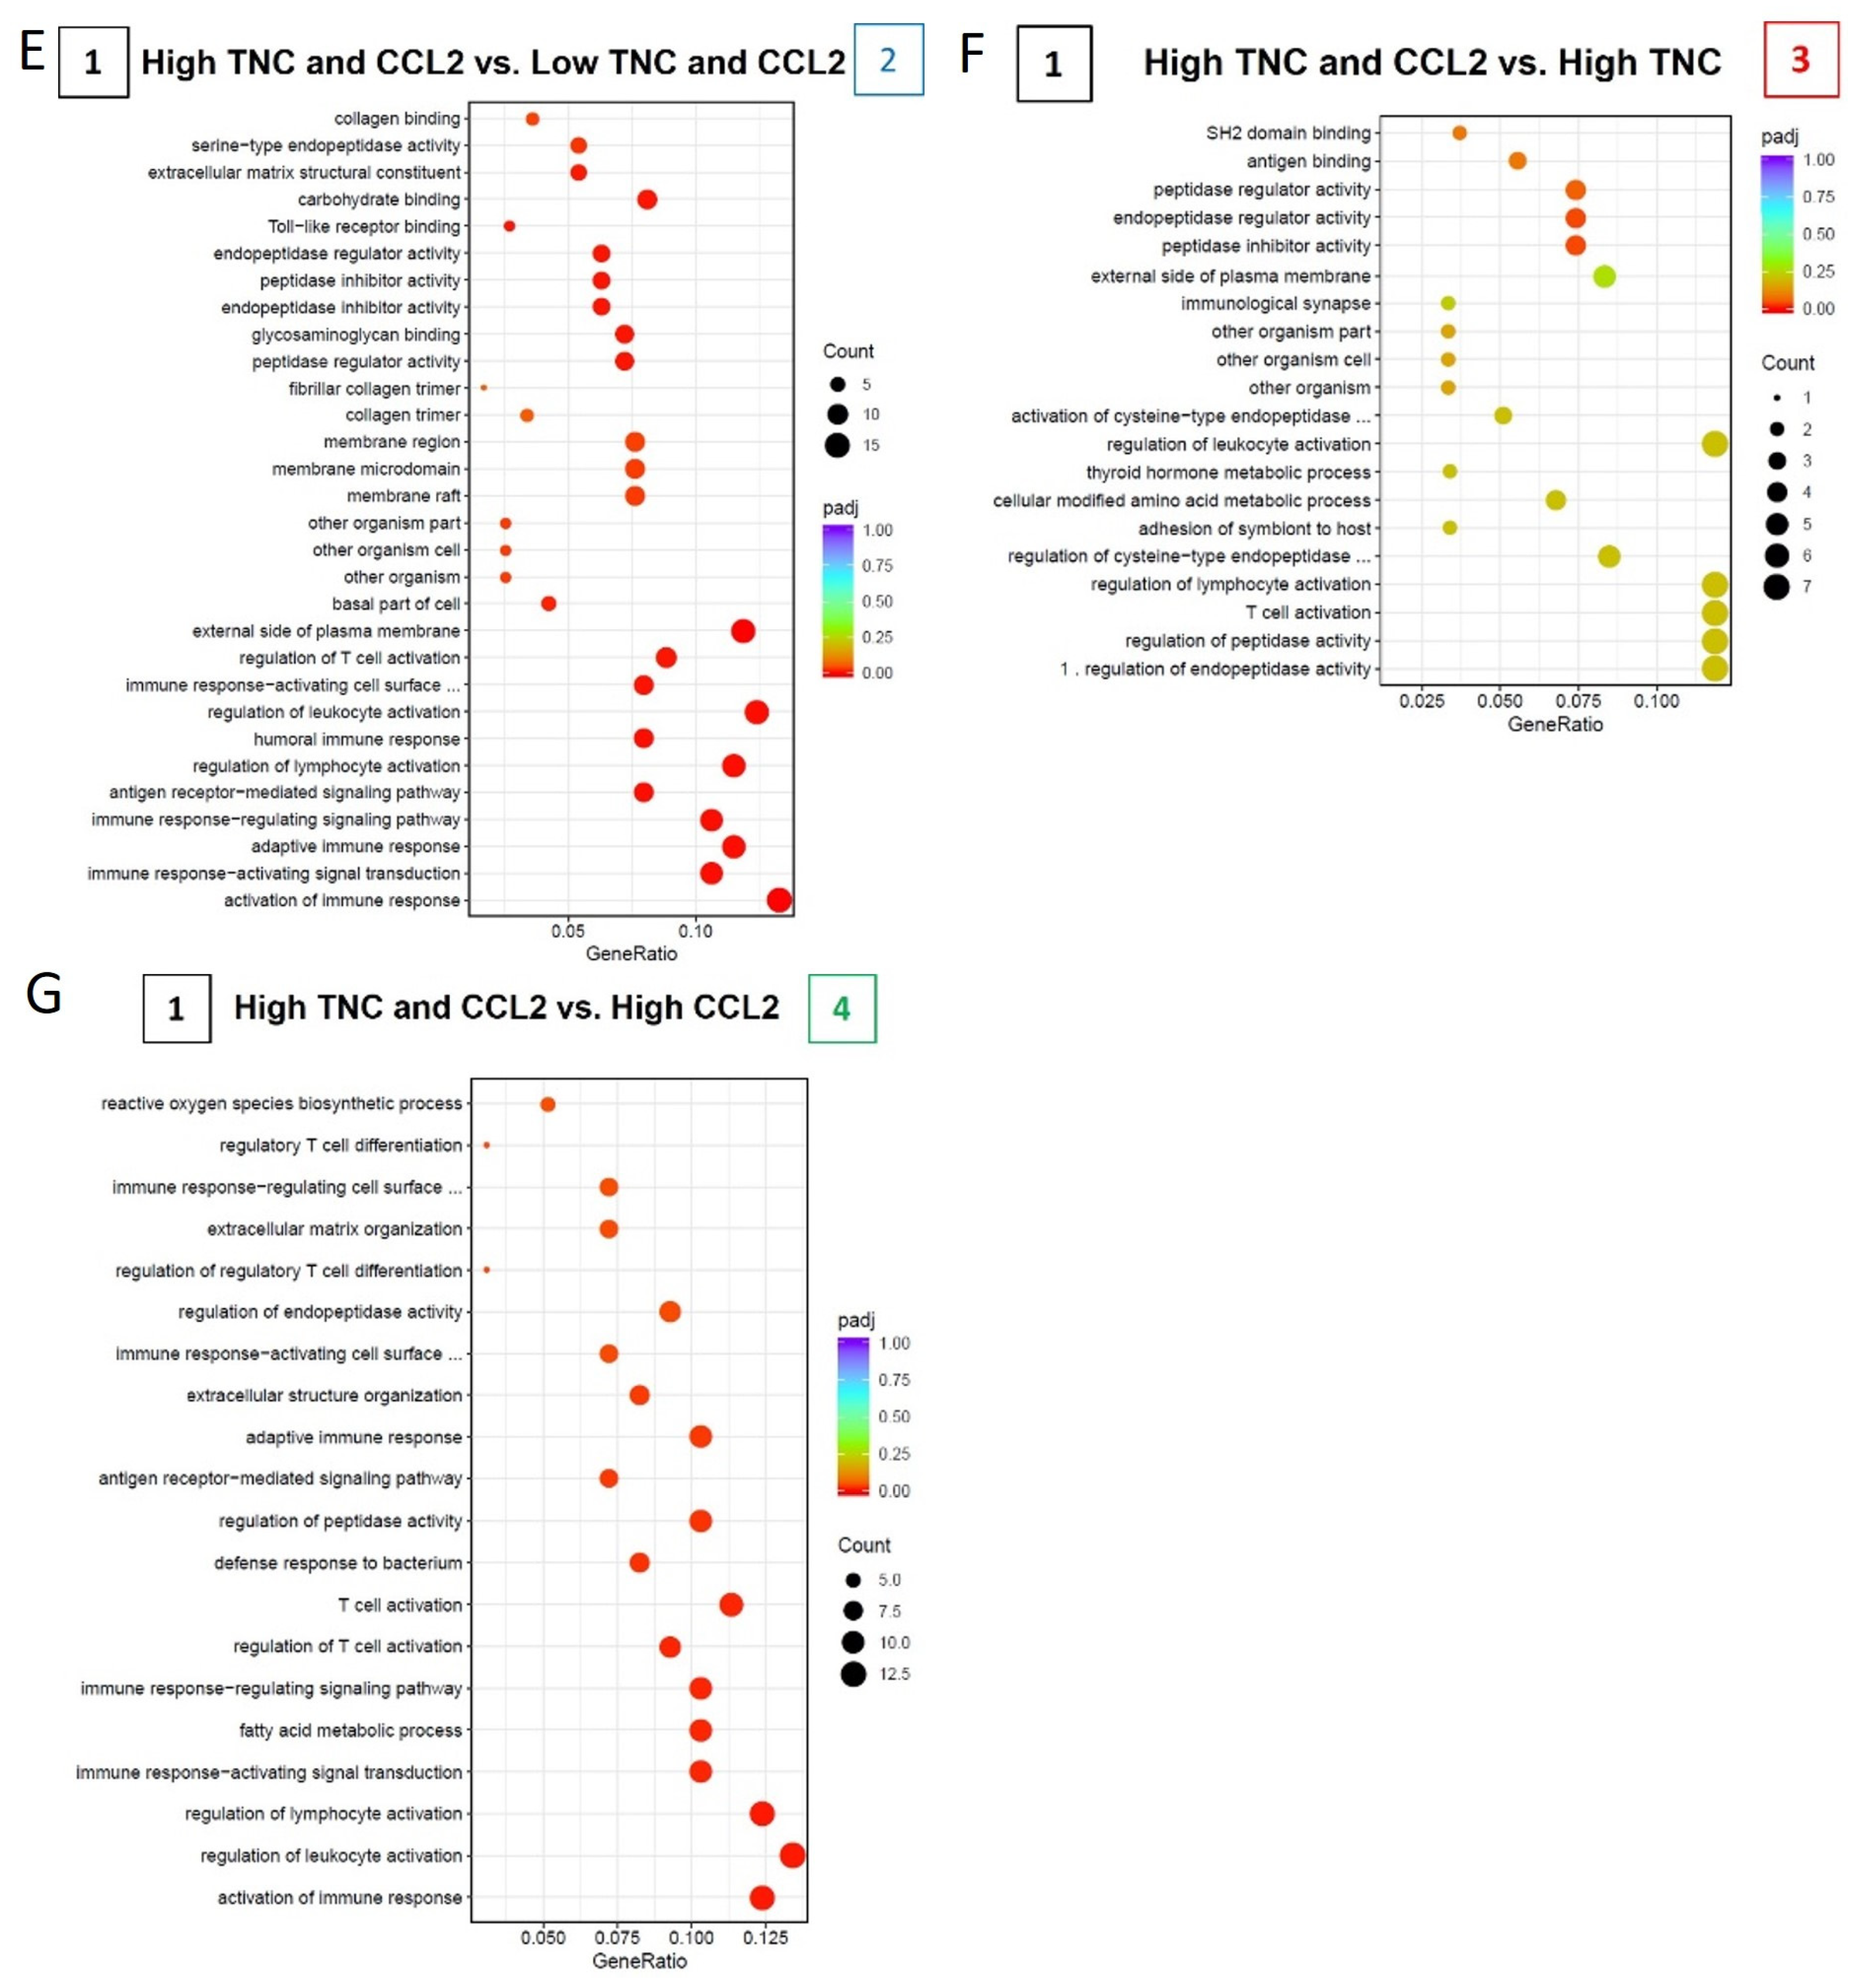
2.6. TNC-CCL2 Gene Interaction Networks Implicate Both Linked and Distinct Roles during Breast Tumor Development In Vivo
3. Discussion
4. Materials and Methods
4.1. Cell Lines
4.2. TNC and CCL2 mRNA and Protein Profiling in NT193 Cell Lines
4.3. TNC and CCL2 mRNA Profiling in Syngeneic Grafting In Vivo Model
4.4. TNC and CCL2 mRNA Profiling in Human Tumor RNA Sequencing Data
4.5. Recombinant Proteins
4.6. Gel Electrophoresis, Coomassie Blue Staining, Western Blot
4.7. Adhesion Assay
4.8. Endotoxin Test
4.9. Transmission Electron Microscopy
4.10. Surface Plasmon Resonance (SPR)
4.11. Bone Marrow Cell Isolation, Differentiation and Culture
4.12. Migration Assay of mBMMs
4.13. mBMM Activation Assay
4.13.1. Activation in the Absence of Matrix Molecules
4.13.2. Activation on Cell Derived Matrices (CDMs)
4.14. In Vivo Procedures
4.15. Tumor Engraftment and Antibody Treatment
4.16. Flow Cytometry
4.17. Statistical Analysis
5. Conclusions
Supplementary Materials
Author Contributions
Funding
Institutional Review Board Statement
Informed Consent Statement
Data Availability Statement
Acknowledgments
Conflicts of Interest
References
- He, Y.; Liu, T.; Dai, S.; Xu, Z.; Wang, L.; Luo, F. Tumor-Associated Extracellular Matrix: How to Be a Potential Aide to Anti-tumor Immunotherapy? Front. Cell Dev. Biol. 2021, 9, 739161. [Google Scholar] [CrossRef] [PubMed]
- Gordon, S.; Plüddemann, A.; Martinez Estrada, F. Macrophage heterogeneity in tissues: Phenotypic diversity and functions. Immunol. Rev. 2014, 262, 36–55. [Google Scholar] [CrossRef]
- Kai, F.; Drain, A.P.; Weaver, V.M. The extracellular matrix modulates the metastatic journey. Dev. Cell 2019, 49, 332–346. [Google Scholar] [CrossRef] [PubMed]
- Deligne, C.; Midwood, K.S. Macrophages and extracellular matrix in breast cancer: Partners in crime or protective allies? Front. Oncol. 2021, 11, 620773. [Google Scholar] [CrossRef] [PubMed]
- Ozga, A.J.; Chow, M.T.; Luster, A.D. Chemokines and the immune response to cancer. Immunity 2021, 54, 859–874. [Google Scholar] [CrossRef]
- Korbecki, J.; Kojder, K.; Simińska, D.; Bohatyrewicz, R.; Gutowska, I.; Chlubek, D.; Baranowska-Bosiacka, I. CC chemokines in a tumor: A review of pro-cancer and anti-cancer properties of the ligands of receptors CCR1, CCR2, CCR3, and CCR4. Int. J. Mol. Sci. 2020, 21, 8412. [Google Scholar] [CrossRef]
- Proudfoot, A.E.; Bonvin, P.; Power, C.A. Targeting chemokines: Pathogens can, why can’t we? Cytokine 2015, 74, 259–267. [Google Scholar] [CrossRef]
- Dyer, D.P. Understanding the mechanisms that facilitate specificity, not redundancy, of chemokine-mediated leukocyte recruitment. Immunology 2020, 160, 336–344. [Google Scholar] [CrossRef]
- Handel, T.M.; Johnson, Z.; Crown, S.E.; Lau, E.K.; Proudfoot, A.E. Regulation of protein function by glycosaminoglycans—As exemplified by chemokines. Annu. Rev. Biochem. 2005, 74, 385–410. [Google Scholar] [CrossRef]
- Hoogewerf, A.J.; Kuschert, G.S.; Proudfoot, A.E.; Borlat, F.; Clark-Lewis, I.; Power, C.A.; Wells, T.N. Glycosaminoglycans mediate cell surface oligomerization of chemokines. Biochemistry 1997, 36, 13570–13578. [Google Scholar] [CrossRef]
- Kuschert, G.S.; Coulin, F.; Power, C.A.; Proudfoot, A.E.; Hubbard, R.E.; Hoogewerf, A.J.; Wells, T.N. Glycosaminoglycans interact selectively with chemokines and modulate receptor binding and cellular responses. Biochemistry 1999, 38, 12959–12968. [Google Scholar] [CrossRef]
- Proudfoot, A.E.I. The biological relevance of chemokine-proteoglycan interactions. Biochem. Soc. Trans. 2006, 34, 422–426. [Google Scholar] [CrossRef]
- Dyer, D.P.; Salanga, C.L.; Volkman, B.F.; Kawamura, T.; Handel, T.M. The dependence of chemokine-glycosaminoglycan interactions on chemokine oligomerization. Glycobiology 2016, 26, 312–326. [Google Scholar] [CrossRef]
- Gschwandtner, M.; Strutzmann, E.; Teixeira, M.M.; Anders, H.J.; Diedrichs-Möhring, M.; Gerlza, T.; Wildner, G.; Russo, R.C.; Adage, T.; Kungl, A.J. Glycosaminoglycans are important mediators of neutrophilic inflammation in vivo. Cytokine 2017, 91, 65–73. [Google Scholar] [CrossRef]
- Proudfoot, A.E.I.; Handel, T.M.; Johnson, Z.; Lau, E.K.; LiWang, P.; Clark-Lewis, I.; Borlat, F.; Wells, T.N.C.; Kosco-Vilbois, M.H. Glycosaminoglycan binding and oligomerization are essential for the in vivo activity of certain chemokines. Proc. Natl. Acad. Sci. USA 2003, 100, 1885–1890. [Google Scholar] [CrossRef]
- Pelletier, A.J.; van der Laan, L.J.; Hildbrand, P.; Siani, M.A.; Thompson, D.A.; Dawson, P.E.; Torbett, B.E.; Salomon, D.R. Presentation of chemokine SDF-1 alpha by fibronectin mediates directed migration of T cells. Blood 2000, 96, 2682–2690. [Google Scholar] [CrossRef]
- Murdamoothoo, D.; Sun, Z.; Yilmaz, A.; Riegel, G.; Abou-Faycal, C.; Deligne, C.; Velazquez-Quesada, I.; Erne, W.; Nascimento, M.; Mörgelin, M. Tenascin-C immobilizes infiltrating T lymphocytes through CXCL12 promoting breast cancer progression. EMBO Mol. Med. 2021, 13, e13270. [Google Scholar] [CrossRef]
- Yang, B.-G.; Tanaka, T.; Jang, M.H.; Bai, Z.; Hayasaka, H.; Miyasaka, M. Binding of lymphoid chemokines to collagen IV that accumulates in the basal lamina of high endothelial venules: Its implications in lymphocyte trafficking. J. Immunol. 2007, 179, 4376–4382. [Google Scholar] [CrossRef]
- Oskarsson, T.; Acharyya, S.; Zhang, X.H.-F.; Vanharanta, S.; Tavazoie, S.F.; Morris, P.G.; Downey, R.J.; Manova-Todorova, K.; Brogi, E.; Massagué, J. Breast cancer cells produce tenascin C as a metastatic niche component to colonize the lungs. Nat. Med. 2011, 17, 867–874. [Google Scholar] [CrossRef]
- Wang, J.; Zhuang, Z.-G.; Xu, S.-F.; He, Q.; Shao, Y.-G.; Ji, M.; Yang, L.; Bao, W. Expression of CCL2 is significantly different in five breast cancer genotypes and predicts patient outcome. Int. J. Clin. Exp. Med. 2015, 8, 15684. [Google Scholar]
- Ueno, T.; Toi, M.; Saji, H.; Muta, M.; Bando, H.; Kuroi, K.; Koike, M.; Inadera, H.; Matsushima, K. Significance of macrophage chemoattractant protein-1 in macrophage recruitment, angiogenesis, and survival in human breast cancer. Clin. Cancer Res. 2000, 6, 3282–3289. [Google Scholar] [PubMed]
- Qian, B.; Li, J.; Zhang, H.; Zhang, J.; Snyder, L.A.; Pollard, J.W. CCL2 recruits inflammatory monocytes to facilitate breast tumor metastasis. Cancer Res. 2011, 71, 2842. [Google Scholar] [CrossRef]
- Fujimoto, H.; Sangai, T.; Ishii, G.; Ikehara, A.; Nagashima, T.; Miyazaki, M.; Ochiai, A. Stromal MCP-1 in mammary tumors induces tumor-associated macrophage infiltration and contributes to tumor progression. Int. J. Cancer 2009, 125, 1276–1284. [Google Scholar] [CrossRef] [PubMed]
- Sun, Z.; Velázquez-Quesada, I.; Murdamoothoo, D.; Ahowesso, C.; Yilmaz, A.; Spenlé, C.; Averous, G.; Erne, W.; Oberndorfer, F.; Oszwald, A. Tenascin-C increases lung metastasis by impacting blood vessel invasions. Matrix Biol. 2019, 83, 26–47. [Google Scholar] [CrossRef] [PubMed]
- Deligne, C.; Murdamoothoo, D.; Gammage, A.N.; Gschwandtner, M.; Erne, W.; Loustau, T.; Marzeda, A.M.; Carapito, R.; Paul, N.; Velazquez-Quesada, I. Matrix-targeting immunotherapy controls tumor growth and spread by switching macrophage phenotype. Cancer Immunol. Res. 2020, 3, 368–382. [Google Scholar] [CrossRef]
- Bonapace, L.; Coissieux, M.-M.; Wyckoff, J.; Mertz, K.D.; Varga, Z.; Junt, T.; Bentires-Alj, M. Cessation of CCL2 inhibition accelerates breast cancer metastasis by promoting angiogenesis. Nature 2014, 515, 130–133. [Google Scholar] [CrossRef]
- Li, D.; Ji, H.; Niu, X.; Yin, L.; Wang, Y.; Gu, Y.; Wang, J.; Zhou, X.; Zhang, H.; Zhang, Q. Tumor-associated macrophages secrete CC-chemokine ligand 2 and induce tamoxifen resistance by activating PI3K/Akt/mTOR in breast cancer. Cancer Sci. 2020, 111, 47–58. [Google Scholar] [CrossRef]
- Matsushima, K.; Larsen, C.G.; DuBois, G.; Oppenheim, J. Purification and characterization of a novel monocyte chemotactic and activating factor produced by a human myelomonocytic cell line. J. Exp. Med. 1989, 169, 1485–1490. [Google Scholar] [CrossRef]
- Yoshimura, T.; Robinson, E.A.; Tanaka, S.; Appella, E.; Kuratsu, J.-L.; Leonard, E.J. Purification and amino acid analysis of two human glioma-derived monocyte chemoattractants. J. Exp. Med. 1989, 169, 1449–1459. [Google Scholar] [CrossRef]
- Charo, I.F.; Myers, S.J.; Herman, A.; Franci, C.; Connolly, A.J.; Coughlin, S.R. Molecular cloning and functional expression of two monocyte chemoattractant protein 1 receptors reveals alternative splicing of the carboxyl-terminal tails. Proc. Natl. Acad. Sci. USA 1994, 91, 2752–2756. [Google Scholar] [CrossRef]
- Deshmane, S.L.; Kremlev, S.; Amini, S.; Sawaya, B.E. Monocyte chemoattractant protein-1 (MCP-1): An overview. J. Interferon Cytokine Res. 2009, 29, 313–326. [Google Scholar] [CrossRef]
- Jin, J.; Lin, J.; Xu, A.; Lou, J.; Qian, C.; Li, X.; Wang, Y.; Yu, W.; Tao, H. CCL2: An important mediator between tumor cells and host cells in tumor microenvironment. Front. Oncol. 2021, 11, 722916. [Google Scholar] [CrossRef]
- Kuroda, T.; Kitadai, Y.; Tanaka, S.; Yang, X.; Mukaida, N.; Yoshihara, M.; Chayama, K. Monocyte chemoattractant protein-1 transfection induces angiogenesis and tumorigenesis of gastric carcinoma in nude mice via macrophage recruitment. Clin. Cancer Res. 2005, 11, 7629–7636. [Google Scholar] [CrossRef]
- Roblek, M.; Protsyuk, D.; Becker, P.F.; Stefanescu, C.; Gorzelanny, C.; Garzon, J.F.G.; Knopfova, L.; Heikenwalder, M.; Luckow, B.; Schneider, S.W. CCL2 is a vascular permeability factor inducing CCR2-dependent endothelial retraction during lung metastasis. Mol. Cancer Res. 2019, 17, 783–793. [Google Scholar] [CrossRef]
- Gschwandtner, M.; Derler, R.; Midwood, K.S. More than just attractive: How CCL2 influences myeloid cell behavior beyond chemotaxis. Front. Immunol. 2019, 10, 2759. [Google Scholar] [CrossRef]
- Salcedo, R.; Ponce, M.L.; Young, H.A.; Wasserman, K.; Ward, J.M.; Kleinman, H.K.; Oppenheim, J.J.; Murphy, W.J. Human endothelial cells express CCR2 and respond to MCP-1: Direct role of MCP-1 in angiogenesis and tumor progression. Blood J. Am. Soc. Hematol. 2000, 96, 34–40. [Google Scholar]
- Kitamura, T.; Qian, B.-Z.; Soong, D.; Cassetta, L.; Noy, R.; Sugano, G.; Kato, Y.; Li, J.; Pollard, J.W. CCL2-induced chemokine cascade promotes breast cancer metastasis by enhancing retention of metastasis-associated macrophages. J. Exp. Med. 2015, 212, 1043–1059. [Google Scholar] [CrossRef]
- Fridlender, Z.G.; Kapoor, V.; Buchlis, G.; Cheng, G.; Sun, J.; Wang, L.-C.S.; Singhal, S.; Snyder, L.A.; Albelda, S.M. Monocyte chemoattractant protein–1 blockade inhibits lung cancer tumor growth by altering macrophage phenotype and activating CD8+ cells. Am. J. Respir. Cell Mol. Biol. 2011, 44, 230–237. [Google Scholar] [CrossRef]
- Yao, M.; Smart, C.; Hu, Q.; Cheng, N. Continuous delivery of neutralizing antibodies elevate CCL2 levels in mice bearing MCF10CA1d breast tumor xenografts. Transl. Oncol. 2017, 10, 734–743. [Google Scholar] [CrossRef]
- Chen, X.; Wang, Y.; Nelson, D.; Tian, S.; Mulvey, E.; Patel, B.; Conti, I.; Jaen, J.; Rollins, B.J. CCL2/CCR2 regulates the tumor microenvironment in HER-2/neu-driven mammary carcinomas in mice. PLoS ONE 2016, 11, e0165595. [Google Scholar] [CrossRef]
- Pienta, K.J.; Machiels, J.-P.; Schrijvers, D.; Alekseev, B.; Shkolnik, M.; Crabb, S.J.; Li, S.; Seetharam, S.; Puchalski, T.A.; Takimoto, C. Phase 2 study of carlumab (CNTO 888), a human monoclonal antibody against CC-chemokine ligand 2 (CCL2), in metastatic castration-resistant prostate cancer. Investig. New Drugs 2013, 31, 760–768. [Google Scholar] [CrossRef] [PubMed]
- Spenlé, C.; Gasser, I.; Saupe, F.; Janssen, K.-P.; Arnold, C.; Klein, A.; van der Heyden, M.; Mutterer, J.; Neuville-Méchine, A.; Chenard, M.-P. Spatial organization of the tenascin-C microenvironment in experimental and human cancer. Cell Adhes. Migr. 2015, 9, 4–13. [Google Scholar] [CrossRef] [PubMed]
- Spenlé, C.; Loustau, T.; Murdamoothoo, D.; Erne, W.; Beghelli-de la Forest Divonne, S.; Veber, R.; Petti, L.; Bourdely, P.; Mörgelin, M.; Brauchle, E.M. Tenascin-C orchestrates an immune suppressive tumor microenvironment in oral squamous cell carcinoma. Cancer Immunol. Res. 2020, 8, 1122–1138. [Google Scholar] [CrossRef] [PubMed]
- Calvo, A.; Catena, R.; Noble, M.; Carbott, D.; Gil-Bazo, I.; Gonzalez-Moreno, O.; Huh, J.; Sharp, R.; Qiu, T.; Anver, M. Identification of VEGF-regulated genes associated with increased lung metastatic potential: Functional involvement of tenascin-C in tumor growth and lung metastasis. Oncogene 2008, 27, 5373–5384. [Google Scholar] [CrossRef] [PubMed]
- Kimura, T.; Tajiri, K.; Sato, A.; Sakai, S.; Wang, Z.; Yoshida, T.; Uede, T.; Hiroe, M.; Aonuma, K.; Ieda, M. Tenascin-C accelerates adverse ventricular remodelling after myocardial infarction by modulating macrophage polarization. Cardiovasc. Res. 2019, 115, 614–624. [Google Scholar] [CrossRef]
- Yonebayashi, S.; Tajiri, K.; Hara, M.; Saito, H.; Suzuki, N.; Sakai, S.; Kimura, T.; Sato, A.; Sekimoto, A.; Fujita, S. Generation of Transgenic Mice that Conditionally Overexpress Tenascin-C. Front. Immunol. 2021, 12, 539. [Google Scholar] [CrossRef]
- Abbadi, D.; Laroumanie, F.; Bizou, M.; Pozzo, J.; Daviaud, D.; Delage, C.; Calise, D.; Gaits-Iacovoni, F.; Dutaur, M.; Tortosa, F. Local production of tenascin-C acts as a trigger for monocyte/macrophage recruitment that provokes cardiac dysfunction. Cardiovasc. Res. 2017, 114, 123–137. [Google Scholar] [CrossRef]
- Catalan, V.; Gomez-Ambrosi, J.; Rodríguez, A.; Ramírez, B.; Rotellar, F.; Valentí, V.; Silva, C.; Gil, M.J.; Salvador, J.; Frühbeck, G. Increased tenascin C and Toll-like receptor 4 levels in visceral adipose tissue as a link between inflammation and extracellular matrix remodeling in obesity. J. Clin. Endocrinol. Metab. 2012, 97, E1880–E1889. [Google Scholar] [CrossRef]
- Fang, W.B.; Acevedo, D.S.; Smart, C.; Zinda, B.; Alissa, N.; Warren, K.; Fraga, G.; Huang, L.-C.; Shyr, Y.; Li, W. Expression of CCL2/CCR2 signaling proteins in breast carcinoma cells is associated with invasive progression. Sci. Rep. 2021, 11, 8708. [Google Scholar] [CrossRef]
- Wawrzyniak, D.; Grabowska, M.; Głodowicz, P.; Kuczyński, K.; Kuczyńska, B.; Fedoruk-Wyszomirska, A.; Rolle, K. Down-regulation of tenascin-C inhibits breast cancer cells development by cell growth, migration, and adhesion impairment. PLoS ONE 2020, 15, e0237889. [Google Scholar] [CrossRef]
- Saji, H.; Koike, M.; Yamori, T.; Saji, S.; Seiki, M.; Matsushima, K.; Toi, M. Significant correlation of monocyte chemoattractant protein-1 expression with neovascularization and progression of breast carcinoma. Cancer Interdiscip. Int. J. Am. Cancer Soc. 2001, 92, 1085–1091. [Google Scholar] [CrossRef]
- Fridman, W.H.; Zitvogel, L.; Sautès–Fridman, C.; Kroemer, G. The immune contexture in cancer prognosis and treatment. Nat. Rev. Clin. Oncol. 2017, 14, 717–734. [Google Scholar] [CrossRef]
- Pomin, V.H. Sulfated glycans in inflammation. Eur. J. Med. Chem. 2015, 92, 353–369. [Google Scholar] [CrossRef]
- Midwood, K.S.; Chiquet, M.; Tucker, R.P.; Orend, G. Tenascin-C at a glance. J. Cell Sci. 2016, 129, 4321–4327. [Google Scholar] [CrossRef]
- De Laporte, L.; Rice, J.J.; Tortelli, F.; Hubbell, J.A. Tenascin C promiscuously binds growth factors via its fifth fibronectin type III-like domain. PLoS ONE 2013, 8, e62076. [Google Scholar] [CrossRef]
- Loustau, T.; Abou-Faycal, C.; Erne, W.; Wiesch, P.A.Z.; Ksouri, A.; Imhof, T.; Morgelin, M.; Li, C.; Mathieu, M.; Salome, N.; et al. Modulating tenascin-C functions by targeting the MAtrix REgulating MOtif, “MAREMO”. Matrix Biol 2022, 108, 20–38. [Google Scholar] [CrossRef]
- Domaingo, A.; Jokesch, P.; Pum, A.; Gschwandtner, M.; Gerlza, T.; Koch, M.; Midwood, K.S.; Kungl, A.J. Chemokine Binding to Tenascin-C Influences Chemokine-Induced Immune Cell Migration. Int. J. Mol. Sci. 2023. submitted. [Google Scholar]
- Sierra-Filardi, E.; Nieto, C.; Dominguez-Soto, A.; Barroso, R.; Sanchez-Mateos, P.; Puig-Kroger, A.; Lopez-Bravo, M.; Joven, J.; Ardavin, C.; Rodriguez-Fernandez, J.L.; et al. CCL2 shapes macrophage polarization by GM-CSF and M-CSF: Identification of CCL2/CCR2-dependent gene expression profile. J. Immunol. 2014, 192, 3858–3867. [Google Scholar] [CrossRef]
- Gendelman, H.E.; Ding, S.; Gong, N.; Liu, J.; Ramirez, S.H.; Persidsky, Y.; Mosley, R.L.; Wang, T.; Volsky, D.J.; Xiong, H. Monocyte chemotactic protein-1 regulates voltage-gated K+ channels and macrophage transmigration. J. Neuroimmune Pharmacol. 2009, 4, 47–59. [Google Scholar] [CrossRef]
- Ward, C.; Murray, J.; Clugston, A.; Dransfield, I.; Haslett, C.; Rossi, A.G. Interleukin-10 inhibits lipopolysaccharide-induced survival and extracellular signal-regulated kinase activation in human neutrophils. Eur. J. Immunol. 2005, 35, 2728–2737. [Google Scholar] [CrossRef]
- Goyal, A.; Wang, Y.; Graham, M.M.; Doseff, A.I.; Bhatt, N.Y.; Marsh, C.B. Monocyte survival factors induce Akt activation and suppress caspase-3. Am. J. Respir. Cell Mol. Biol. 2002, 26, 224–230. [Google Scholar] [CrossRef] [PubMed]
- Neumark, E.; Sagi-Assif, O.; Shalmon, B.; Ben-Baruch, A.; Witz, I.P. Progression of mouse mammary tumors: MCP-1-TNFα cross-regulatory pathway and clonal expression of promalignancy and antimalignancy factors. Int. J. Cancer 2003, 106, 879–886. [Google Scholar] [CrossRef] [PubMed]
- Wang, Q.; Ren, J.; Morgan, S.; Liu, Z.; Dou, C.; Liu, B. Monocyte chemoattractant protein-1 (MCP-1) regulates macrophage cytotoxicity in abdominal aortic aneurysm. PLoS ONE 2014, 9, e92053. [Google Scholar] [CrossRef] [PubMed]
- Sodhi, A.; Biswas, S.K. Monocyte chemoattractant protein-1-induced activation of p42/44 MAPK and c-Jun in murine peritoneal macrophages: A potential pathway for macrophage activation. J. Interferon Cytokine Res. 2002, 22, 517–526. [Google Scholar] [CrossRef] [PubMed]
- Takashiba, S.; Van Dyke, T.E.; Amar, S.; Murayama, Y.; Soskolne, A.W.; Shapira, L. Differentiation of monocytes to macrophages primes cells for lipopolysaccharide stimulation via accumulation of cytoplasmic nuclear factor κB. Infect. Immun. 1999, 67, 5573–5578. [Google Scholar] [CrossRef]
- Rossol, M.; Heine, H.; Meusch, U.; Quandt, D.; Klein, C.; Sweet, M.J.; Hauschildt, S. LPS-induced cytokine production in human monocytes and macrophages. Crit. Rev. Immunol. 2011, 31, 379–446. [Google Scholar] [CrossRef]
- Liu, Y.; Fang, S.; Li, X.; Feng, J.; Du, J.; Guo, L.; Su, Y.; Zhou, J.; Ding, G.; Bai, Y. Aspirin inhibits LPS-induced macrophage activation via the NF-κB pathway. Sci. Rep. 2017, 7, 11549. [Google Scholar] [CrossRef]
- Kersten, K.; Coffelt, S.B.; Hoogstraat, M.; Verstegen, N.J.; Vrijland, K.; Ciampricotti, M.; Doornebal, C.W.; Hau, C.-S.; Wellenstein, M.D.; Salvagno, C. Mammary tumor-derived CCL2 enhances pro-metastatic systemic inflammation through upregulation of IL1β in tumor-associated macrophages. Oncoimmunology 2017, 6, e1334744. [Google Scholar] [CrossRef]
- Hembruff, S.L.; Jokar, I.; Yang, L.; Cheng, N. Loss of transforming growth factor-β signaling in mammary fibroblasts enhances CCL2 secretion to promote mammary tumor progression through macrophage-dependent and-independent mechanisms. Neoplasia 2010, 12, 425–433. [Google Scholar] [CrossRef]
- Tsuyada, A.; Chow, A.; Wu, J.; Somlo, G.; Chu, P.; Loera, S.; Luu, T.; Li, A.X.; Wu, X.; Ye, W. CCL2 mediates cross-talk between cancer cells and stromal fibroblasts that regulates breast cancer stem cells. Cancer Res. 2012, 72, 2768–2779. [Google Scholar] [CrossRef]
- Chen, H.; Liu, D.; Guo, L.; Cheng, X.; Guo, N.; Shi, M. Chronic psychological stress promotes lung metastatic colonization of circulating breast cancer cells by decorating a pre-metastatic niche through activating β-adrenergic signaling. J. Pathol. 2018, 244, 49–60. [Google Scholar] [CrossRef]
- Triulzi, T.; Forte, L.; Regondi, V.; Di Modica, M.; Ghirelli, C.; Carcangiu, M.L.; Sfondrini, L.; Balsari, A.; Tagliabue, E. HER2 signaling regulates the tumor immune microenvironment and trastuzumab efficacy. Oncoimmunology 2019, 8, e1512942. [Google Scholar] [CrossRef]
- Haringman, J.J.; Gerlag, D.M.; Smeets, T.J.; Baeten, D.; Van den Bosch, F.; Bresnihan, B.; Breedveld, F.C.; Dinant, H.J.; Legay, F.; Gram, H. A randomized controlled trial with an anti-CCL2 (anti–monocyte chemotactic protein 1) monoclonal antibody in patients with rheumatoid arthritis. Arthritis Rheum. 2006, 54, 2387–2392. [Google Scholar] [CrossRef]
- Yoshimura, T. The chemokine MCP-1 (CCL2) in the host interaction with cancer: A foe or ally? Cell. Mol. Immunol. 2018, 15, 335–345. [Google Scholar] [CrossRef]
- Midwood, K.; Sacre, S.; Piccinini, A.M.; Inglis, J.; Trebaul, A.; Chan, E.; Drexler, S.; Sofat, N.; Kashiwagi, M.; Orend, G.; et al. Tenascin-C is an endogenous activator of Toll-like receptor 4 that is essential for maintaining inflammation in arthritic joint disease. Nat. Med. 2009, 15, 774–780. [Google Scholar] [CrossRef]
- Haage, V.; Elmadany, N.; Roll, L.; Faissner, A.; Gutmann, D.H.; Semtner, M.; Kettenmann, H. Tenascin C regulates multiple microglial functions involving TLR4 signaling and HDAC1. Brain. Behav. Immun. 2019, 81, 470–483. [Google Scholar] [CrossRef]
- Kanayama, M.; Kurotaki, D.; Morimoto, J.; Asano, T.; Matsui, Y.; Nakayama, Y.; Saito, Y.; Ito, K.; Kimura, C.; Iwasaki, N.; et al. Alpha9 integrin and its ligands constitute critical joint microenvironments for development of autoimmune arthritis. J. Immunol. 2009, 182, 8015–8025. [Google Scholar] [CrossRef]
- Piccinini, A.M.; Knebl, K.; Rek, A.; Wildner, G.; Diedrichs-Möhring, M.; Kungl, A.J. Rationally evolving MCP-1/CCL2 into a decoy protein with potent anti-inflammatory activity in vivo. J. Biol. Chem. 2010, 285, 8782–8792. [Google Scholar] [CrossRef]
- Roblek, M.; Strutzmann, E.; Zankl, C.; Adage, T.; Heikenwalder, M.; Atlic, A.; Weis, R.; Kungl, A.; Borsig, L. Targeting of CCL2-CCR2-Glycosaminoglycan Axis Using a CCL2 Decoy Protein Attenuates Metastasis through Inhibition of Tumor Cell Seeding. Neoplasia 2016, 18, 49–59. [Google Scholar] [CrossRef]
- Lau, E.K.; Paavola, C.D.; Johnson, Z.; Gaudry, J.-P.; Geretti, E.; Borlat, F.; Kungl, A.J.; Proudfoot, A.E.; Handel, T.M. Identification of the glycosaminoglycan binding site of the CC chemokine, MCP-1: Implications for structure and function in vivo. J. Biol. Chem. 2004, 279, 22294–22305. [Google Scholar] [CrossRef]
- Ernst, C.A.; Zhang, Y.J.; Hancock, P.R.; Rutledge, B.J.; Corless, C.L.; Rollins, B.J. Biochemical and biologic characterization of murine monocyte chemoattractant protein-1. Identification of two functional domains. J. Immunol. 1994, 152, 3541–3549. [Google Scholar] [CrossRef] [PubMed]
- Gschwandtner, M.; Piccinini, A.M.; Gerlza, T.; Adage, T.; Kungl, A.J. Interfering with the CCL2-glycosaminoglycan axis as a potential approach to modulate neuroinflammation. Neurosci. Lett. 2016, 626, 164–173. [Google Scholar] [CrossRef] [PubMed]
- Mangan, R.J.; Stamper, L.; Ohashi, T.; Eudailey, J.A.; Go, E.P.; Jaeger, F.H.; Itell, H.L.; Watts, B.E.; Fouda, G.G.; Erickson, H.P. Determinants of Tenascin-C and HIV-1 envelope binding and neutralization. Mucosal Immunol. 2019, 12, 1004–1012. [Google Scholar] [CrossRef] [PubMed]
- Radwanska, A.; Grall, D.; Schaub, S.; Beghelli-de la Forest Divonne, S.; Ciais, D.; Rekima, S.; Rupp, T.; Sudaka, A.; Orend, G.; Van Obberghen-Schilling, E. Counterbalancing anti-adhesive effects of Tenascin-C through fibronectin expression in endothelial cells. Sci. Rep. 2017, 7, 12762. [Google Scholar] [CrossRef]
- Chiquet-Ehrismann, R.; Kalla, P.; Pearson, C.A.; Beck, K.; Chiquet, M. Tenascin interferes with fibronectin action. Cell 1988, 53, 383–390. [Google Scholar] [CrossRef]
- Giblin, S.P.; Schwenzer, A.; Midwood, K.S. Alternative splicing controls cell lineage-specific responses to endogenous innate immune triggers within the extracellular matrix. Matrix Biol. 2020, 93, 95–114. [Google Scholar] [CrossRef]
- Götz, B.; Scholze, A.; Clement, A.; Joester, A.; Schütte, K.; Wigger, F.; Frank, R.; Spiess, E.; Ekblom, P.; Faissner, A. Tenascin-C contains distinct adhesive, anti-adhesive, and neurite outgrowth promoting sites for neurons. J. Cell Biol. 1996, 132, 681–699. [Google Scholar] [CrossRef]
- Ghert, M.A.; Qi, W.-N.; Erickson, H.P.; Block, J.A.; Scully, S.P. Tenascin-C splice variant adhesive/anti-adhesive effects on chondrosarcoma cell attachment to fibronectin. Cell Struct. Funct. 2001, 26, 179–187. [Google Scholar] [CrossRef][Green Version]
- Jiang, Y.; Beller, D.; Frendl, G.; Graves, D. Monocyte chemoattractant protein-1 regulates adhesion molecule expression and cytokine production in human monocytes. J. Immunol. 1992, 148, 2423–2428. [Google Scholar] [CrossRef]
- Chen, M.; Forrester, J.V.; Xu, H. Dysregulation in retinal para-inflammation and age-related retinal degeneration in CCL2 or CCR2 deficient mice. PLoS ONE 2011, 6, e22818. [Google Scholar] [CrossRef]
- Yang, Z.; Li, H.; Wang, W.; Zhang, J.; Jia, S.; Wang, J.; Wei, J.; Lei, D.; Hu, K.; Yang, X. CCL2/CCR2 axis promotes the progression of salivary adenoid cystic carcinoma via recruiting and reprogramming the tumor-associated macrophages. Front. Oncol. 2019, 9, 231. [Google Scholar] [CrossRef]
- Roca, H.; Varsos, Z.S.; Sud, S.; Craig, M.J.; Ying, C.; Pienta, K.J. CCL2 and IL-6 promote survival of human CD11b+-peripheral blood mononuclear cells and induce M2-type macrophage polarization. J. Biol. Chem. 2009, 284, 34342–34354. [Google Scholar] [CrossRef]
- Choi, S.; You, S.; Kim, D.; Choi, S.Y.; Kwon, H.M.; Kim, H.-S.; Hwang, D.; Park, Y.-J.; Cho, C.-S.; Kim, W.-U. Transcription factor NFAT5 promotes macrophage survival in rheumatoid arthritis. J. Clin. Investig. 2017, 127, 954–969. [Google Scholar] [CrossRef]
- Li, Y.; Zheng, Y.; Li, T.; Wang, Q.; Qian, J.; Lu, Y.; Zhang, M.; Bi, E.; Yang, M.; Reu, F. Chemokines CCL2, 3, 14 stimulate macrophage bone marrow homing, proliferation, and polarization in multiple myeloma. Oncotarget 2015, 6, 24218. [Google Scholar] [CrossRef]
- Arpel, A.; Sawma, P.; Spenlé, C.; Fritz, J.; Meyer, L.; Garnier, N.; Velázquez-Quesada, I.; Hussenet, T.; Aci-Sèche, S.; Baumlin, N. Transmembrane domain targeting peptide antagonizing ErbB2/Neu inhibits breast tumor growth and metastasis. Cell Rep. 2014, 8, 1714–1721. [Google Scholar] [CrossRef]
- Colaprico, A.; Silva, T.C.; Olsen, C.; Garofano, L.; Cava, C.; Garolini, D.; Sabedot, T.S.; Malta, T.M.; Pagnotta, S.M.; Castiglioni, I. TCGAbiolinks: An R/Bioconductor package for integrative analysis of TCGA data. Nucleic Acids Res. 2016, 44, e71. [Google Scholar] [CrossRef]
- Ciriello, G.; Gatza, M.L.; Beck, A.H.; Wilkerson, M.D.; Rhie, S.K.; Pastore, A.; Zhang, H.; McLellan, M.; Yau, C.; Kandoth, C. Comprehensive molecular portraits of invasive lobular breast cancer. Cell 2015, 163, 506–519. [Google Scholar] [CrossRef]
- Li, B.; Dewey, C.N. RSEM: Accurate transcript quantification from RNA-Seq data with or without a reference genome. BMC Bioinform. 2011, 12, 323. [Google Scholar] [CrossRef]
- Giblin, S.P.; Murdamoothoo, D.; Deligne, C.; Schwenzer, A.; Orend, G.; Midwood, K.S. How to detect and purify tenascin-C. Methods Cell Biol. 2018, 143, 371–400. [Google Scholar]
- Huang, W.; Chiquet-Ehrismann, R.; Moyano, J.V.; Garcia-Pardo, A.; Orend, G. Interference of tenascin-C with syndecan-4 binding to fibronectin blocks cell adhesion and stimulates tumor cell proliferation. Cancer Res. 2001, 61, 8586–8594. [Google Scholar]
- To, W.S.; Midwood, K.S. Identification of Novel and Distinct Binding Sites within Tenascin-C for Soluble and Fibrillar Fibronectin. J. Biol. Chem. 2011, 286, 14881–14891. [Google Scholar] [CrossRef] [PubMed]
- Liu, X.; Quan, N. Immune cell isolation from mouse femur bone marrow. Bio Protoc. 2015, 5, e1631. [Google Scholar] [CrossRef] [PubMed]
- Franco-Barraza, J.; Beacham, D.A.; Amatangelo, M.D.; Cukierman, E. Preparation of extracellular matrices produced by cultured and primary fibroblasts. Curr. Protoc. Cell Biol. 2016, 71, 10.19.11–10.19.34. [Google Scholar] [CrossRef] [PubMed]
- Tello, M.; Spenlé, C.; Hemmerlé, J.; Mercier, L.; Fabre, R.; Allio, G.; Simon-Assmann, P.; Goetz, J.G. Generating and characterizing the mechanical properties of cell-derived matrices using atomic force microscopy. Methods 2016, 94, 85–100. [Google Scholar] [CrossRef]
- Fonta, C.M.; Loustau, T.; Li, C.; Surendran, S.P.; Hansen, U.; Murdamoothoo, D.; Benn, M.C.; Velazquez-Quesada, I.; Carapito, R.; Orend, G. Infiltrating CD8+ T cells and M2 macrophages are retained in tumor matrix tracks enriched in low tension fibronectin fibers. Matrix Biol. 2023, 116, 1–27. [Google Scholar] [CrossRef]


Disclaimer/Publisher’s Note: The statements, opinions and data contained in all publications are solely those of the individual author(s) and contributor(s) and not of MDPI and/or the editor(s). MDPI and/or the editor(s) disclaim responsibility for any injury to people or property resulting from any ideas, methods, instructions or products referred to in the content. |
© 2023 by the authors. Licensee MDPI, Basel, Switzerland. This article is an open access article distributed under the terms and conditions of the Creative Commons Attribution (CC BY) license (https://creativecommons.org/licenses/by/4.0/).
Share and Cite
Gschwandtner, M.; Gammage, A.N.; Deligne, C.; Mies, L.F.M.; Domaingo, A.; Murdamoothoo, D.; Loustau, T.; Schwenzer, A.; Derler, R.; Carapito, R.; et al. Investigating Chemokine-Matrix Networks in Breast Cancer: Tenascin-C Sets the Tone for CCL2. Int. J. Mol. Sci. 2023, 24, 8365. https://doi.org/10.3390/ijms24098365
Gschwandtner M, Gammage AN, Deligne C, Mies LFM, Domaingo A, Murdamoothoo D, Loustau T, Schwenzer A, Derler R, Carapito R, et al. Investigating Chemokine-Matrix Networks in Breast Cancer: Tenascin-C Sets the Tone for CCL2. International Journal of Molecular Sciences. 2023; 24(9):8365. https://doi.org/10.3390/ijms24098365
Chicago/Turabian StyleGschwandtner, Martha, Anís N. Gammage, Claire Deligne, Linda F. M. Mies, Alissa Domaingo, Devardarssen Murdamoothoo, Thomas Loustau, Anja Schwenzer, Rupert Derler, Raphael Carapito, and et al. 2023. "Investigating Chemokine-Matrix Networks in Breast Cancer: Tenascin-C Sets the Tone for CCL2" International Journal of Molecular Sciences 24, no. 9: 8365. https://doi.org/10.3390/ijms24098365
APA StyleGschwandtner, M., Gammage, A. N., Deligne, C., Mies, L. F. M., Domaingo, A., Murdamoothoo, D., Loustau, T., Schwenzer, A., Derler, R., Carapito, R., Koch, M., Mörgelin, M., Orend, G., Kungl, A. J., & Midwood, K. S. (2023). Investigating Chemokine-Matrix Networks in Breast Cancer: Tenascin-C Sets the Tone for CCL2. International Journal of Molecular Sciences, 24(9), 8365. https://doi.org/10.3390/ijms24098365