Article

The Histone Deacetylases Hst1 and Rpd3 Integrate De Novo NAD+ Metabolism with Phosphate Sensing in Saccharomyces cerevisiae

Department of Microbiology and Molecular Genetics, College of Biological Sciences, University of California, Davis, CA 95616, USA
*
Author to whom correspondence should be addressed.
Int. J. Mol. Sci. 2023, 24(9), 8047; https://doi.org/10.3390/ijms24098047
Submission received: 30 March 2023 / Revised: 22 April 2023 / Accepted: 26 April 2023 / Published: 28 April 2023
(This article belongs to the Special Issue Yeast as a Model System to Study Human Diseases)

Abstract

:
Nicotinamide adenine dinucleotide (NAD+) is a critical cofactor essential for various cellular processes. Abnormalities in NAD+ metabolism have also been associated with a number of metabolic disorders. The regulation and interconnection of NAD+ metabolic pathways are not yet completely understood. By employing an NAD+ intermediate-specific genetic system established in the model organism S. cerevisiae, we show that histone deacetylases (HDACs) Hst1 and Rpd3 link the regulation of the de novo NAD+ metabolism-mediating BNA genes with certain aspects of the phosphate (Pi)-sensing PHO pathway. Our genetic and gene expression studies suggest that the Bas1–Pho2 and Pho2–Pho4 transcription activator complexes play a role in this co-regulation. Our results suggest a model in which competition for Pho2 usage between the BNA-activating Bas1–Pho2 complex and the PHO-activating Pho2–Pho4 complex helps balance de novo activity with PHO activity in response to NAD+ or phosphate depletion. Interestingly, both the Bas1–Pho2 and Pho2–Pho4 complexes appear to also regulate the expression of the salvage-mediating PNC1 gene negatively. These results suggest a mechanism for the inverse regulation between the NAD+ salvage pathways and the de novo pathway observed in our genetic models. Our findings help provide a molecular basis for the complex interplay of two different aspects of cellular metabolism.

1. Introduction

Nicotinamide adenine dinucleotide (NAD+) is an essential enzymatic cofactor. NAD+, its reduced form NADH, and the phosphorylated derivative NADP+ serve a wide variety of critical roles in the cell. NAD+/H is an oxidative electron acceptor in central metabolism, a source of electrons for mitochondrial respiration [1,2], and a cofactor for the sirtuin class of histone deacetylases [3,4,5] and for the poly-ADP-ribose polymerase (PARP) class of DNA repair enzymes [6]. Owing to its centrality and far-ranging influence in the cell, perturbations to NAD+ homeostasis are associated with a considerable and diverse number of diseases, including various metabolic disorders [7], neurological disorders [8], cardiovascular disease [9], and numerous cancers [10,11,12]. Supplementation of NAD+ precursors has been shown to be efficacious in treating or alleviating symptoms of several diseases [13,14,15].
Owing to the complex regulatory networks governing the assimilation of these compounds into the cell’s NAD+ pool however, treatment of many disorders involving defective NAD+ homeostasis is not always straightforward. In addition, NAD+ precursors may interact with a large variety of signaling pathways in the cell, including diverse types of nutrient sensing [16,17,18,19] as well as inflammation and various other responses to infection [20]. As such, it is vital to understand the regulation of NAD+ metabolism and its interaction with other cellular processes.
Biosynthesis of NAD+ in budding yeast proceeds through the following pathways: NA-NAM (nicotinic acid-nicotinamide) salvage, NR (nicotinamide riboside) salvage, and de novo biosynthesis of QA (quinolinic acid) from L-tryptophan [21]. In the first pathway, NAM is deaminated to NA by Pnc1 [22], followed by phosphoribosylation to NaMN (nicotinic acid mononucleotide) by Npt1 [5], adenylation to NaAD (deamindo-NAD+) by Nma1/Nma2 [23,24], and, finally, amination to NAD+ by Qns1 [25]. NR salvage may merge with NA-NAM salvage via conversion to NAM by the nucleosidases Urh1 and Pnp1, or by phosphorylation to NMN by Nrk1 [26,27], followed by adenylation to NAD+ by Pof1 and Nma1/Nma2 [28]. De novo metabolism is mediated by the BNA genes and results in the formation of NaMN, at which point the pathway merges with NA/NAM salvage (Figure 1A).
De novo metabolism, in addition to contributing toward the cell’s NAD+ pool, has a complex and reciprocal relationship with other signaling networks in the cell. The flux of specific de novo metabolites, such as kynurenine (L-KYN) and 3-hydroxykynurenine (3-HK), is often affected, and itself in turn affects various signaling events induced by infection, inflammation, and nutrient sensing [20]. Budding yeast represents a relatively simpler model in which to investigate the relationship of de novo activity with other aspects of NAD+ biosynthesis and other cellular processes in general. The possibility of cross-talks between de novo metabolism and other branches of NAD+ biosynthesis may be a promising avenue of investigation. The NAD+-dependent sirtuin histone deacetylase Hst1, for instance, is itself a regulator of de novo NAD+ biosynthesis [19,29,30], linking de novo activity with the status of the cell’s NAD+ pool.
Although detailed mechanisms are not completely understood, several nutrient-sensing pathways have been connected with the regulation of NAD+ homeostasis. For example, NR salvage activity is associated with the activation of the phosphate (Pi)-sensing PHO pathway [16]. In response to Pi-depletion, the Pho2–Pho4 transcription complex activates PHO target genes [31,32] (Figure 1B), which leads to increased production of NR [16]. Interestingly, PHO activation appears to be inhibited by NaMN accumulation because mutants defective in NaMN production and NA-NAM salvage, such as the npt1Δ and pnc1Δ mutants, show increased PHO activity [16]. However, it remains unclear whether altered NAD+ levels and/or specific NAD+ intermediates have a more direct role in regulating PHO activity. PNC1 has been shown to be a target of regulation by the cAMP-PKA pathway through activation mediated by the Msn2/4 transcription factors [21]. It has also been suggested that PNC1 expression may decline in response to PHO activation through a pathway mediated by stress-response transcription factors Rim15 and Msn2/4 [21]. However, direct evidence supporting the role of Pnc1 in connecting PHO and NAD+ metabolism has not been shown. Moreover, a multifaceted relation between de novo NAD+ metabolism, de novo adenine biosynthesis (ADE), and NA-NAM salvage has been reported in adenine-depleted cells and cells harboring mutations mimicking adenine depletion such as the ade16Δade17Δ mutants [18]. PHO activation has also been reported in ade16Δade17Δ cells [33]. In these cells, activation of BNA and ADE genes are co-regulated by the Bas1–Pho2 transcription complex [18], while activation of PHO genes is mediated by the Pho2–Pho4 complex [33]. It is suggested that Pho2 may help coordinate the regulation of ADE and PHO genes because Pho2 is shared between the Bas1–Pho2 (for ADE) and Pho2–Pho4 (for PHO) complexes. Since most of these studies were carried out under adenine-depleted conditions and/or in the ade16Δade17Δ mutants, the role of Pho2 in coordinating these pathways in wild-type cells under normal conditions and whether additional factors are involved remains unclear.
In this study, we aim to study how de novo NAD+ metabolism is connected to PHO signaling with a particular focus on Pho2, PNC1, and two histone deacetylases (HDACs), Hst1 (NAD+-dependent) and Rpd3. In previous work, we identified the histone deacetylase Rpd3 as a positive regulator of de novo NAD+ metabolism, which acts specifically by antagonizing the Hst1-dependent repression of the BNA genes (Figure 1B) [30]. Rpd3 and Hst1 also appear to co-regulate many other additional NAD+ metabolic factors either antagonistically or synergistically [30], which suggests these two HDACs might coordinate de novo NAD+ metabolism with other branches of the NAD+ metabolic network or with other signaling pathways in the cell. Our previous study showed that the expression of several PHO genes is increased in hst1Δ mutant cells [19], suggesting a direct role of Hst1 in the repression of PHO genes in an NAD+-dependent manner. Rpd3 appears to also repress the PHO pathway [34,35,36], which is opposite to its role as a positive regulator for BNA gene expression [30] (Figure 1B). The interaction of Hst1 and Rpd3 on the regulation of PHO genes is currently unclear. Here, we present evidence that Hst1, Rpd3, and the transcription factor Pho2 link the regulation of the BNA genes with PHO signaling and with NR and NA-NAM salvage, in which a novel role for Pho2 as a regulator of PNC1 is also identified. This work contributes to the elucidation of NAD+ metabolism, its regulation, and its relationship with other metabolic pathways in the cell.

2. Results

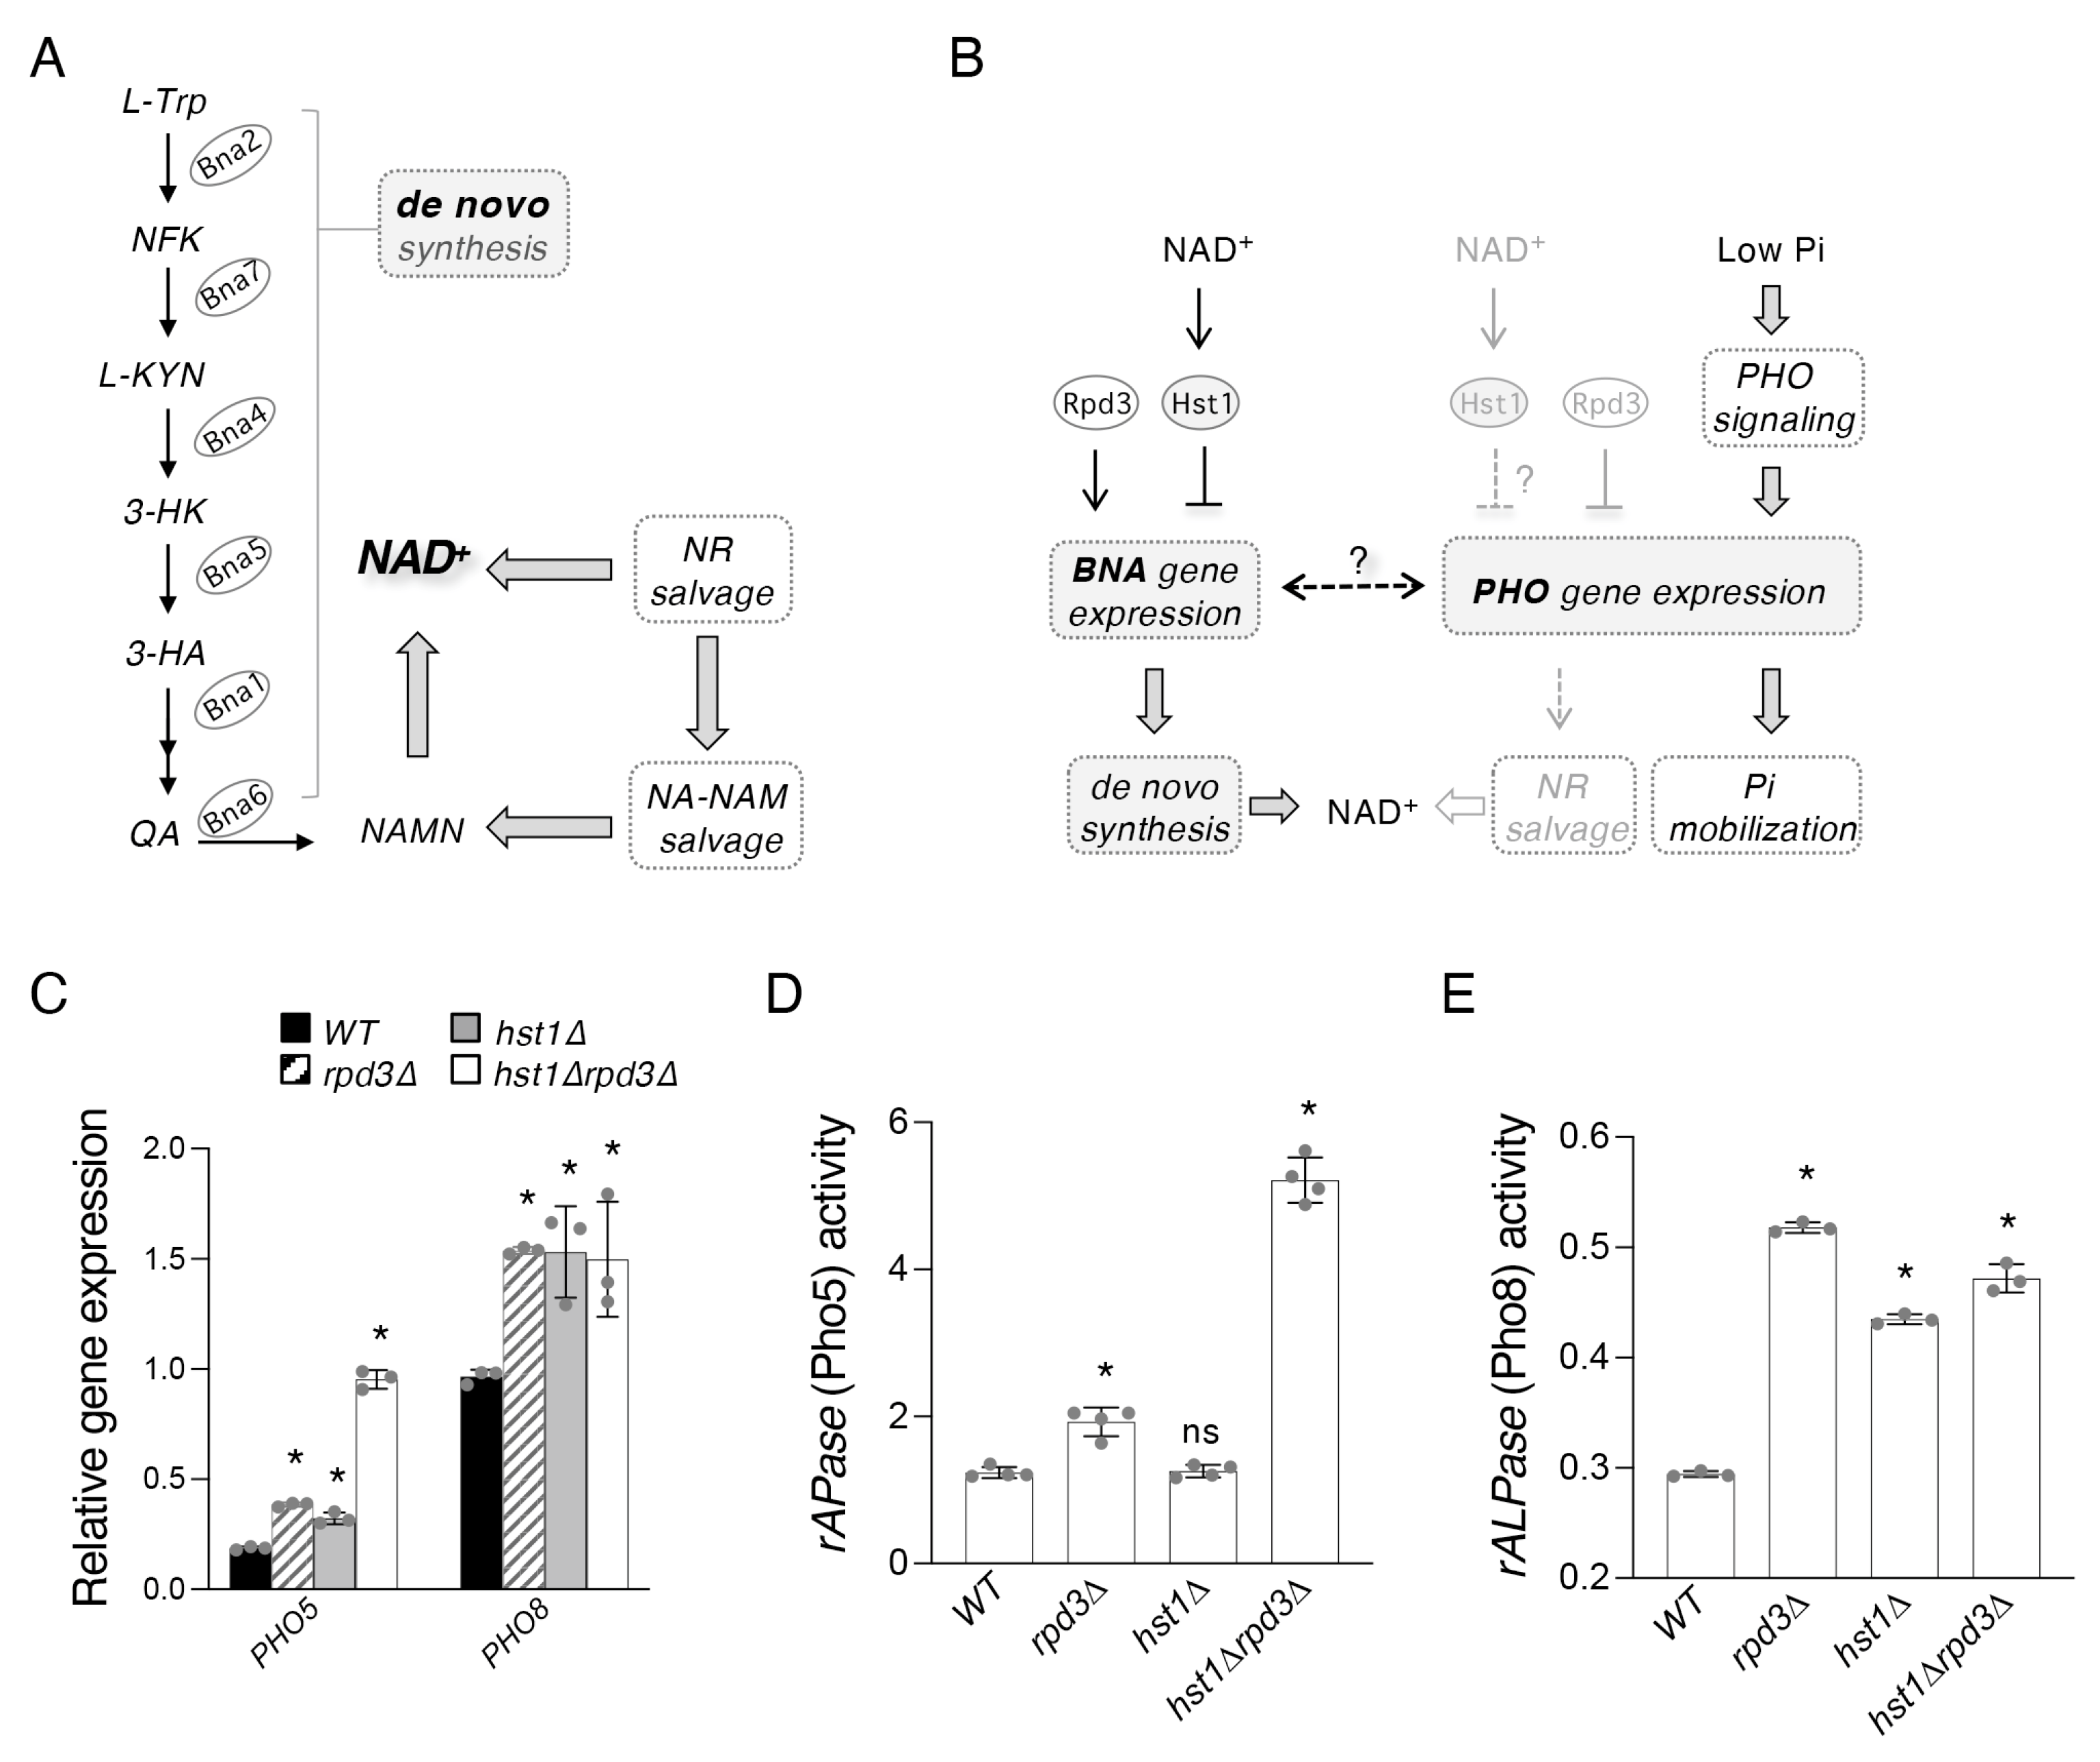
2.1. Hst1 and Rpd3 Regulate Targets of the PHO Pathway

To further understand the interaction of these two HDACs on the regulation of PHO genes, we first determined the expression of the PHO5 and PHO8 genes (encoding two PHO-regulated phosphatases) in cells lacking either one or both HDACs. PHO5 and PHO8 are chosen because they have been shown to be able to convert NMN to NR, and therefore contribute to NR salvage [16,37]. Interestingly, we found that levels of PHO5 expression in hst1Δrpd3Δ cells are strikingly increased compared to WT, rpd3Δ, and hst1Δ cells, suggesting novel synergistic regulation of PHO5 by Hst1 and Rpd3 (Figure 1C). Moreover, this large increase of PHO5 expression in hst1Δrpd3Δ cells closely resembles the similarly elevated production of NR (a product of Pho5 activity) previously observed in this strain [30]. On the other hand, although PHO8 expression was also increased in rpd3Δ and hst1Δ cells, it was not further increased in the double mutant (Figure 1C). Notably, rpd3Δ cells show increased PHO8 expression despite previous work demonstrating that Rpd3 does not affect the acetylation status of the PHO8 promoter [38], newly establishing a potential role for Rpd3 as a regulator of PHO8 and suggesting an atypical form of regulation by Rpd3 at the PHO8 promoter. We next directly determined the phosphatase activities of Pho5 (Figure 1D) and Pho8 (Figure 1E), which also supported the expression results. These results suggest that Rpd3 and Hst1 are regulators shared between the de novo BNA genes and the PHO genes, which employ markedly different regulatory strategies across contexts.

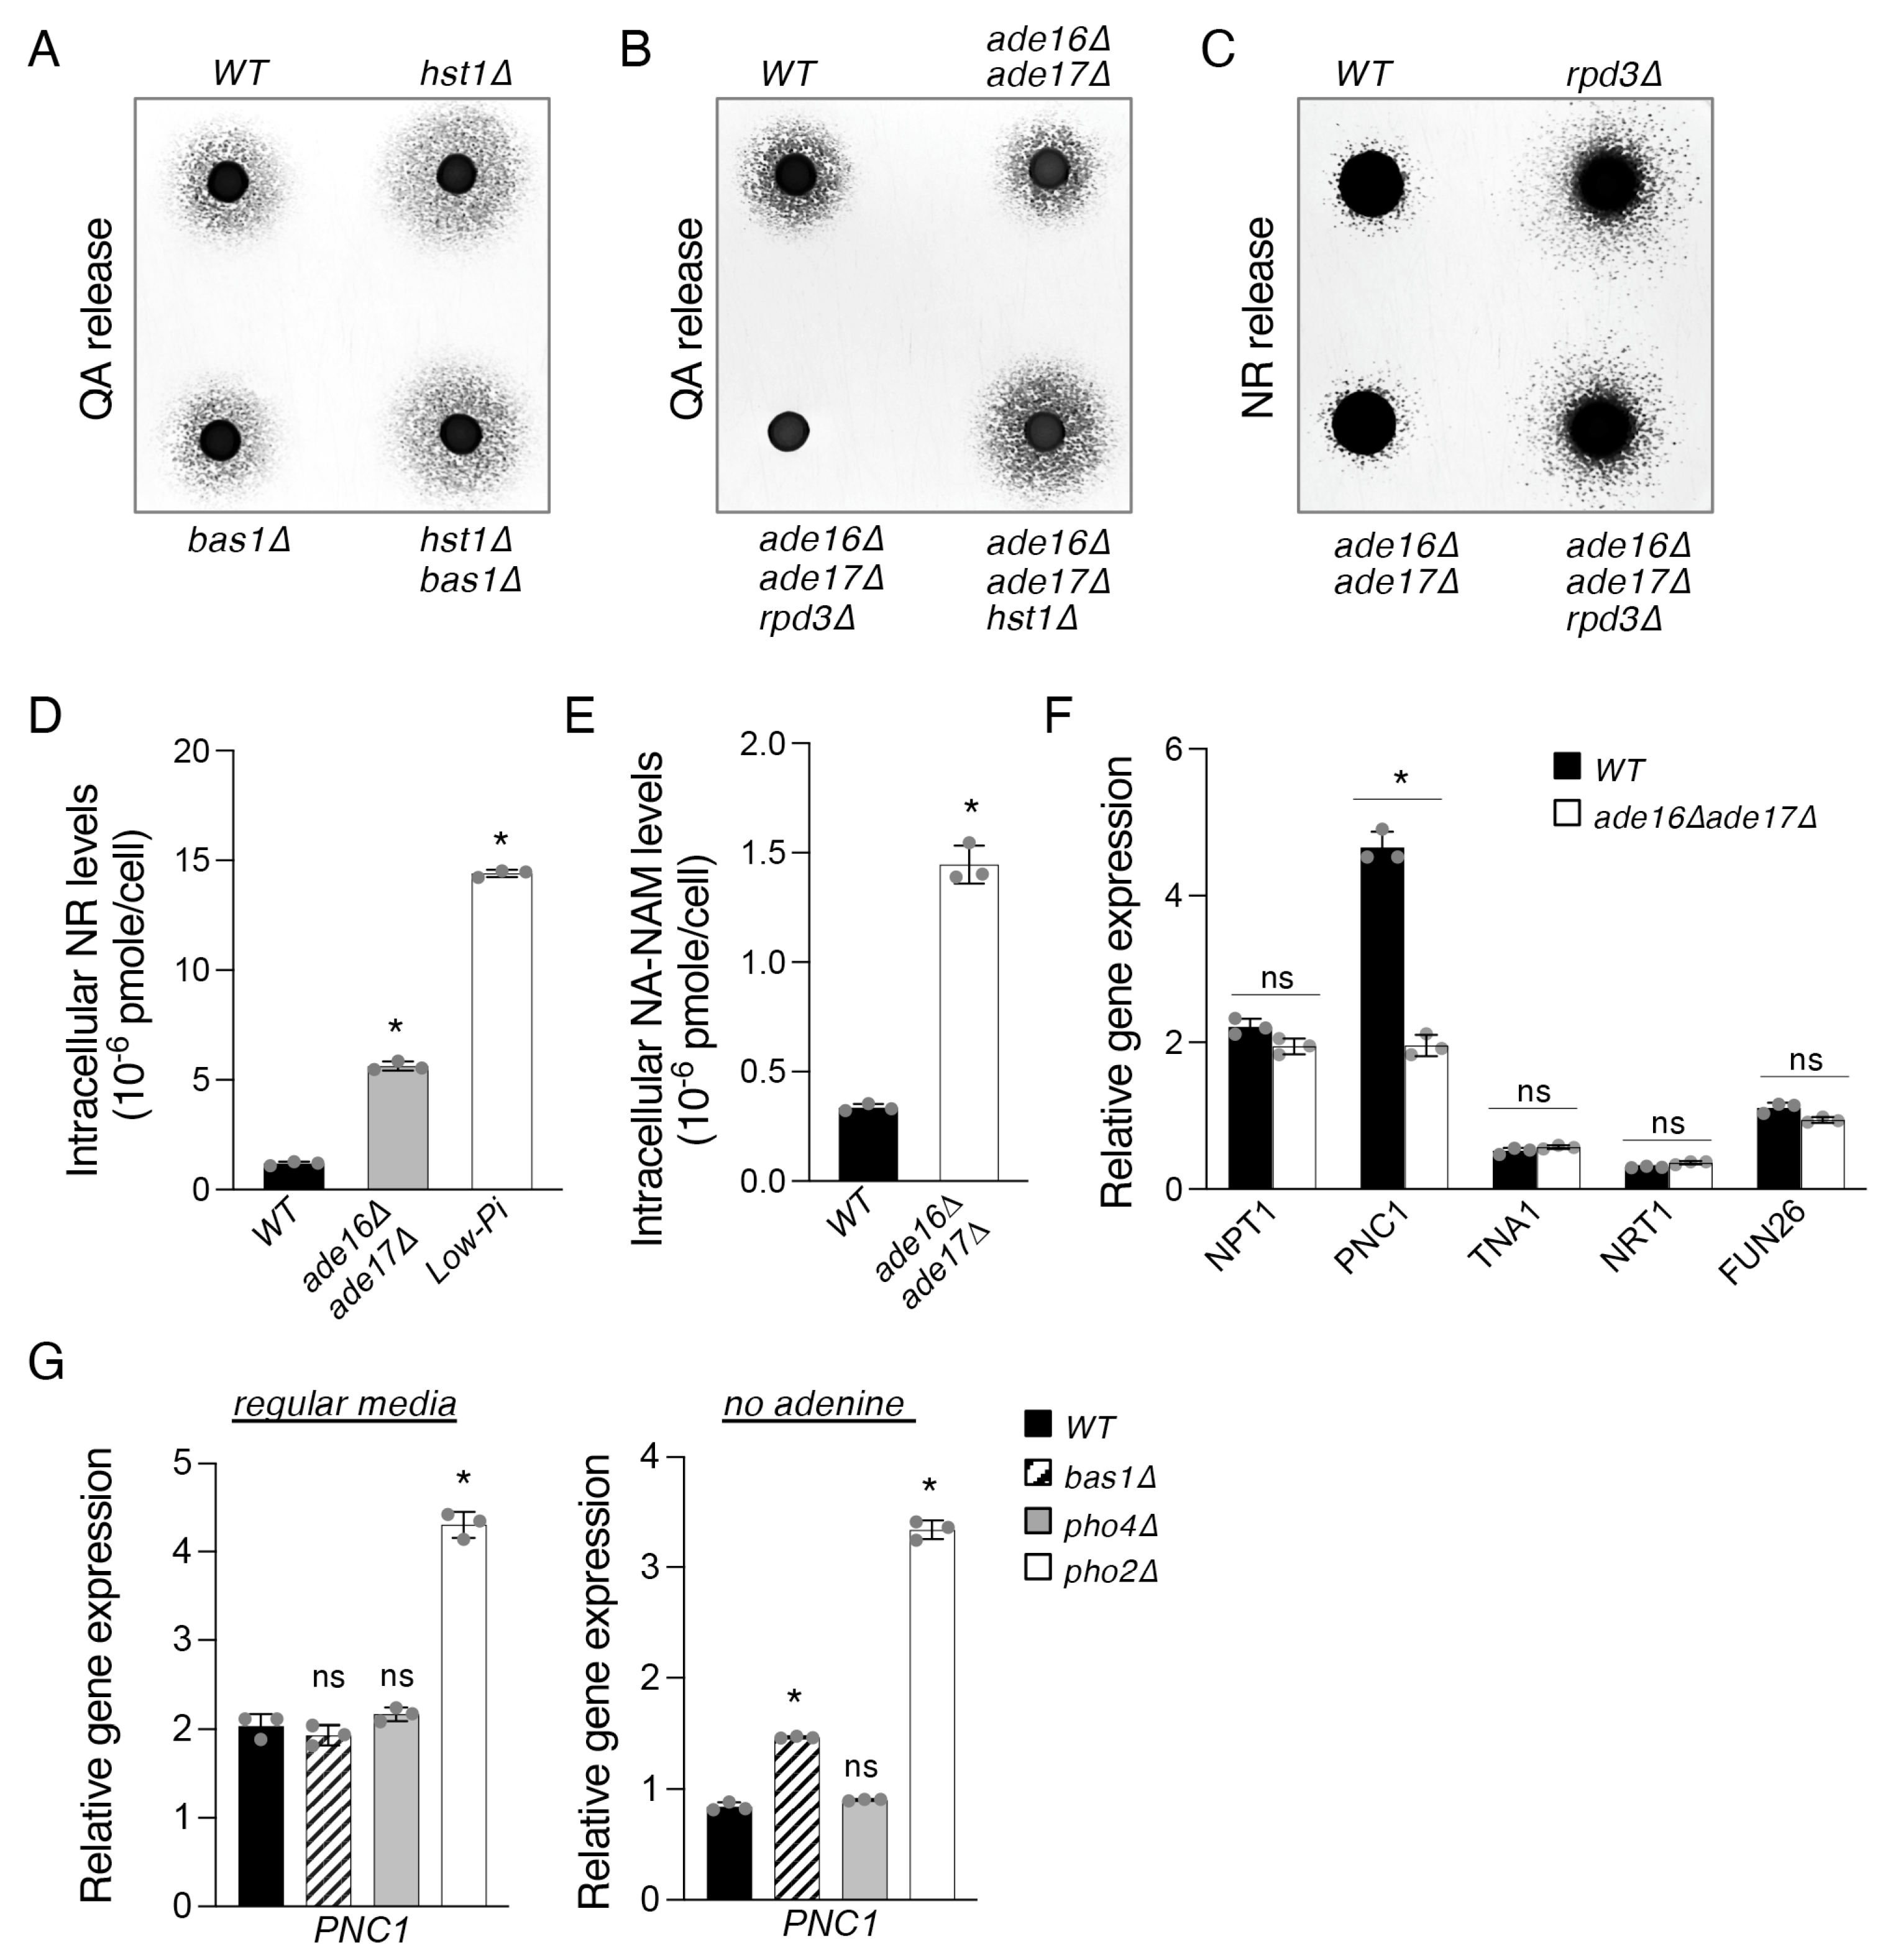
2.2. The Bas1–Pho2 Complex Plays a Role in Hst1- and Rpd3-Mediated Regulation of De Novo NAD+ Metabolism

To further understand the mechanisms of the interconnections between de novo NAD+ metabolism and the PHO pathway, we first sought to determine the effect of Pi depletion on BNA expression. However, this question is difficult to address directly. Given that Pi depletion decreases cellular ATP levels [39], while ATP depletion itself leads to NAD+ depletion [18], we would expect extended Pi-depletion to cause a corresponding drop in NAD+ levels. This would have the ultimate indirect consequence of limiting NAD+-dependent Hst1 activity and inducing BNA expression (Figure 2A), as Hst1 is a critical negative regulator of BNA expression [19,29]. Owing to these considerations, we attempted to identify a time window that would preserve the cellular NAD+ pool while also sufficiently inducing PHO signaling. We found that, soon after transfer to Pi-depleted (low-Pi) medium, cellular NAD+ levels significantly dropped (Figure 2B). Interestingly, one of the first evident changes upon Pi depletion was a redox imbalance between NADH/NAD+ (~5 min), with the ratio quickly rising and then leveling out over time. Since NAD+ depletion appears to be an inevitable confounding factor of Pi limitation, we employed the hst1Δ mutant in our studies of Pi depletion, which is not expected to be sensitive to changes in NAD+ levels with respect to the regulation of BNA expression. As shown in Figure 2D, the expression of most BNA genes was slightly but significantly reduced by Pi-depletion in hst1Δ cells, with the exception of BNA6. Expression of PHO5 was included as a positive control of PHO activation. It is possible that BNA6 expression is less sensitive to Pi depletion and that this effect is only visible under more derepressed conditions. To further investigate whether BNA6 expression is indeed insensitive to Pi depletion, we sought to further increase BNA expression. It has been shown that the ade16Δade17Δ mutants, which are genetic mimics of adenine depletion, also have increased BNA expression through a mechanism in parallel to Hst1 (Figure 2C, left) [18]. In these cells, activation of BNA expression is mediated by a specific transcription complex Bas1–Pho2, which is stimulated by an adenine intermediate (5′-phosphoribosyl-5-amino-4-imidazole carboxamide monophosphate, ZMP) that it accumulates [18]. Although the primary function of Bas1–Pho2 complex is to activate genes for de novo adenine synthesis, it also activates BNA genes during adenine depletion or when cells accumulate ZMP metabolites [18]. Therefore, we also deleted ADE16 and ADE17 in the hst1Δ background in order to further induce BNA expression by this ZMP-Bas1–Pho2-dependent mechanism. Interestingly, expression of BNA2 and BNA6 was further increased in the hst1Δade16Δade17Δ triple mutant compared to the hst1Δ mutant (Figure 2D). In addition, in this background, we were able to observe that all BNA genes are sensitive to Pi-limitation, which reduces BNA gene expression and a concomitant increase in PHO5 expression. These results also demonstrate an inverse correlation between BNA and PHO gene expression during Pi-limitation (Figure 2D).
Next, we examined whether PHO transcription activators might play a role in this co-regulation. Activation of PHO downstream genes is mediated by the Pho2–Pho4 transcription complex [31,32]. Interestingly, Pho2 also functions in the Bas1–Pho2 complex, which has been shown to be required for the activation of BNA genes in the adenine depletion mimicking ade16Δade17Δ mutants [18]. Although it is unclear whether Bas1–Pho2 has an effect on BNA expression in the WT background, these results suggest that Pho2 may be a limiting factor for the regulation of BNA and PHO gene expression. Supporting this, competition between the two complexes has been suggested for the regulation of PHO genes and adenine biosynthesis ADE genes [33]. To test this model, we first asked whether deleting BAS1 would be sufficient to increase PHO expression and/or decrease BNA expression in the WT background without Pi-limitation. We found that BAS1 deletion had no significant effect on the expression of BNA, PHO5, or PHO8 in the WT background except for BNA6 (Figure 2E). This suggests that the Bas1–Pho2 complex may only have a significant role as an activator of BNA expression under inducing conditions, for example, in the ade16Δade17Δ background [33]. It is also likely that each BNA gene is regulated differently under different conditions. However, it should also be considered that deletion of BAS1 causes a significant reduction in cellular ATP levels [40,41], which would be likely to reduce NAD+ production downstream [18]. Therefore, BNA expression in bas1Δ cells may be confounded by reduction or partial loss of Hst1 activity, masking the potential effect of Bas1 itself, which might only become evident in the hst1Δ background. In this regard, we further examined the effect of BAS1 deletion in hst1Δ cells, in which all BNA genes are de-repressed. As shown in Figure 2E, BAS1 deletion significantly reduced the expression of most BNA genes in hst1Δ cells, confirming the role of Bas1 as a positive regulator of BNA expression, which acts independently of Hst1. Interestingly, unlike the other BNA genes, BNA1 expression appears to be slightly increased in bas1Δ cells (Figure 2E), suggesting that the BNA1 gene may be regulated by additional unique mechanisms distinct from those governing expression of the remaining set of BNA genes. Although it has been shown that Bas1–Pho2 is required for the activation of most BNA genes in ade16Δade17Δ cells [18,33], the effect of bas1Δ on BNA expression in a WT background has not been shown. Moreover, hst1Δbas1Δ cells also showed a notable increase in PHO5 and PHO8 expression (Figure 2E), lending support to the model that Bas1 and Pho4 are in competition for limiting reserves of Pho2 (Figure 2C), and that this becomes visible in the absence of Hst1, the major regulator of BNA expression alongside Rpd3 [30]. These studies also firmly indicate that Bas1–Pho2 is required for optimal BNA expression in hst1Δ cells even under adenine-replete conditions.
Having observed a genetic interaction between the hst1Δ mutant and the ade16Δade17Δ (Figure 2D) and bas1Δ mutants (Figure 2E), we then examined whether Rpd3 also played a role in this context. Since Rpd3 antagonizes Hst1-mediated repression and promotes BNA expression, we examined whether Rpd3 was required for Bas1–Pho2-mediated activation of BNA expression in ade16Δade17Δ cells. As shown in Figure 2F, when we compared the ade16Δade17Δ and rpd3Δade16Δade17Δ mutants, RPD3 deletion significantly reduced BNA expression in ade16Δade17Δ cells. Rpd3 may allow for improved recruitment of Bas1–Pho2 by preventing the spreading of repressive chromatin structure established by Hst1 [30]. However, the rpd3Δade16Δade17Δ mutant still expressed most BNA genes to a level higher than that of rpd3Δ cells, suggesting that the direct mechanism of Bas1–Pho2 recruitment might function independently of Rpd3.

2.3. The ade16Δade17Δ Mutant Exhibits Altered Cellular NR and NA-NAM Metabolism

Having observed significant decreases in BNA expression when BAS1 is deleted in the hst1Δ background, we sought to investigate what effect the loss of Bas1 might have on the production of QA, a de novo intermediate. Interestingly, BAS1 deletion did not appear to decrease QA levels in either WT or hst1Δ cells (Figure 3A). It is likely that in bas1Δ cells, a small decrease in QA production may be masked by its decreased BNA6 expression (Figure 2E), which is expected to cause QA accumulation (Figure 1A).
Surprisingly, although the ade16Δade17Δ mutant showed elevated BNA expression, these cells appeared to release less QA (Figure 3B). It is possible that a portion of produced QA is assimilated into NAD+ due to especially high BNA6 expression in these cells (Figure 2E). This is likely the case since the ade16Δade17Δ mutant was shown to have increased levels of BNA expression and de novo pathway metabolites, as well as increased NAD+ levels in a medium lacking NA [18]. The QA production studies also further support Rpd3 as a primary positive regulator of BNA expression [30]. As shown in Figure 3B, the rpd3Δade16Δade17Δ mutant did not release detectable QA and displayed a similar phenotype observed in the rpd3Δ mutant (Figure 2A). In addition, unlike other BNA genes, BNA1 expression was not increased in ade16Δade17Δ cells (Figure 2F), which may also contribute to observed lower QA levels (Figure 3B). These results also suggest some BNA genes may be independently regulated by different mechanisms. Next, we further examined whether other branches of NAD+ metabolism are also affected in the ade16Δade17Δ mutant. Since PHO signaling is activated in this mutant, we examined whether it also produced more NR, as observed in rpd3Δ cells. We found that although the ade16Δade17Δ mutant did not appear to release more NR (Figure 3C), its intracellular NR was significantly increased (Figure 3D). For comparison, direct Pi-depletion caused greater NR production in WT cells compared to the ade16Δade17Δ mutants (Figure 3D). Interestingly, the ade16Δade17Δ cells also showed a significant increase in intracellular NA-NAM levels (Figure 3E). This could be due to increased NR flow into the NA-NAM salvage pathway combined with a blockage in NA-NAM metabolism. To test this, we examined the expression of genes involved in NA (NPT1) and NAM (PNC1) metabolism. Moreover, higher intracellular NR and NA-NAM could also be due to increased import of these precursors, especially considering that the quantities of these metabolites released extracellularly are not visibly increased. Therefore, the expression of TNA1 (NA and QA transporter), NRT1 (NR transporter), and FUN26 (vacuolar NR transporter) was also studied. As shown in Figure 3F, expression of PNC1 was significantly reduced in ade16Δade17Δ cells, while expression of the other genes was not significantly altered. Interestingly, the observed inhibitory effect of ade16Δade17Δ on PNC1 expression suggests that either the Bas1–Pho2 complex or the Pho2–Pho4 complex might negatively regulate PNC1 expression, opposite the previously characterized roles of these complexes as activators of ADE/BNA expression [18,33] and PHO expression [42,43,44], respectively.
To test whether either of the two complexes regulates PNC1 expression, we examined levels of PNC1 expression in cells lacking Bas1, Pho4, and Pho2, respectively. We found that, under standard conditions, deletion of the shared subunit PHO2 had the expected effect of significantly increasing PNC1 expression, while deletion of the unique subunits BAS1 and PHO4 did not have a discernible effect on PNC1 mRNA levels (Figure 3G, left panel). Next, we measured PNC1 gene expression in a medium lacking adenine, a growth condition previously shown to promote the formation of the Bas1–Pho2 and Pho2–Pho4 complexes [33], expecting this to amplify any effect either complex might have. Under these conditions, we observed PHO2 deletion to again cause a large increase in PNC1 expression (Figure 3G, right panel). In addition, we found that in this case, deletion of BAS1 caused a minor increase in PNC1 expression, though far below the level shown in cells lacking the shared complex subunit Pho2. This suggests that both complexes may have overlapping roles in negatively regulating PNC1 and thereby reducing NA-NAM salvage activity and that one complex is largely able to complement the role of the other in its absence. This establishes a novel role for Pho2 as a negative regulator of NA-NAM salvage, alongside its previously characterized roles as a positive regulator of both de novo NAD+ metabolism [18] and NR salvage [16]. Overall, our results showed that both increased NR production and a blockage in the conversion of NAM to NA (reduced PNC1 expression) were observed in ade16Δade17Δ cells. Increased PHO signaling activity likely contributes to NR production [16], while reduced Pnc1 activity leads to the accumulation of NAM and NR. These results also suggest that increased BNA and PHO gene expression observed in the ade16Δand17Δ mutants [33] may be partly due to NAM accumulation and reduced Hst1 activity. It has been shown that NAM can inhibit Hst1-activity [45,46] and de-repress BNA gene expression [19].

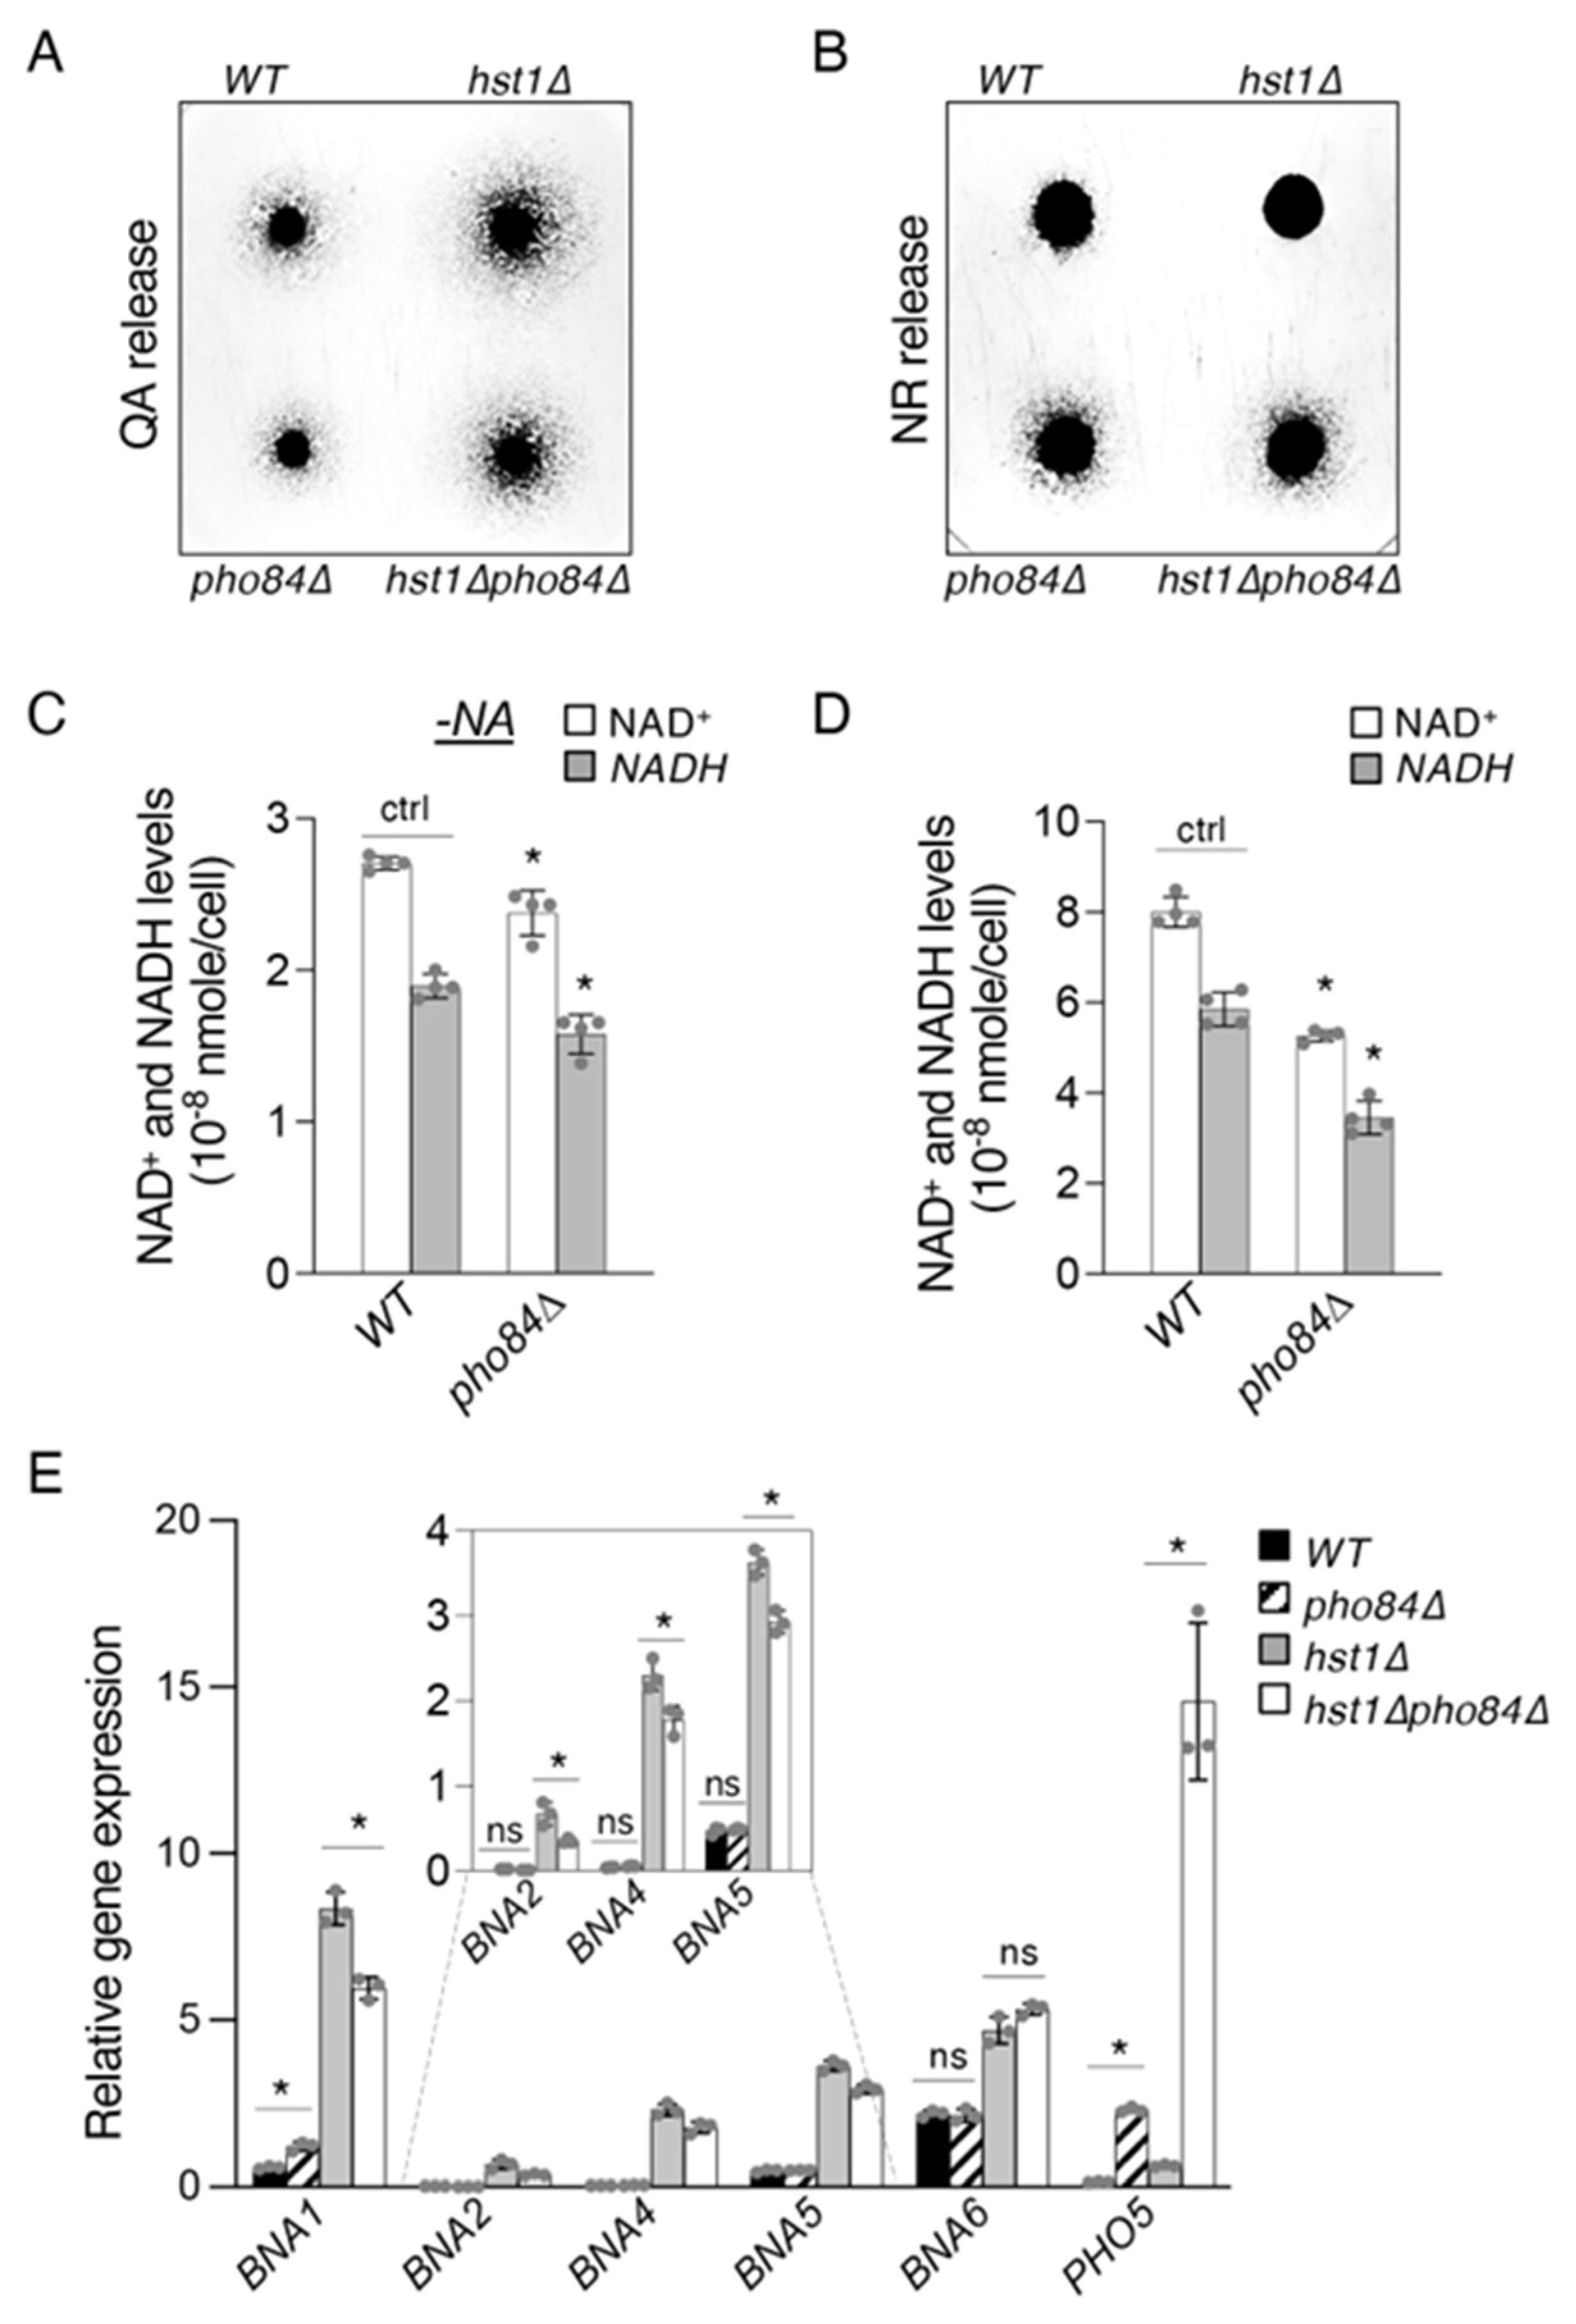
2.4. Pho84-Mediated Phosphate Transport Affects Homeostasis of NAD+ Precursors

To further understand the connection between PHO activation and de novo NAD+ metabolism we employed the pho84Δ mutant as a genetic mimic of Pi depletion. Deletion of PHO84 causes reduced intake and accumulation of Pi [44,47], which serves as a model of chronic reduction of Pi levels, as opposed to acute depletion resulting from short periods of growth in a low-Pi medium. First, we determined the effect of PHO84 deletion on QA production in WT and hst1Δ cells. We found that the deletion of PHO84 slightly, but visibly, reduces QA release in WT and hst1Δ backgrounds (Figure 4A). This may partly be due to competition between Bas1–Pho2 and Pho2–Pho4 caused by PHO activation, limiting the amount of Pho2 available for BNA induction. We also compared the levels of NR production in these cells and found that both pho84Δ and hst1Δpho84Δ cells showed increased NR release relative to WT and hst1Δ cells, respectively. This suggests that Pi sensing, PHO activation, and NR metabolism remain largely functional in hst1Δ cells. Interestingly, hst1Δpho84Δ cells appeared to release less NR compared to pho84Δ cells, suggesting that increased BNA expression might compete with PHO activation in the pho84Δ background.
Next, we examined whether the NAD+ pool is depleted by PHO84 deletion. NAD+ levels were determined in cells grown in an SC medium lacking NA (in which NAD+ is derived mostly from de novo activity) (Figure 4C) and standard SC medium (Figure 4D). We found that NAD+ levels are slightly but significantly reduced in an SC–NA medium, supporting the hypothesis that PHO activation is able to reduce de novo activity. Consistent with the low Pi treatment results (Figure 2B), NAD+ levels were significantly reduced in pho84Δ cells grown in regular SC. This may be due to a limitation of Pi and, consequently, of the NA/NAM salvage pathway, which requires more ATP [18]. Lastly, the use of the pho84Δ mutant also allows us to further solidify the competitive model elaborated above (Figure 2C). We anticipate the competition to be more significant in the hst1Δ background in which BNA expression is induced and that reduced NAD+ levels caused by pho84Δ will not interfere with the analysis. Consistent with this expectation, we saw that expression of most BNA genes was slightly but consistently reduced in hst1Δpho84Δ cells compared to hst1Δ cells (Figure 4E), closely resembling the differences observed by Pi depletion from the growth medium (Figure 2D).

2.5. Phosphate Depletion Increases Pho2 Binding Activity at the PHO5 Promoter but Not at the BNA2 Promoter

Lastly, we attempted to directly test the hypothesis that Pi depletion affects BNA expression via alteration of Bas1–Pho2 complex activity. Presumably, this would occur by increasing Pho2–Pho4 complex formation. It is possible that this increased formation of Pho2–Pho4 might reduce Bas1–Pho2 complex formation and limit the expression of the BNA genes. We again made use of the hst1Δ background in order to avoid the confounding influence of NAD+ limitation during the Pi depletion described above. To investigate this question, we focused on BNA2 as the rate-limiting element of the de novo pathway which is consistently sensitive to factors associated with the general alteration of BNA expression [19]. The BNA2 promoter region contains two predicted Bas1 binding sites near the transcription start site (Figure 5A, left); therefore, we assessed Pho2 binding in the short region between these sites using chromatin immunoprecipitation (ChIP) of Pho2 tagged with an HA epitope. In addition, we investigated binding to the PHO5 promoter as a positive control for PHO induction. The binding sites of Pho4 and Pho2 at the PHO5 promoter are well characterized [48,49,50], so we measured Pho2 binding in a region previously associated with Pho4/Pho2 binding, directly upstream of the UAS1 binding site (Figure 5A, right). First, we examined the expression of the Pho2-HA protein under the conditions investigated by Western blotting. As shown in Figure 5B, Pho2-HA expression was not visibly altered relative to the PGK control either by deletion of HST1 or by depletion of Pi.
As expected, Pi depletion caused a significant increase in Pho2 binding to the PHO5 promoter, confirming the successful operation of PHO signaling under the conditions investigated (Figure 5C). However, Pi depletion did not appear to significantly alter Pho2 binding to the BNA2 promoter. Of note is that an overall low Pho2 binding activity was observed at the BNA2 promoter, making it difficult to detect a further reduction in Pho2 binding by a low Pi. It is possible that Pho2 only transiently associates with the BNA2 promoter and that our assay conditions are not optimal to capture Pho2 binding. The mechanism of Bas1–Pho2 activity at the BNA2 promoter remains largely unknown; for instance, whether one of the two proteins is responsible for the recruitment of the other, or whether the putative binding sites in Figure 5A are genuine binding sites for Bas1–Pho2. It remains to investigate this complex issue in greater detail in future studies.

3. Discussion

In this study, we show that Hst1 and Rpd3 play a role in co-regulating Pi-sensing PHO signaling and de novo NAD+ metabolism (Figure 5D). Together with their antagonistic regulation of de novo metabolism [30], the two appear to employ a different mode of regulation at the PHO5 and PHO8 promoters, with both serving as negative regulators in this latter case (Figure 1B). Two transcription complexes, Pho2–Pho4 and Bas1–Pho2, are also active in this connection. The Pho2–Pho4 complex has long been known as an activator of PHO pathway targets [42,43,44], while the Bas1–Pho2 complex was recently identified as a positive regulator of BNA expression in the ade16Δade17Δ background [18] (Figure 5D). The sharing of Pho2 between these complexes provides an opportunity for coordination between de novo NAD+ synthesis and PHO signaling pathways, considering that Pi depletion is also associated with the reduction of cellular NAD+ levels (Figure 2B). To study the specific effect of Pi-depletion on BNA expression independent of NAD+ levels, we employed the hst1Δ mutant and showed that Pi-depletion in fact limits BNA expression in hst1Δ cells (Figure 2D). These results indicate some degree of competition between Bas1 and Pho4 for binding to Pho2, which has also been suggested to occur between the ADE and PHO genes [33]. The ultimate consequence of this would be two competing signals induced by low-Pi: low NAD+ promotes BNA activation via loss of Hst1 activity, while PHO activation also limits BNA expression (Figure 5D). This effect indeed becomes even more pronounced in hst1Δade16Δade17Δ cells. Supporting this model, we showed that deleting BAS1 indeed reduces BNA expression with a concomitant increase in PHO gene expression in hst1Δ cells (Figure 2E). On the other hand, the deletion of BAS1 alone does not significantly alter BNA expression. It appears that the Bas1–Pho2 complex is not a major regulator of BNA expression under standard conditions, but that it is necessary for full BNA induction under inducing conditions, such as in hst1Δ or ade16Δade17Δ cells. As noted previously, however, the low ATP levels seen in bas1Δ cells [40,41] may cause declines in NAD+ production and loss of Hst1 activity, confounding straightforward investigation of BAS1 deletion in the WT background.
As a sirtuin, Hst1 activity is limited by low NAD+, resulting in the de-repression of both the BNA genes and the PHO pathway (Figure 5D). Owing to these relationships, PHO gene expression is predicted to be activated in low-Pi conditions not only by the main mechanism of Pho4 translocation to the nucleus but also indirectly by the reduction of NAD+ levels under low-Pi conditions (Figure 2A). This series of events ultimately serves to strongly activate PHO targets, one result of which is the increased production of NR (Figure 3D and Figure 5D). We have also identified novel and distinctive roles for Bas1–Pho2 and Pho2–Pho4 as negative regulators of NA-NAM salvage via PNC1. The ade16Δade17Δ mutant cells show reduced PNC1 expression (Figure 3F) and, consequently, NAM accumulation (Figure 3E) (Pnc1 converts NAM to NA). In a medium without adenine, cells lacking Pho2, and to a markedly lesser degree Bas1, exhibit increased PNC1 expression. The mode of PNC1 regulation we have observed greatly helps to contextualize and clarify the nexus of Pi, ATP, and NAD+ metabolism described here. It was shown previously that making NAD+ from NA-NAM salvage requires more ATP than from the de novo pathway, due to additional ATP consumption by Npt1, directly downstream from Pnc1 [18]. Therefore, reduced PNC1 expression may help decrease NA-NAM salvage activity to preserve ATP for other cellular functions and alleviate NA accumulation behind Npt1. Increased NAM accumulated behind Pnc1 may also help de-repress BNA and PHO genes to facilitate de novo NAD+ synthesis and PHO activation in a Hst1-dependent manner, as NAM is a strong inhibitor of Hst1 [45,46]. At the same time, Bas1–Pho2 promotes BNA expression and helps to favor the usage of de novo NAD+ metabolism over NA-NAM salvage. Of note, low Pi directly leads to increased Pho2–Pho4 activity and also low ATP levels, thereby also indirectly promoting Pho2–Pho4 and Bas1–Pho2 activity. Taken together, this suggests that low Pi causes redirection of cellular NAD+ metabolism from NA-NAM salvage to de novo biosynthesis through the following set of events: promotion of BNA expression via Bas1–Pho2 as well as reduced Hst1 activity, reduction of Npt1 catalytic activity via limitation of ATP [18], and, finally, reduction of Pnc1 activity via the combined effect of Pho2–Pho4 and Bas1–Pho2 (Figure 5E). Lastly, the apparent competition between Bas1 and Pho4 for Pho2 under low-Pi conditions seems to favor PHO activation (Figure 2D and Figure 4E) and may help to set an upper limit to BNA activation under these conditions.
On the other hand, Rpd3 serves as an epigenetic regulator in this metabolic network independent of NAD+ levels. Quite interestingly, Rpd3 has a remarkably high degree of overlap with each of the regulators described above: it is a positive regulator of the BNA genes, PNC1 [30], and a negative regulator of the NR-producing phosphatases Pho5 and Pho8 [34,35] (Figure 1C). This helps ensure that PHO activity, de novo NAD+ metabolism, as well as salvage of NA, NAM, and NR remain controlled to some degree, even when levels of NAD+ and Pi are low. For example, in the case of PHO5 expression and NR production, the removal of both Hst1 and Rpd3 leads to synergistically increased activity, which may be detrimental to cells. However, Rpd3 is required not only as a PHO repressor but also seems to be required for full induction of PHO5 [34,51], highlighting the intricate role of Rpd3 as both a positive and negative epigenetic regulator depending on the context. As noted above, Rpd3 acts as a positive regulator of the BNA genes, as well as of the NR transporter NRT1 and the NA/QA transporter TNA1, all of which are induced in hst1Δ or by limitation of NAD+ [19]. Interestingly, Nrt1 has also been shown to be a transporter of the ZMP precursor 5-Aminoimidazole-4-carboxamide-1-β-d-ribofuranoside (AICAR) [52]. Collectively, these results provide a model connecting de novo metabolism, PHO signaling, as well as salvage of NA, NAM, and NR.
As anticipated from the preceding relationship, the phosphate transporter Pho84 also appears to have a significant influence on the regulation of de novo NAD+ metabolism. It is likely that this primarily proceeds through the model outlined, as loss of PHO84 is associated with reduced accumulation of Pi [47] and high levels of PHO induction (Figure 4E) [53]. As mentioned above, the relationship is likely twofold: loss of Hst1 activity due to decreased NAD+ production and decreased availability of Pho2 via its increased recruitment into the PHO-activating Pho2–Pho4 complex. These two influences are predicted to have opposite effects on BNA expression, and the effect of reduced Hst1 activity would be predicted to predominate based on its significant control of BNA expression [19,29,30] relative to the more minor effect exerted by Bas1–Pho2 [18] (Figure 2E and Figure 3A). However, pho84Δ cells show almost no changes in BNA expression relative to WT cells (Figure 4E), suggesting that the two influences may be more balanced in degree. This could possibly be due to an incomplete limitation of Hst1 activity at intermediate intracellular NAD+ concentrations, or alternatively due to particular adaptations to chronically low Pi in pho84Δ cells (Figure 4D).
In addition, the effect of Rpd3 on the transport of Pi via Pho84 cycling is a topic in need of further investigation. Having established the close relationship of both Pi-sensing and Rpd3 with the regulation of de novo metabolism, the two may interact in a variety of ways to influence the ultimate status of BNA gene expression. For instance, rpd3Δ cells are known to accumulate less Pi due to defective recycling of Pho84, causing a significant PHO induction independently of Rpd3 activity at PHO promoters [35]. This suggests that Pho4 may bind and sequester some Pho2 away from Bas1, thereby indirectly reducing BNA expression. Although this effect is expected to be minor in comparison with the effect of Rpd3 as an epigenetic regulator of BNA expression per se, it provides a hint of the complexity involved in joining de novo NAD+ metabolism, Pi-sensing, and NR salvage. Moreover, Pho84 recycling defects in rpd3Δ cells may partially explain the low NAD+ phenotype of rpd3Δ cells in standard and -NA media [30].
Finally, under our experimental conditions, we did not observe a direct limitation of Pho2 binding to the BNA2 promoter after Pi depletion that would directly confirm the model of competition between Bas1–Pho2 and Pho2–Pho4 described above. However, neither does this observation unambiguously exclude the possibility of competition between the two complexes for limiting reserves of Pho2. Several considerations remain to be addressed in this respect. Namely, the promoter of BNA6 may provide a useful alternative to the BNA2 promoter in capturing alterations of Bas1–Pho2 complex activity and binding; among all the BNA genes, BNA6 expression seems to be the most sensitive to deletion of BAS1 (Figure 2E). The BNA6 promoter is also less characterized relative to that of BNA2; studies of BNA6 and other BNA genes may therefore provide insights into different forms of regulation among the set of BNA genes and reveal elements that are unique to each. In addition, the mechanism of Bas1–Pho2 binding to the BNA2 promoter is largely unexplored. It may be that any influence of Pho2 sequestration on BNA expression is not visible in a phenomenon as facile as the simple quantity of Pho2 binding. It was earlier demonstrated that Bas1 is responsible for recruiting Pho2 to the ADE promoters [54], but this may not necessarily be the case for the BNA promoters. It may indeed be the case that Pho2 binds to the BNA promoters first and later assists Bas1 binding, and that limitation of Pho2 availability is only visible as a decrease in Bas1 abundance at the BNA2 promoter Alternatively, some unknown modification or factor downstream of Bas1–Pho2 might provide a better readout of this phenomenon. Finally, two opposite influences are rendered by Pi depletion. These are the increased formation of Pho2–Pho4 described above as well as the limitation of ATP [39], which is predicted to cause increased ZMP levels. Assuming that limiting Pho2 levels do indeed engender competition between Bas1 and Pho4, this influence may be somewhat offset by the promotion of Bas1–Pho2 complex formation by ZMP. This level of context-dependence and complexity makes the question a difficult one to resolve definitively.
In summary, Hst1, Rpd3, and Pho2 appear to integrate the regulation of several disparate branches of NAD+ metabolism, and their activities and targets also provide links to Pi sensing, purine metabolism, and the overall status of the cell’s NAD+ pool. This set of regulators, therefore, helps to coordinate a variety of interrelated metabolic signals in budding yeast. Further work will be required to explore the mechanistic interactions among these regulators and to establish the means by which they compete and cooperate to influence the cellular pools of NAD+ and its precursors. Altogether, this work contributes to the elaboration of the relations by which NAD+ metabolism is governed and helps to connect different branches of NAD+ metabolism among each other and with other signaling networks in the cell.

4. Materials and Methods

4.1. Yeast Strains, Growth Media, and Plasmids

The parental WT yeast strain BY4742 MATα his3Δ1 leu2Δ0 lys2Δ0 ura3Δ0 used for this study was acquired from Open Biosystems [55]. Standard yeast growth media including synthetic minimal (SD), synthetic complete (SC), and yeast extract/peptone/dextrose (YPD) rich media were made as described [56]. Niacin-free yeast nitrogen base acquired from Sunrise Science Products was used to make special NA-free SD and NA-free SC. Low phosphate (low-Pi) medium was prepared by phosphate precipitation from SD or SC as previously described [16]. In brief, for each liter of low-Pi SC or SD, 2.46 g of MgSO4 were first dissolved in SC or SD. Next, 8 mL of concentrated ammonia was slowly added with gentle stirring to precipitate inorganic phosphate as MgNH4PO4. After filtration, HCl was added to the clear solution to adjust pH to 6, followed by autoclave sterilization. Additional auxotrophic supplements and glucose were added after autoclave. All gene deletions were done by replacing the coding regions of WT genes with gene-specific DNA fragments generated by PCR using either the pAG32-hphMX4 [57] or the reusable loxP-kanMX-loxP (pUG6) [58] cassette as a template. Double gene deletions were carried out by employing different drug resistant markers for each round of gene deletion. Multiple gene deletions were achieved by using the galactose-inducible Cre recombinase to remove the loxP-kanMX-loxP marker from the yeast genome [58], followed by another round of gene deletion. The HA epitope tag was added to target genes directly in the genome using the pFA6a-3HA-kanMX6 or pFA6a-kanMX6-PGAL1-3HA plasmid as a template for PCR-mediated tagging [59].

4.2. Quantitative PCR (qPCR) Quantitation of Gene Expression

For each yeast strain, we collected approximately 40–50 OD600 unit (absorbance at 600 nm; 1 OD600 unit = ~1 × 10⁷ cells/mL) cells grown to early-logarithmic phase in SD (~6 h growth from OD600 of 0.1) by centrifugation. Collected cells were immediately subjected to RNA extraction. Total RNA was isolated using GeneJET RNA purification Kit (Thermo Scientific, Waltham, MA, USA) and cDNA was synthesized using QuantiTect Reverse Transcription kit (Qiagen, Hilden, Germany). About 50–100 ng of cDNA and 500 nM of each primer (final concentrations) were used for each 20 µL qPCR reaction. qPCR reactions were run in 96-well plates on Roche LightCycler 480 using LightCycler 480 SYBR green I Master Mix (Roche, Basel, Switzerland) as described [19]. The average size of the amplicon was ~120 bp for each gene of interest. The target mRNA transcript levels were normalized to TAF10 transcript levels.

4.3. Repressible Acid Phosphatase (rAPase) Activity and Alkaline Phosphatase (rALPase) Assays

The rAPase liquid assay was modified from a protocol as previously described [60]. For each strain, about 2.5 OD600 unit cells grown in SC for 6 h were collected, washed, and resuspended in 150 μL sterile water resulting in cell suspension. Next, 600 μL of substrate solution (5.6 mg/mL p-nitrophenylphosphate, pNPP, in 0.1 M sodium acetate, pH 4) was added to the cell suspension, followed by incubation at 30 °C for 15 min. To stop the reaction, 600 µL ice-cold 10% trichloroacetic acid was added. Next, 600 μL of this final mixture was mixed with 600 μL saturated Na2CO3 to allow color (neon yellow) development. Cells were then removed by centrifugation to acquire the supernatant for OD420 colorimetric phosphatase product p-nitrophenol (pNP) determination. The rAPase activities were determined by normalizing OD420 readings to the total cell number (OD600). The cell extract-based rALPase activity assay was carried out as previously described with modifications [61]. In brief, about 2.5 OD600 units of cells grown in SC for 6 h were collected and washed in 0.85% NaCl with 1 mM PMSF by centrifugation [61]. The resultant cell pellet was then resuspended in 600 µL lysis buffer (20 mM PIPES, 0.5%, Triton X-100, 50 mM KCl, 100 mM potassium acetate, 10 mM MgSO4, 10 μM ZnSO4, 1 mM PMSF) followed by bead-beating. The resultant cell lysates were then centrifuged at 13,200 rpm for 5 min at 4 °C to collect the supernatant. Enzymatic reactions were carried out by mixing 200 µL supernatant with 300 µL reaction buffer for each sample (333 mM Tris-HCl, pH 8.5, 0.53% Triton X-100, 133 mM MgSO4, 13.3 µM ZnSO4, w/wo 1.66 mM pNPP), followed by incubation at 37 °C for 20 min. Reactions were stopped by adding 500 µL stop buffer (1 M glycine/KOH, pH 11.0). Supernatants were then collected by centrifugation, and the rALPase activities were determined by normalizing A420 readings of colorimetric phosphatase product pNP to the total cell number (OD600) used in each reaction.

4.4. QA and NR Cross-Feeding Plate Assays

These assays have been used as readout for relative QA and NR levels in previous studies [16,19,30]. Specific mutants, which depend on QA or NR for growth, were employed as the “recipient cells”, and yeast strains of interest were the “feeder cells”. Note that standard growth media do not contain the NAD+ intermediates such as NR and QA needed for the growth of recipient cells. Therefore, the extent of the recipient cell growth indicates the relative levels of QA and NR released by feeder cells. In brief, recipient cell suspension (made in sterile H2O) was plated onto a solid agar plate (~104 cells/cm2). Next, ~2 × 10⁴ cells of each feeder cell strain (2 µL cell suspension made in sterile water at OD600 of 1) were spotted on the lawn of recipient cells. Plates were incubated at 30 °C for 2–3 days and then the images were captured. QA cross-feeding was carried out on SC or SD using the QA-dependent npt1Δnrk1Δbna4Δ mutant. NR cross-feeding was carried out on YPD or SC using the NR-dependent npt1Δbna6Δpho5Δ mutant.

4.5. Measurement(s) of NAD+, NADH, QA, NR, and NA-NAM

Total intracellular levels of NAD+ and NADH were determined using enzymatic cycling reactions as previously described [62] with modifications. Approximately 1 OD600 unit cells grown to early-logarithmic phase in SC (~6 h growth from OD600 of 0.1) were collected in duplicate by centrifugation. Acid extraction was performed in one tube to obtain NAD+, and alkali extraction was performed in the other to obtain NADH at 60 °C for 40 min. Amplification of NAD+ or NADH in the form of malate was carried out using 2–3 µL (for NAD+) or 4 µL (for NADH) of neutralized acid or alkali-extracted lysate in 100 µL of cycling reaction at room temperature for 1 h. Reactions were terminated by heating at 100 °C for 5 min. Malate produced from the cycling reaction was converted to oxaloacetate and then to aspartate and a-ketoglutarate. The reaction produced a corresponding amount of fluorometric NADH as readout, which was measured with excitation at 365 nm and emission monitored at 460 nm. Standard curves for determining NAD+ and NADH concentrations were obtained by adding NAD+ and NADH into the acid and alkali buffer (at final concentrations of 0, 2.5, and 7.5 µM) and then were treated with the same procedure along with other samples. Measurements of the intracellular and released levels of NAD+ intermediates (QA, NR, and NA-NAM) were determined by a liquid-based cross-feeding bioassay as previously described [16,37,63]. To prepare cell lysate for intracellular NAD+ intermediates determination, about 200 OD600 unit (for NR and NA-NAM) or 900 OD600 unit (for QA) cells of interest (donor cells) grown to late-logarithmic phase in SC (~16 h growth from an OD600 of 0.1) were collected by centrifugation and lysed by bead-beating (Biospec Products, Bartlesville, OK, USA) in 400 μL (per 200 OD600 unit cells) ice-cold 50 mM ammonium acetate solution. The supernatant was collected by centrifugation and the pellet was extracted two more times with 600 µL ice-cold 50 mM ammonium acetate solution, which resulted in ~1.6 mL cell lysate. After filter sterilization, 100–200 μL of clear extract (2.5 mL for QA) was supplemented to 8 mL of specific NAD+ intermediate-dependent recipient cells with a starting OD600 of 0.05 in SC. Supplemented cells were then grown at 30 °C for 24 h. For determining released extracellular NAD+ intermediates levels, 20 mL growth medium from the culture of cells of interest was collected and filter-sterilized, and then 4 mL was added to recipient cell culture in 2× SC to a final volume of 8 mL with a starting OD600 of 0.05. Control cultures of recipient cells in SC without supplementation were included in all experiments. For measuring relative QA levels, the QA-dependent npt1Δnrk1Δbna4Δ or npt1Δnrk1Δbna1Δ mutants were used as recipient cells. For measuring relative NR levels, the NR-dependent npt1Δbna6Δpho5Δ mutant was used as recipient cells. To measure relative NA-NAM levels, the NA-NAM dependent bna6Δnrk1Δnrt1Δ mutant was used as recipient cells, and the cultures were grown in NA-free SC. After incubation at 30 °C for 24 h, the growth of the recipient cells (OD600) was measured and normalized to the cell number of each donor strain used. Normalized OD600 readings were then converted to concentrations of QA, NR, and NA-NAM using the standard curves established as previously described [37,63].

4.6. Protein Extraction and Western Blot Analysis

Approximately 20 OD600 unit cells grown in SC to early-logarithmic phase (OD600 of ~1) were collected by centrifugation. Collected cells were snap-frozen in LN2 or immediately subjected to cell extraction. The cell lysate was obtained by bead-beating at 4 °C for 20 min in lysis buffer (50 mM Tris-HCl, pH 7.5, 100 mM NaCl, 1% Triton X-100, 5 mM EDTA, pH 8, 1 mM PMSF, and protease inhibitor cocktail, Pierce). Protein concentrations were measured using the Bradford assay (Bio-Rad, Hercules, CA, USA) and 20 µg (Pho2-HA) or 10 µg (PGK) of total protein was loaded in each lane. After electrophoresis, proteins were transferred to a methanol-activated polyvinylidene fluoride membrane (PVDF, GE Healthcare, Amersham, UK). Blocking was carried out using OneBlock™ Western-CL Blocking buffer at room temperature for 1 h. The membranes were then washed and blotted with either an anti-HA rabbit antibody (Cell Signaling 3724S, Danvers, MA, USA) or an anti-PGK mouse antibody (Invitrogen 459250, Waltham, MA, USA) at 4 °C overnight. Proteins were visualized using anti-mouse (for PGK) or anti-rabbit (for HA) IgG antibody conjugate to horseradish peroxidase (Invitrogen) and the ECL reagents (Amersham, GE). The chemiluminescent image was analyzed using the Amersham Imager 600 (GE, Amersham, UK) system and software following the manufacturer’s instructions.

4.7. Chromatin Immunoprecipitation (ChIP) Assay

Approximately 300 OD600 unit cells grown to early-logarithmic phase in SD for 6 h, as well as an equivalent number of cells grown for 5 h in SD and 1 h in SD without Pi, were crosslinked with 1% formaldehyde for 30 min at room temperature and stopped by adding glycine to a final concentration of 125 mM. Cells were pelleted by centrifugation and washed two times with cold Tris-buffered saline (20 mM Tris-HCl, pH 7.5, 150 mM NaCl). Cells were lysed by bead beating in 1 mL of lysis buffer (50 mM HEPES, 140 mM NaCl, 1% Triton X-100, 1 mM EDTA, 0.1% sodium deoxycholate, 0.1 mM PMSF, and protease inhibitor cocktail, Pierce) [19,30,64]. The cell lysate was drawn off the beads and centrifuged at a maximum speed (13,200 rpm) for 30 min at 4 °C. The chromatin pellet was resuspended in 1 mL of lysis buffer and sonicated on ice eight times with 20 s pulses using a Branson 450 Sonicator (Thomas Scientific, Swedesboro, NJ, USA) (output control set at 1.5 and duty cycle held at constant) to shear chromatin to an average length of ~500 bp. Sonicated chromatin solution was centrifuged twice at 10,000 rpm for 10 min at 4 °C. The supernatant was then aliquoted into two tubes (labeled “IP”, immunoprecipitated, and “no-Ab”, no antibody). The IP samples were incubated overnight at 4 °C with anti-HA monoclonal antibody (Abcam ab1424 or Cell Signaling 3724S) at a dilution of 1:150 (Abcam, Cambridge, UK) or 1:50 (Cell Signaling, Danvers, MA, USA). Both IP and no-Ab samples were incubated with 60 μL of ChIP-grade protein G beads (Cell Signaling 9007S) for 2 h at 4 °C and then washed as previously described. DNA was then eluted from the beads two times with 125 μL of elution buffer (5 × TE, 1% SDS). The combined DNA solution and input samples were incubated at 65 °C overnight to reverse the crosslinking. The purified DNA samples were analyzed by qPCR as described above. The amount of immunoprecipitated specific promoter DNA was determined relative to no-Ab DNA.

Author Contributions

Conceptualization, B.G. and S.-J.L.; data curation, B.G., Y.-C.L., M.M., K.H. and L.-H.L.; formal analysis, B.G. and S.-J.L.; funding acquisition, S.-J.L.; investigation, B.G., Y.-C.L., C.-C.H., M.M., K.H., L.-H.L. and S.-J.L.; methodology, B.G., Y.-C.L., C.-C.H. and S.-J.L.; software, B.G. and S.-J.L.; supervision, S.-J.L.; validation, B.G., Y.-C.L., C.-C.H., M.M. and K.H.; visualization, B.G., M.M., K.H. and L.-H.L.; writing—original draft, B.G. and S.-J.L.; writing—review and editing, B.G., Y.-C.L., C.-C.H., M.M., K.H., L.-H.L. and S.-J.L. All authors have read and agreed to the published version of the manuscript.

Funding

This research was funded by the National Institute of Health Grants GM141855.

Institutional Review Board Statement

Not applicable.

Informed Consent Statement

Not applicable.

Data Availability Statement

All data are contained within this article.

Acknowledgments

We thank Rebecca Parales and David Wilson for their suggestions and discussions. We also thank Natalie Wong and Erin Peixoto for their discussions and assistance with the preparation of media and reagents.

Conflicts of Interest

The authors declare no conflict of interest.

References

  1. Xie, N.; Zhang, L.; Gao, W.; Huang, C.; Huber, P.E.; Zhou, X.; Li, C.; Shen, G.; Zou, B. NAD(+) metabolism: Pathophysiologic mechanisms and therapeutic potential. Signal Transduct. Target. Ther. 2020, 5, 227. [Google Scholar] [CrossRef] [PubMed]
  2. Croft, T.; Venkatakrishnan, P.; Lin, S.J. NAD(+) Metabolism and Regulation: Lessons From Yeast. Biomolecules 2020, 10, 330. [Google Scholar] [CrossRef] [PubMed]
  3. Landry, J.; Sutton, A.; Tafrov, S.T.; Heller, R.C.; Stebbins, J.; Pillus, L.; Sternglanz, R. The silencing protein SIR2 and its homologs are NAD-dependent protein deacetylases. Proc. Natl. Acad. Sci. USA 2000, 97, 5807–5811. [Google Scholar] [CrossRef] [PubMed]
  4. Imai, S.; Armstrong, C.M.; Kaeberlein, M.; Guarente, L. Transcriptional silencing and longevity protein Sir2 is an NAD-dependent histone deacetylase. Nature 2000, 403, 795–800. [Google Scholar] [CrossRef]
  5. Smith, J.S.; Brachmann, C.B.; Celic, I.; Kenna, M.A.; Muhammad, S.; Starai, V.J.; Avalos, J.L.; Escalante-Semerena, J.C.; Grubmeyer, C.; Wolberger, C.; et al. A phylogenetically conserved NAD+-dependent protein deacetylase activity in the Sir2 protein family. Proc. Natl. Acad. Sci. USA 2000, 97, 6658–6663. [Google Scholar] [CrossRef]
  6. Kraus, W.L. PARPs and ADP-Ribosylation: 50 Years… and Counting. Mol. Cell 2015, 58, 902–910. [Google Scholar] [CrossRef]
  7. Okabe, K.; Yaku, K.; Tobe, K.; Nakagawa, T. Implications of altered NAD metabolism in metabolic disorders. J. Biomed. Sci. 2019, 26, 34. [Google Scholar] [CrossRef]
  8. Lautrup, S.; Sinclair, D.A.; Mattson, M.P.; Fang, E.F. NAD(+) in Brain Aging and Neurodegenerative Disorders. Cell Metab. 2019, 30, 630–655. [Google Scholar] [CrossRef]
  9. Lin, Q.; Zuo, W.; Liu, Y.; Wu, K.; Liu, Q. NAD(+) and cardiovascular diseases. Clin. Chim. Acta Int. J. Clin. Chem. 2021, 515, 104–110. [Google Scholar] [CrossRef]
  10. Tummala, K.S.; Gomes, A.L.; Yilmaz, M.; Graña, O.; Bakiri, L.; Ruppen, I.; Ximénez-Embún, P.; Sheshappanavar, V.; Rodriguez-Justo, M.; Pisano, D.G.; et al. Inhibition of De Novo NAD+ Synthesis by Oncogenic URI Causes Liver Tumorigenesis through DNA Damage. Cancer Cell 2014, 26, 826–839. [Google Scholar] [CrossRef]
  11. Hong, S.M.; Hwang, S.W.; Wang, T.; Park, C.W.; Ryu, Y.M.; Jung, J.H.; Shin, J.H.; Kim, S.Y.; Lee, J.L.; Kim, C.W.; et al. Increased nicotinamide adenine dinucleotide pool promotes colon cancer progression by suppressing reactive oxygen species level. Cancer Sci. 2019, 110, 629–638. [Google Scholar] [CrossRef]
  12. Gujar, A.D.; Le, S.; Mao, D.D.; Dadey, D.Y.A.; Turski, A.; Sasaki, Y.; Aum, D.; Luo, J.; Dahiya, S.; Yuan, L.; et al. An NAD+-dependent transcriptional program governs self-renewal and radiation resistance in glioblastoma. Proc. Natl. Acad. Sci. USA 2016, 113, E8247–E8256. [Google Scholar] [CrossRef]
  13. Jahan, F.; Bagchi, R.A. Enhancing NAD(+) Metabolome in Cardiovascular Diseases: Promises and Considerations. Front. Cardiovasc. Med. 2021, 8, 716989. [Google Scholar] [CrossRef]
  14. Hou, Y.; Wei, Y.; Lautrup, S.; Yang, B.; Wang, Y.; Cordonnier, S.; Mattson, M.P.; Croteau, D.L.; Bohr, V.A. NAD(+) supplementation reduces neuroinflammation and cell senescence in a transgenic mouse model of Alzheimer’s disease via cGAS-STING. Proc. Natl. Acad. Sci. USA 2021, 118, e2011226118. [Google Scholar] [CrossRef]
  15. Zhen, X.; Zhang, S.; Xie, F.; Zhou, M.; Hu, Z.; Zhu, F.; Nie, J. Nicotinamide Supplementation Attenuates Renal Interstitial Fibrosis via Boosting the Activity of Sirtuins. Kidney Dis. 2021, 7, 186–199. [Google Scholar] [CrossRef]
  16. Lu, S.P.; Lin, S.J. Phosphate-responsive signaling pathway is a novel component of NAD+ metabolism in Saccharomyces cerevisiae. J. Biol. Chem. 2011, 286, 14271–14281. [Google Scholar] [CrossRef]
  17. Tsang, F.; James, C.; Kato, M.; Myers, V.; Ilyas, I.; Tsang, M.; Lin, S.J. Reduced Ssy1-Ptr3-Ssy5 (SPS) signaling extends replicative life span by enhancing NAD+ homeostasis in Saccharomyces cerevisiae. J. Biol. Chem. 2015, 290, 12753–12764. [Google Scholar] [CrossRef]
  18. Pinson, B.; Ceschin, J.; Saint-Marc, C.; Daignan-Fornier, B. Dual control of NAD+ synthesis by purine metabolites in yeast. eLife 2019, 8, e43808. [Google Scholar] [CrossRef]
  19. James Theoga Raj, C.; Croft, T.; Venkatakrishnan, P.; Groth, B.; Dhugga, G.; Cater, T.; Lin, S.J. The copper-sensing transcription factor Mac1, the histone deacetylase Hst1, and nicotinic acid regulate de novo NAD(+) biosynthesis in budding yeast. J. Biol. Chem. 2019, 294, 5562–5575. [Google Scholar] [CrossRef]
  20. Groth, B.; Venkatakrishnan, P.; Lin, S.J. NAD(+) Metabolism, Metabolic Stress, and Infection. Front. Mol. Biosci. 2021, 8, 686412. [Google Scholar] [CrossRef]
  21. Tsang, F.; Lin, S.-J. Less is more: Nutrient limitation induces cross-talk of nutrient sensing pathways with NAD+ homeostasis and contributes to longevity. Front. Biol. 2015, 10, 333–357. [Google Scholar] [CrossRef] [PubMed]
  22. Ghislain, M.; Talla, E.; Francois, J.M. Identification and functional analysis of the Saccharomyces cerevisiae nicotinamidase gene, PNC1. Yeast 2002, 19, 215–224. [Google Scholar] [CrossRef] [PubMed]
  23. Emanuelli, M.; Carnevali, F.; Lorenzi, M.; Raffaelli, N.; Amici, A.; Ruggieri, S.; Magni, G. Identification and characterization of YLR328W, the Saccharomyces cerevisiae structural gene encoding NMN adenylyltransferase. Expression and characterization of the recombinant enzyme. FEBS Lett. 1999, 455, 13–17. [Google Scholar] [CrossRef] [PubMed]
  24. Anderson, R.M.; Bitterman, K.J.; Wood, J.G.; Medvedik, O.; Cohen, H.; Lin, S.S.; Manchester, J.K.; Gordon, J.I.; Sinclair, D.A. Manipulation of a nuclear NAD+ salvage pathway delays aging without altering steady-state NAD+ levels. J. Biol. Chem. 2002, 277, 18881–18890. [Google Scholar] [CrossRef]
  25. Bieganowski, P.; Pace, H.C.; Brenner, C. Eukaryotic NAD+ synthetase Qns1 contains an essential, obligate intramolecular thiol glutamine amidotransferase domain related to nitrilase. J. Biol. Chem. 2003, 278, 33049–33055. [Google Scholar] [CrossRef]
  26. Belenky, P.; Racette, F.G.; Bogan, K.L.; McClure, J.M.; Smith, J.S.; Brenner, C. Nicotinamide riboside promotes Sir2 silencing and extends lifespan via Nrk and Urh1/Pnp1/Meu1 pathways to NAD+. Cell 2007, 129, 473–484. [Google Scholar] [CrossRef]
  27. Bieganowski, P.; Brenner, C. Discoveries of nicotinamide riboside as a nutrient and conserved NRK genes establish a Preiss-Handler independent route to NAD+ in fungi and humans. Cell 2004, 117, 495–502. [Google Scholar] [CrossRef]
  28. Kato, M.; Lin, S.J. YCL047C/POF1 Is a Novel Nicotinamide Mononucleotide Adenylyltransferase (NMNAT) in Saccharomyces cerevisiae. J. Biol. Chem. 2014, 289, 15577–15587. [Google Scholar] [CrossRef]
  29. Bedalov, A.; Hirao, M.; Posakony, J.; Nelson, M.; Simon, J.A. NAD+-dependent deacetylase Hst1p controls biosynthesis and cellular NAD+ levels in Saccharomyces cerevisiae. Mol. Cell. Biol. 2003, 23, 7044–7054. [Google Scholar] [CrossRef]
  30. Groth, B.; Huang, C.C.; Lin, S.J. The histone deacetylases Rpd3 and Hst1 antagonistically regulate de novo NAD(+) metabolism in the budding yeast Saccharomyces cerevisiae. J. Biol. Chem. 2022, 298, 102410. [Google Scholar] [CrossRef]
  31. O’Neill, E.M.; Kaffman, A.; Jolly, E.R.; O’Shea, E.K. Regulation of PHO4 nuclear localization by the PHO80-PHO85 cyclin-CDK complex. Science 1996, 271, 209–212. [Google Scholar] [CrossRef]
  32. Kaffman, A.; Rank, N.M.; O’Shea, E.K. Phosphorylation regulates association of the transcription factor Pho4 with its import receptor Pse1/Kap121. Genes Dev. 1998, 12, 2673–2683. [Google Scholar] [CrossRef]
  33. Pinson, B.; Vaur, S.; Sagot, I.; Coulpier, F.; Lemoine, S.; Daignan-Fornier, B. Metabolic intermediates selectively stimulate transcription factor interaction and modulate phosphate and purine pathways. Genes Dev. 2009, 23, 1399–1407. [Google Scholar] [CrossRef]
  34. Vidal, M.; Gaber, R.F. RPD3 encodes a second factor required to achieve maximum positive and negative transcriptional states in Saccharomyces cerevisiae. Mol. Cell. Biol. 1991, 11, 6317–6327. [Google Scholar] [CrossRef]
  35. Wongwisansri, S.; Laybourn, P.J. Disruption of histone deacetylase gene RPD3 accelerates PHO5 activation kinetics through inappropriate Pho84p recycling. Eukaryot. Cell 2005, 4, 1387–1395. [Google Scholar] [CrossRef]
  36. Korber, P.; Barbaric, S. The yeast PHO5 promoter: From single locus to systems biology of a paradigm for gene regulation through chromatin. Nucleic Acids Res. 2014, 42, 10888–10902. [Google Scholar] [CrossRef]
  37. Lu, S.P.; Kato, M.; Lin, S.J. Assimilation of endogenous nicotinamide riboside is essential for calorie restriction-mediated life span extension in Saccharomyces cerevisiae. J. Biol. Chem. 2009, 284, 17110–17119. [Google Scholar] [CrossRef]
  38. Reinke, H.; Gregory, P.D.; Hörz, W. A transient histone hyperacetylation signal marks nucleosomes for remodeling at the PHO8 promoter in vivo. Mol. Cell 2001, 7, 529–538. [Google Scholar] [CrossRef]
  39. Boer, V.M.; Crutchfield, C.A.; Bradley, P.H.; Botstein, D.; Rabinowitz, J.D. Growth-limiting intracellular metabolites in yeast growing under diverse nutrient limitations. Mol. Biol. Cell 2010, 21, 198–211. [Google Scholar] [CrossRef]
  40. Gauthier, S.; Coulpier, F.; Jourdren, L.; Merle, M.; Beck, S.; Konrad, M.; Daignan-Fornier, B.; Pinson, B. Co-regulation of yeast purine and phosphate pathways in response to adenylic nucleotide variations. Mol. Microbiol. 2008, 68, 1583–1594. [Google Scholar] [CrossRef]
  41. Takaine, M.; Imamura, H.; Yoshida, S. High and stable ATP levels prevent aberrant intracellular protein aggregation in yeast. eLife 2022, 11, e67659. [Google Scholar] [CrossRef] [PubMed]
  42. Vogel, K.; Horz, W.; Hinnen, A. The two positively acting regulatory proteins PHO2 and PHO4 physically interact with PHO5 upstream activation regions. Mol. Cell. Biol. 1989, 9, 2050–2057. [Google Scholar] [CrossRef] [PubMed]
  43. Munsterkotter, M.; Barbaric, S.; Horz, W. Transcriptional regulation of the yeast PHO8 promoter in comparison to the coregulated PHO5 promoter. J. Biol. Chem. 2000, 275, 22678–22685. [Google Scholar] [CrossRef] [PubMed]
  44. Bun-Ya, M.; Nishimura, M.; Harashima, S.; Oshima, Y. The PHO84 gene of Saccharomyces cerevisiae encodes an inorganic phosphate transporter. Mol. Cell. Biol. 1991, 11, 3229–3238. [Google Scholar] [CrossRef]
  45. Bitterman, K.J.; Anderson, R.M.; Cohen, H.Y.; Latorre-Esteves, M.; Sinclair, D.A. Inhibition of silencing and accelerated aging by nicotinamide, a putative negative regulator of yeast sir2 and human SIRT1. J. Biol. Chem. 2002, 277, 45099–45107. [Google Scholar] [CrossRef]
  46. Jackson, M.D.; Schmidt, M.T.; Oppenheimer, N.J.; Denu, J.M. Mechanism of Nicotinamide Inhibition and Transglycosidation by Sir2 Histone/Protein Deacetylases. J. Biol. Chem. 2003, 278, 50985–50998. [Google Scholar] [CrossRef]
  47. Auesukaree, C.; Homma, T.; Tochio, H.; Shirakawa, M.; Kaneko, Y.; Harashima, S. Intracellular phosphate serves as a signal for the regulation of the PHO pathway in Saccharomyces cerevisiae. J. Biol. Chem. 2004, 279, 17289–17294. [Google Scholar] [CrossRef]
  48. Rudolph, H.; Hinnen, A. The yeast PHO5 promoter: Phosphate-control elements and sequences mediating mRNA start-site selection. Proc. Natl. Acad. Sci. USA 1987, 84, 1340–1344. [Google Scholar] [CrossRef]
  49. Barbarić, S.; Münsterkötter, M.; Svaren, J.; Hörz, W. The homeodomain protein Pho2 and the basic-helix-loop-helix protein Pho4 bind DNA cooperatively at the yeast PHO5 promoter. Nucleic Acids Res. 1996, 24, 4479–4486. [Google Scholar] [CrossRef]
  50. Barbaric, S.; Münsterkötter, M.; Goding, C.; Hörz, W. Cooperative Pho2-Pho4 interactions at the PHO5 promoter are critical for binding of Pho4 to UASp1 and for efficient transactivation by Pho4 at UASp2. Mol. Cell. Biol. 1998, 18, 2629–2639. [Google Scholar] [CrossRef]
  51. Rundlett, S.E.; Carmen, A.A.; Kobayashi, R.; Bavykin, S.; Turner, B.M.; Grunstein, M. HDA1 and RPD3 are members of distinct yeast histone deacetylase complexes that regulate silencing and transcription. Proc. Natl. Acad. Sci. USA 1996, 93, 14503–14508. [Google Scholar] [CrossRef]
  52. Ceschin, J.; Saint-Marc, C.; Laporte, J.; Labriet, A.; Philippe, C.; Moenner, M.; Daignan-Fornier, B.; Pinson, B. Identification of yeast and human 5-aminoimidazole-4-carboxamide-1-beta-d-ribofuranoside (AICAr) transporters. J. Biol. Chem. 2014, 289, 16844–16854. [Google Scholar] [CrossRef]
  53. Ueda, Y.; Oshima, Y. A constitutive mutation, phoT, of the repressible acid phosphatase synthesis with inability to transport inorganic phosphate in Saccharomyces cerevisiae. Mol. Gen. Genet. 1975, 136, 255–259. [Google Scholar] [CrossRef]
  54. Som, I.; Mitsch, R.N.; Urbanowski, J.L.; Rolfes, R.J. DNA-bound Bas1 recruits Pho2 to activate ADE genes in Saccharomyces cerevisiae. Eukaryot. Cell 2005, 4, 1725–1735. [Google Scholar] [CrossRef]
  55. Brachmann, C.B.; Davies, A.; Cost, G.J.; Caputo, E.; Li, J.; Hieter, P.; Boeke, J.D. Designer deletion strains derived from Saccharomyces cerevisiae S288C: A useful set of strains and plasmids for PCR-mediated gene disruption and other applications. Yeast 1998, 14, 115–132. [Google Scholar] [CrossRef]
  56. Burke, D.; Dawson, D.; Sterns, T. Methods in Yeast Genetics; Cold Spring Harbor Laboratory Press: Cold Spring Harbor, NY, USA, 2000; pp. 171–174. [Google Scholar]
  57. Goldstein, A.L.; McCusker, J.H. Three new dominant drug resistance cassettes for gene disruption in Saccharomyces cerevisiae. Yeast 1999, 15, 1541–1553. [Google Scholar] [CrossRef]
  58. Guldener, U.; Heck, S.; Fielder, T.; Beinhauer, J.; Hegemann, J.H. A new efficient gene disruption cassette for repeated use in budding yeast. Nucleic Acids Res. 1996, 24, 2519–2524. [Google Scholar] [CrossRef]
  59. Longtine, M.S.; McKenzie, A., 3rd; Demarini, D.J.; Shah, N.G.; Wach, A.; Brachat, A.; Philippsen, P.; Pringle, J.R. Additional modules for versatile and economical PCR-based gene deletion and modification in Saccharomyces cerevisiae. Yeast 1998, 14, 953–961. [Google Scholar] [CrossRef]
  60. Toh-e, A.; Ueda, Y.; Kakimoto, S.I.; Oshima, Y. Isolation and characterization of acid phosphatase mutants in Saccharomyces cerevisiae. J. Bacteriol. 1973, 113, 727–738. [Google Scholar] [CrossRef]
  61. Noda, T.; Klionsky, D.J. The quantitative Pho8Δ60 assay of nonspecific autophagy. Methods Enzym. 2008, 451, 33–42. [Google Scholar] [CrossRef]
  62. Easlon, E.; Tsang, F.; Skinner, C.; Wang, C.; Lin, S.J. The malate-aspartate NADH shuttle components are novel metabolic longevity regulators required for calorie restriction-mediated life span extension in yeast. Genes Dev. 2008, 22, 931–944. [Google Scholar] [CrossRef] [PubMed]
  63. Croft, T.; Raj, C.J.T.; Salemi, M.; Phinney, B.S.; Lin, S.-J. A functional link between NAD+ homeostasis and N-terminal protein acetylation in Saccharomyces cerevisiae. J. Biol. Chem. 2018, 293, 2927–2938. [Google Scholar] [CrossRef] [PubMed]
  64. Li, M.; Petteys, B.J.; McClure, J.M.; Valsakumar, V.; Bekiranov, S.; Frank, E.L.; Smith, J.S. Thiamine biosynthesis in Saccharomyces cerevisiae is regulated by the NAD+-dependent histone deacetylase Hst1. Mol. Cell. Biol. 2010, 30, 3329–3341. [Google Scholar] [CrossRef] [PubMed]
Figure 1. Rpd3 and Hst1 negatively regulate the PHO pathway genes PHO5 and PHO8. (A) Abridged model of the NAD+ biosynthetic pathways in Saccharomyces cerevisiae. De novo NAD+ metabolism begins with TRP, which is converted into NaMN by the Bna enzymes (Bna2, -7, -4, -5, -1, -6) (left). NaMN is also produced by salvage of NA and NAM, which is further connected with salvage of NR (right). NA, nicotinic acid; NAM, nicotinamide; NR, nicotinamide riboside; QA, quinolinic acid; TRP, L-tryptophan; NFK, N-formylkynurenine; KYN, kynurenine; 3-HK, 3-hydroxykynurenine; 3-HA, 3-hydroxyanthranilic acid; ACMS, 2-amino-3-carboximuconate-6-semialdehyde. KA, kynurenic acid; NaMN, nicotinic acid mononucleotide. Abbreviations of protein names are shown in ovals. Bna2, tryptophan 2,3-dioxygenase; Bna7, kynurenine formamidase; Bna4, kynurenine 3-monooxygenase; Bna5, kynureninase; Bna1, 3-hydroxyanthranilate 3,4-dioxygenase; Bna6, quinolinic acid phosphoribosyl transferase. (B) Relationship between de novo NAD+ biosynthesis, NR salvage, and Pi sensing. Rpd3 and Hst1 antagonistically regulate the BNA genes of the de novo pathway and have previously been shown to negatively regulate certain PHO targets including PHO5 and PHO8 phosphatases. PHO gene expression is sensitive to cellular phosphate (Pi) levels and is induced by Pi-depletion. Two PHO targets, the acid phosphatase Pho5 and the alkaline phosphatase Pho8, are known to convert NMN to NR, producing Pi. PHO signaling is mediated by the transcription factor complex formed by Pho2 and Pho4. (C) Gene expression qPCR analysis of PHO5 and PHO8 levels in WT, rpd3Δ, hst1Δ, and hst1Δrpd3Δ cells. Values shown are relative expression levels normalized to TAF10 as a control. PHO5 expression is increased in rpd3Δ and hst1Δ cells and is especially strongly raised in hst1Δrpd3Δ cells. PHO8 expression in rpd3Δ, hst1Δ, and hst1Δrpd3Δ cells is raised to a similar extent relative to WT cells. (D) Pho5 (repressible acid phosphatase, rAPase) activity in WT, rpd3Δ, hst1Δ, and hst1Δrpd3Δ cells. Both hst1Δ and rpd3Δ cells show a significant increase in Pho5 activity relative to WT. The hst1Δrpd3Δ double mutants show a further increase of Pho5 activity relative to the single mutants. (E) Pho8 (repressible alkaline phosphatase rALPase) activity in WT, rpd3Δ, hst1Δ, and hst1Δrpd3Δ cells. rpd3Δ, hst1Δ, and hst1Δrpd3Δ cells show comparable increases in Pho8 activity relative to WT cells. For (CE), the graphs are representative of the trend observed across three independent experiments. Error bars represent data from three technical replicates for each strain in an experiment. The p values are calculated using Student’s t-test (*, p < 0.05; ns, not significant).
Ijms 24 08047 g001
Figure 2. Rpd3 and Hst1 interact with cellular phosphate sensing and the Bas1–Pho2 complex during the regulation of de novo NAD+ metabolism. (A) Model of the proposed relationship between Pi depletion and reduction of cellular NAD+ pools. Pi depletion consequently leads to lower NAD+ levels. The limitation of NAD+ is predicted to reduce the activity of Hst1, which is an NAD+-dependent HDAC. Loss of Hst1 activity would then lead to decreased silencing of the BNA promoters. It is unknown whether Pi depletion affects BNA expression independent of Hst1. (B) NAD+ and NADH levels of WT cells grown in low Pi medium over the course of 30 min. Cells transferred into SC medium without Pi rapidly begin to show altered NAD+/NADH homeostasis. (C) Model depicting the interconnection of the Bas1, Pho2, and Pho4 transcription factors. Pho2 is shared between the BNA-activating Bas1–Pho2 complex and the PHO-activating Pho2–Pho4 complex. The formation of both complexes is promoted by the adenine precursor ZMP, which is accumulated in ade16Δade17Δ cells. (D) Pi depletion reduces the expression of the BNA genes in hst1Δ and hst1Δade16Δade17Δ backgrounds. Cells transferred to low-Pi medium for 30 min show reduced expression of several BNA genes relative to cells maintained in standard SC medium. PHO5 is included as a positive control for PHO activation. Values shown are relative expression levels normalized to TAF10 as a control. (E) Deletion of BAS1 reduces expression of the BNA genes but increases PHO5 and PHO8 expression in an hst1Δ background. Deletion of BAS1 does not significantly affect BNA expression in WT cells. (F) Deletions of ADE16 and ADE17 increase the expression of most BNA genes in WT and rpd3Δ cells. Rpd3 is required for optimal BNA expression in both WT and ade16Δade17Δ cells. PHO5 is included as a positive control for PHO activation. For (B,DF), the graphs are representative of the trend observed across three independent experiments. Error bars represent data from two biological replicates each with two technical replicates (for (B)) or from three technical replicates (for (DF)) for each strain in an experiment. The p values are calculated using Student’s t-test (*, p < 0.05; ns, not significant; ctrl, control).
Ijms 24 08047 g002
Figure 3. The ade16Δade17Δ mutant cells show altered homeostasis of NAD+ precursors. (A) Deletion of BAS1 does not markedly affect QA release in WT or hst1Δ backgrounds. (B) Deletions of ADE16 and ADE17 decrease QA release in WT cells but do not visibly affect QA release in rpd3Δ or hst1Δ cells. (C) Deletions of ADE16 and ADE17 do not affect levels of NR release in WT and hst1Δ backgrounds. Feeder cell spots along with NR-dependent recipient cells (npt1Δbna6Δpho5Δ) were grown at 30 °C on a YPD plate for 3 days. (D) ade16Δade17Δ cells have higher intracellular NR levels relative to WT cells. WT cells transferred to low Pi for 30 min also produce more NR. (E) ade16Δade17Δ cells have higher intracellular NA-NAM levels relative to WT cells. (F) Expression of PNC1, responsible for the conversion of NAM to NA, is reduced in ade16Δade17Δ cells. ade16Δade17Δ cells do not show significant changes in expression of the NA/QA transporter Tna1 or the NR transporters Nrt1 and Fun26. Values shown are relative expression levels normalized to TAF10 as a control. (G) Deletion of PHO2 significantly increases expression of PNC1 in both standard medium (left) and medium lacking adenine (right). Deletion of BAS1 slightly increases PNC1 expression in the medium without adenine. For (DG), the graphs are representative of the trend observed across three independent experiments. Error bars represent data from three technical replicates for each strain in an experiment. The p values are calculated using Student’s t-test (*, p < 0.05; ns, not significant).
Ijms 24 08047 g003
Figure 4. The phosphate transporter Pho84 influences cellular NAD+ production. (A) Deletion of PHO84 slightly decreases QA release in WT and hst1Δ cells. (B) Deletion of PHO84 slightly increases NR release in WT and hst1Δ cells. (C) Deletion of PHO84 slightly reduces NAD+/NADH levels when cells are grown in SC medium lacking NA. (D) pho84Δ cells show a significant reduction of NAD+/NADH relative to WT cells in regular SC medium. (E) pho84Δ cells do not show markedly altered BNA expression compared to WT cells. hst1Δpho84Δ cells exhibit small but significant reductions of BNA expression relative to hst1Δ cells. PHO5 is included as a positive control for PHO activation. Values shown are relative expression levels normalized to TAF10 as a control. For (CE), the graphs are representative of the trend observed across three independent experiments. Error bars represent data from two biological replicates each with two technical replicates (for (C,D)) or from three technical replicates (for (E)) for each strain in an experiment. The p values are calculated using Student’s t-test (*, p < 0.05; ns, not significant; ctrl, control).
Ijms 24 08047 g004
Figure 5. Model of the interconnection of NAD+ metabolism and PHO signaling by Hst1, Rpd3, and Pho2. (A) Schematics of putative Bas1 binding sites at the BNA2 promoter (left) and of Pho4 binding sites at the PHO5 promoter (right). Regions marked with ‘#’ were assayed for Pho2-HA binding. (B) Western blot analysis of Pho2-HA protein expression. Neither deletion of HST1 nor 1 h of Pi depletion significantly affects levels of Pho2-HA expression relative to the PGK control. (C) Pho2-HA binding activities at BNA2 and PHO5 promoters determined by ChIP. Pi depletion is able to increase Pho2-HA binding to the PHO5 promoter in hst1Δ cells. At the BNA2 promoter, Pho2-HA appears to have low binding activities and Pi depletion does not further decrease its binding. Values shown are relative binding levels (Ab/no-Ab) normalized to TAF10 as a control. Graphs are representative of the trend observed across three independent experiments. Error bars represent data from three technical replicates for each strain in an experiment. The p values are calculated using Student’s t-test (*, p < 0.05; ns, not significant). (D) Rpd3 is a positive regulator of de novo NAD+ metabolism, while Hst1 is a negative regulator. On the other hand, both appear to be negative regulators of the PHO pathway. Hst1 activity is decreased by low NAD+ levels, which may be caused by lowered ATP levels (not shown in this figure), which itself can be a consequence of phosphate depletion (low-Pi). This makes Hst1 sensitive to all three of these conditions, which consequently causes reduced silencing of BNA and PHO genes, leading to increased flux through de novo NAD+ biosynthesis and NR salvage pathways. Low-Pi may also enhance the formation of Bas1–Pho2 and Pho2–Pho4 complexes independent of NAD+ and Hst1, possibly via ZMP accumulation. Finally, low-Pi also promotes the translocation of Pho4 to the nucleus and increases Pho2–Pho4 complex formation. Under low-Pi conditions, the resulting lowered ATP and increased ZMP levels are predicted to activate Bas1–Pho2 and Pho2–Pho4, while low-Pi itself leads to prioritization of PHO activation via Pho4–Pho2 over BNA activation via Bas1–Pho2. Bas1–Pho2 and Pho2–Pho4 also inhibit NA-NAM salvage via negative regulation of PNC1 expression. With its HDAC activity being independent of NAD+ levels, Rpd3 remains an activator of de novo NAD+ biosynthesis and NAD+ precursor transport, as well as a repressor of Pi sensing under all conditions described. Dashed lines indicate the mechanisms of these steps remain unclear. The p values are calculated using Student’s t-test (*, p < 0.05; ns, not significant; ctrl, control).
Ijms 24 08047 g005
Disclaimer/Publisher’s Note: The statements, opinions and data contained in all publications are solely those of the individual author(s) and contributor(s) and not of MDPI and/or the editor(s). MDPI and/or the editor(s) disclaim responsibility for any injury to people or property resulting from any ideas, methods, instructions or products referred to in the content.

