
Celiac Disease Is a Risk Factor for Mature T and NK Cell Lymphoma: A Mendelian Randomization Study

 , ,
, ,  , and
, and
Abstract
1. Introduction
2. Results
2.1. Eleven Non-HLA SNPs Associated with Celiac Disease Are Selected as IVs
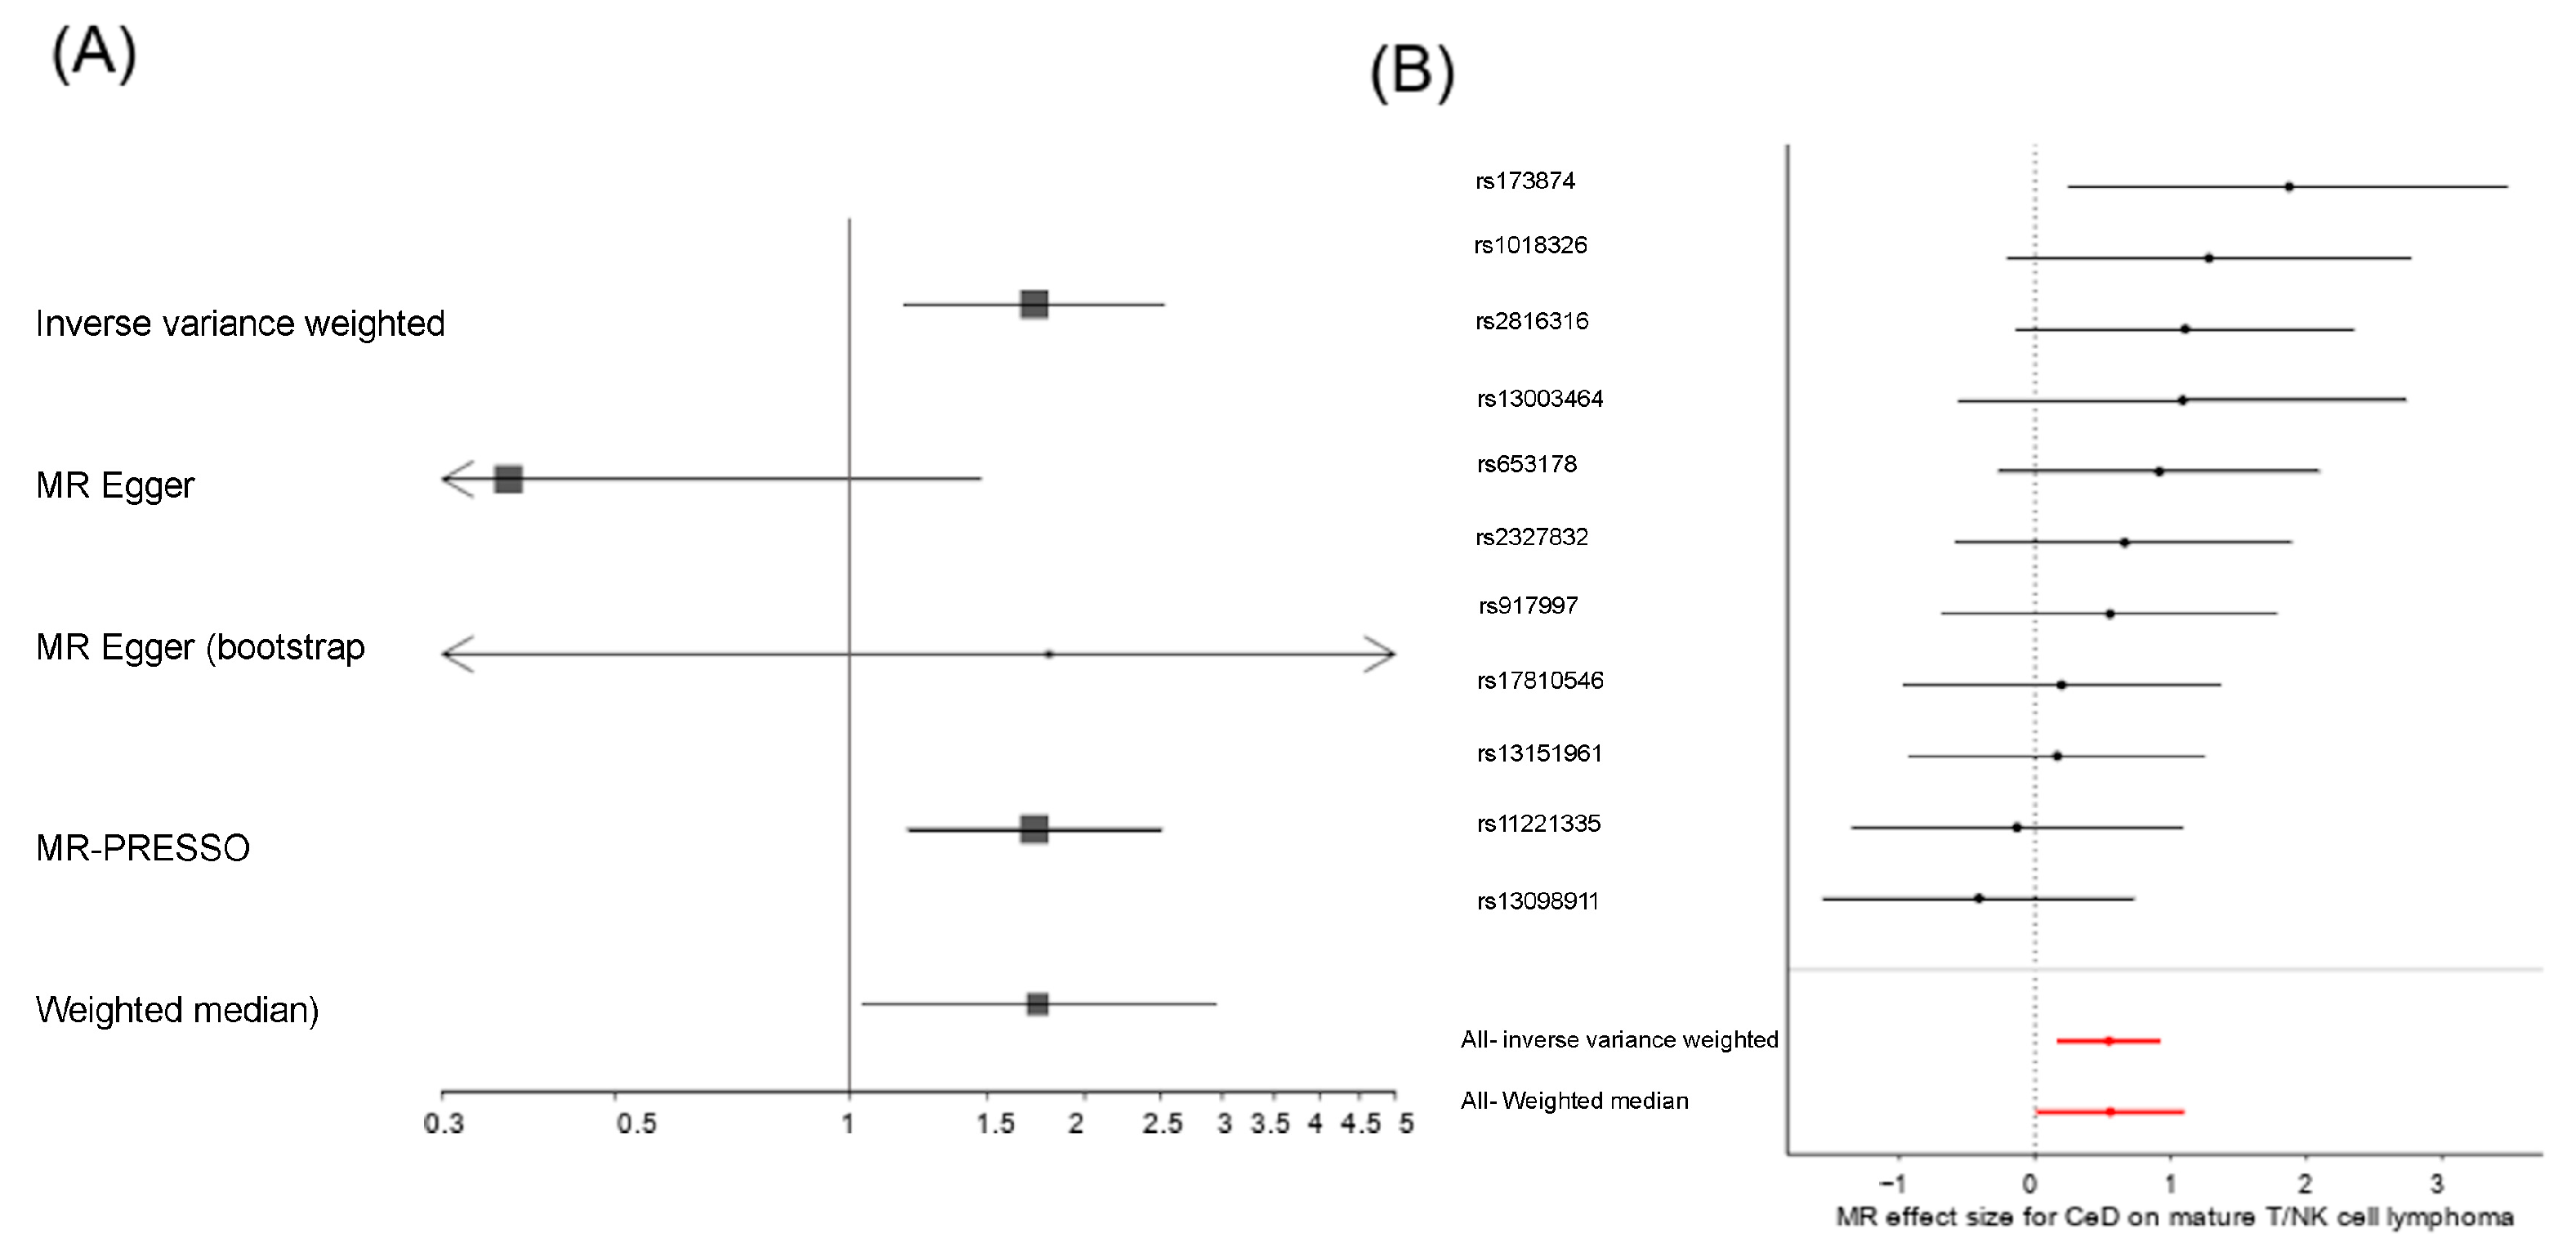
2.2. Celiac Disease Is a Risk Factor for the Development of Mature T and NK Cell Lymphoma
2.3. Celiac Disease Is Independent of Other Mature T and NK Cell Lymphoma Risk Factors
2.4. Celiac Disease-Associated T Cell Activation Is Linked with Mature T and NK Cell Lymphoma
3. Discussion
4. Materials and Methods
4.1. Genome-Wide Association Studies
4.2. Mendelian Randomization Analysis
4.3. Sensitivity Analysis
4.4. Multivariable Mendelian Randomization Analysis
4.5. Functional Effect of the IVs
Supplementary Materials
Author Contributions
Funding
Institutional Review Board Statement
Informed Consent Statement
Data Availability Statement
Conflicts of Interest
References
- Lebwohl, B.; Sanders, D.S.; Green, P.H.R. Coeliac disease. Lancet 2018, 391, 70–81. [Google Scholar] [CrossRef] [PubMed]
- Singh, P.; Arora, A.; Strand, T.A.; Leffler, D.A.; Catassi, C.; Green, P.H.; Kelly, C.P.; Ahuja, V.; Makharia, G.K. Global Prevalence of Celiac Disease: Systematic Review and Meta-Analysis. Clin. Gastroenterol. Hepatol. 2018, 16, 823–836.e2. [Google Scholar] [CrossRef] [PubMed]
- Gatti, S.; Lionetti, E.; Balanzoni, L.; Verma, A.K.; Galeazzi, T.; Gesuita, R.; Scattolo, N.; Cinquetti, M.; Fasano, A.; Catassi, C.; et al. Increased Prevalence of Celiac Disease in School-Age Children in Italy. Clin. Gastroenterol. Hepatol. 2020, 18, 596–603. [Google Scholar] [CrossRef] [PubMed]
- King, J.A.; Jeong, J.; Underwood, F.E.; Quan, J.; Panaccione, N.; Windsor, J.W.; Coward, S.; deBruyn, J.; Ronksley, P.E.; Shaheen, A.-A.; et al. Incidence of Celiac Disease Is Increasing Over Time: A Systematic Review and Meta-Analysis. Am. J. Gastroenterol. 2020, 115, 507–525. [Google Scholar] [CrossRef]
- Jabri, B.; Sollid, L.M. T Cells in Celiac Disease. J. Immunol. 2017, 198, 3005–3014. [Google Scholar] [CrossRef]
- Iversen, R.; Roy, B.; Stamnaes, J.; Høydahl, L.S.; Hnida, K.; Neumann, R.S.; Korponay-Szabó, I.R.; Lundin, K.E.A.; Sollid, L.M. Efficient T Cell-B Cell Collaboration Guides Autoantibody Epitope Bias and Onset of Celiac Disease. Proc. Natl. Acad. Sci. USA 2019, 116, 15134–15139. [Google Scholar] [CrossRef]
- Høydahl, L.S.; Richter, L.; Frick, R.; Snir, O.; Gunnarsen, K.S.; Landsverk, O.J.B.; Iversen, R.; Jeliazkov, J.R.; Gray, J.J.; Bergseng, E.; et al. Plasma Cells Are the Most Abundant Gluten Peptide MHC-Expressing Cells in Inflamed Intestinal Tissues From Patients With Celiac Disease. Gastroenterology 2019, 156, 1428–1439.e10. [Google Scholar] [CrossRef]
- Leonard, M.M.; Silvester, J.A.; Leffler, D.; Fasano, A.; Kelly, C.P.; Lewis, S.K.; Goldsmith, J.D.; Greenblatt, E.; Kwok, W.W.; McAuliffe, W.J.; et al. Evaluating Responses to Gluten Challenge: A Randomized, Double-Blind, 2-Dose Gluten Challenge Trial. Gastroenterology 2021, 160, 720–733.e8. [Google Scholar] [CrossRef]
- Catassi, C.; Verdu, E.F.; Bai, J.C.; Lionetti, E. Coeliac Disease. Lancet 2022, 399, 2413–2426. [Google Scholar] [CrossRef]
- Lebwohl, B.; Green, P.H.R.; Emilsson, L.; Mårild, K.; Söderling, J.; Roelstraete, B.; Ludvigsson, J.F. Cancer Risk in 47,241 Individuals With Celiac Disease: A Nationwide Cohort Study. Clin. Gastroenterol. Hepatol. 2022, 20, e111–e131. [Google Scholar] [CrossRef]
- Emilsson, L.; Semrad, C.; Lebwohl, B.; Green, P.H.R.; Ludvigsson, J.F. Risk of Small Bowel Adenocarcinoma, Adenomas, and Carcinoids in a Nationwide Cohort of Individuals with Celiac Disease. Gastroenterology 2020, 159, 1686–1694.e2. [Google Scholar] [CrossRef] [PubMed]
- Caio, G.; Volta, U.; Ursini, F.; Manfredini, R.; De Giorgio, R. Small bowel adenocarcinoma as a complication of celiac disease: Clinical and diagnostic features. BMC Gastroenterol. 2019, 19, 45. [Google Scholar] [CrossRef] [PubMed]
- Nijeboer, P.; de Baaij, L.R.; Visser, O.; Witte, B.I.; Cillessen, S.A.G.M.; Mulder, C.J.; Bouma, G. Treatment Response in Enteropathy Associated T-Cell Lymphoma; Survival in a Large Multicenter Cohort. Am. J. Hematol. 2015, 90, 493–498. [Google Scholar] [CrossRef] [PubMed]
- Lebwohl, B.; Green, P.H.R.; Söderling, J.; Roelstraete, B.; Ludvigsson, J.F. Association Between Celiac Disease and Mortality Risk in a Swedish Population. JAMA 2020, 323, 1277–1285. [Google Scholar] [CrossRef]
- Al-Toma, A.; Goerres, M.S.; Meijer, J.W.R.; Peña, A.S.; Crusius, J.B.A.; Mulder, C.J.J. Human Leukocyte Antigen-DQ2 Homozygosity and the Development of Refractory Celiac Disease and Enteropathy-Associated T-Cell Lymphoma. Clin. Gastroenterol. Hepatol. 2006, 4, 315–319. [Google Scholar] [CrossRef]
- Biagi, F.; Bianchi, P.I.; Vattiato, C.; Marchese, A.; Trotta, L.; Badulli, C.; De Silvestri, A.; Martinetti, M.; Corazza, G.R. Influence of HLA-DQ2 and DQ8 on Severity in Celiac Disease. J. Clin. Gastroenterol. 2012, 46, 46–50. [Google Scholar] [CrossRef]
- Frommer, L.; Kahaly, G.J. Type 1 Diabetes and Autoimmune Thyroid Disease-The Genetic Link. Front. Endocrinol. 2021, 12, 618213. [Google Scholar] [CrossRef]
- Dubois, P.C.A.; Trynka, G.; Franke, L.; Hunt, K.A.; Romanos, J.; Curtotti, A.; Zhernakova, A.; Heap, G.A.R.; Adány, R.; Aromaa, A.; et al. Multiple Common Variants for Celiac Disease Influencing Immune Gene Expression. Nat. Genet. 2010, 42, 295–302. [Google Scholar] [CrossRef]
- Ricaño-Ponce, I.; Gutierrez-Achury, J.; Costa, A.F.; Deelen, P.; Kurilshikov, A.; Zorro, M.M.; Platteel, M.; van der Graaf, A.; Consortium for the study of genetic associations of celiac disease in Latin-America; Sanna, S.; et al. Immunochip Meta-Analysis in European and Argentinian Populations Identifies Two Novel Genetic Loci Associated with Celiac Disease. Eur. J. Hum. Genet. 2020, 28, 313–323. [Google Scholar] [CrossRef]
- Verdu, E.F.; Schuppan, D. Co-factors, Microbes, and Immunogenetics in Celiac Disease to Guide Novel Approaches for Diagnosis and Treatment. Gastroenterology 2021, 161, 1395–1411.e4. [Google Scholar] [CrossRef]
- Burgess, S.; Butterworth, A.; Thompson, S.G. Mendelian randomization analysis with multiple genetic variants using summarized data. Genet. Epidemiol. 2013, 37, 658–665. [Google Scholar] [CrossRef] [PubMed]
- Bowden, J.; Davey Smith, G.; Burgess, S. Mendelian randomization with invalid instruments: Effect estimation and bias detection through Egger regression. Int. J. Epidemiol. 2015, 44, 512–525. [Google Scholar] [CrossRef]
- Smith, G.D.; Ebrahim, S. ‘Mendelian randomization’: Can genetic epidemiology contribute to understanding environmental determinants of disease? Int. J. Epidemiol. 2003, 32, 1–22. [Google Scholar] [CrossRef] [PubMed]
- Hartwig, F.P.; Davies, N.M.; Hemani, G.; Davey Smith, G. Two-sample Mendelian randomization: Avoiding the downsides of a powerful, widely applicable but potentially fallible technique. Int. J. Epidemiol. 2016, 45, 1717–1726. [Google Scholar] [CrossRef] [PubMed]
- Loos, R.J.F. 15 years of genome-wide association studies and no signs of slowing down. Nat. Commun. 2020, 11, 5900. [Google Scholar] [CrossRef]
- Hemani, G.; Zheng, J.; Elsworth, B.; Wade, K.H.; Haberland, V.; Baird, D.; Laurin, C.; Burgess, S.; Bowden, J.; Langdon, R.; et al. The MR-Base Platform Supports Systematic Causal Inference across the Human Phenome. Elife 2018, 7, e34408. [Google Scholar] [CrossRef]
- Buniello, A.; MacArthur, J.A.L.; Cerezo, M.; Harris, L.W.; Hayhurst, J.; Malangone, C.; McMahon, A.; Morales, J.; Mountjoy, E.; Sollis, E.; et al. The NHGRI-EBI GWAS Catalog of Published Genome-Wide Association Studies, Targeted Arrays and Summary Statistics 2019. Nucleic Acids Res. 2019, 47, D1005–D1012. [Google Scholar] [CrossRef]
- Liu, D.; Meng, X.; Tian, Q.; Cao, W.; Fan, X.; Wu, L.; Song, M.; Meng, Q.; Wang, W.; Wang, Y. Vitamin D and Multiple Health Outcomes: An Umbrella Review of Observational Studies, Randomized Controlled Trials, and Mendelian Randomization Studies. Adv. Nutr. 2022, 13, 1044–1062. [Google Scholar] [CrossRef]
- Guo, J.-Z.; Wu, Q.-J.; Liu, F.-H.; Gao, C.; Gong, T.-T.; Li, G. Review of Mendelian Randomization Studies on Endometrial Cancer. Front. Endocrinol. 2022, 13, 783150. [Google Scholar] [CrossRef]
- Giaccherini, M.; Gentiluomo, M.; Fornili, M.; Lucenteforte, E.; Baglietto, L.; Campa, D. Association between Telomere Length and Mitochondrial Copy Number and Cancer Risk in Humans: A Meta-Analysis on More than 300,000 Individuals. Crit. Rev. Oncol. Hematol. 2021, 167, 103510. [Google Scholar] [CrossRef]
- Bennett, D.A.; Du, H. An Overview of Methods and Exemplars of the Use of Mendelian Randomisation in Nutritional Research. Nutrients 2022, 14, 3408. [Google Scholar] [CrossRef] [PubMed]
- Ademi, Z.; Morton, J.I.; Liew, D.; Nicholls, S.J.; Zoungas, S.; Ference, B.A. Integrating the Biology of Cardiovascular Disease into the Epidemiology of Economic Decision Modelling via Mendelian Randomisation. Pharmacoeconomics 2022, 40, 1033–1042. [Google Scholar] [CrossRef] [PubMed]
- Lamina, C. Mendelian Randomization: Principles and its usage in Lp(a) research. Atherosclerosis 2022, 349, 36–41. [Google Scholar] [CrossRef] [PubMed]
- Goris, A.; Vandebergh, M.; McCauley, J.L.; Saarela, J.; Cotsapas, C. Genetics of multiple sclerosis: Lessons from polygenicity. Lancet Neurol. 2022, 21, 830–842. [Google Scholar] [CrossRef]
- Vandebergh, M.; Degryse, N.; Dubois, B.; Goris, A. Environmental risk factors in multiple sclerosis: Bridging Mendelian randomization and observational studies. J. Neurol. 2022, 269, 4565–4574. [Google Scholar] [CrossRef]
- Choi, H.K.; McCormick, N.; Yokose, C. Excess comorbidities in gout: The causal paradigm and pleiotropic approaches to care. Nat. Rev. Rheumatol. 2022, 18, 97–111. [Google Scholar] [CrossRef]
- Tang, B.; Shi, H.; Alfredsson, L.; Klareskog, L.; Padyukov, L.; Jiang, X. Obesity-Related Traits and the Development of Rheumatoid Arthritis: Evidence From Genetic Data. Arthritis Rheumatol. 2021, 73, 203–211. [Google Scholar] [CrossRef]
- Zhang, Y.-R.; Xu, W.; Zhang, W.; Wang, H.-F.; Ou, Y.-N.; Qu, Y.; Shen, X.-N.; Chen, S.-D.; Wu, K.-M.; Zhao, Q.-H.; et al. Modifiable Risk Factors for Incident Dementia and Cognitive Impairment: An Umbrella Review of Evidence. J. Affect. Disord. 2022, 314, 160–167. [Google Scholar] [CrossRef]
- Julian, T.H.; Boddy, S.; Islam, M.; Kurz, J.; Whittaker, K.J.; Moll, T.; Harvey, C.; Zhang, S.; Snyder, M.P.; McDermott, C.; et al. A Review of Mendelian Randomization in Amyotrophic Lateral Sclerosis. Brain 2022, 145, 832–842. [Google Scholar] [CrossRef]
- Pierce, B.L.; Ahsan, H.; Vanderweele, T.J. Power and instrument strength requirements for Mendelian randomization studies using multiple genetic variants. Int. J. Epidemiol. 2011, 40, 740–752. [Google Scholar] [CrossRef]
- Ingham, R.R.; Reagan, J.L.; Dalia, S.; Furman, M.; Merhi, B.; Nemr, S.; Zarrabi, A.; Mitri, J.; Castillo, J.J. The Relationship Between Obesity and Lymphoma: A Meta-Analysis of Prospective Cohort Studies. Blood 2011, 118, 5198. [Google Scholar] [CrossRef]
- Strongman, H.; Brown, A.; Smeeth, L.; Bhaskaran, K. Body mass index and Hodgkin’s lymphoma: UK population-based cohort study of 5.8 million individuals. Br. J. Cancer 2019, 120, 768–770. [Google Scholar] [CrossRef] [PubMed]
- Sergentanis, T.N.; Kanavidis, P.; Michelakos, T.; Petridou, E.T. Cigarette smoking and risk of lymphoma in adults: A comprehensive meta-analysis on Hodgkin and non-Hodgkin disease. Eur. J. Cancer Prev. 2013, 22, 131–150. [Google Scholar] [CrossRef] [PubMed]
- Kamper-Jørgensen, M.; Rostgaard, K.; Glaser, S.L.; Zahm, S.H.; Cozen, W.; Smedby, K.E.; Sanjosé, S.; Chang, E.T.; Zheng, T.; La Vecchia, C.; et al. Cigarette Smoking and Risk of Hodgkin Lymphoma and Its Subtypes: A Pooled Analysis from the International Lymphoma Epidemiology Consortium (InterLymph). Ann. Oncol. 2013, 24, 2245–2255. [Google Scholar] [CrossRef]
- Burgess, S.; Small, D.S.; Thompson, S.G. A review of instrumental variable estimators for Mendelian randomization. Stat. Methods Med. Res. 2017, 26, 2333–2355. [Google Scholar] [CrossRef]
- Karlsson, M.; Zhang, C.; Méar, L.; Zhong, W.; Digre, A.; Katona, B.; Sjöstedt, E.; Butler, L.; Odeberg, J.; Dusart, P.; et al. A Single-Cell Type Transcriptomics Map of Human Tissues. Sci. Adv. 2021, 7, eabh2169. [Google Scholar] [CrossRef]
- Ward, L.D.; Kellis, M. HaploReg: A resource for exploring chromatin states, conservation, and regulatory motif alterations within sets of genetically linked variants. Nucleic Acids Res. 2012, 40, D930–D934. [Google Scholar] [CrossRef]
- Oscanoa, J.; Sivapalan, L.; Gadaleta, E.; Dayem Ullah, A.Z.; Lemoine, N.R.; Chelala, C. SNPnexus: A Web Server for Functional Annotation of Human Genome Sequence Variation (2020 Update). Nucleic Acids Res. 2020, 48, W185–W192. [Google Scholar] [CrossRef]
- Balmain, A. Cancer as a complex genetic trait: Tumor susceptibility in humans and mouse models. Cell 2002, 108, 145–152. [Google Scholar] [CrossRef]
- He, M.-M.; Lo, C.-H.; Wang, K.; Polychronidis, G.; Wang, L.; Zhong, R.; Knudsen, M.D.; Fang, Z.; Song, M. Immune-Mediated Diseases Associated With Cancer Risks. JAMA Oncol. 2022, 8, 209–219. [Google Scholar] [CrossRef]
- Ge, F.; Huo, Z.; Li, C.; Wang, R.; Wang, R.; Liu, Y.; Chen, J.; Lu, Y.; Wen, Y.; Jiang, Y.; et al. Lung Cancer Risk in Patients with Multiple Sclerosis: A Mendelian Randomization Analysis. Mult. Scler. Relat. Disord. 2021, 51, 102927. [Google Scholar] [CrossRef] [PubMed]
- Wang, Z.; Chen, B.; Fu, Y.; Ou, C.; Rong, Q.; Kong, X.; Xu, W.; Deng, Y.; Jiang, M.; Xie, J. Eosinophilia and Lung Cancer: Analysis From Real-World Data and Mendelian Randomization Study. Front. Med. 2022, 9, 830754. [Google Scholar] [CrossRef] [PubMed]
- Bouras, E.; Karhunen, V.; Gill, D.; Huang, J.; Haycock, P.C.; Gunter, M.J.; Johansson, M.; Brennan, P.; Key, T.; Lewis, S.J.; et al. Circulating Inflammatory Cytokines and Risk of Five Cancers: A Mendelian Randomization Analysis. BMC Med. 2022, 20, 3. [Google Scholar] [CrossRef]
- Zhang, M.; Wang, Y.; Wang, Y.; Bai, Y.; Gu, D. Association Between Systemic Lupus Erythematosus and Cancer Morbidity and Mortality: Findings From Cohort Studies. Front. Oncol. 2022, 12, 860794. [Google Scholar] [CrossRef]
- Lek, M.; Karczewski, K.J.; Minikel, E.V.; Samocha, K.E.; Banks, E.; Fennell, T.; O’Donnell-Luria, A.H.; Ware, J.S.; Hill, A.J.; Cummings, B.B.; et al. Analysis of Protein-Coding Genetic Variation in 60,706 Humans. Nature 2016, 536, 285–291. [Google Scholar] [CrossRef] [PubMed]
- Ren, W.; Wang, X.; Yang, M.; Wan, H.; Li, X.; Ye, X.; Meng, B.; Li, W.; Yu, J.; Lei, M.; et al. Distinct Clinical and Genetic Features of Hepatitis B Virus-Associated Follicular Lymphoma in Chinese Patients. Blood Adv. 2022, 6, 2731–2744. [Google Scholar] [CrossRef] [PubMed]
- Huang, S.-Q.; Zhang, N.; Zhou, Z.-X.; Huang, C.-C.; Zeng, C.-L.; Xiao, D.; Guo, C.-C.; Han, Y.-J.; Ye, X.-H.; Ye, X.-G.; et al. Association of LPP and TAGAP Polymorphisms with Celiac Disease Risk: A Meta-Analysis. Int. J. Environ. Res. Public Health 2017, 14. [Google Scholar] [CrossRef]
- Liu, J.Z.; van Sommeren, S.; Huang, H.; Ng, S.C.; Alberts, R.; Takahashi, A.; Ripke, S.; Lee, J.C.; Jostins, L.; Shah, T.; et al. Association Analyses Identify 38 Susceptibility Loci for Inflammatory Bowel Disease and Highlight Shared Genetic Risk across Populations. Nat. Genet. 2015, 47, 979–986. [Google Scholar] [CrossRef]
- de Lange, K.M.; Moutsianas, L.; Lee, J.C.; Lamb, C.A.; Luo, Y.; Kennedy, N.A.; Jostins, L.; Rice, D.L.; Gutierrez-Achury, J.; Ji, S.-G.; et al. Genome-Wide Association Study Implicates Immune Activation of Multiple Integrin Genes in Inflammatory Bowel Disease. Nat. Genet. 2017, 49, 256–261. [Google Scholar] [CrossRef]
- Ferreira, M.A.; Vonk, J.M.; Baurecht, H.; Marenholz, I.; Tian, C.; Hoffman, J.D.; Helmer, Q.; Tillander, A.; Ullemar, V.; van Dongen, J.; et al. Shared Genetic Origin of Asthma, Hay Fever and Eczema Elucidates Allergic Disease Biology. Nat. Genet. 2017, 49, 1752–1757. [Google Scholar] [CrossRef]
- Ferreira, M.A.R.; Mathur, R.; Vonk, J.M.; Szwajda, A.; Brumpton, B.; Granell, R.; Brew, B.K.; Ullemar, V.; Lu, Y.; Jiang, Y.; et al. Genetic Architectures of Childhood- and Adult-Onset Asthma Are Partly Distinct. Am. J. Hum. Genet. 2019, 104, 665–684. [Google Scholar] [CrossRef] [PubMed]
- International Multiple Sclerosis Genetics Consortium (IMSGC); Beecham, A.H.; Patsopoulos, N.A.; Xifara, D.K.; Davis, M.F.; Kemppinen, A.; Cotsapas, C.; Shah, T.S.; Spencer, C.; Booth, D.; et al. Analysis of Immune-Related Loci Identifies 48 New Susceptibility Variants for Multiple Sclerosis. Nat. Genet. 2013, 45, 1353–1360. [Google Scholar] [PubMed]
- Stahl, E.A.; Raychaudhuri, S.; Remmers, E.F.; Xie, G.; Eyre, S.; Thomson, B.P.; Li, Y.; Kurreeman, F.A.S.; Zhernakova, A.; Hinks, A.; et al. Genome-Wide Association Study Meta-Analysis Identifies Seven New Rheumatoid Arthritis Risk Loci. Nat. Genet. 2010, 42, 508–514. [Google Scholar] [CrossRef] [PubMed]
- Gutierrez-Achury, J.; Zorro, M.M.; Ricaño-Ponce, I.; Zhernakova, D.V.; Coeliac Disease Immunochip Consortium, RACI Consortium; Diogo, D.; Raychaudhuri, S.; Franke, L.; Trynka, G.; Wijmenga, C.; et al. Functional Implications of Disease-Specific Variants in Loci Jointly Associated with Coeliac Disease and Rheumatoid Arthritis. Hum. Mol. Genet. 2016, 25, 180–190. [Google Scholar] [CrossRef] [PubMed]
- Forgetta, V.; Manousaki, D.; Istomine, R.; Ross, S.; Tessier, M.-C.; Marchand, L.; Li, M.; Qu, H.-Q.; Bradfield, J.P.; Grant, S.F.A.; et al. Rare Genetic Variants of Large Effect Influence Risk of Type 1 Diabetes. Diabetes 2020, 69, 784–795. [Google Scholar] [CrossRef]
- Chiou, J.; Geusz, R.J.; Okino, M.-L.; Han, J.Y.; Miller, M.; Melton, R.; Beebe, E.; Benaglio, P.; Huang, S.; Korgaonkar, K.; et al. Interpreting Type 1 Diabetes Risk with Genetics and Single-Cell Epigenomics. Nature 2021, 594, 398–402. [Google Scholar] [CrossRef]
- Inshaw, J.R.J.; Sidore, C.; Cucca, F.; Stefana, M.I.; Crouch, D.J.M.; McCarthy, M.I.; Mahajan, A.; Todd, J.A. Analysis of Overlapping Genetic Association in Type 1 and Type 2 Diabetes. Diabetologia 2021, 64, 1342–1347. [Google Scholar] [CrossRef]
- Stanford, S.M.; Bottini, N. PTPN22: The Archetypal Non-HLA Autoimmunity Gene. Nat. Rev. Rheumatol. 2014, 10, 602–611. [Google Scholar] [CrossRef]
- Tamehiro, N.; Nishida, K.; Yanobu-Takanashi, R.; Goto, M.; Okamura, T.; Suzuki, H. T-Cell Activation RhoGTPase-Activating Protein Plays an Important Role in T17-Cell Differentiation. Immunol. Cell Biol. 2017, 95, 729–735. [Google Scholar] [CrossRef]
- Galatola, M.; Cielo, D.; Panico, C.; Stellato, P.; Malamisura, B.; Carbone, L.; Gianfrani, C.; Troncone, R.; Greco, L.; Auricchio, R. Presymptomatic Diagnosis of Celiac Disease in Predisposed Children: The Role of Gene Expression Profile. J. Pediatr. Gastroenterol. Nutr. 2017, 65, 314–320. [Google Scholar] [CrossRef]
- Arshad, M.; Bhatti, A.; John, P.; Jalil, F.; Borghese, F.; Kawalkowska, J.Z.; Williams, R.O.; Clanchy, F.I.L. T Cell Activation Rho GTPase Activating Protein (TAGAP) Is Upregulated in Clinical and Experimental Arthritis. Cytokine 2018, 104, 130–135. [Google Scholar] [CrossRef] [PubMed]
- Connelly, T.M.; Berg, A.S.; Harris, L.R., 3rd; Hegarty, J.P.; Ruggiero, F.M.; Deiling, S.M.; Brinton, D.L.; Koltun, W.A. T-Cell Activation Rho GTPase-Activating Protein Expression Varies with Inflammation Location and Severity in Crohn’s Disease. J. Surg. Res. 2014, 190, 457–464. [Google Scholar] [CrossRef] [PubMed]
- Chen, J.; He, R.; Sun, W.; Gao, R.; Peng, Q.; Zhu, L.; Du, Y.; Ma, X.; Guo, X.; Zhang, H.; et al. TAGAP Instructs Th17 Differentiation by Bridging Dectin Activation to EPHB2 Signaling in Innate Antifungal Response. Nat. Commun. 2020, 11, 1913. [Google Scholar] [CrossRef] [PubMed]
- Cerqueira, J.X.M.; Saavalainen, P.; Kurppa, K.; Laurikka, P.; Huhtala, H.; Nykter, M.; L E Koskinen, L.; Yohannes, D.A.; Kilpeläinen, E.; Shcherban, A.; et al. Independent and Cumulative Coeliac Disease-Susceptibility Loci Are Associated with Distinct Disease Phenotypes. J. Hum. Genet. 2021, 66, 613–623. [Google Scholar] [CrossRef]
- Westra, H.-J.; Peters, M.J.; Esko, T.; Yaghootkar, H.; Schurmann, C.; Kettunen, J.; Christiansen, M.W.; Fairfax, B.P.; Schramm, K.; Powell, J.E.; et al. Systematic Identification of Trans eQTLs as Putative Drivers of Known Disease Associations. Nat. Genet. 2013, 45, 1238–1243. [Google Scholar] [CrossRef]
- Green, P.H.R.; Fleischauer, A.T.; Bhagat, G.; Goyal, R.; Jabri, B.; Neugut, A.I. Risk of Malignancy in Patients with Celiac Disease. Am. J. Med. 2003, 115, 191–195. [Google Scholar] [CrossRef]
- 1000 Genomes Project Consortium. A global reference for human genetic variation. Nature 2015, 526, 68–74. [Google Scholar] [CrossRef]
- Elsworth, B.; Lyon, M.; Alexander, T.; Liu, Y.; Matthews, P.; Hallett, J.; Bates, P.; Palmer, T.; Haberland, V.; Smith, G.D.; et al. The MRC IEU OpenGWAS Data Infrastructure. bioRxiv 2020. [Google Scholar] [CrossRef]
- Kurki, M.I.; Karjalainen, J.; Palta, P.; Sipilä, T.P.; Kristiansson, K.; Donner, K.; Reeve, M.P.; Laivuori, H.; Aavikko, M.; Kaunisto, M.A.; et al. FinnGen: Unique genetic insights from combining isolated population and national health register data. MedRxiv 2022. [Google Scholar] [CrossRef]
- Verbanck, M.; Chen, C.-Y.; Neale, B.; Do, R. Publisher Correction: Detection of widespread horizontal pleiotropy in causal relationships inferred from Mendelian randomization between complex traits and diseases. Nat. Genet. 2018, 50, 1196. [Google Scholar] [CrossRef]
- Bowden, J.; Davey Smith, G.; Haycock, P.C.; Burgess, S. Consistent Estimation in Mendelian Randomization with Some Invalid Instruments Using a Weighted Median Estimator. Genet. Epidemiol. 2016, 40, 304–314. [Google Scholar] [CrossRef] [PubMed]
- Benjamini, Y.; Hochberg, Y. Controlling the false discovery rate: A practical and powerful approach to multiple testing. J. R. Stat. Soc. 1995, 57, 289–300. [Google Scholar] [CrossRef]
- Brion, M.-J.A.; Shakhbazov, K.; Visscher, P.M. Calculating statistical power in Mendelian randomization studies. Int. J. Epidemiol. 2013, 42, 1497–1501. [Google Scholar] [CrossRef] [PubMed]
- Kamat, M.A.; Blackshaw, J.A.; Young, R.; Surendran, P.; Burgess, S.; Danesh, J.; Butterworth, A.S.; Staley, J.R. PhenoScanner V2: An Expanded Tool for Searching Human Genotype-Phenotype Associations. Bioinformatics 2019, 35, 4851–4853. [Google Scholar] [CrossRef]
- Burgess, S.; Thompson, S.G. Multivariable Mendelian randomization: The use of pleiotropic genetic variants to estimate causal effects. Am. J. Epidemiol. 2015, 181, 251–260. [Google Scholar] [CrossRef]
- Pulit, S.L.; Stoneman, C.; Morris, A.P.; Wood, A.R.; Glastonbury, C.A.; Tyrrell, J.; Yengo, L.; Ferreira, T.; Marouli, E.; Ji, Y.; et al. Meta-analysis of genome-wide association studies for body fat distribution in 694,649 individuals of European ancestry. Hum. Mol. Genet. 2019, 18, 166–174. [Google Scholar] [CrossRef]
- GTEx Consortium. The Genotype-Tissue Expression (GTEx) project. Nat. Genet. 2013, 45, 580–585. [Google Scholar] [CrossRef]
- ENCODE Project Consortium. An integrated encyclopedia of DNA elements in the human genome. Nature 2012, 489, 57–74. [Google Scholar] [CrossRef]
- Luo, Y.; Hitz, B.C.; Gabdank, I.; Hilton, J.A.; Kagda, M.S.; Lam, B.; Myers, Z.; Sud, P.; Jou, J.; Lin, K.; et al. New Developments on the Encyclopedia of DNA Elements (ENCODE) Data Portal. Nucleic Acids Res. 2020, 48, D882–D889. [Google Scholar] [CrossRef]


| Outcome | SNP | Chr | Position (bp) | Effect Allele | Other Allele | Beta Exposure | Pval Exposure | Beta Outcome | Pval Outcome | Eaf Outcome |
|---|---|---|---|---|---|---|---|---|---|---|
| Diffuse large B-cell lymphoma | rs1018326 | 2 | 182,007,800 | C | T | 0.1519 | 3.78 × 10⁻⁹ | 5.00 × 10⁻⁴ | 9.96 × 10⁻¹ | 0.4994 |
| rs11221335 | 11 | 128,385,906 | C | T | 0.2175 | 4.16 × 10⁻¹¹ | −3.88 × 10⁻² | 7.38 × 10⁻¹ | 0.2342 | |
| rs13003464 | 2 | 61,186,829 | G | A | 0.1415 | 4.92 × 10⁻⁸ | −3.34 × 10⁻² | 7.42 × 10⁻¹ | 0.3696 | |
| rs13098911 | 3 | 46,235,201 | T | C | 0.2784 | 2.53 × 10⁻¹¹ | 9.46 × 10⁻² | 4.98 × 10⁻¹ | 0.1461 | |
| rs13151961 | 4 | 123,115,502 | G | A | −0.3239 | 6.31 × 10⁻¹⁸ | 1.99 × 10⁻¹ | 1.95 × 10⁻¹ | 0.1145 | |
| rs1738074 | 6 | 159,465,977 | C | T | −0.1424 | 3.14 × 10⁻⁸ | −6.17 × 10⁻² | 5.36 × 10⁻¹ | 0.5824 | |
| rs17810546 | 3 | 159,665,050 | G | A | 0.3235 | 4.56 × 10⁻¹⁸ | −1.61 × 10⁻¹ | 3.25 × 10⁻¹ | 0.09909 | |
| rs2327832 (rs6920220) | 6 | 138,006,504 | G | A | 0.2319 | 1.41 × 10⁻¹⁴ | −1.02 × 10⁻¹ | 4.11 × 10⁻¹ | 0.1888 | |
| rs2816316 | 1 | 192,536,813 | A | C | 0.2544 | 1.45 × 10⁻¹² | 2.00 × 10⁻¹ | 1.47 × 10⁻¹ | 0.8538 | |
| rs653178 | 12 | 112,007,756 | T | C | −0.1923 | 6.03 × 10⁻¹⁴ | 1.54 × 10⁻¹ | 1.22 × 10⁻¹ | 0.584 | |
| rs917997 | 2 | 103,070,568 | C | T | −0.2319 | 5.97 × 10⁻¹⁵ | 3.00 × 10⁻² | 8.09 × 10⁻¹ | 0.8084 | |
| Follicular lymphoma | rs1018326 | 2 | 182,007,800 | C | T | 0.1519 | 3.78 × 10⁻⁹ | −3.07 × 10⁻² | 6.22 × 10⁻¹ | 0.4994 |
| rs11221335 | 11 | 128,385,906 | C | T | 0.2175 | 4.16 × 10⁻¹¹ | −1.26 × 10⁻² | 8.64 × 10⁻¹ | 0.2342 | |
| rs13003464 | 2 | 61,186,829 | G | A | 0.1415 | 4.92 × 10⁻⁸ | 7.02 × 10⁻² | 2.74 × 10⁻¹ | 0.3696 | |
| rs13098911 | 3 | 46,235,201 | T | C | 0.2784 | 2.53 × 10⁻¹¹ | −7.04 × 10⁻² | 4.25 × 10⁻¹ | 0.1461 | |
| rs13151961 | 4 | 123,115,502 | G | A | −0.3239 | 6.31 × 10⁻¹⁸ | −1.03 × 10⁻¹ | 2.93 × 10⁻¹ | 0.1145 | |
| rs1738074 | 6 | 159,465,977 | C | T | −0.1424 | 3.14 × 10⁻⁸ | −1.77× 10⁻² | 7.79 × 10⁻¹ | 0.5824 | |
| rs17810546 | 3 | 159,665,050 | G | A | 0.3235 | 4.56 × 10⁻¹⁸ | −1.01 × 10⁻¹ | 3.30 × 10⁻¹ | 0.09909 | |
| rs2327832 (rs6920220) | 6 | 138,006,504 | G | A | 0.2319 | 1.41 × 10⁻¹⁴ | −7.97 × 10⁻² | 3.13 × 10⁻¹ | 0.1888 | |
| rs2816316 | 1 | 192,536,813 | A | C | 0.2544 | 1.45 × 10⁻¹² | −5.29 × 10⁻² | 5.46 × 10⁻¹ | 0.8538 | |
| rs653178 | 12 | 112,007,756 | T | C | −0.1923 | 6.03 × 10⁻¹⁴ | −6.25 × 10⁻² | 3.21 × 10⁻¹ | 0.584 | |
| rs917997 | 2 | 103,070,568 | C | T | −0.2319 | 5.97 × 10⁻¹⁵ | 5.11 × 10⁻² | 5.15 × 10⁻¹ | 0.8084 | |
| Hodgkin lymphoma | rs1018326 | 2 | 182,007,800 | C | T | 0.1519 | 3.78 × 10⁻⁹ | 8.30 × 10⁻³ | 9.11 × 10⁻¹ | 0.4994 |
| rs11221335 | 11 | 128,385,906 | C | T | 0.2175 | 4.16 × 10⁻¹¹ | 7.96 × 10⁻² | 3.61 × 10⁻¹ | 0.2342 | |
| rs13003464 | 2 | 61,186,829 | G | A | 0.1415 | 4.92 × 10⁻⁸ | 1.83 × 10⁻¹ | 1.70 × 10⁻² | 0.3696 | |
| rs13098911 | 3 | 46,235,201 | T | C | 0.2784 | 2.53 × 10⁻¹¹ | −1.14 × 10⁻¹ | 2.81 × 10⁻¹ | 0.1461 | |
| rs13151961 | 4 | 123,115,502 | G | A | −0.3239 | 6.31 × 10⁻¹⁸ | −7.82 × 10⁻² | 5.01 × 10⁻¹ | 0.1145 | |
| rs1738074 | 6 | 159,465,977 | C | T | −0.1424 | 3.14 × 10⁻⁸ | 2.11 × 10⁻² | 7.79 × 10⁻¹ | 0.5824 | |
| rs17810546 | 3 | 159,665,050 | G | A | 0.3235 | 4.56 × 10⁻¹⁸ | 4.27 × 10⁻² | 7.30 × 10⁻¹ | 0.09909 | |
| rs2327832 (rs6920220) | 6 | 138,006,504 | G | A | 0.2319 | 1.41 × 10⁻¹⁴ | −2.15 × 10⁻² | 8.19 × 10⁻¹ | 0.1888 | |
| rs2816316 | 1 | 192,536,813 | A | C | 0.2544 | 1.45 × 10⁻¹² | −7.50 × 10⁻³ | 9.43 × 10⁻¹ | 0.8538 | |
| rs653178 | 12 | 112,007,756 | T | C | −0.1923 | 6.03 × 10⁻¹⁴ | 4.56 × 10⁻² | 5.44 × 10⁻¹ | 0.584 | |
| rs917997 | 2 | 103,070,568 | C | T | −0.2319 | 5.97 × 10⁻¹⁵ | −6.82 × 10⁻² | 4.68 × 10⁻¹ | 0.8084 | |
| Non-follicular lymphoma | rs1018326 | 2 | 182,007,800 | C | T | 0.1519 | 3.78 × 10⁻⁹ | −3.43 × 10⁻² | 3.92 × 10⁻¹ | 0.4994 |
| rs11221335 | 11 | 128385906 | C | T | 0.2175 | 4.16 × 10⁻¹¹ | 4.88 × 10⁻² | 3.00 × 10⁻¹ | 0.2342 | |
| rs13003464 | 2 | 61,186,829 | G | A | 0.1415 | 4.92 × 10⁻⁸ | 5.75 × 10⁻² | 1.64 × 10⁻¹ | 0.3696 | |
| rs13098911 | 3 | 46,235,201 | T | C | 0.2784 | 2.53 × 10⁻¹¹ | −2.86 × 10⁻² | 6.15 × 10⁻¹ | 0.1461 | |
| rs13151961 | 4 | 123,115,502 | G | A | −0.3239 | 6.31 × 10⁻¹⁸ | −1.06 × 10⁻² | 8.66 × 10⁻¹ | 0.1145 | |
| rs1738074 | 6 | 159,465,977 | C | T | −0.1424 | 3.14 × 10⁻⁸ | −1.90 × 10⁻² | 6.40 × 10⁻¹ | 0.5824 | |
| rs17810546 | 3 | 159,665,050 | G | A | 0.3235 | 4.56 × 10⁻¹⁸ | 6.50 × 10⁻³ | 9.22 × 10⁻¹ | 0.09909 | |
| rs2327832 (rs6920220) | 6 | 138,006,504 | G | A | 0.2319 | 1.41 × 10⁻¹⁴ | −7.19 × 10⁻² | 1.57 × 10⁻¹ | 0.1888 | |
| rs2816316 | 1 | 192,536,813 | A | C | 0.2544 | 1.45 × 10⁻¹² | 6.84 × 10⁻² | 2.25 × 10⁻¹ | 0.8538 | |
| rs653178 | 12 | 112,007,756 | T | C | −0.1923 | 6.03 × 10⁻¹⁴ | 9.04 × 10⁻² | 2.58 × 10⁻¹ | 0.584 | |
| rs917997 | 2 | 103,070,568 | C | T | −0.2319 | 5.97 × 10⁻¹⁵ | 5.16 × 10⁻² | 3.09 × 10⁻¹ | 0.8084 | |
| Other and unspecified types of non-Hodgkin lymphoma | rs1018326 | 2 | 182,007,800 | C | T | 0.1519 | 3.78 × 10⁻⁹ | 2.00 × 10⁻³ | 9.74 × 10⁻¹ | 0.4994 |
| rs11221335 | 11 | 128,385,906 | C | T | 0.2175 | 4.16 × 10⁻¹¹ | 7.59 × 10⁻² | 2.97 × 10⁻¹ | 0.2342 | |
| rs13003464 | 2 | 61,186,829 | G | A | 0.1415 | 4.92 × 10⁻⁸ | 2.51 × 10⁻² | 6.93 × 10⁻¹ | 0.3696 | |
| rs13098911 | 3 | 46,235,201 | T | C | 0.2784 | 2.53 × 10⁻¹¹ | −3.00 × 10⁻² | 7.33 × 10⁻¹ | 0.1461 | |
| rs13151961 | 4 | 123,115,502 | G | A | −0.3239 | 6.31 × 10⁻¹⁸ | 2.40 × 10⁻³ | 9.80 × 10⁻¹ | 0.1145 | |
| rs1738074 | 6 | 159,465,977 | C | T | −0.1424 | 3.14 × 10⁻⁸ | −1.11 × 10⁻² | 8.60 × 10⁻¹ | 0.5824 | |
| rs17810546 | 3 | 159,665,050 | G | A | 0.3235 | 4.56 × 10⁻¹⁸ | −7.88 × 10⁻² | 4.43 × 10⁻¹ | 0.09909 | |
| rs2327832 (rs6920220) | 6 | 138,006,504 | G | A | 0.2319 | 1.41 × 10⁻¹⁴ | −6.06 × 10⁻² | 4.39 × 10⁻¹ | 0.1888 | |
| rs2816316 | 1 | 192,536,813 | A | C | 0.2544 | 1.45 × 10⁻¹² | 2.51 × 10⁻² | 7.72 × 10⁻¹ | 0.8538 | |
| rs653178 | 12 | 112,007,756 | T | C | −0.1923 | 6.03 × 10⁻¹⁴ | 5.10 × 10⁻² | 4.14 × 10⁻¹ | 0.584 | |
| rs917997 | 2 | 103,070,568 | C | T | −0.2319 | 5.97 × 10⁻¹⁵ | −2.91 × 10⁻² | 7.09 × 10⁻¹ | 0.8084 | |
| Mature T/NK-cell lymphomas | rs1018326 | 2 | 182,007,800 | C | T | 0.1519 | 3.78 × 10⁻⁹ | 1.95 × 10⁻¹ | 9.25 × 10⁻² | 0.4994 |
| rs11221335 | 11 | 128,385,906 | C | T | 0.2175 | 4.16 × 10⁻¹¹ | −2.89 × 10⁻² | 8.32 × 10⁻¹ | 0.2342 | |
| rs13003464 | 2 | 61,186,829 | G | A | 0.1415 | 4.92 × 10⁻⁸ | 1.54 × 10⁻¹ | 1.97 × 10⁻¹ | 0.3696 | |
| rs13098911 | 3 | 46,235,201 | T | C | 0.2784 | 2.53 × 10⁻¹¹ | −1.15 × 10⁻¹ | 4.86 × 10⁻¹ | 0.1461 | |
| rs13151961 | 4 | 123,115,502 | G | A | −0.3239 | 6.31 × 10⁻¹⁸ | −5.31 × 10⁻² | 7.69 × 10⁻¹ | 0.1145 | |
| rs1738074 | 6 | 159,465,977 | C | T | −0.1424 | 3.14 × 10⁻⁸ | −2.67 × 10⁻¹ | 2.33 × 10⁻² | 0.5824 | |
| rs17810546 | 3 | 159,665,050 | G | A | 0.3235 | 4.56 × 10⁻¹⁸ | 6.38 × 10⁻² | 7.40 × 10⁻¹ | 0.09909 | |
| rs2327832 (rs6920220) | 6 | 138,006,504 | G | A | 0.2319 | 1.41 × 10⁻¹⁴ | 1.53 × 10⁻¹ | 2.97 × 10⁻¹ | 0.1888 | |
| rs2816316 | 1 | 192,536,813 | A | C | 0.2544 | 1.45 × 10⁻¹² | 2.82 × 10⁻¹ | 8.31 × 10⁻² | 0.8538 | |
| rs653178 | 12 | 112,007,756 | T | C | −0.1923 | 6.03 × 10⁻¹⁴ | −1.76 × 10⁻¹ | 1.33 × 10⁻¹ | 0.584 | |
| rs917997 | 2 | 103,070,568 | C | T | −0.2319 | 5.97 × 10⁻¹⁵ | −1.28 × 10⁻¹ | 3.82 × 10⁻¹ | 0.8084 | |
| Lymphomas | rs1018326 | 2 | 182007800 | C | T | 0.1519 | 3.78 × 10⁻⁹ | −5.26 × 10⁻⁵ | 7.51 × 10⁻¹ | 0.42235 |
| rs11221335 | 11 | 128,385,906 | C | T | 0.2175 | 4.16 × 10⁻¹¹ | 2.47 × 10⁻⁴ | 2.17 × 10⁻¹ | 0.21227 | |
| rs13003464 | 2 | 61,186,829 | G | A | 0.1415 | 4.92 × 10⁻⁸ | 3.00 × 10⁻⁴ | 7.58 × 10⁻² | 0.37623 | |
| rs13098911 | 3 | 46,235,201 | T | C | 0.2784 | 2.53 × 10⁻¹¹ | −1.79 × 10⁻⁴ | 5.64 × 10⁻¹ | 0.07501 | |
| rs13151961 | 4 | 123,115,502 | G | A | −0.3239 | 6.31 × 10⁻¹⁸ | 8.67 × 10⁻⁵ | 6.87 × 10⁻¹ | 0.17478 | |
| rs1738074 | 6 | 159,465,977 | C | T | −0.1424 | 3.14 × 10⁻⁸ | 9.34 × 10⁻⁵ | 5.70 × 10⁻¹ | 0.56446 | |
| rs17810546 | 3 | 159,665,050 | G | A | 0.3235 | 4.56 × 10⁻¹⁸ | 1.99 × 10⁻⁴ | 4.22 × 10⁻¹ | 0.12335 | |
| rs2327832 | 6 | 137,973,068 | G | A | 0.2319 | 1.41 × 10⁻¹⁴ | 6.79 × 10⁻⁵ | 7.30 × 10⁻¹ | 0.22264 | |
| rs2816316 | 1 | 192,536,813 | A | C | 0.2544 | 1.45 × 10⁻¹² | −2.90 × 10⁻⁶ | 9.89 × 10⁻¹ | 0.81835 | |
| rs653178 | 12 | 112,007,756 | T | C | −0.1923 | 6.03 × 10⁻¹⁴ | 1.95 × 10⁻⁴ | 2.34 × 10⁻¹ | 0.51724 | |
| rs917997 | 2 | 103,070,568 | C | T | −0.2319 | 5.97 × 10⁻¹⁵ | −1.54 × 10⁻⁴ | 4.33 × 10⁻¹ | 0.77549 | |
| Small intestine/small bowel cancer | rs1018326 | 2 | 182,007,800 | C | T | 0.1519 | 3.78 × 10⁻⁹ | −7.65 × 10⁻⁵ | 1.49 × 10⁻¹ | 0.42222 |
| rs11221335 | 11 | 128,385,906 | C | T | 0.2175 | 4.16 × 10⁻¹¹ | 2.71 × 10⁻⁵ | 6.72 × 10⁻¹ | 0.21196 | |
| rs13003464 | 2 | 61,186,829 | G | A | 0.1415 | 4.92 × 10⁻⁸ | −8.21 × 10⁻⁵ | 1.29 × 10⁻¹ | 0.37657 | |
| rs13098911 | 3 | 46,235,201 | T | C | 0.2784 | 2.53 × 10⁻¹¹ | 1.15 × 10⁻⁴ | 2.47 × 10⁻¹ | 0.07483 | |
| rs13151961 | 4 | 123,115,502 | G | A | −0.3239 | 6.31 × 10⁻¹⁸ | 2.26 × 10⁻⁵ | 7.43 × 10⁻¹ | 0.17515 | |
| rs1738074 | 6 | 159,465,977 | C | T | −0.1424 | 3.14 × 10⁻⁸ | −5.30 × 10⁻⁵ | 3.15 × 10⁻¹ | 0.56542 | |
| rs17810546 | 3 | 159,665,050 | G | A | 0.3235 | 4.56 × 10⁻¹⁸ | 1.73 × 10⁻⁴ | 2.96 × 10⁻² | 0.12339 | |
| rs2327832 | 6 | 137,973,068 | G | A | 0.2319 | 1.41 × 10⁻¹⁴ | −1.87 × 10⁻⁵ | 7.66 × 10⁻¹ | 0.22287 | |
| rs2816316 | 1 | 192,536,813 | A | C | 0.2544 | 1.45 × 10⁻¹² | −1.32 × 10⁻⁵ | 8.47 × 10⁻¹ | 0.81853 | |
| rs653178 | 12 | 112,007,756 | T | C | −0.1923 | 6.03 × 10⁻¹⁴ | 7.96 × 10⁻⁵ | 1.29 × 10⁻¹ | 0.51709 | |
| rs917997 | 2 | 103,070,568 | C | T | −0.2319 | 5.97 × 10⁻¹⁵ | −6.43 × 10⁻⁵ | 3.06 × 10⁻¹ | 0.77487 |
| Outcome | Method | Pval | OR | OR lCI95 | OR uCI95 |
|---|---|---|---|---|---|
| Lymphomas | MR-Egger | 9.70 × 10⁻¹ | 1.00 | 1.00 | 1.00 |
| Weighted median | 9.68 × 10⁻¹ | 1.00 | 1.00 | 1.00 | |
| Inverse variance weighted | 6.12 × 10⁻¹ | 1.00 | 1.00 | 1.00 | |
| MR-PRESSO | 5.86 × 10⁻¹ | 1.00 | 1.00 | 1.00 | |
| Diffuse large B-cell lymphoma | MR-Egger | 5.34 × 10⁻¹ | 0.68 | 0.21 | 2.21 |
| Weighted median | 3.45 × 10⁻¹ | 0.82 | 0.54 | 1.24 | |
| Inverse variance weighted | 3.34 × 10⁻¹ | 0.85 | 0.62 | 1.18 | |
| MR-PRESSO | 3.06 × 10⁻¹ | 0.85 | 0.64 | 1.14 | |
| Follicular lymphoma | MR-Egger | 3.52 × 10⁻¹ | 0.69 | 0.32 | 1.46 |
| Weighted median | 1.42 × 10⁻¹ | 0.81 | 0.62 | 1.07 | |
| Inverse variance weighted | 6.49 × 10⁻¹ | 0.95 | 0.78 | 1.17 | |
| MR-PRESSO | 5.93 × 10⁻¹ | 0.95 | 0.80 | 1.13 | |
| Hodgkin lymphoma | MR-Egger | 5.82 × 10⁻¹ | 0.77 | 0.31 | 1.89 |
| Weighted median | 7.15 × 10⁻¹ | 1.06 | 0.77 | 1.46 | |
| Inverse variance weighted | 4.66 × 10⁻¹ | 1.10 | 0.86 | 1.40 | |
| MR-PRESSO | 4.55 × 10⁻¹ | 1.10 | 0.87 | 1.38 | |
| Non-follicular lymphoma | MR-Egger | 8.30 × 10⁻¹ | 0.94 | 0.52 | 1.69 |
| Weighted median | 9.70 × 10⁻¹ | 1.00 | 0.82 | 1.20 | |
| Inverse variance weighted | 5.80 × 10⁻¹ | 0.96 | 0.82 | 1.12 | |
| MR-PRESSO | 5.92 × 10⁻¹ | 0.96 | 0.82 | 1.12 | |
| Other and unspecified types of non-Hodgkin lymphoma | MR-Egger | 6.02 × 10⁻¹ | 0.81 | 0.39 | 1.71 |
| Weighted median | 9.87 × 10⁻¹ | 1.00 | 0.77 | 1.30 | |
| Inverse variance weighted | 8.39 × 10⁻¹ | 0.98 | 0.80 | 1.20 | |
| MR-PRESSO | 7.36 × 10⁻¹ | 0.98 | 0.87 | 1.10 | |
| Mature T/NK-cell lymphomas | MR-Egger | 1.91 × 10⁻¹ | 0.36 | 0.09 | 1.48 |
| Weighted median | 4.12 × 10⁻² | 1.74 | 1.02 | 2.97 | |
| Inverse variance weighted | 5.32 × 10⁻³ | 1.72 | 1.18 | 2.53 | |
| MR-PRESSO | 1.79 × 10⁻² | 1.72 | 1.18 | 2.52 | |
| Small intestine/small bowel cancer | MR-Egger | 1.21 × 10⁻¹ | 1.00 | 1.00 | 1.00 |
| Weighted median | 6.46 × 10⁻¹ | 1.00 | 1.00 | 1.00 | |
| Inverse variance weighted | 8.35 × 10⁻¹ | 1.00 | 1.00 | 1.00 | |
| MR-PRESSO | 8.39 × 10⁻¹ | 1.00 | 1.00 | 1.00 |
Disclaimer/Publisher’s Note: The statements, opinions and data contained in all publications are solely those of the individual author(s) and contributor(s) and not of MDPI and/or the editor(s). MDPI and/or the editor(s) disclaim responsibility for any injury to people or property resulting from any ideas, methods, instructions or products referred to in the content. |
© 2023 by the authors. Licensee MDPI, Basel, Switzerland. This article is an open access article distributed under the terms and conditions of the Creative Commons Attribution (CC BY) license (https://creativecommons.org/licenses/by/4.0/).
Share and Cite
Martín-Masot, R.; Herrador-López, M.; Navas-López, V.M.; Carmona, F.D.; Nestares, T.; Bossini-Castillo, L. Celiac Disease Is a Risk Factor for Mature T and NK Cell Lymphoma: A Mendelian Randomization Study. Int. J. Mol. Sci. 2023, 24, 7216. https://doi.org/10.3390/ijms24087216
Martín-Masot R, Herrador-López M, Navas-López VM, Carmona FD, Nestares T, Bossini-Castillo L. Celiac Disease Is a Risk Factor for Mature T and NK Cell Lymphoma: A Mendelian Randomization Study. International Journal of Molecular Sciences. 2023; 24(8):7216. https://doi.org/10.3390/ijms24087216
Chicago/Turabian StyleMartín-Masot, Rafael, Marta Herrador-López, Víctor Manuel Navas-López, Francisco David Carmona, Teresa Nestares, and Lara Bossini-Castillo. 2023. "Celiac Disease Is a Risk Factor for Mature T and NK Cell Lymphoma: A Mendelian Randomization Study" International Journal of Molecular Sciences 24, no. 8: 7216. https://doi.org/10.3390/ijms24087216
APA StyleMartín-Masot, R., Herrador-López, M., Navas-López, V. M., Carmona, F. D., Nestares, T., & Bossini-Castillo, L. (2023). Celiac Disease Is a Risk Factor for Mature T and NK Cell Lymphoma: A Mendelian Randomization Study. International Journal of Molecular Sciences, 24(8), 7216. https://doi.org/10.3390/ijms24087216