
Integrated Analyses of Single-Cell Transcriptome and Mendelian Randomization Reveal the Protective Role of Resistin in Sepsis Survival in Intensive Care Unit

Abstract
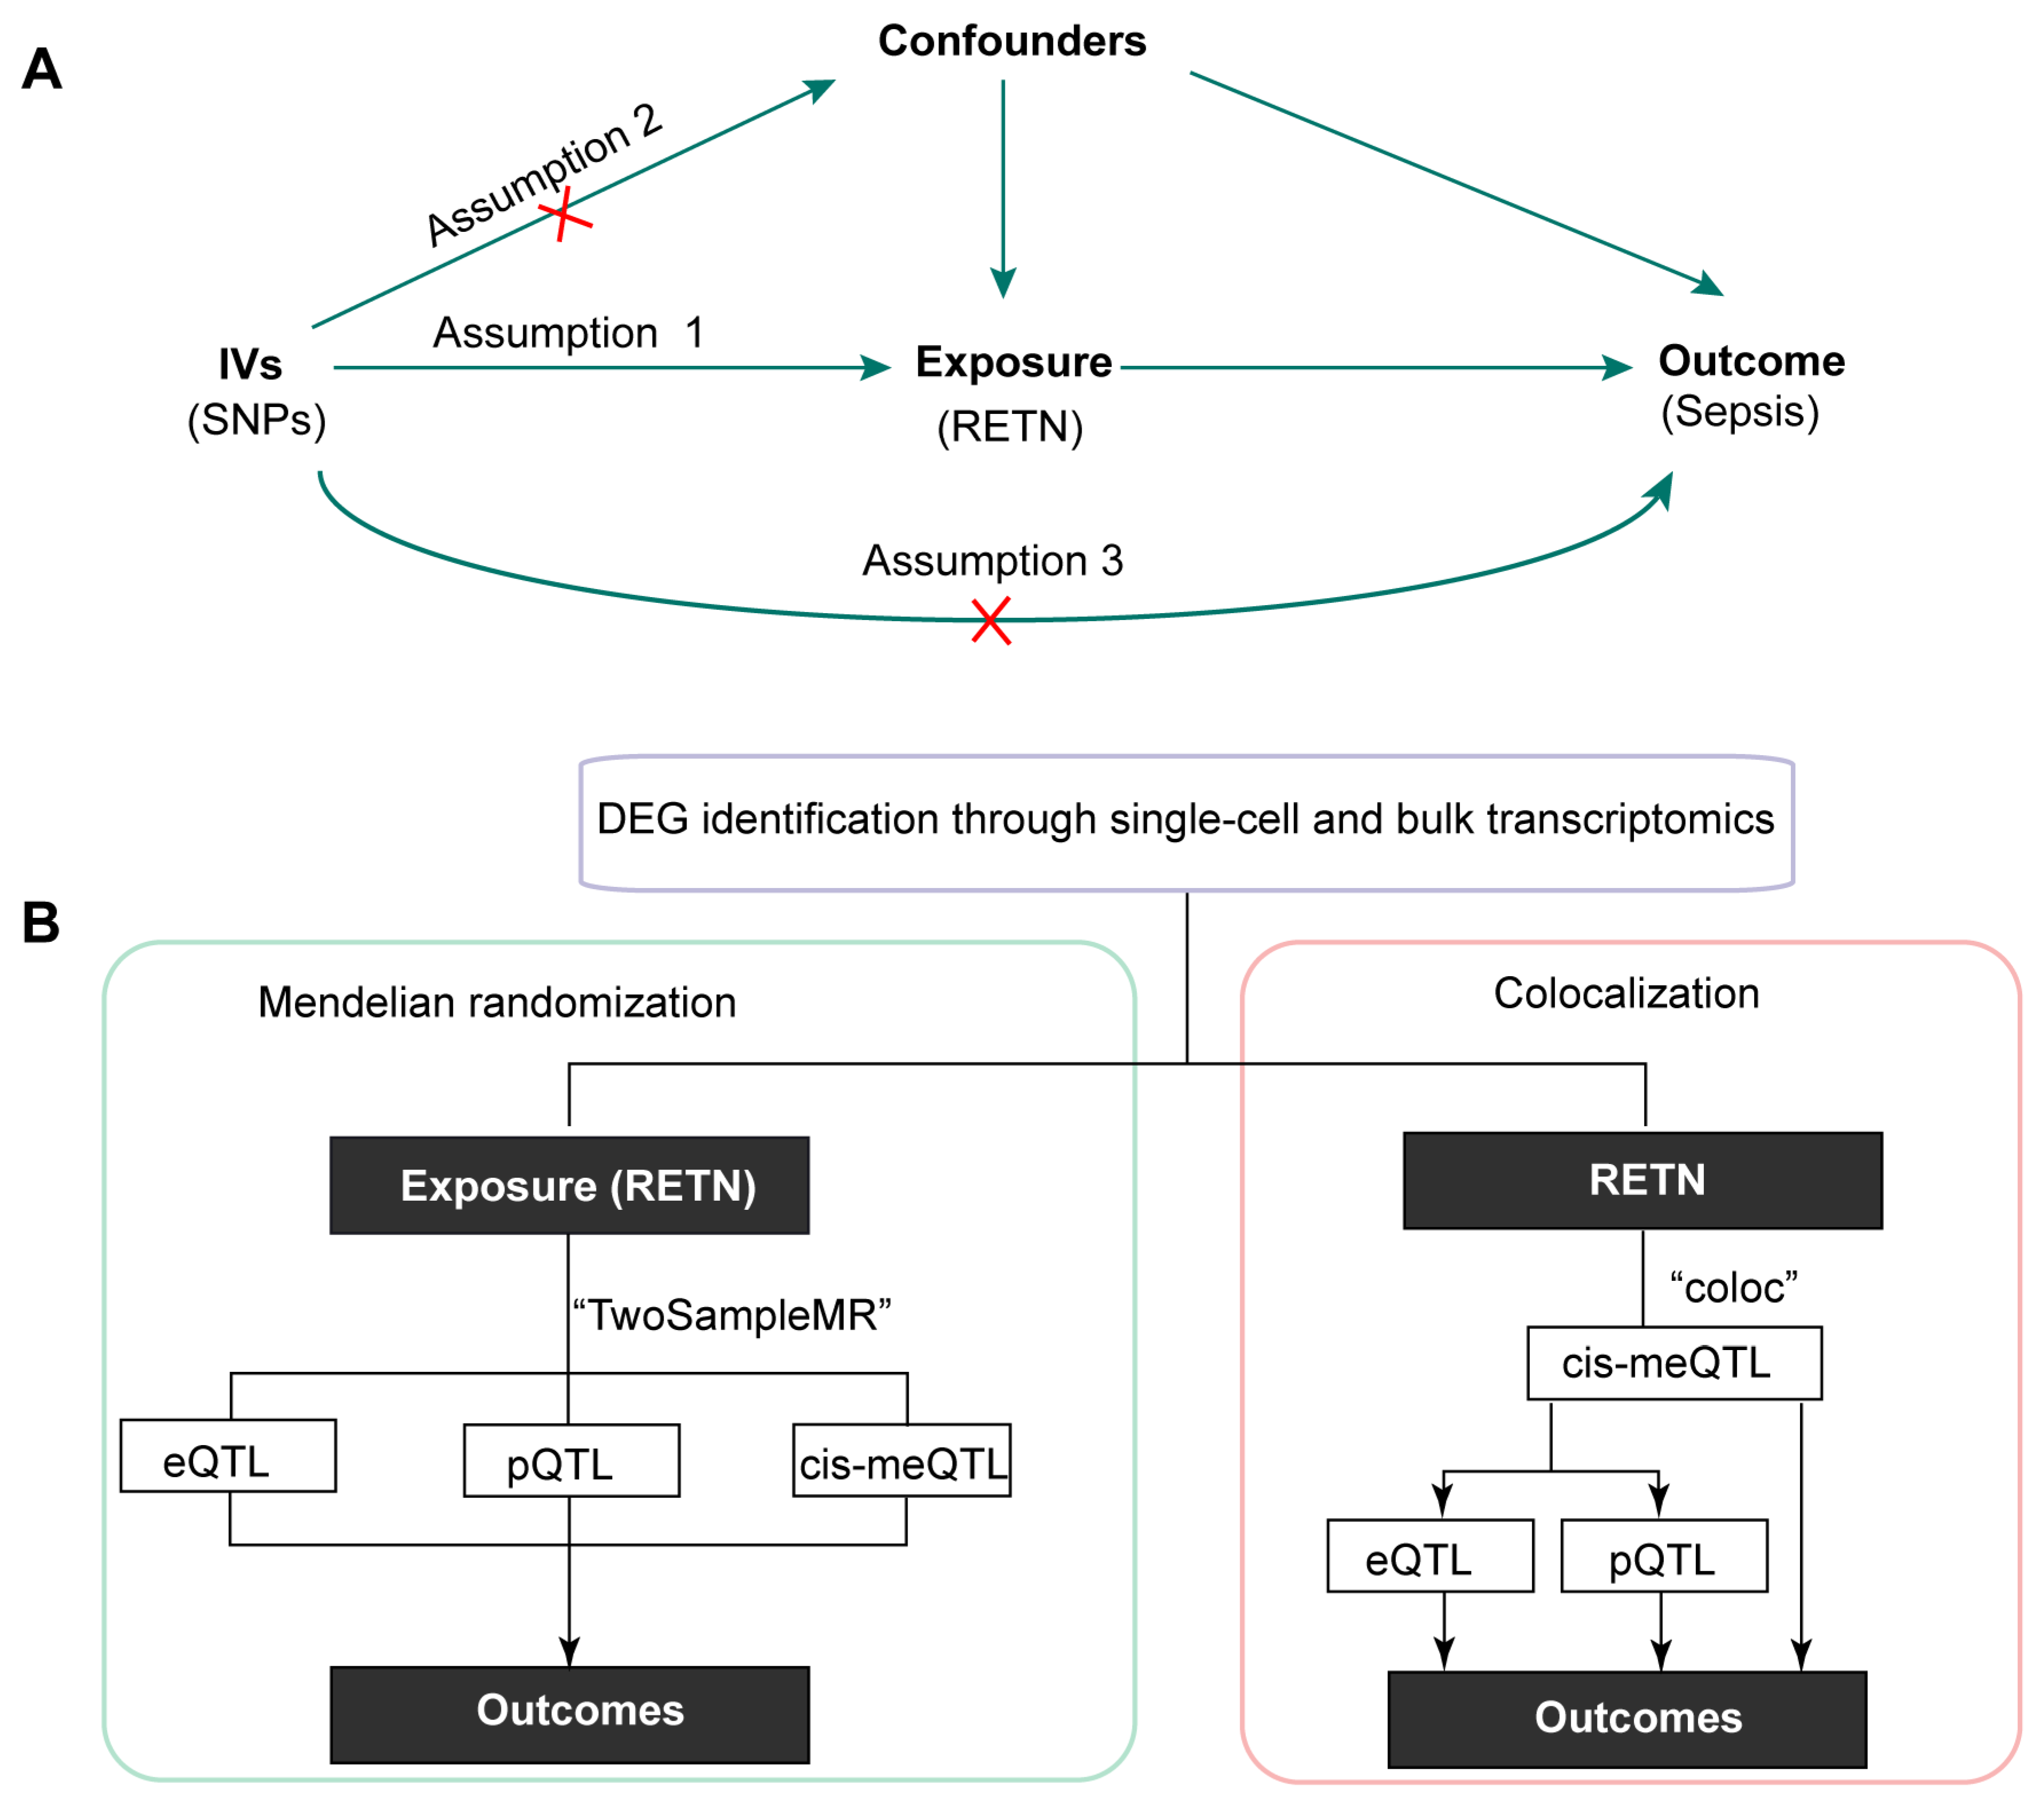
:1. Introduction
2. Results
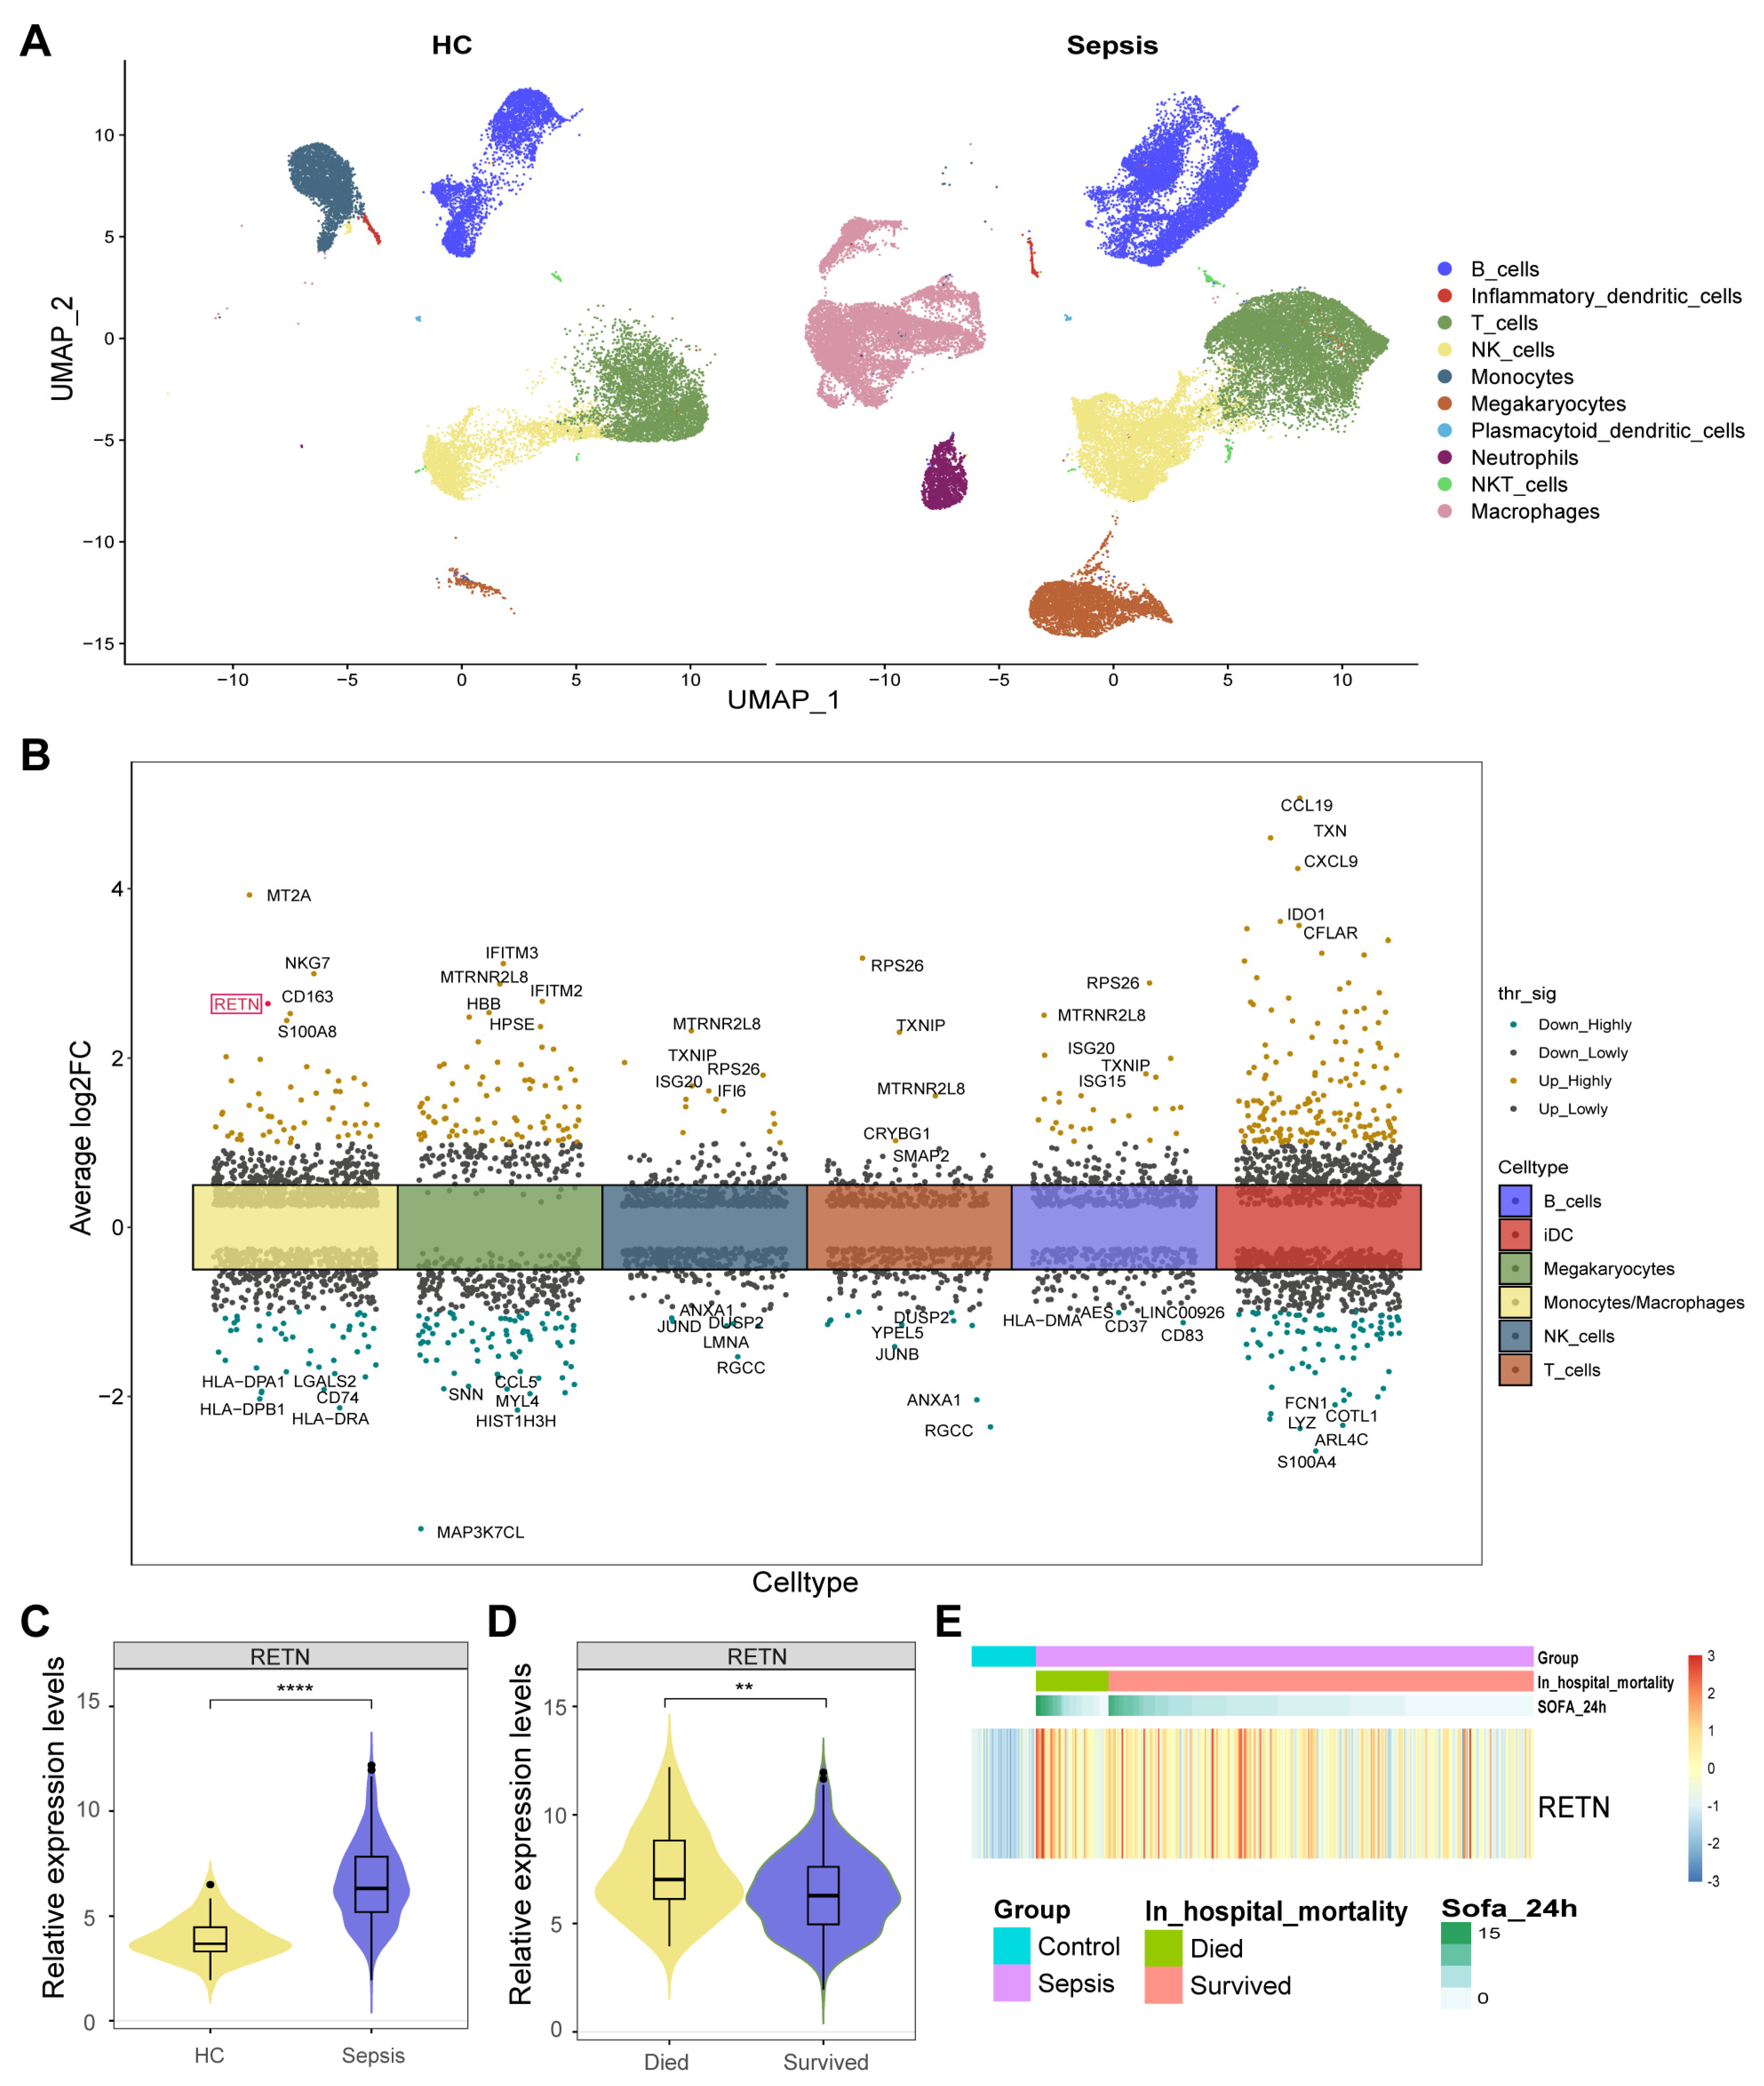
2.1. Identification of 560 DEGs between Healthy Controls and Sepsis Samples
2.2. RETN Was also Upregulated in Sepsis Samples in Bulk Transcriptome
2.3. The Associations between RETN and Outcomes
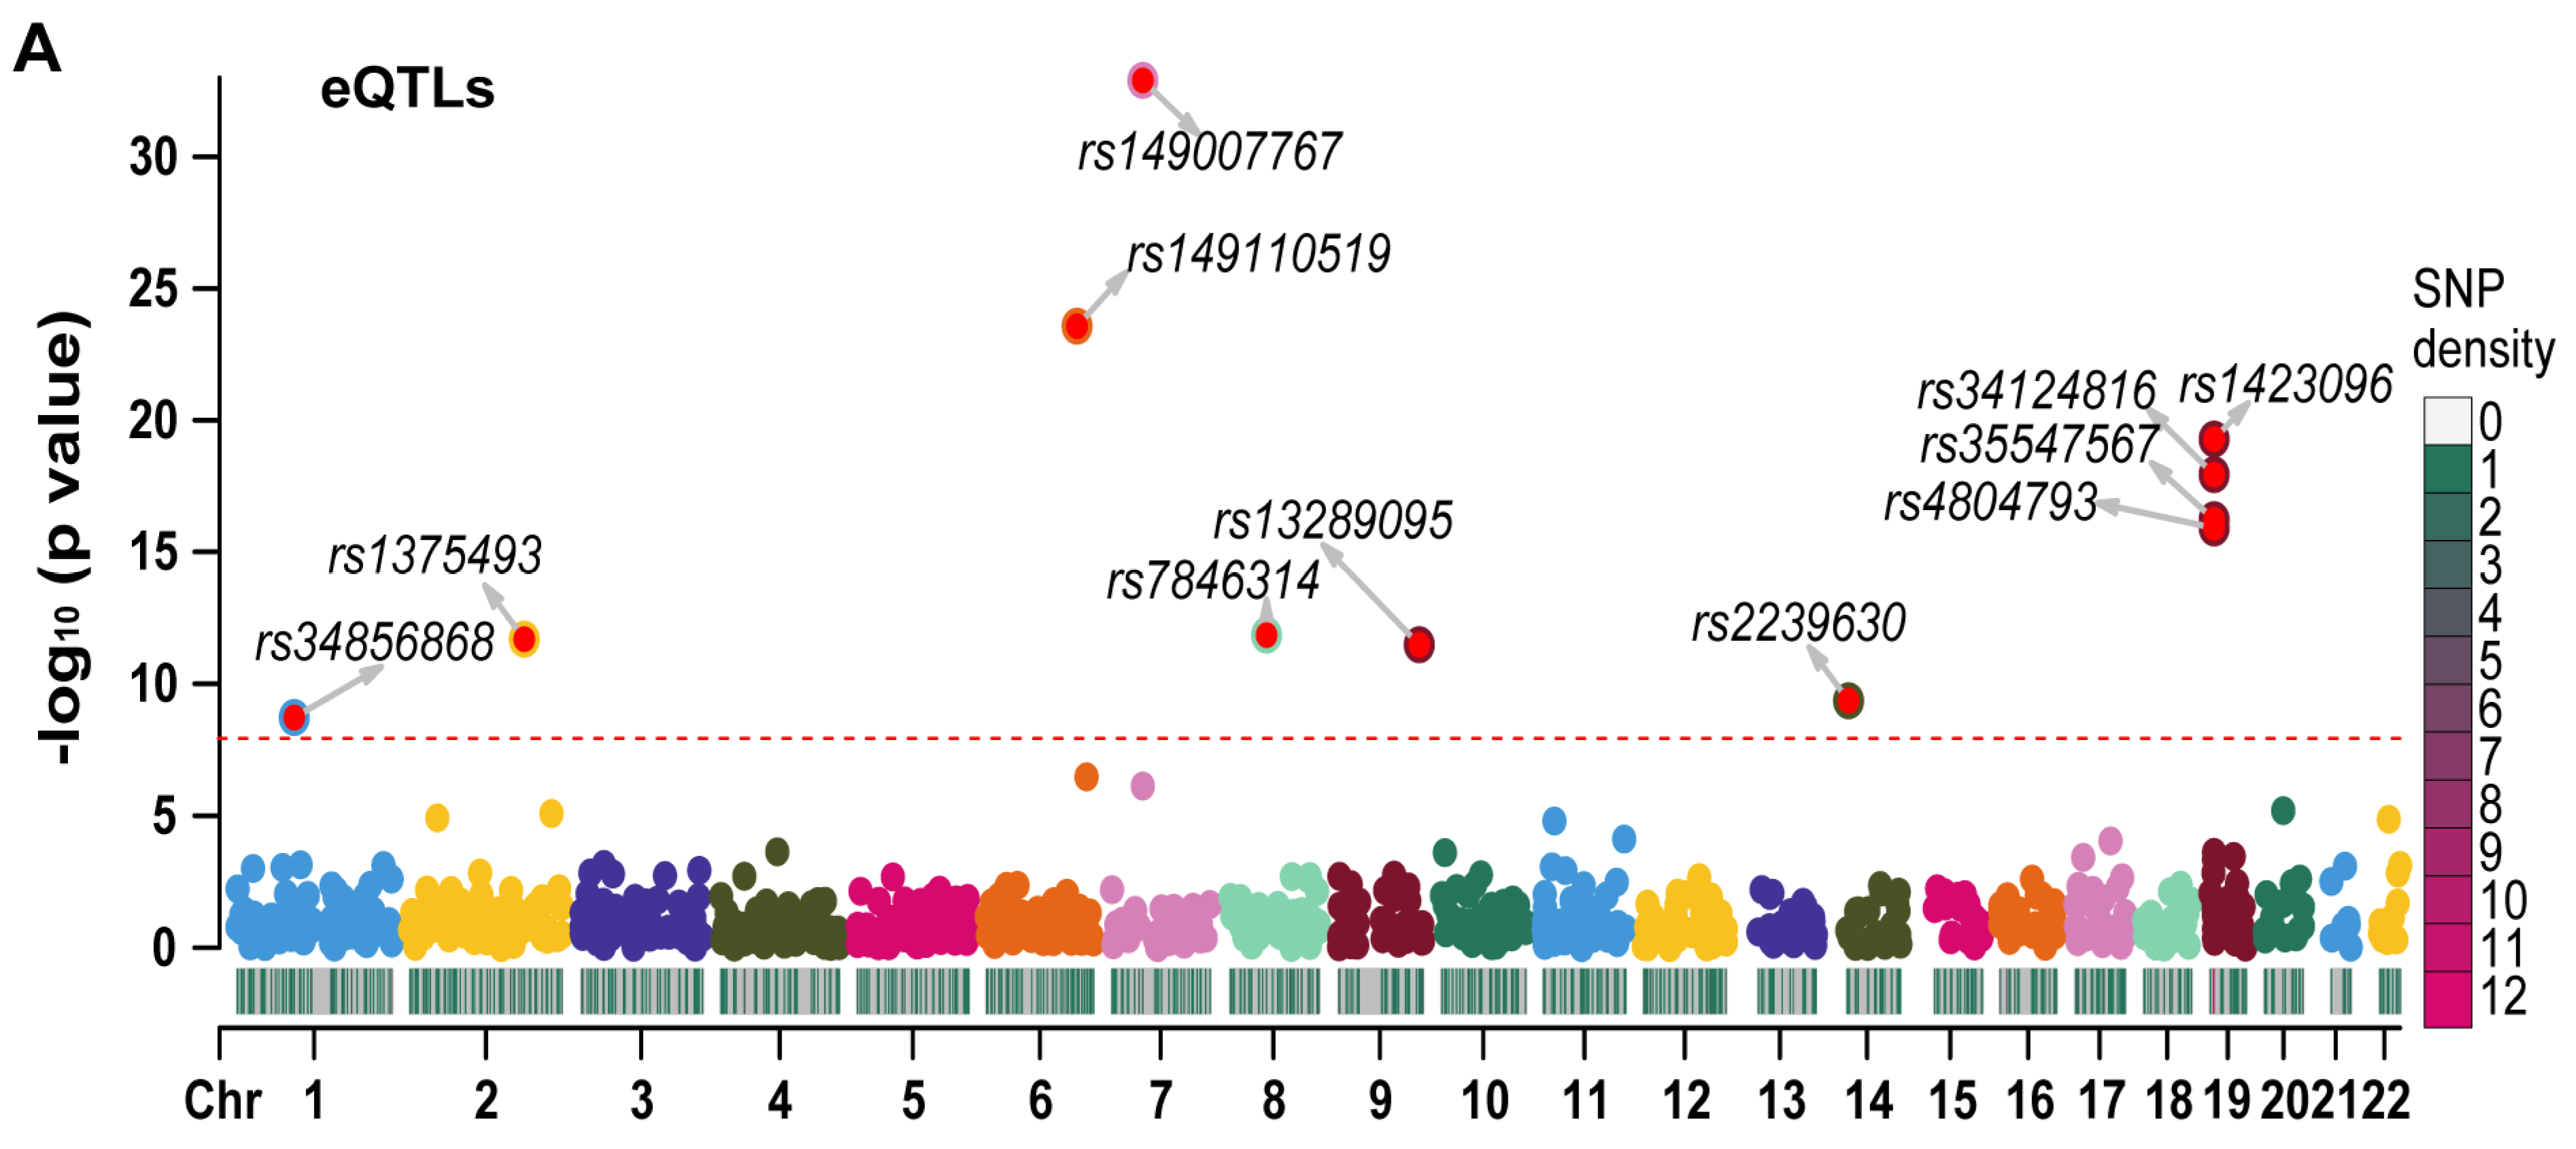
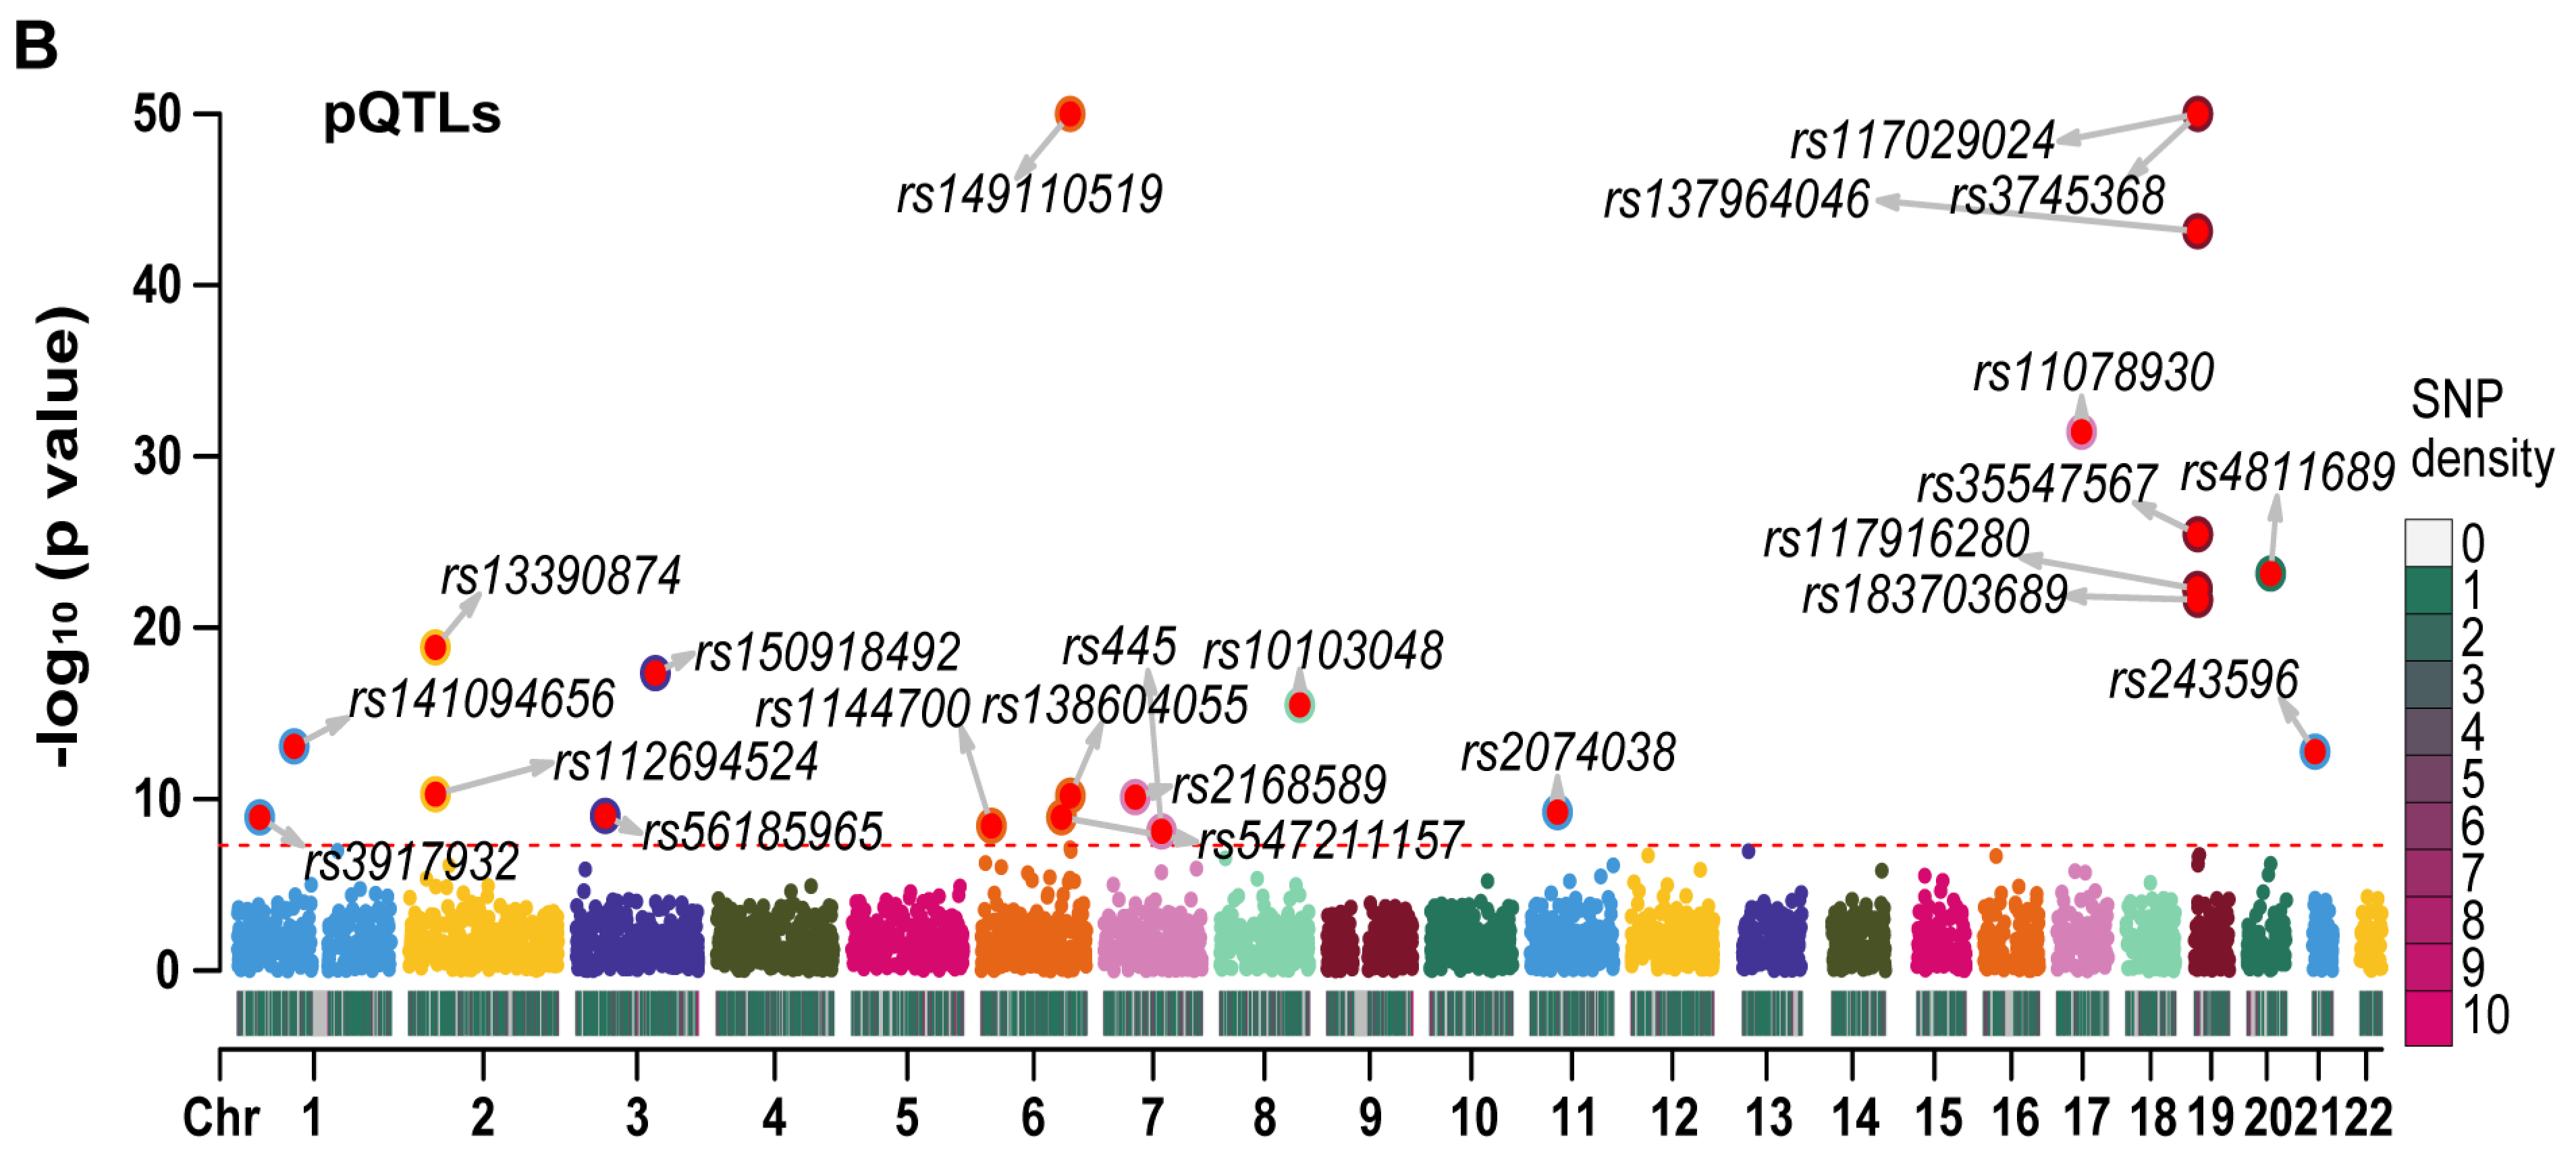
2.4. The MR Results of RETN-Related CpG Sites and RETN Levels and Outcomes of Sepsis
2.5. Colocalization Analyses Show the Colocalization between Some CpG Sites and RETN Protein Levels
3. Materials and Methods
3.1. Single-Cell Transcriptome Data
3.2. Bulk Transcriptome Data
3.3. Exposure Data
3.4. Outcome Cohorts
3.5. Identification of DEGs between Healthy Controls and Sepsis Samples
3.6. Exploring RETN Differential Expression in Bulk Transcriptome
3.7. The Association between RETN Expression and Outcomes
3.8. The Association between RETN Protein and Outcomes
3.9. The Associations between cis-meQTL and RETN eQTL, pQTL, and Outcomes of Sepsis
3.10. Sensitivity Test
3.11. The Colocation Analyses
3.12. Statistical Methods
4. Discussion
5. Conclusions
Supplementary Materials
Author Contributions
Funding
Institutional Review Board Statement
Informed Consent Statement
Data Availability Statement
Acknowledgments
Conflicts of Interest
Abbreviations
| CAP1 | cyclase-associated actin cytoskeleton regulatory protein 1 |
| CI | confidence interval |
| GWAS | genome-wide association study |
| HMGCR | 3-hydroxy-3-methylglutaryl-CoA reductase |
| ICU | intensive care unit |
| IEU | integrative epidemiology unit |
| IV | instrumental variable |
| IVW | inverse variance weighted |
| LD | linkage disequilibrium |
| MAF | minor allele frequency |
| MR | Mendelian randomization |
| OR | odds ratio |
| QTL | quantitative trait loci |
| RCTs | randomized controlled trials |
| RETN | resistin |
| SNP | single nucleotide polymorphism |
| SOFA | Sequential Organ Failure Assessment |
| TLR4 | Toll-like receptor 4 |
References
- Rudd, K.E.; Johnson, S.C.; Agesa, K.M.; Shackelford, K.A.; Tsoi, D.; Kievlan, D.R.; Colombara, D.V.; Ikuta, K.S.; Kissoon, N.; Finfer, S.; et al. Global, regional, and national sepsis incidence and mortality, 1990–2017: Analysis for the Global Burden of Disease Study. Lancet 2020, 395, 200–211. [Google Scholar] [CrossRef] [PubMed]
- Steppan, C.M.; Bailey, S.T.; Bhat, S.; Brown, E.J.; Banerjee, R.R.; Wright, C.M.; Patel, H.R.; Ahima, R.S.; Lazar, M.A. The hormone resistin links obesity to diabetes. Nature 2001, 409, 307–312. [Google Scholar] [CrossRef] [PubMed]
- Stofkova, A. Resistin and visfatin: Regulators of insulin sensitivity, inflammation and immunity. Endocr. Regul. 2010, 44, 25–36. [Google Scholar] [CrossRef] [PubMed]
- Koch, A.; Gressner, O.A.; Sanson, E.; Tacke, F.; Trautwein, C. Serum resistin levels in critically ill patients are associated with inflammation, organ dysfunction and metabolism and may predict survival of non-septic patients. Crit. Care 2009, 13, R95. [Google Scholar] [CrossRef]
- Khattab, A.A.; El-Mekkawy, M.S.; Helwa, M.A.; Omar, E.S. Utility of serum resistin in the diagnosis of neonatal sepsis and prediction of disease severity in term and late preterm infants. J. Perinat. Med. 2018, 46, 919–925. [Google Scholar] [CrossRef]
- Sanderson, E.; Glymour, M.M.; Holmes, M.V.; Kang, H.; Morrison, J.; Munafò, M.R.; Palmer, T.; Schooling, C.M.; Wallace, C.; Zhao, Q.; et al. Mendelian randomization. Nat. Rev. Methods Prim. 2022, 2, 6. [Google Scholar] [CrossRef]
- Harrison, S.; Dixon, P.; Jones, H.E.; Davies, A.R.; Howe, L.D.; Davies, N.M. Long-term cost-effectiveness of interventions for obesity: A mendelian randomisation study. PLoS Med. 2021, 18, e1003725. [Google Scholar] [CrossRef]
- Morrow, J.D.; Glass, K.; Cho, M.H.; Hersh, C.P.; Pinto-Plata, V.; Celli, B.; Marchetti, N.; Criner, G.; Bueno, R.; Washko, G.; et al. Human Lung DNA Methylation Quantitative Trait Loci Colocalize with Chronic Obstructive Pulmonary Disease Genome-Wide Association Loci. Am. J. Respir. Crit. Care Med. 2018, 197, 1275–1284. [Google Scholar] [CrossRef]
- Huang, W.; Xiao, J.; Ji, J.; Chen, L. Association of lipid-lowering drugs with COVID-19 outcomes from a Mendelian randomization study. eLife 2021, 10, e73873. [Google Scholar] [CrossRef]
- Yin, L.; Zhang, H.; Tang, Z.; Xu, J.; Yin, D.; Zhang, Z.; Yuan, X.; Zhu, M.; Zhao, S.; Li, X.; et al. rMVP: A Memory-efficient, Visualization-enhanced, and Parallel-accelerated Tool for Genome-wide Association Study. Genom. Proteom. Bioinform. 2021, 19, 619–628. [Google Scholar] [CrossRef]
- Qiu, X.; Li, J.; Bonenfant, J.; Jaroszewski, L.; Mittal, A.; Klein, W.; Godzik, A.; Nair, M.G. Dynamic changes in human single-cell transcriptional signatures during fatal sepsis. J. Leukoc. Biol. 2021, 110, 1253–1268. [Google Scholar] [CrossRef] [PubMed]
- Baghela, A.; Pena, O.M.; Lee, A.H.; Baquir, B.; Falsafi, R.; An, A.; Farmer, S.W.; Hurlburt, A.; Mondragon-Cardona, A.; Rivera, J.D.; et al. Predicting sepsis severity at first clinical presentation: The role of endotypes and mechanistic signatures. eBioMedicine 2022, 75, 103776. [Google Scholar] [CrossRef] [PubMed]
- Võsa, U.; Claringbould, A.; Westra, H.-J.; Bonder, M.J.; Deelen, P.; Zeng, B.; Kirsten, H.; Saha, A.; Kreuzhuber, R.; Yazar, S.; et al. Large-scale cis- and trans-eQTL analyses identify thousands of genetic loci and polygenic scores that regulate blood gene expression. Nat. Genet. 2021, 53, 1300–1310. [Google Scholar] [CrossRef] [PubMed]
- Ferkingstad, E.; Sulem, P.; Atlason, B.A.; Sveinbjornsson, G.; Magnusson, M.I.; Styrmisdottir, E.L.; Gunnarsdottir, K.; Helgason, A.; Oddsson, A.; Halldorsson, B.V.; et al. Large-scale integration of the plasma proteome with genetics and disease. Nat. Genet. 2021, 53, 1712–1721. [Google Scholar] [CrossRef]
- Min, J.L.; Hemani, G.; Hannon, E.; Dekkers, K.F.; Castillo-Fernandez, J.; Luijk, R.; Carnero-Montoro, E.; Lawson, D.J.; Burrows, K.; Suderman, M.; et al. Genomic and phenotypic insights from an atlas of genetic effects on DNA methylation. Nat. Genet. 2021, 53, 1311–1321. [Google Scholar] [CrossRef]
- Hemani, G.; Zheng, J.; Elsworth, B.; Wade, K.H.; Haberland, V.; Baird, D.; Laurin, C.; Burgess, S.; Bowden, J.; Langdon, R.; et al. The MR-Base platform supports systematic causal inference across the human phenome. eLife 2018, 7, e34408. [Google Scholar] [CrossRef]
- Hao, Y.; Hao, S.; Andersen-Nissen, E.; Mauck, W.M.; Zheng, S.; Butler, A.; Lee, M.J.; Wilk, A.J.; Darby, C.; Zager, M.; et al. Integrated analysis of multimodal single-cell data. Cell 2021, 184, 3573–3587.e3529. [Google Scholar] [CrossRef]
- Love, M.I.; Huber, W.; Anders, S. Moderated estimation of fold change and dispersion for RNA-seq data with DESeq2. Genome Biol. 2014, 15, 550. [Google Scholar] [CrossRef]
- VanderWeele, T.J.; Tchetgen Tchetgen, E.J.; Cornelis, M.; Kraft, P. Methodological challenges in mendelian randomization. Epidemiology 2014, 25, 427–435. [Google Scholar] [CrossRef]
- Lin, Z.; Deng, Y.; Pan, W. Combining the strengths of inverse-variance weighting and Egger regression in Mendelian randomization using a mixture of regressions model. PLoS Genet. 2021, 17, e1009922. [Google Scholar] [CrossRef]
- Skrivankova, V.W.; Richmond, R.C.; Woolf, B.A.R.; Yarmolinsky, J.; Davies, N.M.; Swanson, S.A.; VanderWeele, T.J.; Higgins, J.P.T.; Timpson, N.J.; Dimou, N.; et al. Strengthening the Reporting of Observational Studies in Epidemiology Using Mendelian Randomization: The STROBE-MR Statement. JAMA 2021, 326, 1614–1621. [Google Scholar] [CrossRef] [PubMed]
- Pierce, B.L.; Burgess, S. Efficient Design for Mendelian Randomization Studies: Subsample and 2-Sample Instrumental Variable Estimators. Am. J. Epidemiol. 2013, 178, 1177–1184. [Google Scholar] [CrossRef] [PubMed]
- Kichaev, G.; Roytman, M.; Johnson, R.; Eskin, E.; Lindström, S.; Kraft, P.; Pasaniuc, B. Improved methods for multi-trait fine mapping of pleiotropic risk loci. Bioinformatics 2017, 33, 248–255. [Google Scholar] [CrossRef] [PubMed]
- Tan, A.G.; Kifley, A.; Flood, V.M.; Holliday, E.G.; Scott, R.J.; Cumming, R.G.; Mitchell, P.; Wang, J.J. Evaluating the associations between obesity and age-related cataract: A Mendelian randomization study. Am. J. Clin. Nutr. 2019, 110, 969–976. [Google Scholar] [CrossRef]
- Gaziano, L.; Giambartolomei, C.; Pereira, A.C.; Gaulton, A.; Posner, D.C.; Swanson, S.A.; Ho, Y.-L.; Iyengar, S.K.; Kosik, N.M.; Vujkovic, M.; et al. Actionable druggable genome-wide Mendelian randomization identifies repurposing opportunities for COVID-19. Nat. Med. 2021, 27, 668–676. [Google Scholar] [CrossRef]
- Sargolzaei, M.; Schenkel, F.S.; Jansen, G.B.; Schaeffer, L.R. Extent of Linkage Disequilibrium in Holstein Cattle in North America. J. Dairy Sci. 2008, 91, 2106–2117. [Google Scholar] [CrossRef]
- Chang, C.C.; Chow, C.C.; Tellier, L.C.; Vattikuti, S.; Purcell, S.M.; Lee, J.J. Second-generation PLINK: Rising to the challenge of larger and richer datasets. GigaScience 2015, 4, 7. [Google Scholar] [CrossRef]
- Auton, A.; Abecasis, G.R.; Altshuler, D.M.; Durbin, R.M.; Abecasis, G.R.; Bentley, D.R.; Chakravarti, A.; Clark, A.G.; Donnelly, P.; Eichler, E.E.; et al. A global reference for human genetic variation. Nature 2015, 526, 68–74. [Google Scholar] [CrossRef]
- Mamrut, S.; Harony, H.; Sood, R.; Shahar-Gold, H.; Gainer, H.; Shi, Y.-J.; Barki-Harrington, L.; Wagner, S. DNA Methylation of Specific CpG Sites in the Promoter Region Regulates the Transcription of the Mouse Oxytocin Receptor. PLoS ONE 2013, 8, e56869. [Google Scholar] [CrossRef]
- Liu, M.; Jiang, Y.; Wedow, R.; Li, Y.; Brazel, D.M.; Chen, F.; Datta, G.; Davila-Velderrain, J.; McGuire, D.; Tian, C.; et al. Association studies of up to 1.2 million individuals yield new insights into the genetic etiology of tobacco and alcohol use. Nat. Genet. 2019, 51, 237–244. [Google Scholar] [CrossRef]
- Verbanck, M.; Chen, C.Y.; Neale, B.; Do, R. Detection of widespread horizontal pleiotropy in causal relationships inferred from Mendelian randomization between complex traits and diseases. Nat. Genet. 2018, 50, 693–698. [Google Scholar] [CrossRef] [PubMed]
- Hemani, G.; Tilling, K.; Davey Smith, G. Orienting the causal relationship between imprecisely measured traits using GWAS summary data. PLoS Genet. 2017, 13, e1007081. [Google Scholar] [CrossRef]
- Wallace, C. Eliciting priors and relaxing the single causal variant assumption in colocalisation analyses. PLoS Genet. 2020, 16, e1008720. [Google Scholar] [CrossRef] [PubMed]
- Wang, Y.; Guga, S.; Wu, K.; Khaw, Z.; Tzoumkas, K.; Tombleson, P.; Comeau, M.E.; Langefeld, C.D.; Cunninghame Graham, D.S.; Morris, D.L.; et al. COVID-19 and systemic lupus erythematosus genetics: A balance between autoimmune disease risk and protection against infection. PLoS Genet. 2022, 18, e1010253. [Google Scholar] [CrossRef] [PubMed]
- Cao, C.; Yu, M.; Chai, Y. Pathological alteration and therapeutic implications of sepsis-induced immune cell apoptosis. Cell Death Dis. 2019, 10, 782. [Google Scholar] [CrossRef]
- Schäffler, A.; Hamer, O.; Dickopf, J.; Goetz, A.; Landfried, K.; Voelk, M.; Herfarth, H.; Kopp, A.; Büchler, C.; Schölmerich, J.; et al. Admission resistin levels predict peripancreatic necrosis and clinical severity in acute pancreatitis. Am. J. Gastroenterol. 2010, 105, 2474–2484. [Google Scholar] [CrossRef]
- Hillenbrand, A.; Knippschild, U.; Weiss, M.; Schrezenmeier, H.; Henne-Bruns, D.; Huber-Lang, M.; Wolf, A.M. Sepsis induced changes of adipokines and cytokines—Septic patients compared to morbidly obese patients. BMC Surg. 2010, 10, 26. [Google Scholar] [CrossRef]
- Jang, J.C.; Chen, G.; Wang, S.H.; Barnes, M.A.; Chung, J.I.; Camberis, M.; Le Gros, G.; Cooper, P.J.; Steel, C.; Nutman, T.B.; et al. Macrophage-Derived Human Resistin Is Induced in Multiple Helminth Infections and Promotes Inflammatory Monocytes and Increased Parasite Burden. PLoS Pathog. 2015, 11, e1004579. [Google Scholar] [CrossRef]
- Miller, L.; Singbartl, K.; Chroneos, Z.C.; Ruiz-Velasco, V.; Lang, C.H.; Bonavia, A. Resistin directly inhibits bacterial killing in neutrophils. Intensive Care Med. Exp. 2019, 7, 30. [Google Scholar] [CrossRef]
- Chang, M.L.; Liang, K.H.; Ku, C.L.; Lo, C.C.; Cheng, Y.T.; Hsu, C.M.; Yeh, C.T.; Chiu, C.T. Resistin reinforces interferon λ-3 to eliminate hepatitis C virus with fine-tuning from RETN single-nucleotide polymorphisms. Sci. Rep. 2016, 6, 30799. [Google Scholar] [CrossRef]
- Nakatochi, M.; Ichihara, S.; Yamamoto, K.; Ohnaka, K.; Kato, Y.; Yokota, S.; Hirashiki, A.; Naruse, K.; Asano, H.; Izawa, H.; et al. Epigenome-wide association study suggests that SNPs in the promoter region of RETN influence plasma resistin level via effects on DNA methylation at neighbouring sites. Diabetologia 2015, 58, 2781–2790. [Google Scholar] [CrossRef] [PubMed]


| IEU ID (Outcome) | Trait | RETN (Exposure) | p | OR | 95% CI |
|---|---|---|---|---|---|
| ieu-b-4980 | Sepsis | eQTLs | 0.049 | 0.970 | 0.896–1.051 |
| cis-eQTLs | 0.128 | 0.897 | 0.780–1.032 | ||
| pQTLs | 0.791 | 0.991 | 0.930–1.057 | ||
| cis-pQTLs | 0.794 | 0.990 | 0.915–1.070 | ||
| ieu-b-4981 | Sepsis (28 day death in critical care) | eQTLs | 0.031 | 0.603 | 0.380–0.956 |
| cis-eQTLs | 0.037 | 0.389 | 0.161–0.943 | ||
| pQTLs | 0.033 | 0.666 | 0.458–0.968 | ||
| cis-pQTLs | 0.007 | 0.540 | 0.344–0.846 | ||
| ieu-b-4982 | Sepsis (critical care) | eQTLs | 0.060 | 0.802 | 0.637–1.009 |
| cis-eQTLs | 0.024 | 0.686 | 0.494–0.952 | ||
| pQTLs | 0.036 | 0.829 | 0.695–0.987 | ||
| cis-pQTLs | 0.036 | 0.785 | 0.627–0.984 | ||
| ieu-b-4979 | Pneumonia (death) | eQTLs | 0.012 | 0.754 | 0.604–0.940 |
| cis-eQTLs | 0.121 | 0.770 | 0.554–1.071 | ||
| pQTLs | 0.292 | 0.927 | 0.805–1.067 | ||
| cis-pQTLs | 0.342 | 0.871 | 0.656–1.157 | ||
| ieu-b-4978 | Pneumonia (critical care) | eQTLs | 0.205 | 0.872 | 0.707–1.077 |
| cis-eQTLs | 0.904 | 0.975 | 0.646–1.472 | ||
| pQTLs | 0.200 | 1.091 | 0.955–1.247 | ||
| cis-pQTLs | 0.488 | 1.091 | 0.853–1.394 | ||
| ieu-b-4977 | Pneumonia (28-day death in critical care) | eQTLs | 0.658 | 0.901 | 0.567–1.430 |
| cis-eQTLs | 0.693 | 1.182 | 0.515–2.716 | ||
| pQTLs | 0.913 | 0.982 | 0.712–1.356 | ||
| cis-pQTLs | 0.491 | 0.882 | 0.616–1.262 | ||
| ebi-a-GCST90000255 | Severe COVID-19 infection with respiratory failure (analysis I) | eQTLs | 0.697 | 1.071 | 0.757–1.516 |
| cis-eQTLs | 0.495 | 1.273 | 0.637–2.545 | ||
| pQTLs | 0.785 | 1.043 | 0.769–1.416 | ||
| cis-pQTLs | 0.508 | 1.148 | 0.763–1.727 | ||
| ebi-a-GCST90000256 | Severe COVID-19 infection with respiratory failure (analysis II) | eQTLs | 0.851 | 1.044 | 0.668–1.630 |
| cis-eQTLs | 0.761 | 0.900 | 0.456–1.775 | ||
| pQTLs | 0.834 | 0.967 | 0.703–1.329 | ||
| cis-pQTLs | 0.683 | 0.919 | 0.612–1.379 | ||
| ukb-d-I9_K_CARDIAC | Death due to cardiac causes | eQTLs | 0.558 | 1.000 | 0.999–1.002 |
| cis-eQTLs | 0.768 | 1.000 | 0.999–1.001 | ||
| pQTLs | 0.984 | 1.000 | 0.999–1.001 | ||
| cis-pQTLs | 0.399 | 1.001 | 0.999–1.002 | ||
| ebi-a-GCST009541 | Heart failure | eQTLs | 0.115 | 0.957 | 0.907–1.011 |
| cis-eQTLs | 0.135 | 0.941 | 0.869–1.019 | ||
| pQTLs | 0.327 | 0.975 | 0.927–1.026 | ||
| cis-pQTLs | 0.084 | 0.948 | 0.891–1.007 | ||
| ukb-d-I50 | Heart failure | eQTLs | 0.332 | 1.000 | 0.999–1.000 |
| cis-eQTLs | 0.040 | 0.999 | 0.998–1.000 | ||
| pQTLs | 0.576 | 1.000 | 1.000–1.000 | ||
| cis-pQTLs | 0.681 | 1.000 | 0.999–1.001 | ||
| finn-b-N14_RENFAIL | Renal failure | eQTLs | 0.621 | 1.031 | 0.913–1.164 |
| cis-eQTLs | 0.337 | 1.100 | 0.905–1.337 | ||
| pQTLs | 0.262 | 1.059 | 0.958–1.171 | ||
| cis-pQTLs | 0.609 | 1.044 | 0.885–1.232 | ||
| ukb-b-4963 | Acute renal failure | eQTLs | 0.573 | 1.001 | 0.999–1.003 |
| cis-eQTLs | 0.982 | 1.000 | 0.997–1.003 | ||
| pQTLs | 0.393 | 0.999 | 0.998–1.001 | ||
| cis-pQTLs | NA a | NA | NA | ||
| finn-b-K11_HEPFAIL | Hepatic failure | eQTLs | 0.836 | 0.957 | 0.631–1.451 |
| cis-eQTLs | 0.509 | 0.804 | 0.421–1.536 | ||
| pQTLs | 0.514 | 1.122 | 0.794–1.586 | ||
| cis-pQTLs | 0.660 | 1.112 | 0.693–1.784 | ||
| finn-b-DEATH | Any death | eQTLs | 0.698 | 0.976 | 0.864–1.103 |
| cis-eQTLs | 0.153 | 1.127 | 0.956–1.328 | ||
| pQTLs | 0.463 | 1.032 | 0.949–1.123 | ||
| cis-pQTLs | 0.232 | 1.096 | 0.943–1.274 |
| CpG Sites (Exposure) | Cis-meQTL (SNP) | Outcome | p | OR | 95%CI |
|---|---|---|---|---|---|
| cg02346997 | rs3745367 | RETN (eQTLs) | 0.085 | 0.954 | 0.904–1.007 |
| RETN (pQTLs) | 1.224 × 10−42 | 0.742 | 0.711–0.775 | ||
| Sepsis death | 0.004 | 1.709 | 1.183–2.469 | ||
| Sepsis severity | 0.378 | 1.086 | 0.905–1.304 | ||
| cg02383368 | rs4134860 | RETN (eQTLs) | 0.010 | 0.859 | 0.765–0.965 |
| RETN (pQTLs) | 0.224 | 0.947 | 0.867–1.034 | ||
| Sepsis death | 0.252 | 1.586 | 0.721–3.489 | ||
| Sepsis severity | 0.064 | 1.451 | 0.978–2.151 | ||
| cg06633066 | rs3745367 | RETN (eQTLs) | 0.085 | 0.859 | 0.722–1.021 |
| RETN (pQTLs) | 1.224 × 10−42 | 0.383 | 0.334–0.440 | ||
| Sepsis death | 0.004 | 5.601 | 1.717–18.274 | ||
| Sepsis severity | 0.378 | 1.303 | 0.723–2.346 | ||
| cg11931253 | rs72990846 rs8107343 | RETN (eQTLs) | 0.055 | 0.851 | 0.721–1.004 |
| RETN (pQTLs) | 0.740 | 1.052 | 0.779–1.422 | ||
| Sepsis death | 0.963 | 0.984 | 0.506–1.914 | ||
| Sepsis severity | 0.978 | 1.005 | 0.719–1.404 | ||
| cg15460739 | rs4134849 | RETN (eQTLs) | 3.830 × 10−45 | 1.425 | 1.204–1.686 |
| RETN (pQTLs) | 0.740 | 1.052 | 0.779–1.422 | ||
| Sepsis death | 0.778 | 0.860 | 0.302–2.454 | ||
| Sepsis severity | 0.243 | 0.731 | 0.432–1.237 | ||
| cg15576517 | rs34205585 rs807812 | RETN (eQTLs) | 0.664 | 1.011 | 0.961–1.065 |
| RETN (pQTLs) | 0.473 | 1.039 | 0.935–1.155 | ||
| Sepsis death | 0.944 | 0.980 | 0.550–1.745 | ||
| Sepsis severity | 0.761 | 0.974 | 0.825–1.151 | ||
| cg15828235 | rs72994460 | RETN (eQTLs) | 0.007 | 1.098 | 1.026–1.174 |
| RETN (pQTLs) | 0.340 | 1.156 | 0.859–1.555 | ||
| Sepsis death | 0.691 | 0.846 | 0.372–1.927 | ||
| Sepsis severity | 0.759 | 0.938 | 0.625–1.409 | ||
| cg17474222 | rs10406687 | RETN (eQTLs) | 0.001 | 1.303 | 1.117–1.520 |
| RETN (pQTLs) | 9.350 × 10⁻⁶ | 1.337 | 1.176–1.520 | ||
| Sepsis death | 0.164 | 2.145 | 0.733–6.277 | ||
| Sepsis severity | 0.990 | 1.003 | 0.586–1.717 | ||
| cg18563630 | rs583984 rs794083 | RETN (eQTLs) | 0.272 | 0.931 | 0.820–1.058 |
| RETN (pQTLs) | NA a | NA | NA | ||
| Sepsis death | 0.643 | 1.122 | 0.689–1.827 | ||
| Sepsis severity | 0.932 | 0.990 | 0.787–1.246 | ||
| cg22322184 | rs3745367 | RETN (eQTLs) | 0.085 | 0.943 | 0.881–1.008 |
| RETN (pQTLs) | 1.224 × 10−42 | 0.690 | 0.654–0.728 | ||
| Sepsis death | 0.004 | 1.949 | 1.233–3.081 | ||
| Sepsis severity | 0.378 | 1.108 | 0.882–1.391 | ||
| cg24433207 | rs4134825 | RETN (eQTLs) | 2.827 × 10⁻⁵ | 1.394 | 1.193–1.628 |
| RETN (pQTLs) | 0.166 | 1.087 | 0.966–1.222 | ||
| Sepsis death | 0.798 | 0.881 | 0.334–2.325 | ||
| Sepsis severity | 0.195 | 0.724 | 0.445–1.179 | ||
| cg24759919 | rs147516010 rs794077 rs599330 | RETN (eQTLs) | 0.209 | 1.038 | 0.979–1.100 |
| RETN (pQTLs) | 0.875 | 1.009 | 0.898–1.135 | ||
| Sepsis death | 0.873 | 1.028 | 0.735–1.436 | ||
| Sepsis severity | 0.832 | 1.018 | 0.862–1.203 |
| Trait1 | Trait2 | PP.H1 | PP.H2 | PP.H3 | PP.H4 |
|---|---|---|---|---|---|
| RETN-eQTL | Sepsis death | 0.487 | 0.000 | 0.437 | 0.075 |
| RETN-pQTL | 0.159 | 0.000 | 0.153 | 0.688 | |
| Cis-meQTL | 0.455 | 0.000 | 0.000 | 0.545 | |
| RETN-eQTL | Sepsis severity | 0.557 | 0.000 | 0.363 | 0.080 |
| RETN-pQTL | 0.158 | 0.000 | 0.143 | 0.700 | |
| Cis-meQTL | 0.968 | 0.000 | 0.000 | 0.032 | |
| Cis-meQTL | RETN-eQTL | 0.000 | 0.000 | 1.000 | 0.000 |
| RETN-pQTL | 0.000 | 0.000 | 0.000 | 1.000 |
Disclaimer/Publisher’s Note: The statements, opinions and data contained in all publications are solely those of the individual author(s) and contributor(s) and not of MDPI and/or the editor(s). MDPI and/or the editor(s) disclaim responsibility for any injury to people or property resulting from any ideas, methods, instructions or products referred to in the content. |
© 2023 by the authors. Licensee MDPI, Basel, Switzerland. This article is an open access article distributed under the terms and conditions of the Creative Commons Attribution (CC BY) license (https://creativecommons.org/licenses/by/4.0/).
Share and Cite
Chen, H.; Luo, H.; Tian, T.; Li, S.; Jiang, Y. Integrated Analyses of Single-Cell Transcriptome and Mendelian Randomization Reveal the Protective Role of Resistin in Sepsis Survival in Intensive Care Unit. Int. J. Mol. Sci. 2023, 24, 14982. https://doi.org/10.3390/ijms241914982
Chen H, Luo H, Tian T, Li S, Jiang Y. Integrated Analyses of Single-Cell Transcriptome and Mendelian Randomization Reveal the Protective Role of Resistin in Sepsis Survival in Intensive Care Unit. International Journal of Molecular Sciences. 2023; 24(19):14982. https://doi.org/10.3390/ijms241914982
Chicago/Turabian StyleChen, Hanghang, Haihua Luo, Tian Tian, Shan Li, and Yong Jiang. 2023. "Integrated Analyses of Single-Cell Transcriptome and Mendelian Randomization Reveal the Protective Role of Resistin in Sepsis Survival in Intensive Care Unit" International Journal of Molecular Sciences 24, no. 19: 14982. https://doi.org/10.3390/ijms241914982
APA StyleChen, H., Luo, H., Tian, T., Li, S., & Jiang, Y. (2023). Integrated Analyses of Single-Cell Transcriptome and Mendelian Randomization Reveal the Protective Role of Resistin in Sepsis Survival in Intensive Care Unit. International Journal of Molecular Sciences, 24(19), 14982. https://doi.org/10.3390/ijms241914982