Article

Genome-Wide Characterization and Expression Analysis of Transcription Factor Families in Desert Moss Syntrichia caninervis under Abiotic Stresses

1
State Key Laboratory of Desert and Oasis Ecology, Key Laboratory of Ecological Safety and Sustainable Development in Arid Lands, Xinjiang Institute of Ecology and Geography, Chinese Academy of Sciences, Beijing 100045, China
2
Xinjiang Key Laboratory of Conservation and Utilization of Plant Gene Resources, Xinjiang Institute of Ecology and Geography, Chinese Academy of Sciences, Urumqi 830000, China
3
University of Chinese Academy of Sciences, Beijing 100049, China
*
Author to whom correspondence should be addressed.
Int. J. Mol. Sci. 2023, 24(7), 6137; https://doi.org/10.3390/ijms24076137
Submission received: 10 February 2023 / Revised: 5 March 2023 / Accepted: 17 March 2023 / Published: 24 March 2023
(This article belongs to the Section Molecular Biology)

Abstract

:
Transcription factor (TF) families play important roles in plant stress responses. S. caninervis is a new model moss for plant desiccation tolerance studies. Here, we report a high-confidence identification and characterization of 591 TFs representing 52 families that covered all chromosomes in S. caninervis. GO term and KEGG pathway analysis showed that TFs were involved in the regulation of transcription, DNA-templated, gene expression, binding activities, plant hormone signal transduction, and circadian rhythm. A number of TF promoter regions have a mixture of various hormones-related cis-regulatory elements. AP2/ERF, bHLH, MYB, and C2H2-zinc finger TFs were the overrepresented TF families in S. caninervis, and the detailed classification of each family is performed based on structural features. Transcriptome analysis revealed the transcript abundances of some ScAP2/ERF, bHLH, MYB, and C2H2 genes were accumulated in the treated S. caninervis under cold, dehydration, and rehydration stresses. The RT-qPCR results strongly agreed with RNA-seq analysis, indicating these TFs might play a key role in S. caninervis response to abiotic stress. Our comparative TF characterization and classification provide the foundations for functional investigations of the dominant TF genes involved in S. caninervis stress response, as well as excellent stress tolerance gene resources for plant stress resistance breeding.

1. Introduction

Abiotic stress negatively impacts plant growth and development, as well as poses a significant threat to plant production and food supply [1]. Plants respond to periods of abiotic stress by motivating specific physiological, biochemical, and molecular elements to mitigate the undesirable impact of the abiotic stress combination on plant growth and developmental stages [2,3]. Transcription factors (TFs) are key regulators in gene expression, transcriptional regulation, and signal transduction pathways by recognizing specific cis-regulatory DNA sequences in the promoters of downstream genes [4,5]. TFs contain four domains: a DNA-binding, transcription activation or repression, a nuclear localization indicator, and an oligomerization region [6]. These four domains systematically act together to regulate transcriptional and posttranscriptional processes by activating or repressing gene expression patterns in response to external and internal stimuli during plant growth and developmental phase [7]. TFs and their binding sequences significantly interact with each other and help plant cells respond to diverse environmental conditions [8,9].
In plants, a large number of recognized TFs ranged from 6% to 10% [10]. In the PlantTFDB database, a total of 320370 TFs were identified from 165 species and classified into 58 families, which cover the main lineages of green plants and provide genomic TF repertoires across green plants [11]. In the model plant Arabidopsis, which has 1770 TFs in its genome, these TFs can be classified into different families based on their structure and binding domains [12]. In recent years, many studies have shown that numerous plant TFs, including the members of APETALA2/ethylene-responsive element binding factors (AP2/ERF), myeloblastoma (MYB), basic helix-loop-helix (bHLH), NAM, ATAF1/2, CUC2 (NAC), basic leucine zipper (bZIP), and C2H2-zinc finger genes, are significantly involved in plant stress responses [13,14]. Genome-wide comparative analysis of all the TFs in plant species is a good strategy for identifying valuable stress-tolerant genes [12]. As high-throughput sequencing technology advances, the availability of many plant genome sequences provides an important opportunity for investigating the genome-wide characterization of TF families. Many important TF family members were identified in different plant species based on the whole genome dataset from various lineages. A huge number of TF genes were detected in Arabidopsis (1770), rice (1801), and V. vinifera (1659) [15]. In bryophytes, a total of 1078, 423, and 333 TF members were initially identified in the P. patens, M. polymorpha, and A. angustus genomes, respectively [15]. In algae, V. carteri genome has 125 TF genes and K. flaccidum genome has 232 TF genes [16].
Syntrichia caninervis is a dominant species of biological soil crust in the Gurbantunggut Desert of Northwestern China [17]. S. caninervis is a desiccation-tolerant moss, which can survive equilibration with extremely dry air (i.e., 0–30% RH or less than −162 MPa) [18]. It has emerged as an ideal model for understanding the molecular mechanism of plant desiccation tolerance as well as a potential source of stress-related gene identification for crop improvement [19,20,21,22]. In the previous study, based on the dehydration-rehydration transcriptome of S. caninervis, we identified a total of 778 TFs [23] and cloned several TFs in S. caninervis, such as ScDREB5, ScDREB8, ScDREB10, ScABI4, and ScABI3, which play important roles in DT responses. The most gratifying discovery is that, unlike the TF genes isolated from Arabidopsis and other angiosperms, the TF genes cloned from S. caninervis also exhibited significantly improved drought/salt/cold/heat stress tolerances in Arabidopsis without growth inhibition [19,24,25,26,27]. All of these studies have demonstrated that S. caninervis stress-tolerant TFs are excellent candidate genes for plant stress-tolerance molecular breeding [28].
Recently, the genome data of S. caninervis has become available [29], but there has yet to be systematic research on the high-throughput mining of stress tolerant-related TFs in the S. caninervis genome. In addition, as a representative species that has evolved from aquatic to terrestrial, relatively little is known about the functional role and evolution information of TFs in moss responses to abiotic stress. A comprehensive analysis of S. caninervis TFs and their evolutionary functions might help to elucidate the regulatory mechanism underlying stress responses. Here, we carried out a comprehensive genomic analysis of TFs in S. caninervis, which identified that 591 TF members encoded genes. All TFs were consequently subjected to systematic analysis, including conserved domains, chromosomal positions, gene ontology (GO), KEGG pathway enrichment, regulatory information, phylogeny tree analysis, network interactions, comparison studies of TF numbers across various species, and gene expression patterns under cold exposure and dehydration-rehydration (D-R) stress. The findings of this work will provide fundamental information about the TFs in S. caninervis, as well as contribute to future investigations of the functions and regulatory mechanisms of dominant TF genes involved in S. caninervis stress responses. Additionally, global identification and comparative analysis of TF genes from related lineages extend our knowledge of TF evolution and function.

2. Results

2.1. Identification of S. caninervis TFs

Approximately 820 putative TF sequences were associated with the S. caninervis genome by blast searches. SMART database and InterPro online tools were employed to determine the existence of the TF domain features in S. caninervis protein sequences (Figure S1 and Table S1). The results of identification and characterization were improved by adjusting the assignment rules and prediction cutoffs of TF families in S. caninervis. Finally, a total of 591 (591/16,545 (3.6%)) non-redundant TFs belonging to 52 TF families were identified in S. caninervis (Figure 1 and Table S1). In addition, over-represented TFs include the AP2/ERF with 75, MYB (MYB/MYB-related) with 58, bHLH with 52, C2H2 with 35, B3 with 33, C3H with 29, Trihelix with 28 genes. Whereas 10 identified TF families with a single gene copy in the S. caninervis genome database, such as BBR-BPC VOZ and others (Figure 1 and Figure S1). Furthermore, the S. caninervis genome lacks TCP, FAR1, GeBP, SAP, RAV, NZZ/SPL, and YABBY families (Figure 1), suggesting that these TF family members may evolve after whole genome duplication. In this study, different members of TFs were identified in 14 plant species that belong to 58 TF families (Figure 1). AP2/ERF is one of the biggest families, with 75, 178, and 167 AP2/ERF genes potentially found in S. caninervis, P. patens, and S. fallax, while 31, 25, and eight genes were identified in M. polymorpha, V. carteri, and K. flaccidum, respectively (Figure 1). In S. caninervis, AP2/ERF TF superfamily includes three subgroups, AP2, ERF (ERF/DREB), and soloist subfamilies with 7, 67, and one gene, respectively. The proportions of the ERF subfamily (67/75 = 89.33%) were relatively expanded, and the percentages of the AP2 subfamily (7/75 = 9.33%) decreased in S. caninervis. In comparison with the proportions of these genes in A. thaliana (77.65% ERF: 16.75% AP2), P. trichocarpa (75.46% ERF: 21.93% AP2), O. sativa (80.23% ERF: 15.69% AP2), Z. mays (73.27% ERF: 21.86% AP2), V. carteri (48 % ERF: 52% AP2), K. flaccidum (50.0% ERF: 37.5% AP2), and C. zofingiensis (50% ERF: 50% AP2) (Table S2). According to the number of MYB repeats in protein sequences, 58 S. caninervis MYB genes were identified and classified into three distinct subgroups, 37 MYB-related (MYB-R1), 19 MYB-R2, and two MYB-R3 (Table S3). Similar results were found in K. flaccidum, V. carteri, potato, B. distachyon, and pineapple (Table S3). However, in other plants such as P. patens, D. catenatum, and Arabidopsis, MYB proteins are divided into four subgroups, MYB-related, MYB-R2, MYB-R3, and MYB-R4. MYB-related genes predominate in S. caninervis, but in higher plants, MYB-R2 is more common [30]. In fact, the numbers of the identified MYB TFs in different plant species gradually increased from algae and mosses to flowering plants (Table S3). The basic helix–loop–helix (bHLH) TF is characterized by a basic helix–loop–helix domain with two parts, a basic DNA binding domain at the N-terminal and a protein interaction domain at the C-terminal. Comparative results indicated that bHLH TFs in various plant species have increased gradually from algae to mosses and higher plants. For example, three species of algae genomes (K. flaccidum, V. carteri, and C. zofingiensis) have 18 members, S. caninervis has 52 members, P. patens has 114 members, and O. sativa, A. thaliana, Z. mays, and P. trichocarpa genomes have 211, 225, 308, 379 gene members, respectively (Figure 1). The C2H2-zinc finger protein family is the fourth most abundant TF family in S. caninervis with 35 genes. Different numbers of C2H2-zinc finger genes were found in 14 plant species (Figure 1).

2.2. Chromosomal Mapping of TF Genes in S. caninervis

Chromosomal position analysis of the S. caninervis genome found that 591 candidate TFs were assigned to all chromosomes and mapped according to their chromosomal locations. The distribution and density of TF genes in the chromosomal regions were not identical in the S. caninervis genome (Figure 2). Chromosomes 6, 11, and 12 harbored the highest numbers of TFs, whereas the lowest density of TFs (16 TFs) was mapped to chromosome 13 (largest chromosome) as shown in Figure 2. The detailed distributions of four over-represented TF families, including AP2/ERF, MYB, bHLH, and C2H2 were investigated. Seventy-five AP2/ERF genes covered all S. caninervis chromosomes. The highest numbers of AP2/ERF TFs were found on chromosome 12, with 13 TFs, followed by chromosome 6 with nine TFs, and chromosomes 8 and 9 with eight TFs for each. However, the lowest density of AP2/ERF members was detected on chromosomes 3, 13, and 4 with three, two, and one TF, respectively (Figure 2 and Table S1). A total of 52 bHLH TFs were straight-mapped to 12 S. caninervis chromosomes with unequal distributions (Figure 2). Chromosome 12 had 12 bHLH genes, followed by chromosomes 5 and 9 with seven bHLH genes for each, while the lowest bHLH numbers were found in chromosomes 2 and 3 with three genes for each. Fifty-eight MYB TF genes were anchored onto 11 chromosomes (Figure 2 and Table S1). Chromosome 12 had eight genes, followed by chromosomes 1, 10, and 11 each with seven genes (Figure 2). However, chromosomes 5 and 7 had the lowest numbers of MYB genes, with five genes. Thirty-five C2H2-zinc finger genes were mapped to 12 chromosomes (Figure 2 and Table S1). Chromosomes 10 and 4 each had six genes, but chromosomes 1 and 5 each had one gene (Figure 2). Furthermore, the majority of (70.22% (415)) S. caninervis TF genes were disrupted by introns, which varied from 1 to 17, while the remaining 29.78% (176) TF genes were intron-less (Table S1). Introns play a functional role in the regulation of gene expression. Exon shuffling involves the formation of a new gene during the plant evolution process [31].

2.3. GO Term, KEGG Pathway, and Cis-Element Analysis of Tfs in S. caninervis

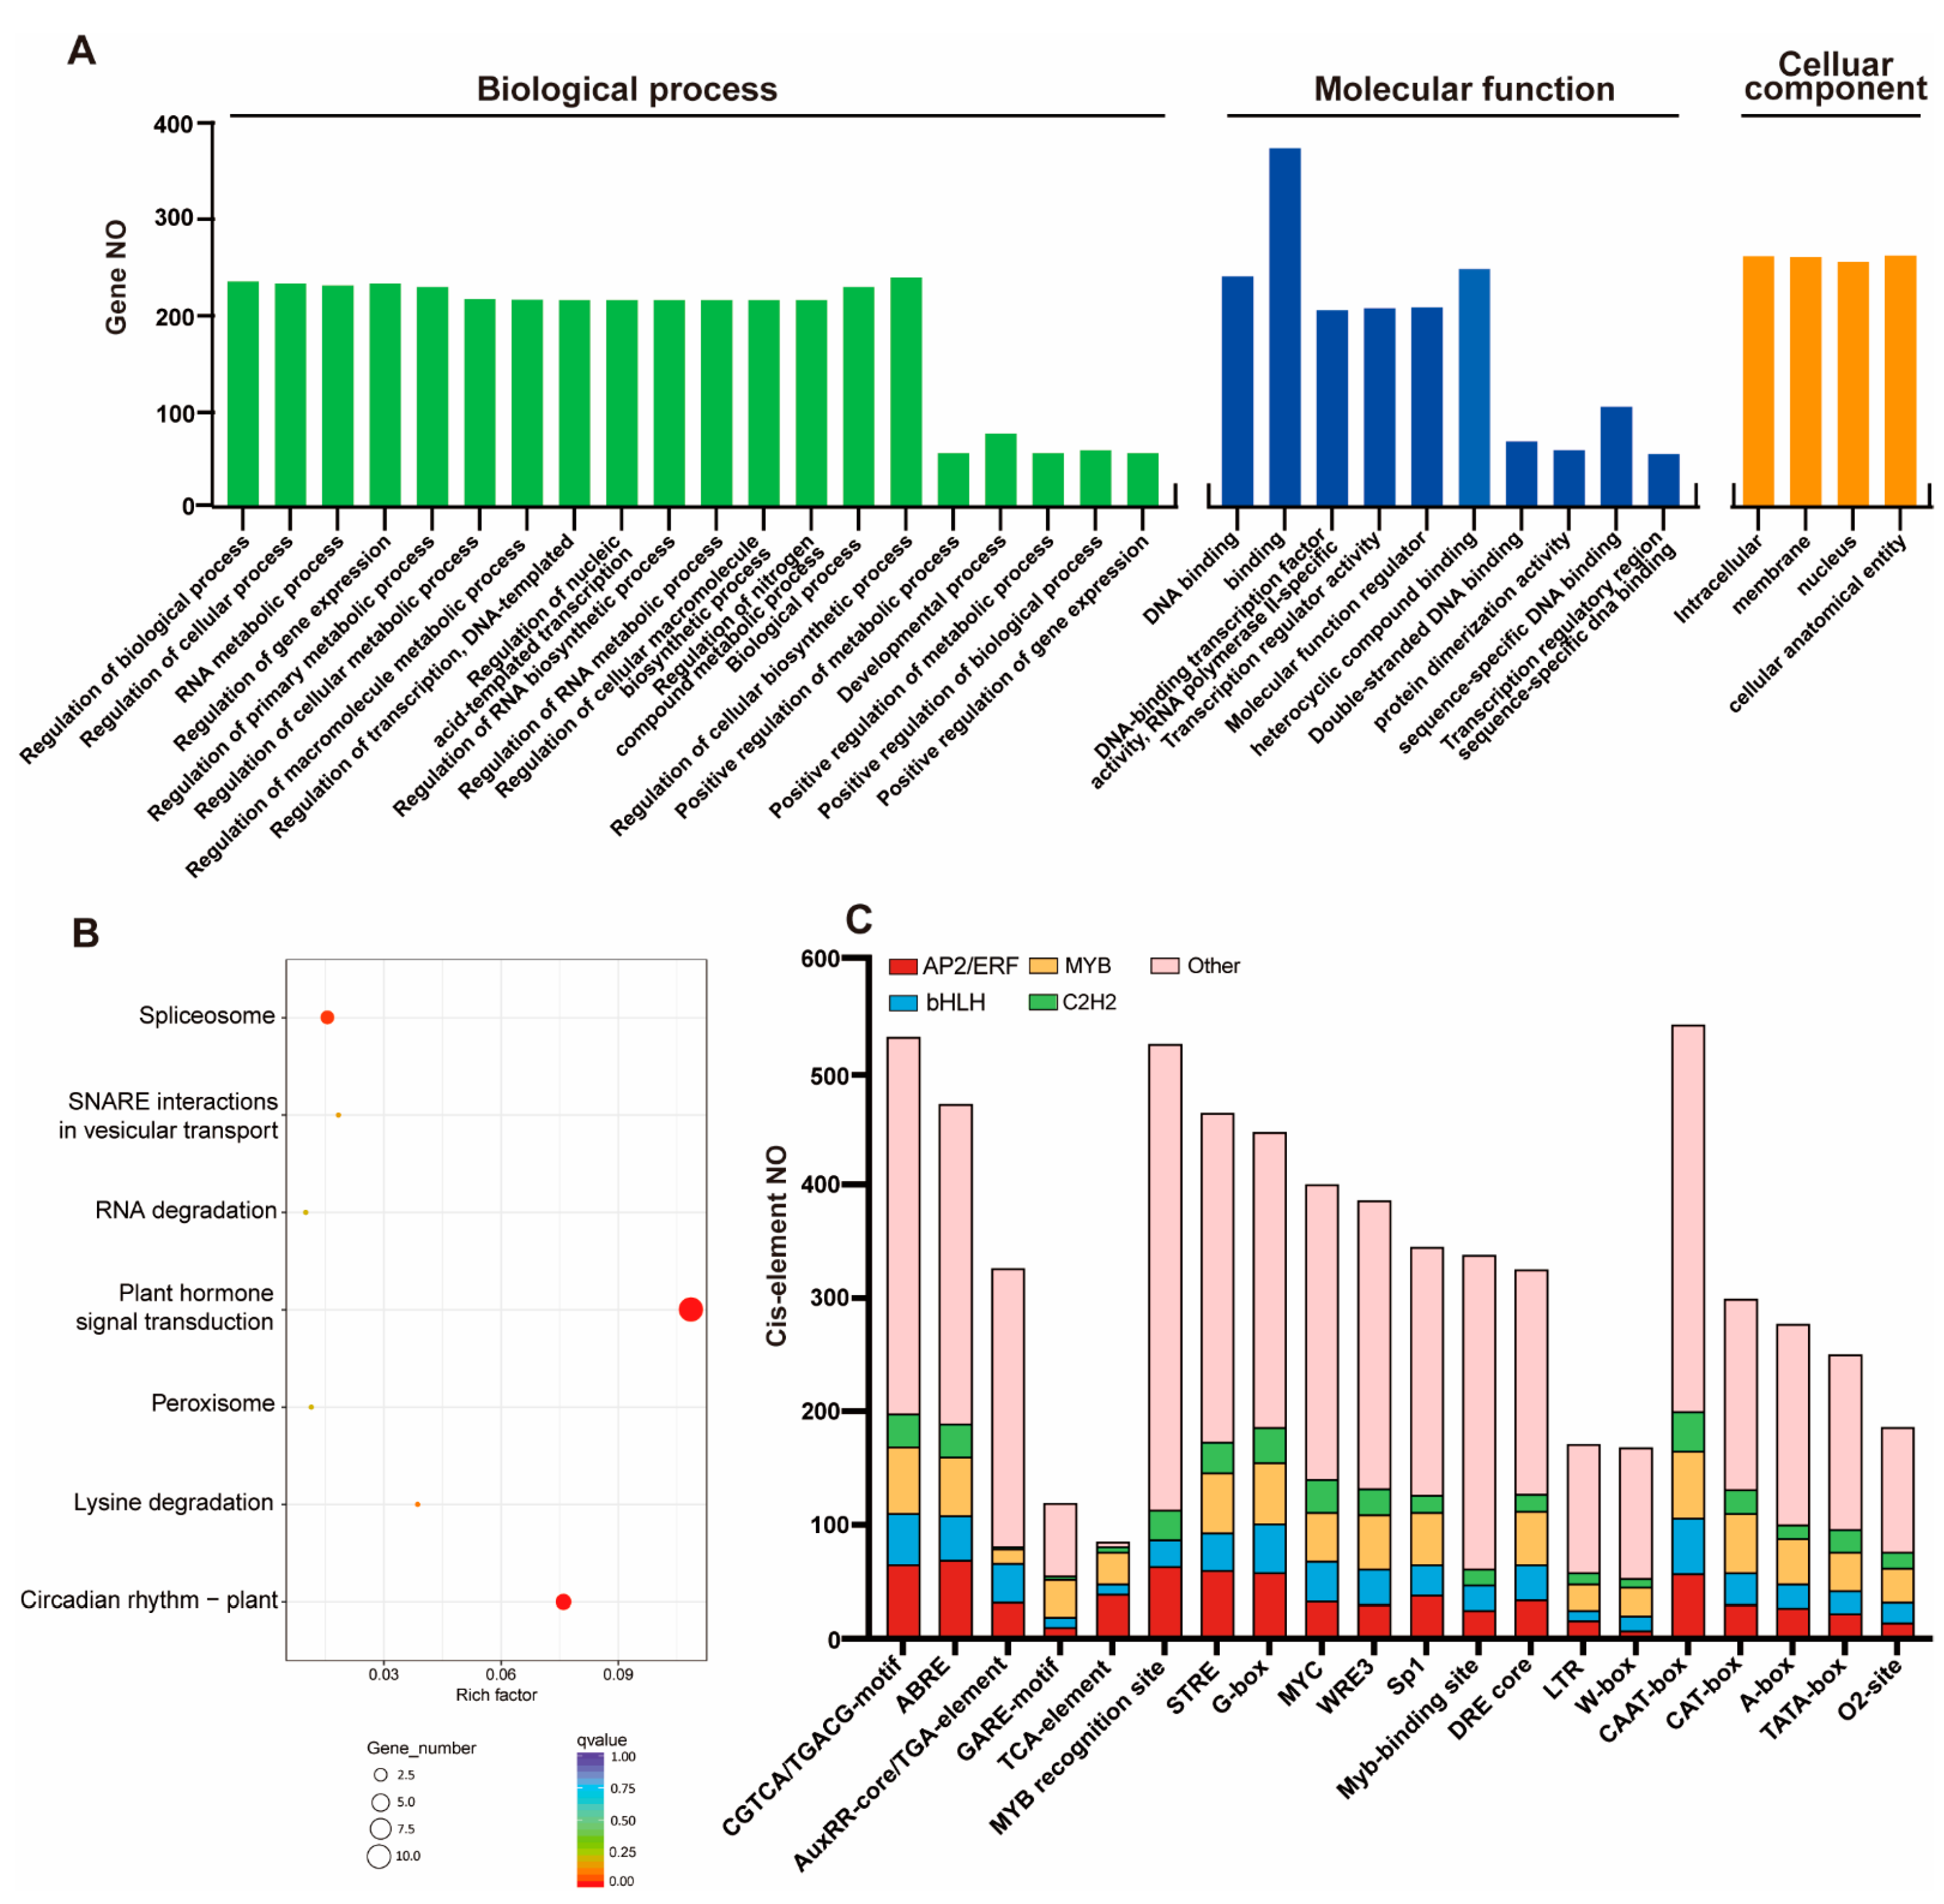
To investigate the potential regulatory functions of 591 TFs in S. caninervis, GOterm was used. ScTF proteins were divided into three subgroups by GO annotation based on their classifications as a biological process, cellular component, and molecular function. GO results assigned ScTFs into 20 groups of biological processes. Several TF genes were involved in the regulation of transcription, cellular macromolecule biosynthetic process, gene expression, nitrogen compound metabolic process, primary metabolic process and DNA-templated (Figure 3A). In the cellular component, TF genes were relatively enriched in the nucleus, membrane, intracellular, and cellular anatomical entity. In the molecular function prediction of TF genes, they were theoretically associated with binding activities and transcription regulator activities (Figure 3A). The KEGG pathway analysis showed that the majority of TF members were associated with plant hormone signal transduction, circadian rhythm–plant, spliceosome, and lysine degradation (Figure 3B).
TFs can bind to specific DNA-sequences in the promoters of target genes and regulate their expression patterns under various environmental conditions [32,33]. In S. caninervis, the promoters of the TF genes contained various cis-elements such as CAAT-box, MYB-recognition site, as-1, G-box, STRE, CGTCA-motif, ABRE, and MYC (Figure 3C). In this investigation, many AP2/ERFs and C2H2-zinc finger promoter regions had ABRE and CGTCA/TGACG-motif elements (Table S5). The CGTCA-motif (cis-acting regulatory element involved in the MeJA-responsiveness) and CAAT-box (common cis-acting element in promoter and enhancer regions) were found in the promoter sites of all S. caninervis MYB genes (Figure 3C and Table S4). G-box and CAAT-box were detected on all bHLH promoter sites. Several cis-regulatory elements associated with hormone responses such as CGTCA-motif, ABRE, GARE-motif, TGA-element, AuxRR-core, and TCA-element, were identified in the promoter regions of AP2/ERF, MYB, and bHLH TFs (Figure 3C). Furthermore, some AP2/ERF, MYB, and bHLH promoter regions have a mixture of different hormone-related cis-regulatory elements. The result also identified other cis-regulatory elements related to diverse stresses such as G-box, STRE, Sp1, DRE core, I-box, MBS, MYC, GATT-motif, TCCC-motif and LTR (Figure 3C and Table S4).

2.4. Evolutionary Conservation of the Top Four TF Families in S. caninervis

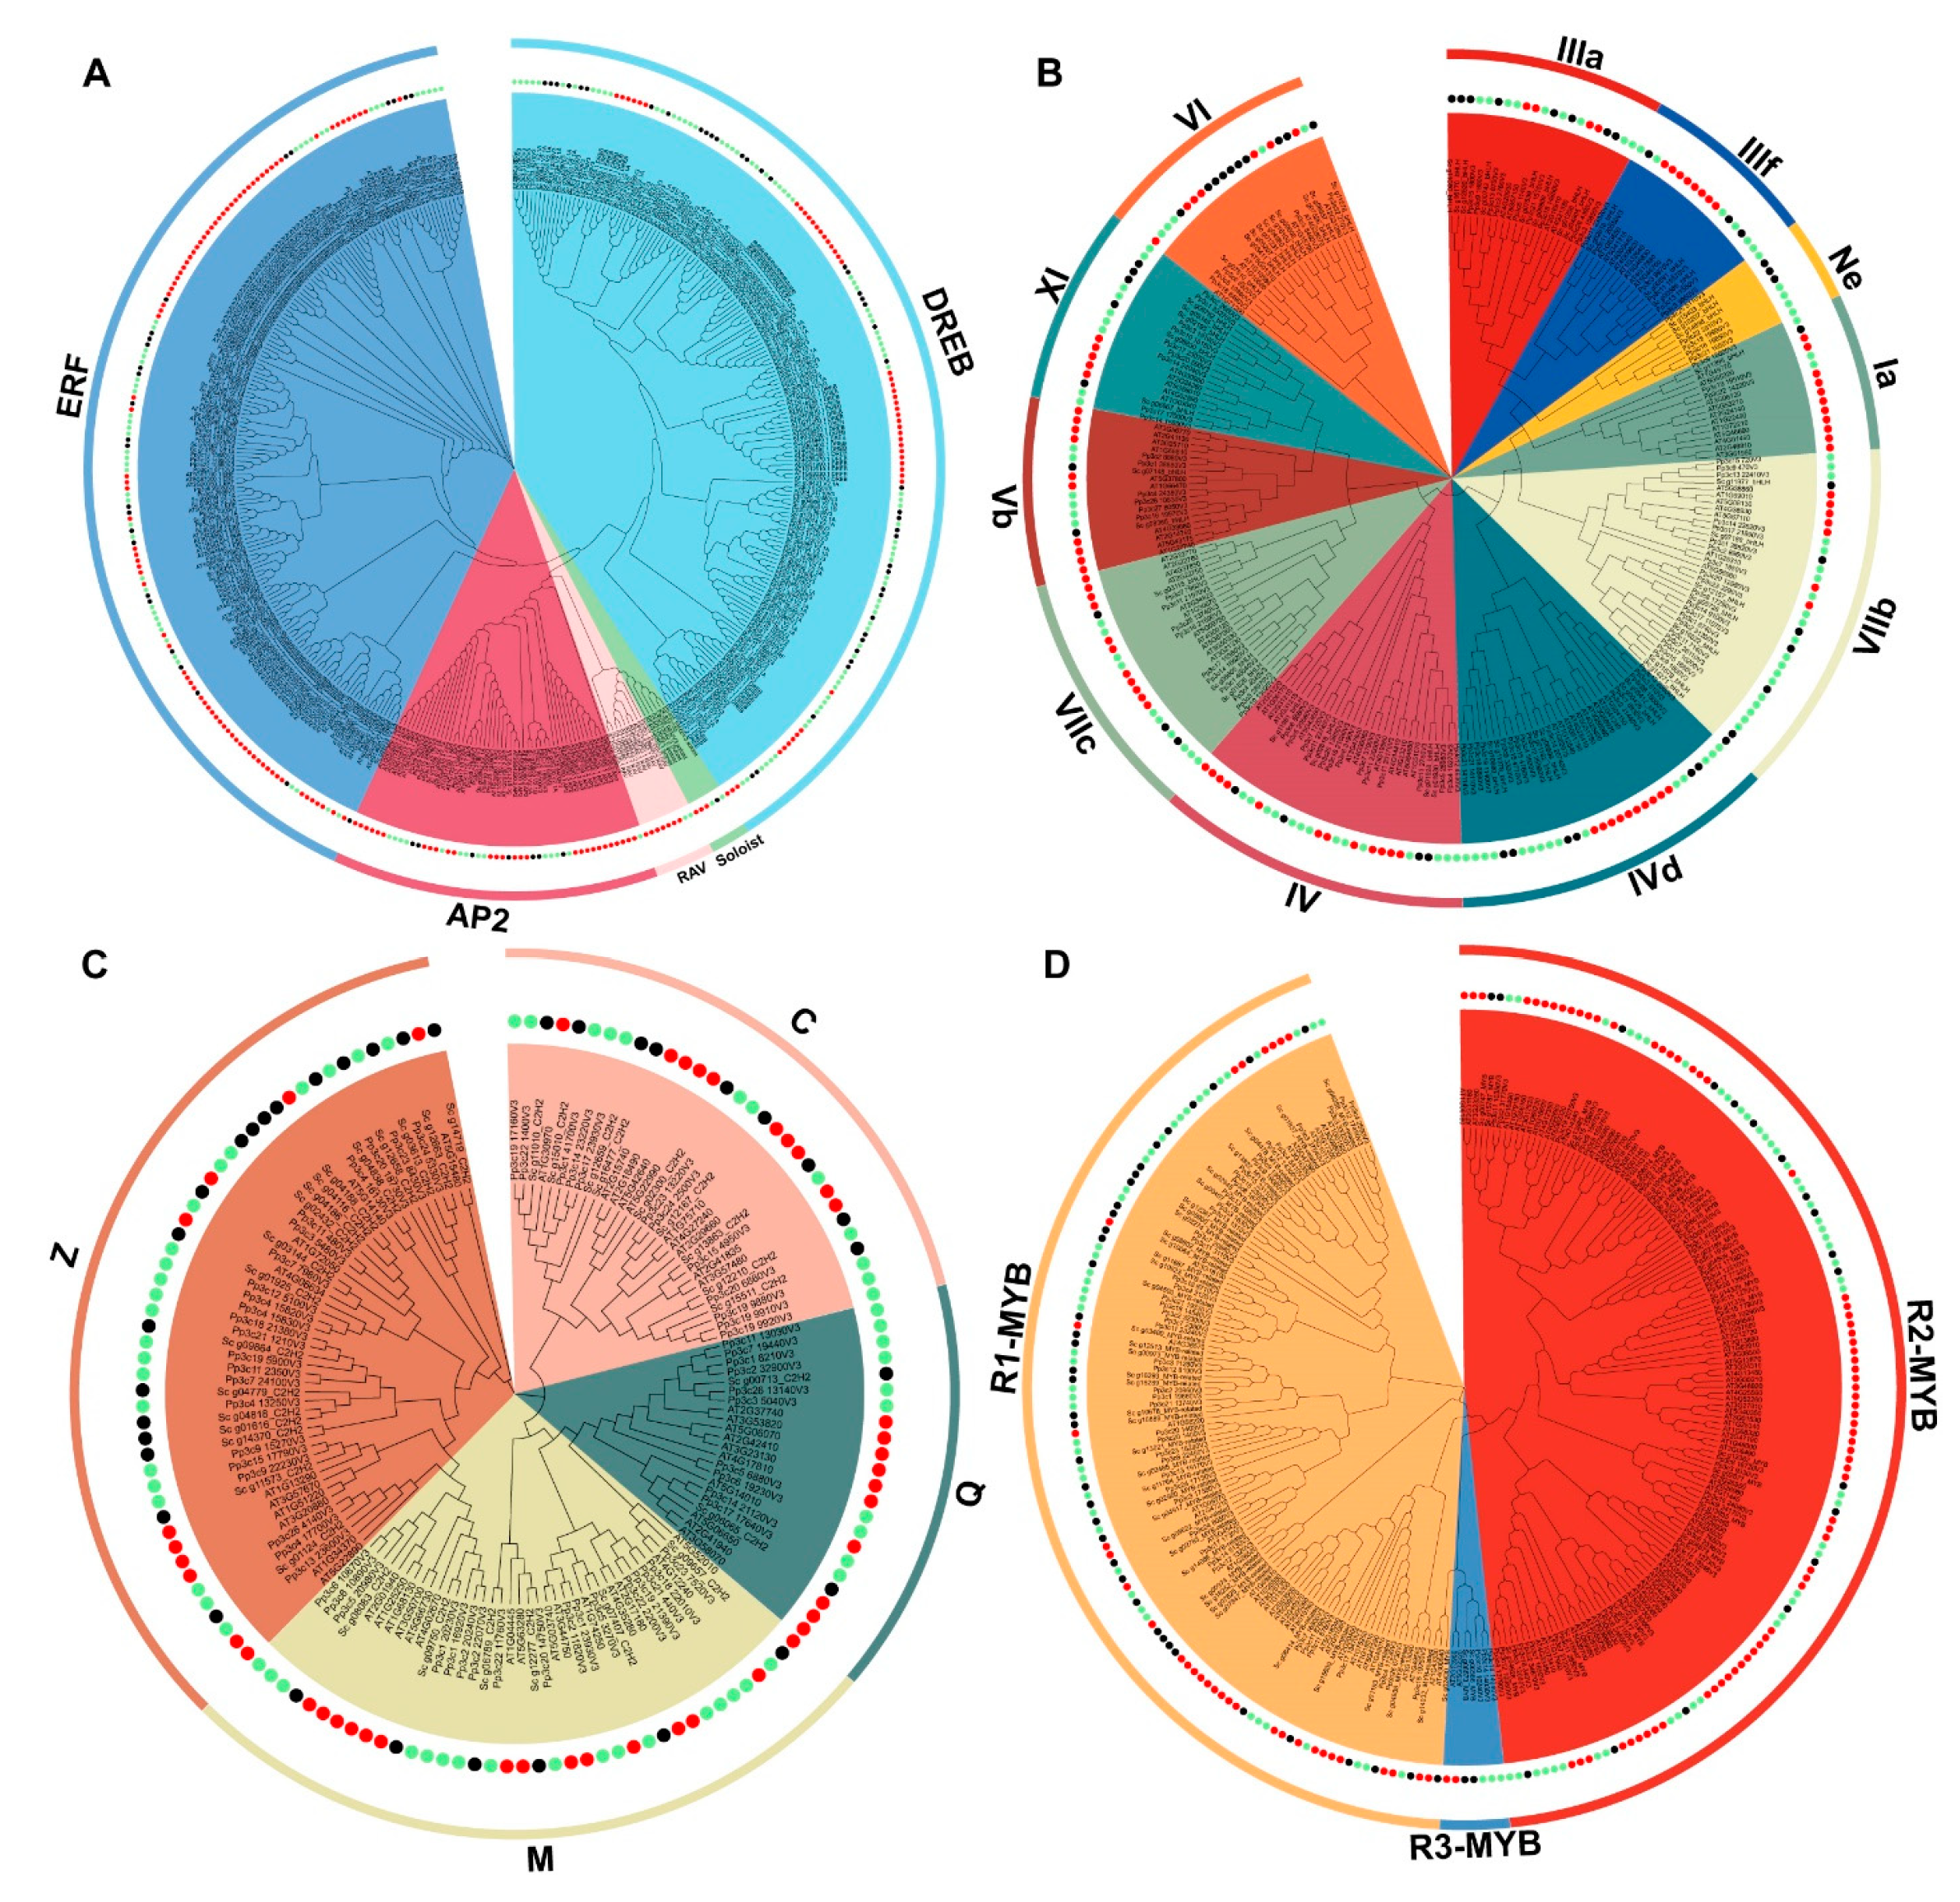
To study the molecular evolutionary relationships of AP2/ERF, MYB, bHLH, and C2H2-zinc finger proteins in S. caninervis, Arabidopsis and P. patens TFs were used to generate phylogenetic tree analysis with the neighbor-joining (NJ) method. Based on unrooted phylogeny tree analysis, the AP2/ERF, MYB, bHLH, and C2H2-zinc finger members were divided into different subgroups (Figure 4). The results showed that there was an unequal representation of the TF proteins from the three species within the specific subgroup (Figure 4). Based on the tree topology and sequence similarities, the AP2/ERF TF family was assigned to the AP2, DREB, ERF, RAV, and soloist subfamilies (Figure 4A). To classify these S. caninervis subfamilies, previous annotations of the plant AP2/ERF subfamilies have been considered [34,35]. The DREB subfamily had the most AP2/ERF members (S. caninervis (41), A. thaliana (48), and P. patens (75) genes) followed by The ERF subfamily (S. caninervis (26), A. thaliana (84) and P. patens (38) genes), and AP2 subfamily (S. caninervis (7), A. thaliana (28) and P. patens (14) genes). However, the lowest number of AP2/ERF genes belonged to the RAV subfamily (A. thaliana (7) and P. patens (2) genes), and AP2/ERF genes were assigned to the soloist subfamily (S. caninervis (1), A. thaliana (3) and P. patens (2) genes) (Figure 4A). Eleven bHLH family subgroups were identified and designated as 1a-NE (Figure 4B). To annotate these S. caninervis bHLH subgroups, we consider the earlier annotation of the Arabidopsis bHLH subfamilies as proposed by Pires and Dolan [36]. Ten subgroups (Ia to IX) contained bHLH genes from three plant species, and the VIIb subgroup had the highest number of genes with 34, followed by IVd and IV with 30 and 29 genes, respectively (Figure 4B). Whereas the Ne subgroup contained the lowest members, with only nine genes from desert mosses (S. caninervis (three genes) and P. patens (six genes)), indicating that this subgroup may have losses in the vascular plant genome. The C2H2-zinc finger family was categorized into four main groups: Q, M, Z, and C (Figure 4C). The number of genes in the C2H2-zinc finger family varied by group. Group Z contained the largest number of genes (S. caninervis (18), A. thaliana (10), and P. patens (22) genes), followed by groups M (S. caninervis (6), A. thaliana (15) and P. patens (17)) and C (S. caninervis (9), A. thaliana (10) and P. patens (12) genes). On the other hand, the lowest numbers of C2H2-zinc finger genes were found in group Q (two S. caninervis, 10 A. thaliana and 10 P. patens genes). MYB TF family is divided into three major subfamilies including 1R-MYB S. caninervis (37), A. thaliana (67) and P. patens (47)), 2R-MYB S. caninervis (19), A. thaliana (33) and P. patens (44)) and 3R-MYB (S. caninervis (2), A. thaliana (2) and P. patens (3)) (Figure 4D). MYB protein domains were specific to distinctive subfamilies, indicative of a particular role of these subgroups. Our results suggest that 1R-MYB is functionally important and evolutionarily conserved in S. caninervis. Importantly, several TF gene homologous groups were gathered by plant species within a particular subgroup, which potentially referred to that plant species (Figure 4).

2.5. Protein-Protein Interactions Analysis of the Top Four TF Families

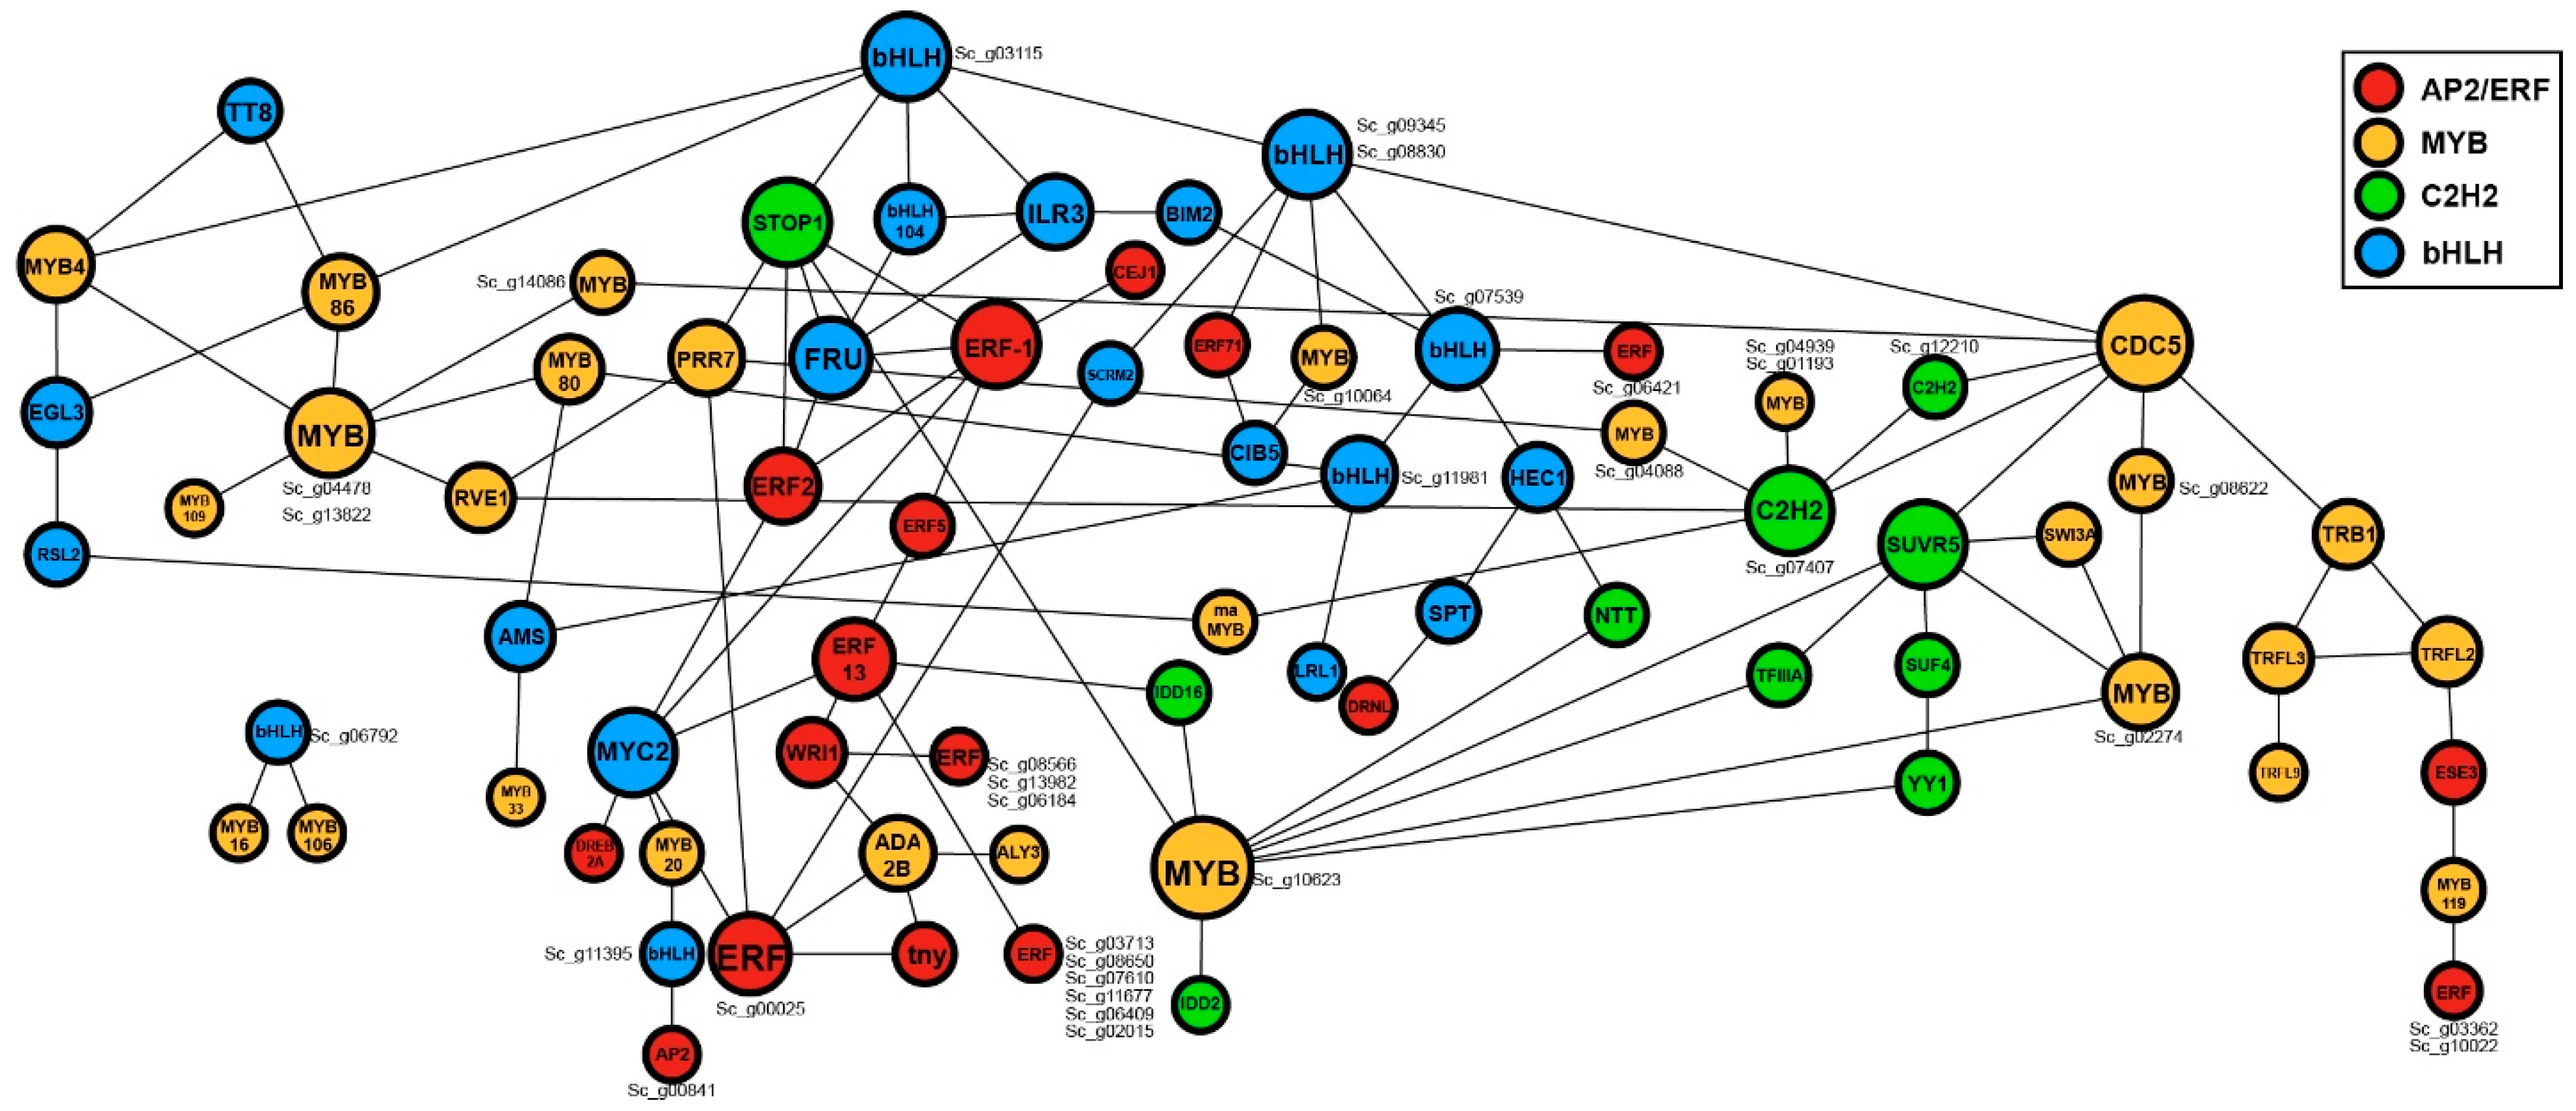
Protein-protein interaction is expressly important for gaining more insight into the functional roles of the proteins. To systematically examine the protein network interactions of S. caninervis TFs, we selected four overrepresented TF families (AP2/ERF, MYB, bHLH, and C2H2-zinc finger). The results found that 169 TFs (63 AP2/ERF, 49 MYB, 37 bHLH, and 20 C2H2-zinc finger members) potentially interacted according to their closer homologs in Arabidopsis (Figure 5 and Table S5). Apart from their regulatory functions in a specific pathway, the majority of TFs (AP2/ERF, MYB, bHLH, and C2H2-zinc finger) exhibited interaction network characteristics (Figure 5) allowing them to be involved in a wide variety of abiotic stress tolerance [37,38,39]. In this network, many TFs interact with multiple TFs that are not only in the same family but also from different families. ERF-1 (Sc_g15827_ERF, Sc_g15828_ERF, Sc_g00099_ERF, Sc_g04891_ERF, Sc_g08334_ERF, Sc_g14120_ERF and Sc_g00444_ERF) physically interacted with EFR-2 (Sc_g04542_ERF), CEJ1 (Sc_g02134_ERF), EFR-5 (Sc_g05418_ERF), FRU (Sc_g00742_bHLH), MYC2 (Sc_g00589_bHLH, Sc_g00591_bHLH and Sc_g00606_bHLH) and STOP1 (Sc_g01124_C2H2) (Figure 5 and Table S5). MYC2 potentially interacted with five members of ERFs (EFR-1, EFR-5, EFR-13, Sc_g00025_ERF and DREB2A (Sc_g02107_ERF) and MYB20 (Sc_g13885_MYB). bHLH_AT4G37850 (Sc_g03115_bHLH) physically interacted with bHLH_AT1G68920 (Sc_g09345_bHLH and Sc_g08830_bHLH), bHLH104 (Sc_g01930_bHLH), ILR3 (Sc_g01928_bHLH), STOP1 (Sc_g01124_C2H2), MYB4 (Sc_g15787_MYB and Sc_g00747_MYB) and MYB86 (Sc_g11316_MYB and Sc_g14329_MYB) (Figure 5 and Table S1). CDC5 (Sc_g04917_MYB) importantly interacted with MYB-related_AT2G47210 (Sc_g08622_MYB-related), TRB1 (Sc_g00407_MYB-related), AT3G11450 (Sc_g14086_MYB-related), SUVR5 (Sc_g15511_C2H2), AT5G26610 (Sc_g12210_C2H2), MYB-related_AT1G74250 (Sc_g07407_C2H2) and bHLH_AT1G68920 (Sc_g09345_bHLH and Sc_g08830_bHLH). STOP1 (Sc_g01124_C2H2) probably interacted with two ERF members (ERF-1, ERF-2), two bHLH genes (bHLH_AT4G37850 (Sc_g03115_bHLH) and FRU (Sc_g00742_bHLH) and one member of MYB (PRR7 (Sc_g07847_MYB).

2.6. MicroRNAs and Their Target Transcription Factors

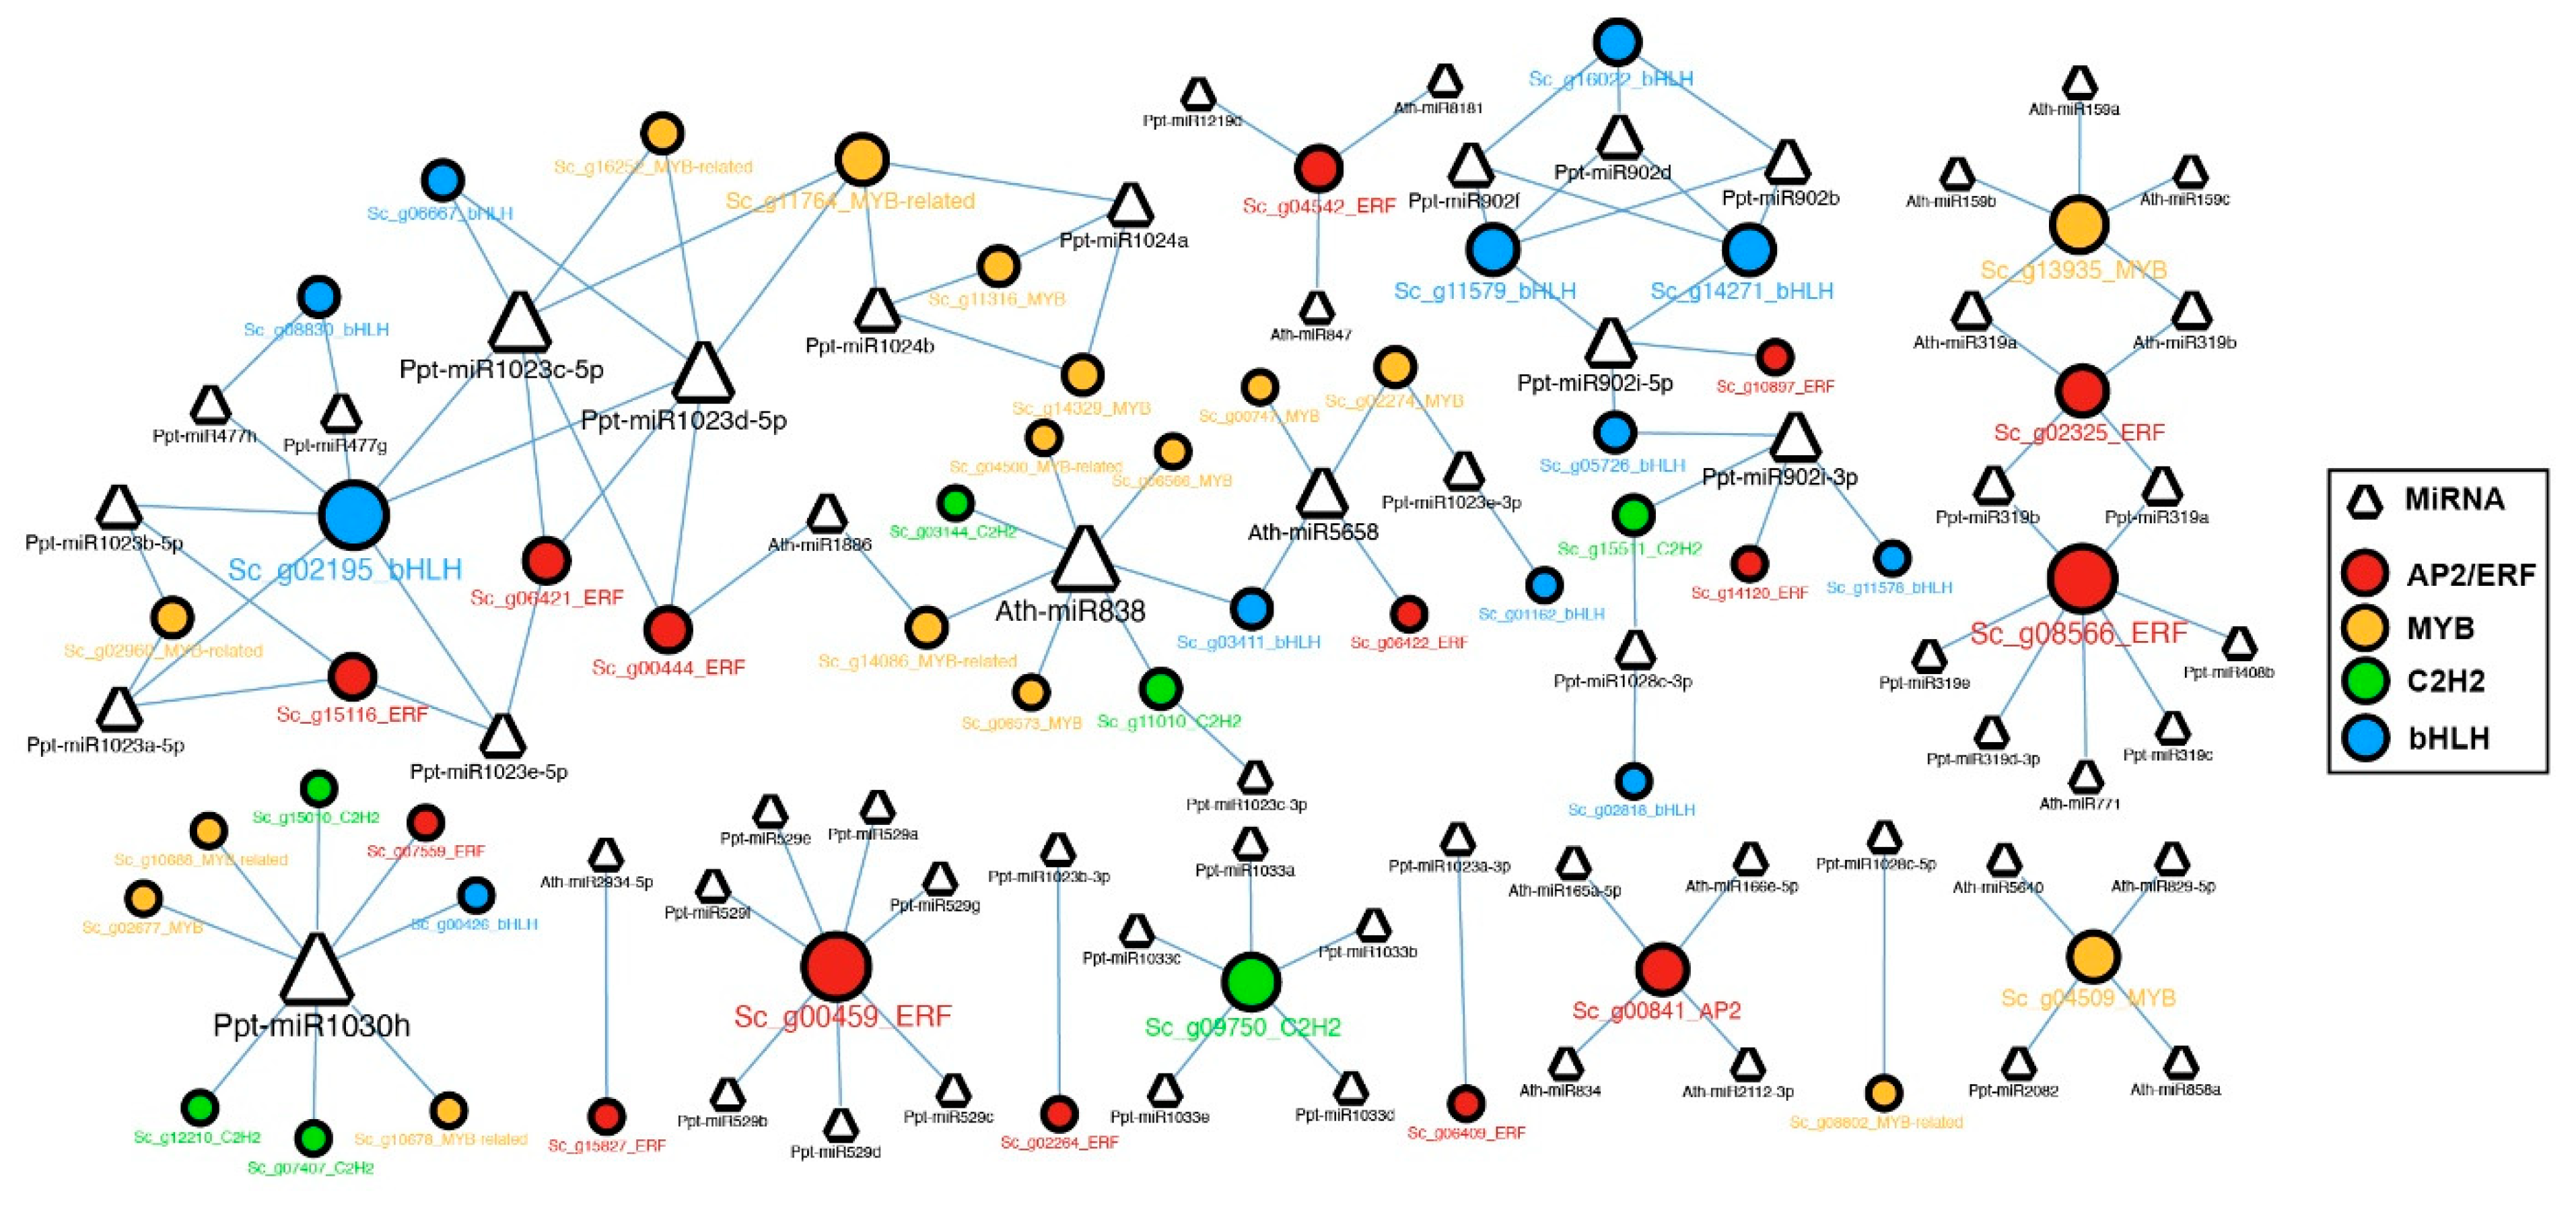
To investigate the molecular function of TF genes in S. caninervis, we used predictive miRNAs (http://plantgrn.noble.org/psRNATarget) (accessed on 1 February 2023) [40], PmiREN (https://www.pmiren.com) (accessed on 1 February 2023) [41] and target genes (http://bioinformatics.psb.ugent.be/webtools/tapir/) (accessed on 1 February 2023) to examine if some TF genes are targeted by miRNAs. The result found that a total of S. caninervis 46 TFs were identified as being targeted by 43 miRNAs (eight miRNAs from Arabidopsis and 35 miRNAs from P. patens) (Figure 6). Several TFs were targeted by at least one miRNA (Figure 6); for example, Sc_g09750_C2H2 was targeted by five miRNAs (Ppt-miR1033a,b,c,d,e), Sc_g04509_MYB targeted by four miRNAs (Ath-miR5640, Ath-miR829-5p, Ath-miR858a, and Ppt-miR2082) and Sc_g13935_MYB targeted by five miRNAs (Ath-miR159a,b.c and Ath-miR319a,b). However, Ath-miR1886 possibly targeted the Sc_g00444_ERF gene, and Ath-miR5658 targeted four TF members (Sc_g00747_MYB, Sc_g03411_bHLH, Sc_g06422_ERF and Sc_g02274_MYB) (Figure 6 and Table S6).

2.7. Expression Profile Analysis of Four Overrepresented TFs under Chilling and Freezing Stresses Based on Transcriptome Data

Transcriptome results showed that the majority of the ScAP2/ERF, MYB, bHLH, and C2H2 genes in S. caninervis are responsive to cold stress (chilling and freezing). A total of 166 TFs from 222 ScAP2/ERF, MYB, bHLH, and C2H2 genes were significantly changed in transcript abundances under cold stress at 1, 8, and 24 h as compared to the control (0 h) (Figure 7A–D). A significant number (60/75) of AP2/ERF (7 AP2 and 53 ERFs) genes were induced by chilling and freezing stresses at different time-series in comparison with the control (Figure 7A), suggesting that these genes might play an important role in cold responses. Under freezing stress, the transcript performances of Sc_g02134_ERF, Sc_g06184_ERF, and Sc_g02264_ERF were significantly up-regulated at 8 and 24 h. However, Sc_g10553_AP2, Sc_g08566_ERF, Sc_g10022_ERF, and Sc_g10746_ERF were significantly down-regulated during cold exposure in the stressed S. caninervis, implying their functional roles in adaptation mechanisms to cold conditions (Figure 7A). Under cold exposure, a total of 36 (36/52) bHLH genes were differentially expressed in the stressed S. caninervis in comparison with the control (Figure 7B). Sc_g00426_bHLH, Sc_g05412_bHLH, and Sc_g11080_bHLH were significantly up-regulated while, Sc_g12157_bHLH, Sc_g16170_bHLH Sc_g02618_bHLH, and Sc_g02818_bHLH were down-regulated in the stressed S. caninervis by cold treatments at 1, 8 and 24 h (Figure 7B). The great number of differentially expressed MYB TFs (41/58) (17 MYB and 24 MYB-related) genes revealed low transcript levels in S. caninervis under cold conditions (Figure 7D). Sc_g04509_MYB, Sc_g12513_MYB-related, Sc_g14329_MYB, and Sc_g04500_MYB-related transcript abundances were down-regulated in response to cold stress (Figure 7D). The transcript levels of Sc_g13885_MYB and Sc_g15608_MYB were up-regulated under chilling stress by more than 1.5 fold-changes, and Sc_g01837_MYB-related was up-regulated under freezing stress at 8 and 24 h by more than 2.5 fold-changes (Figure 7D), suggesting that these genes might play an important role in regulating chilling and freezing stress tolerance. A total of 23 (23/35) C2H2-zinc finger genes were relatively induced in transcript abundances under chilling and freezing stresses at different time points (Figure 7C). Sc_g09750_C2H2 and Sc_g12659_C2H2 transcripts were up-regulated in response to S. caninervis cold stress tolerance, indicating that these transcription factors may also be associated with the regulation of cold stress tolerance.

2.8. Expression Profile Analysis of Four Overrepresented TFs under Dehydration-Rehydration Stress Based on Transcriptome Data

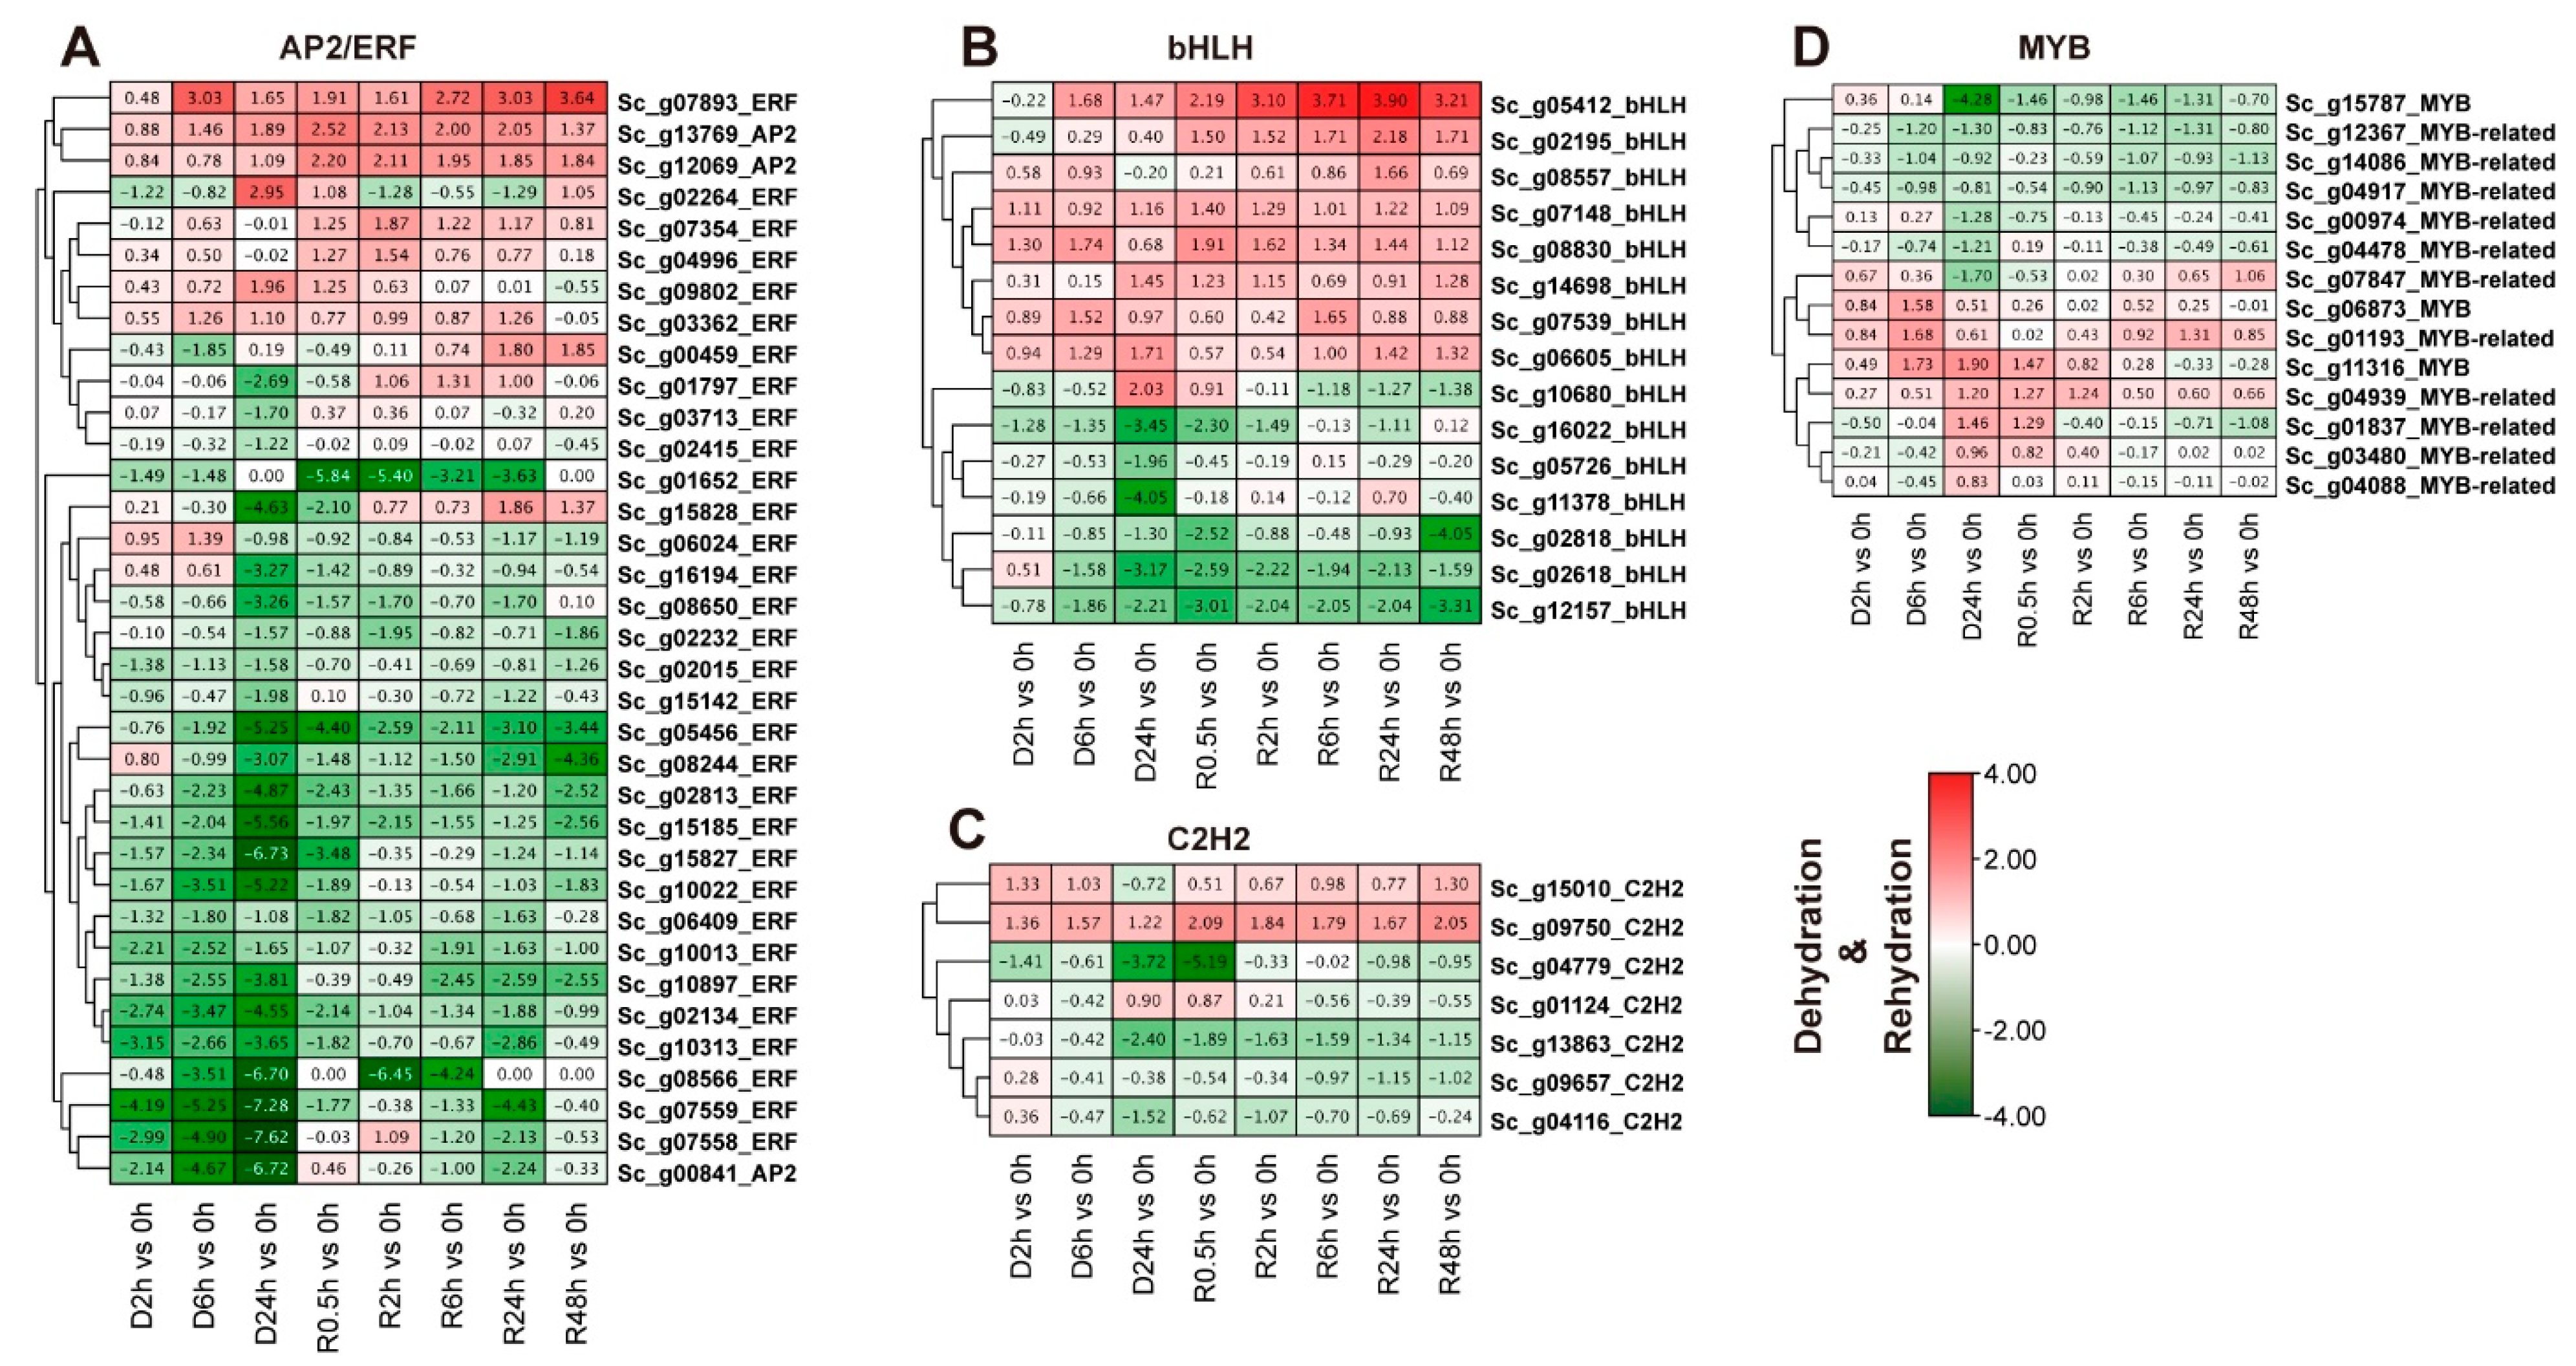
The transcript abundance changes of four overrepresented ScTF families were further investigated in response to dehydration and rehydration stresses. In Figure 7, only 71 TFs out of 220 had significantly different transcript abundances at various times of D-R treatment in S. caninervis as compared to the control (0 h). Approximately half (35/76) of the AP2/ERF (3 AP2 and 32 ERF TFs) genes were differentially expressed in S. caninervis response to D-R stress (Figure 8A). The transcript abundances of Sc_g02813-ERF, Sc_g05456_ERF, Sc_g15827_ERF, Sc_g00841_ERF, Sc_g02134_ERF, Sc_g07559_ERF, Sc_g10013_ERF, Sc_g07559_ERF, and Sc_g15185_ERF were significantly down-regulated in the treated S. caninervis (Figure 8B). On the other hand, Sc_g07893_ERF, Sc_g13769_AP2, and Sc_g12069_AP2 were up-regulated in the treated S. caninervis at different time-series of the D-R process as compared to the control (Figure 8A). The bHLH family has 15 differentially expressed genes, the majority of these genes were up-regulated in response to D-R stress (Figure 8B). For example, the transcript levels of the Sc_g05412_bHLH, Sc_g08830_bHLH, Sc_g06605_bHLH, Sc_g14698_bHLH, and Sc_g07539_bHLH genes were relatively increased under D-R stress. Sc_g12157_bHLH and Sc_g02818_bHLH transcripts were down-regulated in the treated S. caninervis by desiccation stress. Within the MYB family, 14 MYB (3 MYB and 11 MYB-related TFs) genes were responsive to D-R stress (Figure 8B). The transcript abundances of Sc_g15787_MYB, Sc_g04917_MYB-related, and Sc_g14086_MYB-related were down-regulated, but Sc_g04939_MYB_related and Sc_g01193_MYB_related were up-regulated in stressed S. caninervis under D-R condition. In total, the transcript abundance of seven C2H2-zinc finger genes varied relatively in abundance patterns depending on the D-R condition (Figure 8C). (Sc_g09750_C2H2 and Sc_g15010_C2H2 were up-regulated, while Sc_g04779_C2H2 and Sc_g_1363_C2H2 were down-regulated in stressed S. caninervis by rehydration and dehydration at 2 and 6 h (Figure 8D).

2.9. Validation of TFs Transcript Abundance by RT-qPCR

To further explore the functional roles of these TF families in response to cold and desiccation stresses, we selected nine TF genes including, four bHLH, two MYB, two C2H2-zinc fingers, and one AP2/ERF, with different transcript abundances for verification by RT-qPCR assay (Figure 9). All of the selected TF genes showed a significant change in transcript abundance at different time-series of chilling and freezing conditions, indicating that these TFs may be involved in the S. caninervis cold stress response. The transcript abundance of Sc_g02618_bHLH and Sc_g08556_ERF was significantly elevated to about 10-fold and 25-fold at 1 h under chilling stress, while their expression patterns were effectively induced by freezing stress (Figure 9). The transcript abundances of Sc_g14032_MYB, Sc_g00426-bHLH, Sc_g09750_C2H2, Sc_g04509_MYB, and Sc_g05412_bHLH were significantly increased at various times of cold stress but their relative expression patterns under freezing stress were higher than those under chilling stress. Among them, the transcript levels of Sc_g09750_C2H2 and Sc_g05412_bHLH were dramatically increased to about 500-fold at 24 h under freezing stress (Figure 9). The transcript level of Sc_g12157_bHLH was significantly decreased under chilling stress, whereas it was significantly increased with freezing stress at 1 h. Sc_g04116_C2H2 was highly increased with the influence of chilling at 1h and significantly decreased with chilling stress at 8 and 24 h and freezing stress (Figure 9).
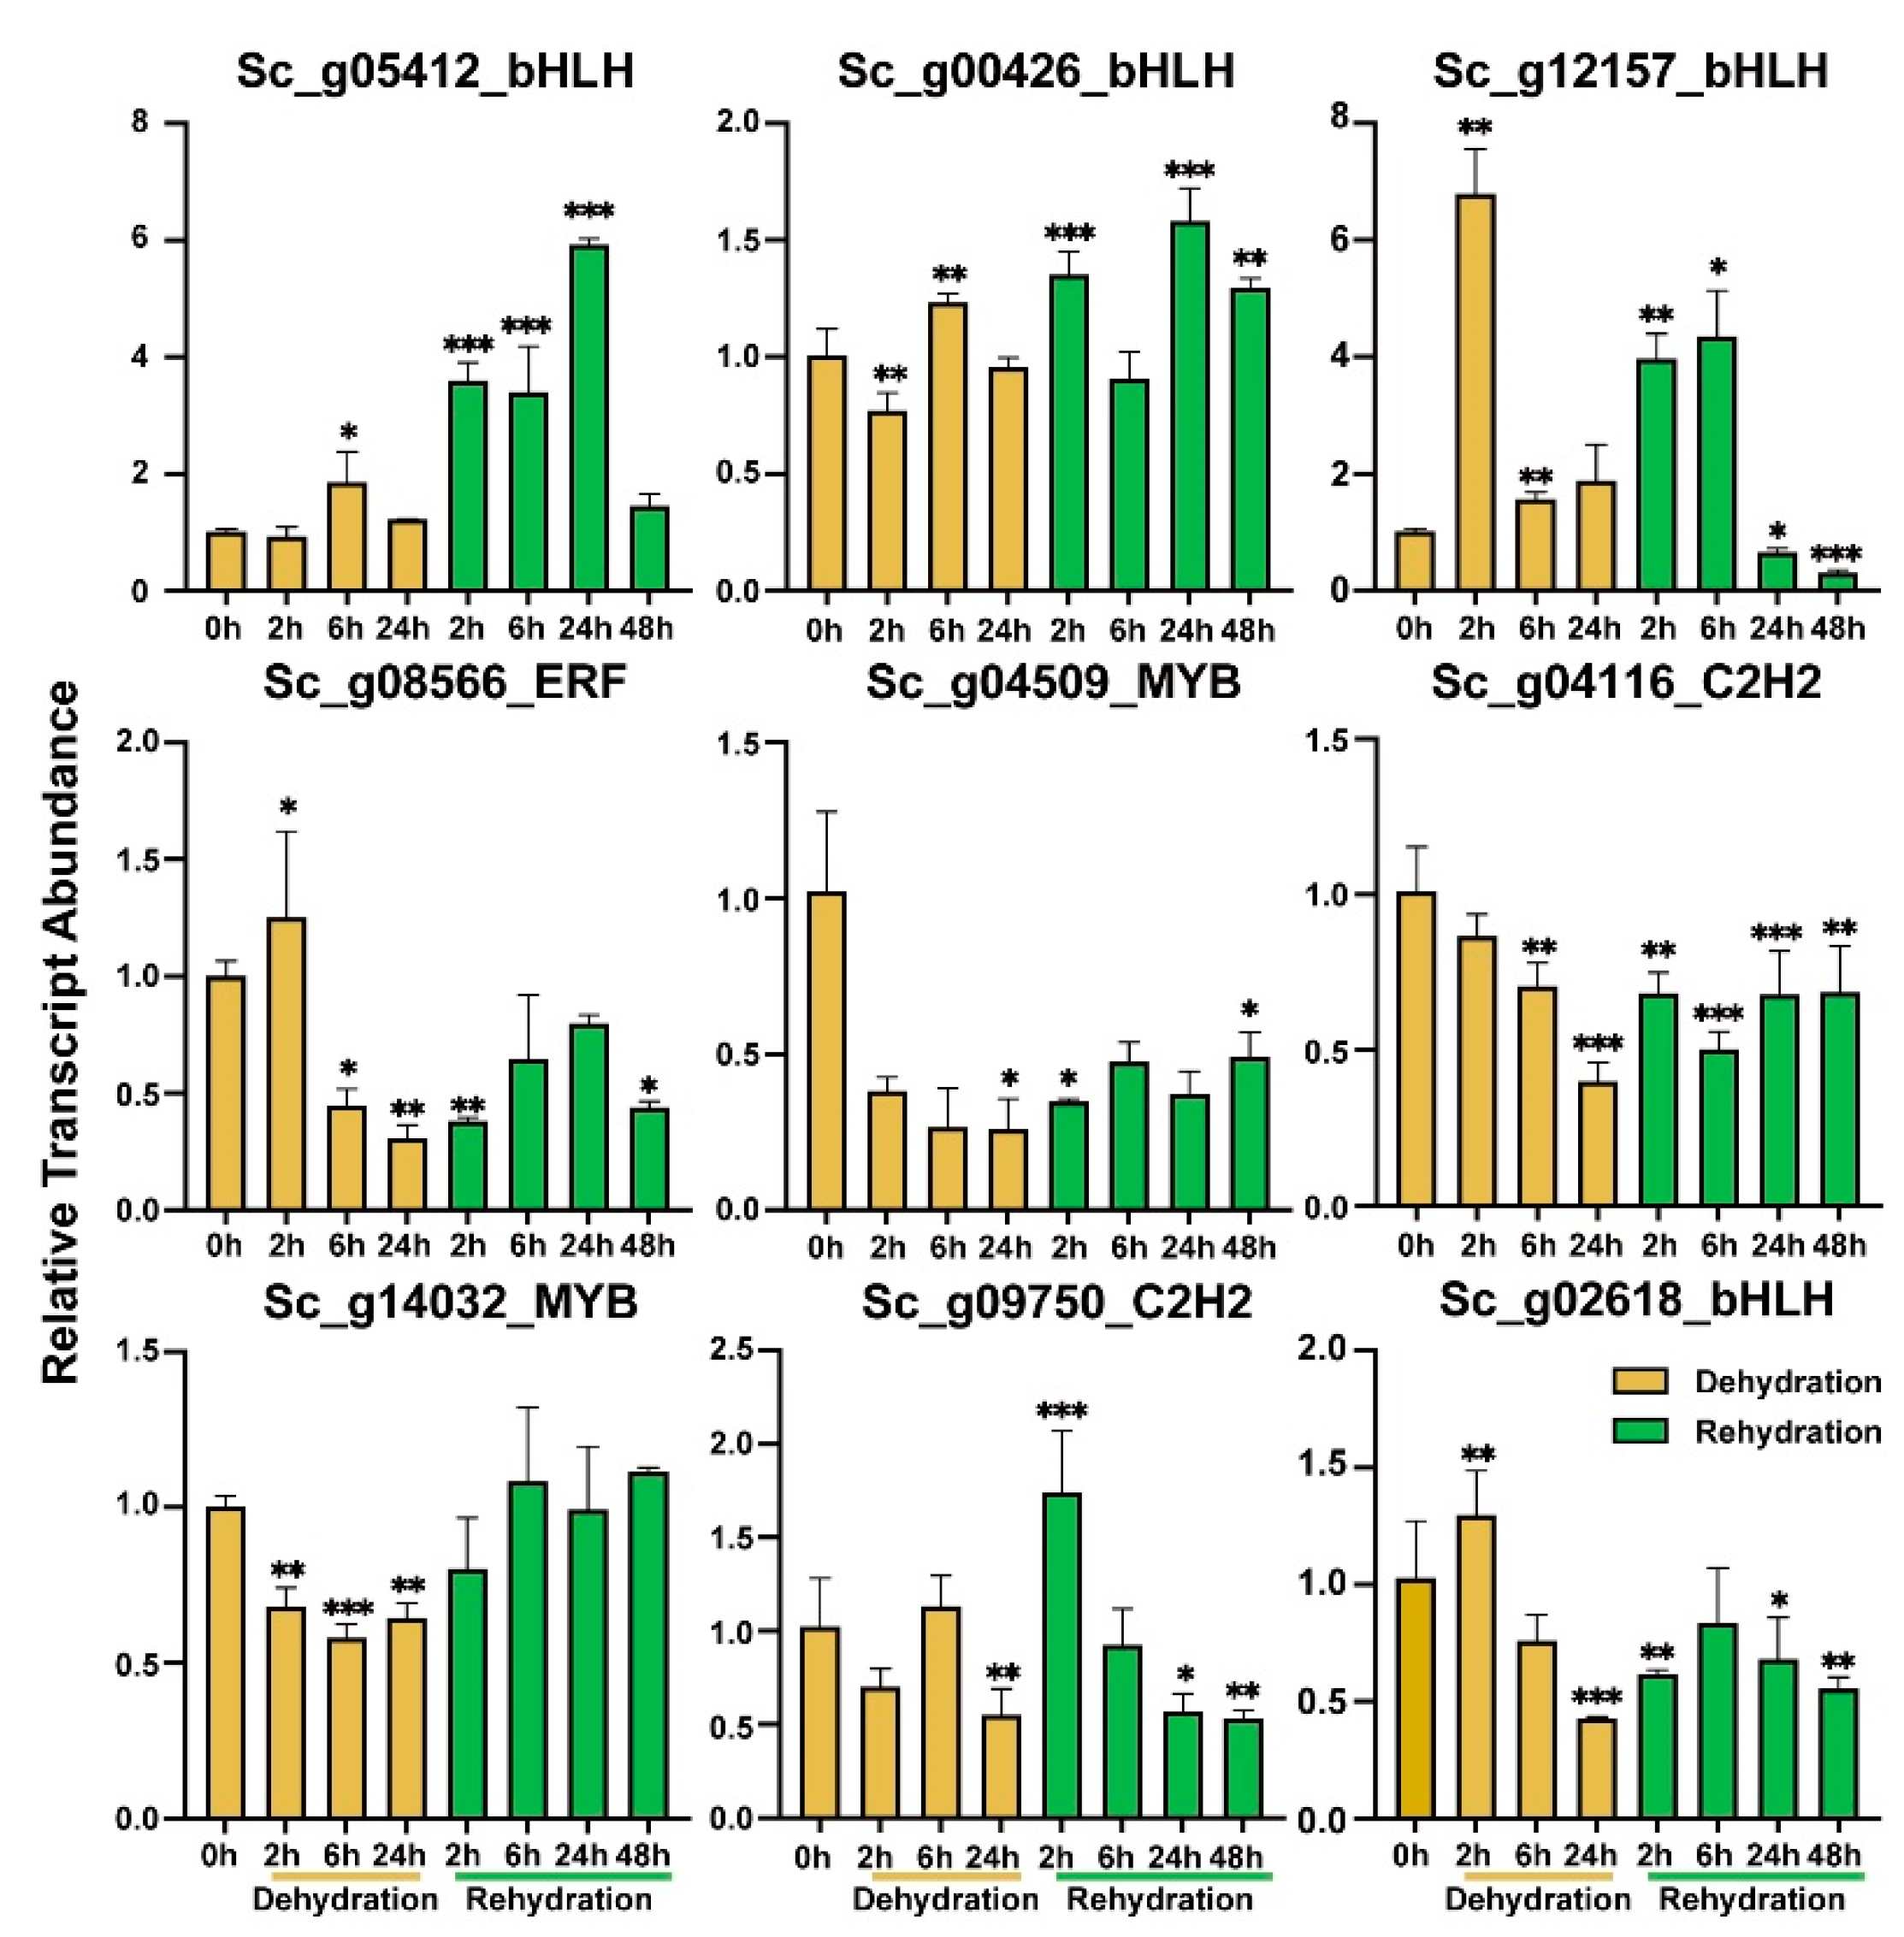
The relative transcript abundance of the nine selected TFs under dehydration stress and rehydration conditions at different time points was also examined by RT-qPCR (Figure 10). All tested S. caninervis TFs responded to the D-R condition (Figure 10). The transcript abundance of three ScbHLH genes (Sc_g05412_bHLH and Sc_g00426_bHLH) was increased in stressed S. caninervis under dehydration at 6 and 24 h, and rehydration conditions (Figure 10). Sc_g12157_bHLH transcript abundance increased during D-R stress (2 and 6 h) but it was gradually reduced in response to rehydration conditions at 24 and 48 h. The transcript abundance of Sc_g08556_ERF and Sc_g02618_bHLH was significantly elevated at 2 h under dehydration stress but dramatically reduced with dehydration (6 and 24 h) and rehydration conditions. The transcript abundance of Sc_g04509_MYB and Sc_g04116_C2H2 was significantly reduced with dehydration and rehydration stresses (Figure 10). The transcript abundance of Sc_g14032_MYB significantly decreased in response to dehydration stress but did not change significantly during the rehydration process. The Sc_g09750_C2H2 transcript pattern was significantly increased at 2 h of dehydration stress and decreased in response to dehydration stress at 24 h and dehydration process at 24 and 48 h (Figure 10).

3. Discussion

3.1. Genome-Wide Identification and Comparative Analysis of TFs

TFs can recognize and bind to a specific sequence of DNA-binding and interact with various proteins in the transcriptional process to regulate the expression pattern of a great number of genes that are involved in plant growth and survival strategies under different stress conditions [42,43]. In this study, the identification and characterization of TF members in S. caninervis based on the genome were completed. We analyzed the TFs that existed in S. caninervis and analyzed how TF functions and molecular roles might be explained in this unique model plant. More remarkably, we determined protein domain specificity for diverse TF members related to various families (Figure 1 and Figure S1) for which there was little information available in S. caninervis. Finally, 591 TF members were identified in S. caninervis and distributed among 52 TF families. The percentage of S. caninervis TF members (3.6%) was significantly lower than that in vascular plants, which ranged from 6% to 10% of the total genes [10]. The variation in TF numbers among different plants provided a stronger sign of involvement in specific functional roles during plant growth, development, and response to diverse stresses. The complication of multi-cellular organism evolution events is associated with an increase in the number of TF member families and regulatory protein expansion [44]. Meanwhile, the identified S. caninervis TF numbers were significantly lower than those in P. patens, this may be partially explained by the fact that S. caninervis has experienced a single whole genome duplication (WGD) [29], whereas, P. patens has undergone two WGD events [45]. The AP2/ERF family is one of the largest TF families in moss species in comparison with algae and higher plants (Figure 1). In S. caninervis, AP2/ERF family is divided into four subfamilies including AP2, ERF, DREB, and soloist, and the absence of RAV genes. Furthermore, the ratio of the ERF subfamily is relatively increased, while the proportion of theAP2 subfamily is reduced in S. caninervis as compared with A. thaliana, P. trichocarpa, O. sativa, and Z. mays (Table S2). This result is in agreement with our previous reports [46]. The MYB family is the second largest TF group in S. caninervis and is classified into three distinct subgroups including MYB-R1, MYB-R2, and MYB-R3, and lacks the MYB-R subgroup. The proportion of MYB-R1 is relatively larger in S. caninervis as compared to V. carteri, P. patens, O. sativa, Z. mays, A. thaliana, upland cotton, and B. napus (Table S3), while, the majority of MYB genes are related to the MYB-R2 subgroup in higher plants [30]. MYB protein members within the same subgroups had the same protein domain in terms of R repeat and distribution, which suggested that the MYB TF family within a specific subfamily, could share a similar molecular function (Table S3). This result was in agreement with a prior report that concluded that members of the MYB TF family with similar protein compositions were classified into the same subgroup [47]. bHLH TFs are characterized by a basic helix–loop–helix domain with two parts, a basic DNA binding domain at the N-terminal and a protein interaction domain at the C-terminal [44]. Previous results showed that bHLH TFs in several plant species were gradually increased from algae to plants in association with increased plant adaptation complexities [48]. In the S. caninervis genome, the bHLH family is the third-largest TF member, which can be divided into 11 groups based on evolutionary conservation. According to protein domain analysis, C2H2-zinc finger TFs in S. caninervis were classified into four major subgroups including Q-type, M-type, Z-type, and C-type (Figure 4C). The majority of C2H2-zinc finger genes in this study belonged to groups Z and C, in contrast to earlier findings in higher plants [49].

3.2. The Functional Prediction of the Top Four TF Families by Comprehensive Analysis

The functional roles of most TFs remain largely unknown; therefore, we used GO analysis and the KEGG pathway to investigate the biological roles of TFs in the regulation of molecular responses in S. caninervis. Bioinformatics analysis revealed that TFs were potentially associated with the regulation of transcription, DNA-templated, RNA process, gene expression, binding activities, plant hormone signal transduction, circadian rhythm–plant, and spliceosome (Figure 3A). These results indicated that S. caninervis TF genes may play important roles in the regulation of gene expression and various hormone signaling pathways in plant cell responses to changes in environmental stimuli. In this investigation, we observed a strong overrepresentation of ABRE and CGTCA-motif/TGACG-motif elements in the promoter regions of AP2/ERFs and C2H2-zinc finger TF families (Table S5), suggesting that ABA and JA might be involved in the regulation of stress responses in S. caninervis [50]. Meanwhile, several AP2/ERF, MYB, and bHLH promoter regions have a mixture of diverse hormones-related cis-regulatory elements (Figure 3B and Table S5), supporting the functional role of TFs in the regulation of various hormone signaling pathways [51,52]. AP2/ERFs are regulated by hormone pathways and modulate hormone signaling and biosynthesis in plants [53]. The outcome of this examination showed that several cis-regulatory elements related to TFs could be involved in regulating abiotic stress responses in S. caninervis.
TFs interact with other proteins in the regulation of transcriptional processes [54]. The results of protein-protein interactions found that the majority of ScTFs physically interacted within the family as well as with other TF families (Figure 5). In plants, AP2/ERF, bHLH, and MYB are essential abiotic stress-related TF families [51,55]. ERF1 is a key module in ethylene signaling, playing an important function in stress responses and participating in the delay in flowering time in Arabidopsis [56,57]. In plant-pathogen interactions, ERF1 physically integrates ethylene and JA signaling to trigger the expression levels of defense-related genes [58]. It was found that ERF1 probably targets several stress-related genes in response to various abiotic stress [59]. MYC2 is associated with the regulation of abiotic stress responses such as drought and low temperatures [60]. In this study, ScERF-1 and ScMYC2 have the greatest number of potential interacting proteins with high similarity. ScERF-1 could interact with six TFs belonging to three TF families including, AP2/ERF (EFR-2, CEJ1, and EFR-5), bHLH (FRU and MYC2), and C2H2-zinc finger (STOP1), and these TF members also interacted with other TF families. ScMYC2 potentially interacted with five members of ERFs (EFR-1, EFR-5, EFR-13, Sc_g00025_ERF, and DREB2A) and one MYB gene; our results suggest that ScERF1 and ScMYC2 play key roles in the abiotic stress regulatory network of S. caninervis. Importantly, TFs and miRNAs can regulate each other [61], and they are involved in plant stress responses [62]. In the model plants, microRNA159 (Ath-miR159a,b,c) is a highly preserved miRNA in plants and contributes to stress responses [63]. Ath-miR5658, Ath-miR858, and Ath-miR1886 were also found to be responses to various stress tolerances [64,65,66]. In this work, we identified several miRNAs from Arabidopsis and P. patens that theoretically target overrepresented TF families in S. caninervis, similar to previous reports, stress-related miRNAs also target many TFs in S. caninervis, such as Ath-miR5658 potentially targeted four ScTFs members (Sc_g03411_bHLH, Sc_g06422_ERF, and Sc_g02274_MYB) and Ath-miR159 can specifically target Sc_g13935_MYB. Meanwhile, one TF can be regulated by many miRNAs, such as Sc_g00444_ERF which was targeted by three miRNAs and Sc_g04509_MYB was targeted by four miRNAs, implying that miRNAs might contribute to abiotic stress response regulatory network interactions in S. caninervis. Further research on the network interaction between TFs and miRNAs in S. caninervis will contribute significantly to elucidating their biological functions in abiotic stress responses.

3.3. Transcript Abundances of AP2/ERF, MYB, bHLH, and C2H2-Zinc Finger Genes Associated with Cold and Dehydration-Rehydration Stresses

The comparative analysis of single TF families indicates that transcriptional regulators are frequently specialized in specific responses to environmental stimuli [26,67,68]. Recently, extensive studies have elucidated the regulatory functions played by AP2/ERF, MYB, bHLH, and other TFs in responses to biotic and abiotic stresses in plants [48]. The majority of transcripts encoding AP2/ERF, MYB, bHLH, and C2H2 TFs were induced by both cold and D-R stress, indicating that cold and desiccation responses may share common signal transduction events. Specifically, the result also found that there are transcript TFs strongly induced by cold stress (specifically freezing) rather than D-R, such as the transcript patterns of Sc_g09750_C2H2 and Sc_g05412_bHLH dramatically increased about 500-fold at 24 h during freezing stress but only increased 6-fold during D-R stress. Some of the TFs were only induced by cold and not altered by D-R stress (Figure 9 and Figure 10), such as the transcript patterns of Sc_g06184_ERF was significantly up-regulated under freezing stress at 24 h with more than 1000 fold, while it was not induced during the D-R process (Figure 7 and Figure 8), suggesting that this gene specifically plays regulatory role in S. caninervis response to freezing stress.
Previous studies have shown that AP2/ERF members play an important role in the regulation of abiotic stress responses [69]. In the model moss P. patens, AP2/ERFs are associated with the regulation of dehydration-rehydration, light [70], and cold stress responses [71]. ScDREB genes in S. caninervis significantly respond to multiple stresses and notably enhance drought, salt, and cold stress tolerance in transgenic yeast and Arabidopsis [26], suggesting that the AP2/ERF genes play important roles in moss stress responses. In this study, among the four over-represented TF families, the AP2/ERF family was the key differentially expressed TF in S. caninervis with great signal induction and detection under both cold and D-R treatments, indicating that AP2/ERF TF family may significantly contribute to cold and desiccation stress responses. It was reported that several members of bHLH TFs are involved in the regulation of abiotic stresses, such as light [72], cold [73], drought [74], salt [75], and hormonal signals [76]. The majority of detectable bHLH genes were increased in stressed S. caninervis by cold and dehydration-rehydration processes (Figure 7 and Figure 8). RNA-seq and RT-qPCR results showed that the transcript abundances of bHLH members were strongly increased by dehydration-rehydration stress, indicating that these genes may play functional roles in responses to abiotic stress tolerance in S. caninervis. The induced abundance of transcripts encoded by specific TFs could be reflected in the accumulation of mRNAs, which are associated with regulating the increasing abundance of cryoprotectant compounds during cold exposure [48] and dehydration responses [77]. The different expression patterns of these TFs between cold stress and desiccation stress indicated that in S. caninervis, these TFs might have multiple roles in replying to various abiotic stresses. The research findings highlight AP2/ERFs genes as important stress regulators in S. caninervis [20,48].

4. Material and Methods

4.1. Identification and Genetic Mapping of S. caninervis TFs

To identify the features of transcription factor families in S. caninervis, blast tools were used to search against the S. caninervis genome database. S. caninervis protein sequences were obtained from the National Center for Biotechnology Information (https://www.ncbi.nlm.nih.gov/genome/97510) (accessed on 1 February 2023) for systematic analysis. A local BLASTP using corresponding protein sequences of TF families was obtained from the plant TFs database (http://planttfdb.cbi.edu.cn/) (accessed on 1 February 2023) and National Center for Biotechnology Information (https://www.ncbi.nlm.nih.gov/Structure/cdd/wrpsb.cgi) (accessed on 1 February 2023). The Hidden Markov Model (HMM) profile of the TF domains was downloaded from the Pfam database (http://pfam-legacy.xfam.org) (accessed on 1 February 2023) [78]. Both methods of BLASTP were used to search against the S. caninervis proteomic database, with E-value ≤ 10−10. All the identified transcription factor sequences were systematically aligned using ClustalW alignment (https://www.ebi.ac.uk/Tools/msa/clustalw2/) (accessed on 1 February 2023) to remove the redundant sequences. Additionally, the SMART database (Simple Modular Architecture Research Tool: http://smart.embl-heidelberg.de/) (accessed on 1 February 2023) and InterPro online (http://www.ebi.ac.uk/interpro/) (accessed on 1 February 2023) were used to validate the presence of TF domains in S. caninervis and only protein sequences with known TF domains were considered for further investigation. The accuracy of TF prediction and identification was improved by setting up two rules to identify and categorize TFs into their exact TF families. First, if a protein sequence in a family or superfamily had numerous TF domains, we categorized the TFs according to the specific domain of the protein family. The second rule is that if a TF protein sequence with multiple DNA-binding domains, we classify it into the specific family with the smallest E-value in DNA-binding domain prediction. The chromosomal locations of all S. caninervis TF members were identified through BLASTN searches against the S. caninervis genome database. Map gene 2chromosome v2 (http://mg2c.iask.in/mg2c_v2.0/) (accessed on 1 February 2023) online software was used to map S. caninervis TFs into chromosomes. The input files were prepared and contained the following detailed information: S. caninervis gene ID, start and end positions of TFs, chromosome ID of TF members, and corresponding chromosomal length.

4.2. Bioinformatics Analyses of S. Caninervis TF Families

Gene Ontology (GO) enrichment analysis of TFs was implemented by the GOseq R package. GO terms with a corrected p-value less than 0.05 were considered significantly enriched. We used KOBAS software to test the statistical enrichment of S. caninervis TFs in KEGG pathways with a corrected p-value less than 0.05 was considered significantly enriched. Cis-acting regulatory elements in the promoter of each TF gene sequence (1.5 kb upstream of the translation starting region) were conducted using the PlantCARE database (http://bioinformatics.psb.ugent.be/webtools/plantcare/html/) (accessed on 1 February 2023). To investigate the evolutionary conservation of the S. caninervis top four TF families, multiple sequence alignments of S. caninervis, Arabidopsis, and P. patens TF members were conducted using ClustalW (http://www.clustal.org/clustal2/) (accessed on 1 February 2023). Phylogenetic tree analysis was implemented by MEGA 6.0 software (http://www.megasoftware.net/) (accessed on 1 February 2023) using the NJ (neighbor-joining) method with 1000 bootstrap repetitions. The phylogeny tree was completed with the following standards: Substitution, Poisson Model, data subset to use, the p-distance, pairwise deletion, and replication. Furthermore, to get more insight into the regulatory functions of four overrepresented TFs (AP2/ERF, MYB, bHLH, and C2H2-zinc finger) in the molecular mechanisms underlying visa protein-protein interaction in S. caninervis, the STRING database (https://string-db.org) (accessed on 1 February 2023) was applied to perform the protein interaction networks [79]. We submitted S. caninervis TF sequences to the STRING database to predict the protein-protein interaction based on their closer Arabidopsis protein sequences (gene similarities greater than 50% with an E-value < 10−20). In order to predict miRNAs and their TF targets, several algorithm tools were used to identify miRNAs (http://plantgrn.noble.org/psRNATarget) (accessed on 1 February 2023) [40], PmiREN (https://www.pmiren.com) (accessed on 1 February 2023) [41], and TAPIR: Target prediction for plant microRNAs (http://bioinformatics.psb.ugent.be/webtools/tapir/) (accessed on 1 February 2023).

4.3. Expression Profiling of TFs in Stressed S. caninervis by Abiotic Stress

S. caninervis gametophytes were harvested from the Gurbantunggut Desert of Xinjiang Uygur Autonomous Region of China [31,32,33,34,35]. The S. caninervis sample was placed in Petri dishes and stored in an air-dried place at room temperature for at least one week, and then the gametophytes were fully rehydrated for 24 h before stress treatment. For cold stress (chilling and freezing), hydrated gametophores were gently and slowly dried with filter paper to remove the surface water, and evenly placed in the Petri dishes and treated with chilling (4 °C) and freezing (−4 °C) stresses in an artificial climate box (LRX-580A-LED, PRANDT, Ningbo, China), using 16/8 h light/dark photo-cycles (approximately 100 μmol m−2s−1 constant light, 50% relative humidity) as compared to the control (S. caninervis grown under the normal condition at 25 °C). S. caninervis samples were collected at 0 (control), 1, 8, and 24-h of cold exposure (chilling and freezing stress). The dehydration (slow drying) treatment was completed by placing the gametophytes in small wire baskets over saturated sodium nitrite solution (67% relative humidity at 25 °C) in a sealed glass desiccator reserved in the same incubator [80] and samples were collected at 0, 2, 6, and 24-h. Rehydration treatment of S. caninervis samples was reached by placing the dehydrated gametophytes after slow drying in a new Petri dish in the incubator at 25 °C in the light and adding distilled water but not submerging moss plants to fully hydrated gametophytes, and samples were harvested at 0, 0.5, 2, 6, 24, and 48-h. Three biological replicates for each sample were collected for the experimental procedures. Cold transcriptome data (chilling and freezing stress) and desiccation transcriptome data (dehydration and rehydration) are submitted to China National GeneBank DataBase (CNGBdb) under the accession numbers (CNP0003778) and (CNP0003370), respectively. To investigate the expression patterns of TFs in S. caninervis exposed to cold (chilling and freezing), dehydration, and rehydration stress treatments in comparison with the control (0-h). We calculated the expression patterns of each TF using Fragment per Kilobase of exon model per Million mapped reads (FPKM) with Cufflinks (Version 2.1.1) [81] (http://cufflinks.cbcb.umd.edu/) (accessed on 1 February 2023). Fold changes of various TFs expressed analysis and the related statistical computations of the two pairwise comparisons were conducted with the DESeq R package (1.10.1) [82]. Benjamini’s and Hochberg’s method was used to adjust the p-value by controlling the false rate [83]. Only transcription factor genes with corrected p-value ≤ 0.05 and |log2(Fold change)| > 1 were considered as differentially expressed TFs using TBtools [84].
RT-qPCR analysis was performed on CFX-96 Real-Time System (Bio-Rad, Hercules), using SYBR Premix Ex TaqTM II (TaKaRa) to validate gene expression patterns of RNA-seq. During chilling and freezing exposures, samples were harvested at 0, 1, 8, and 24 h. Under dehydration treatment, plant samples were collected at 0, 2, 6, and 24 h. For rehydration treatment, plant samples were collected at 0, 2, 6, 24, and 48 h, and all plant samples were completed with three biological replicates. The ScTubulin was used as a reference gene for the normalization of the relative expression level of each gene [85]. The relative quantification from three biological replicates was standardized to the reference gene and calculated by the 2−ΔΔCt method [86].

5. Conclusions

Similar to other green plants, the desiccation stress-tolerant moss S. caninervis genome has significant numbers of TF families, but their ratio is less than that in higher plants. In this study, overrepresented TF families include the AP2/ERF, MYB, bHLH, and C2H2 genes, and the detailed categorization of each family is completed based on structural features. The combination of bioinformatics analysis and expression profiling of TFs in S. caninervis indicated that several members of the AP2/ERF and bHLH TFs might play a key role in the modulation of diverse pathways in response to abiotic stress tolerance. A comprehensive analysis of S. caninervis TFs and their evolutionary functions might help to elucidate the regulatory mechanism underlying abiotic stress responses in S. caninervis. Further research on functional validation of the key TFs and comparative studies with other plants will be crucial steps in understanding their molecular regulation and network interactions in response to various abiotic stresses.

Supplementary Materials

The following supporting information can be downloaded at: https://www.mdpi.com/article/10.3390/ijms24076137/s1.

Author Contributions

H.S. and X.L. designed the experiment. W.B. and R.Y. performed the experiments. H.S., W.B. and M.Z. analyzed the results. H.S. prepared the manuscript. Y.L., X.L. and D.Z. revised the manuscript. All authors have read and agreed to the published version of the manuscript.

Funding

This research was supported by The CAS President’s International Fellowship Initiative Grant (2021PB0040), Key Research Program of Frontier Sciences, Chinese Academy of Sciences (ZDBS-LY-SM009) and Natural Science Foundation of Xinjiang Uygur Autonomous Region (Grant No. 2022D01E96).

Institutional Review Board Statement

Not applicable.

Informed Consent Statement

Not applicable.

Data Availability Statement

All related data are available within the manuscript and its additional files.

Acknowledgments

The authors appreciate the CAS President’s International Fellowship Initiative Grant.

Conflicts of Interest

The authors declare no conflict of interest.

References

  1. Alejo-jacuinde, G.; Herrera-estrella, L. Exploring the High Variability of Vegetative Desiccation Tolerance in Pteridophytes. Plants 2022, 11, 1222. [Google Scholar] [CrossRef] [PubMed]
  2. Ben Rejeb, I.; Pastor, V.; Mauch-Mani, B. Plant Responses to Simultaneous Biotic and Abiotic Stress: Molecular Mechanisms. Plants 2014, 3, 458–475. [Google Scholar] [CrossRef] [PubMed] [Green Version]
  3. Anderson, J.V.; Davis, D.G. Abiotic Stress Alters Transcript Profiles and Activity of Glutathione S-Transferase, Glutathione Peroxidase, and Glutathione Reductase in Euphorbia esula. Physiol. Plant. 2004, 120, 421–433. [Google Scholar] [CrossRef] [PubMed]
  4. Nakashima, K.; Ito, Y.; Yamaguchi-Shinozaki, K. Transcriptional Regulatory Networks in Response to Abiotic Stresses in Arabidopsis and Grasses. Plant Physiol. 2009, 149, 88–95. [Google Scholar] [CrossRef] [PubMed] [Green Version]
  5. Hussain, S.S.; Kayani, M.A.; Amjad, M. Transcription Factors as Tools to Engineer Enhanced Drought Stress Tolerance in Plants. Biotechnol. Prog. 2011, 27, 297–306. [Google Scholar] [CrossRef]
  6. Riechmann, J.L.; Heard, J.; Martin, G.; Reuber, L.; Jiang, C.; Keddie, J.; Adam, L.; Pineda, O.; Ratcliffe, O.J.; Samaha, R.R.; et al. Arabidopsis Transcription Factors: Genome-Wide Comparative Analysis among Eukaryotes. Science 2000, 290, 2105–2110. [Google Scholar] [CrossRef]
  7. Ptashne, M. How eukaryotic transcriptional activators work. Nature 1988, 335, 683–689. [Google Scholar] [CrossRef]
  8. Xu, W.; Grain, D.; Bobet, S.; Le Gourrierec, J.; Thévenin, J.; Kelemen, Z.; Lepiniec, L.; Dubos, C. Complexity and Robustness of the Flavonoid Transcriptional Regulatory Network Revealed by Comprehensive Analyses of MYB-BHLH-WDR Complexes and Their Targets in Arabidopsis Seed. New Phytol. 2014, 202, 132–144. [Google Scholar] [CrossRef]
  9. Stracke, R.; Ishihara, H.; Huep, G.; Barsch, A.; Mehrtens, F.; Niehaus, K.; Weisshaar, B. Differential Regulation of Closely Related R2R3-MYB Transcription Factors Controls Flavonol Accumulation in Different Parts of the Arabidopsis thaliana Seedling. Plant J. 2007, 50, 660–677. [Google Scholar] [CrossRef] [Green Version]
  10. Franco-zorrilla, J.M.; López-vidriero, I.; Carrasco, J.L.; Godoy, M.; Vera, P.; Solano, R. DNA-Binding Specificities of Plant Transcription Factors and Their Potential to Define Target Genes. Proc. Natl. Acad. Sci. USA 2014, 111, 2367–2372. [Google Scholar] [CrossRef] [Green Version]
  11. Tian, F.; Yang, D.; Meng, Y.; Jin, J.; Gao, G. PlantRegMap: Charting Functional Regulatory Maps in Plants. Nucliec Acid Res. 2020, 48, 1104–1113. [Google Scholar] [CrossRef] [PubMed]
  12. Qu, L.J.; Zhu, Y.X. Transcription Factor Families in Arabidopsis: Major Progress and Outstanding Issues for Future Research. Curr. Opin. Plant Biol. 2006, 9, 544–549. [Google Scholar] [CrossRef] [PubMed]
  13. Chacón-Cerdas, R.; Barboza-Barquero, L.; Albertazzi, F.J.; Rivera-Méndez, W. Transcription Factors Controlling Biotic Stress Response in Potato Plants. Physiol. Mol. Plant Pathol. 2020, 112, 101527. [Google Scholar] [CrossRef]
  14. Seo, E.; Choi, D. Functional Studies of Transcription Factors Involved in Plant Defenses in the Genomics Era. Brief. Funct. Genom. 2015, 14, 260–267. [Google Scholar] [CrossRef] [PubMed] [Green Version]
  15. Zhang, J.; Fu, X.X.; Li, R.Q.; Zhao, X.; Liu, Y.; Li, M.H.; Zwaenepoel, A.; Ma, H.; Goffinet, B.; Guan, Y.L.; et al. The Hornwort Genome and Early Land Plant Evolution. Nat. Plants 2020, 6, 107–118. [Google Scholar] [CrossRef] [Green Version]
  16. Catarino, B.; Hetherington, A.J.; Emms, D.M.; Kelly, S.; Dolan, L. The Stepwise Increase in the Number of Transcription Factor Families in the Precambrian Predated the Diversification of Plants on Land. Mol. Biol. Evol. 2016, 33, 2815–2819. [Google Scholar] [CrossRef] [Green Version]
  17. Zhang, Y. The Microstructure and Formation of Biological Soil Crusts in Their Early Developmental Stage. Chin. Sci. Bull. 2005, 50, 117–121. [Google Scholar] [CrossRef]
  18. Wood, W.; Neal, D.T. A New Look at Habits and the Habit-Goal Interface. Psychol. Rev. 2007, 114, 843–863. [Google Scholar] [CrossRef]
  19. Yang, H.; Zhang, D.; Wang, J.; Wood, A.J.; Zhang, Y. Molecular Cloning of a Stress-Responsive Aldehyde Dehydrogenase Gene ScALDH21 from the Desiccation-Tolerant Moss Syntrichia caninervis and Its Responses to Different Stresses. Mol. Biol. Rep. 2012, 39, 2645–2652. [Google Scholar] [CrossRef]
  20. Li, X.; Zhang, D.; Gao, B.; Liang, Y.; Yang, H.; Wang, Y.; Wood, A.J. Transcriptome-Wide Identification, Classification, and Characterization of AP2/ERF Family Genes in the Desert Moss Syntrichia caninervis. Front. Plant Sci. 2017, 8, 262. [Google Scholar] [CrossRef] [Green Version]
  21. Liu, X.; Zhang, Y.; Yang, H.; Liang, Y.; Li, X.; Oliver, M.J.; Zhang, D. Functional Aspects of Early Light-induced Protein (Elip) Genes from the Desiccation-tolerant Moss Syntrichia caninervis. Int. J. Mol. Sci. 2020, 21, 1411. [Google Scholar] [CrossRef] [PubMed] [Green Version]
  22. Li, X.; Zhang, D.; Li, H.; Gao, B.; Yang, H.; Zhang, Y.; Wood, A.J. Characterization of Reference Genes for RT-QPCR in the Desert Moss Syntrichia caninervis in Response to Abiotic Stress and Desiccation/Rehydration. Front. Plant Sci. 2015, 6, 38. [Google Scholar] [CrossRef] [PubMed] [Green Version]
  23. Gao, B.; Zhang, D.; Li, X.; Yang, H.; Wood, A.J. De Novo Assembly and Characterization of the Transcriptome in the Desiccation-Tolerant Moss Syntrichia caninervis. BMC Res. Notes 2014, 7, 490. [Google Scholar] [CrossRef] [PubMed] [Green Version]
  24. Zhang, Y.; Liu, X.; Zhang, K.; Zhang, D.; Guan, K. An ABSCISIC ACID INSENSITIVE3-like Gene from the Desert Moss Syntrichia caninervis Confers Abiotic Stress Tolerance and Reduces ABA Sensitivity. Plant Cell Tissue Organ Cult. 2018, 133, 417–435. [Google Scholar] [CrossRef]
  25. Liu, J.; Yang, R.; Liang, Y.; Wang, Y.; Li, X. The DREB A-5 Transcription Factor ScDREB5 From Syntrichia caninervis Enhanced Salt Tolerance by Regulating Jasmonic Acid Biosynthesis in Transgenic Arabidopsis. Front. Plant Sci. 2022, 13, 857396. [Google Scholar] [CrossRef]
  26. Li, H.; Zhang, D.; Li, X.; Guan, K.; Yang, H. Novel DREB A-5 Subgroup Transcription Factors from Desert Moss (Syntrichia caninervis) Confers Multiple Abiotic Stress Tolerance to Yeast. J. Plant Physiol. 2016, 194, 45–53. [Google Scholar] [CrossRef]
  27. Zhang, Y.; Wang, C.; Huang, M.; Zhang, Y. Functional Analysis of ScABI3 from Syntrichia caninervis Mitt. in Medicago sativa L. Agronomy 2022, 12, 2238. [Google Scholar] [CrossRef]
  28. Eckardt, N.A. DREB Duo Defines Distinct Drought and Cold Response Pathways. Plant Cell 2019, 31, 1196–1197. [Google Scholar] [CrossRef] [Green Version]
  29. Silva, A.T.; Gao, B.; Fisher, K.M.; Mishler, B.D.; Ekwealor, J.T.B.; Stark, L.R.; Li, X.; Zhang, D.; Bowker, M.A.; Brinda, J.C.; et al. To Dry Perchance to Live: Insights from the Genome of the Desiccation-Tolerant Biocrust Moss Syntrichia caninervis. Plant J. 2021, 105, 1339–1356. [Google Scholar] [CrossRef]
  30. Zhang, T.; Cui, Z.; Li, Y.; Kang, Y.; Song, X.; Wang, J. Genome-Wide Identification and Expression Analysis of MYB Transcription Factor Superfamily in Dendrobium catenatum. Front. Genet. 2021, 12, 714696. [Google Scholar] [CrossRef]
  31. Keren, H.; Lev-Maor, G.; Ast, G. Alternative Splicing and Evolution: Diversification, Exon Definition and Function. Nat. Rev. Genet. 2010, 11, 345–355. [Google Scholar] [CrossRef] [PubMed]
  32. Stockinger, E.J.; Gilmour, S.J.; Thomashow, M.F. Arabidopsis thaliana CBF1 Encodes an AP2 Domain-Containing Transcriptional Activator That Binds to the C-Repeat/DRE, a Cis-Acting DNA Regulatory Element That Stimulates Transcription in Response to Low Temperature and Water Deficit. Proc. Natl. Acad. Sci. USA 1997, 94, 1035–1040. [Google Scholar] [CrossRef] [PubMed] [Green Version]
  33. Maruyama, K.; Todaka, D.; Mizoi, J.; Yoshida, T.; Kidokoro, S.; Matsukura, S.; Takasaki, H.; Sakurai, T.; Yamamoto, Y.Y.; Yoshiwara, K.; et al. Identification of Cis-Acting Promoter Elements in Cold-and Dehydration-Induced Transcriptional Pathways in Arabidopsis, Rice, and Soybean. DNA Res. 2012, 19, 37–49. [Google Scholar] [CrossRef] [PubMed]
  34. Wang, H.; Ni, D.; Shen, J.; Deng, S.; Xuan, H. Genome-Wide Identification of the AP2/ERF Gene Family and Functional Analysis of GmAP2/ERF144 for Drought Tolerance in Soybean. Front. Plant Sci. 2022, 13, 848766. [Google Scholar] [CrossRef]
  35. Li, Q.; Zhang, L.; Chen, P.; Wu, C.; Zhang, H. Genome-Wide Identification of APETALA2/ ETHYLENE RESPONSIVE FACTOR Transcription Factors in Cucurbita moschata and Their Involvement in Ethylene Response. Front. Plant Sci. 2022, 13, 847754. [Google Scholar] [CrossRef]
  36. Pires, N.; Dolan, L. Origin and Diversification of Basic-Helix-Loop-Helix Proteins in Plants. Mol. Biol. Evol. 2010, 27, 862–874. [Google Scholar] [CrossRef] [Green Version]
  37. Song, Y.; Zhang, X.; Li, M.; Yang, H.; Fu, D.; Lv, J.; Ding, Y.; Gong, Z.; Shi, Y.; Yang, S. The Direct Targets of CBFs: In Cold Stress Response and Beyond. J. Integr. Plant Biol. 2021, 63, 1874–1887. [Google Scholar] [CrossRef]
  38. Zhou, H.; He, Y.; Zhu, Y.; Li, M.; Song, S.; Bo, W.; Li, Y. Comparative Transcriptome Profiling Reveals Cold Stress Responsiveness in Two Contrasting Chinese Jujube Cultivars. BMC Plant Biol. 2020, 20, 240. [Google Scholar] [CrossRef]
  39. Agarwal, P.K.; Agarwal, P.; Reddy, M.K.; Sopory, S.K. Role of DREB Transcription Factors in Abiotic and Biotic Stress Tolerance in Plants. Plant Cell Rep. 2006, 25, 1263–1274. [Google Scholar] [CrossRef]
  40. Dai, X.; Zhao, P.X. PsRNATarget: A Plant Small RNA Target Analysis Server. Nucleic Acids Res. 2011, 46, 49–54. [Google Scholar] [CrossRef] [Green Version]
  41. Guo, Z.; Kuang, Z.; Wang, Y.; Zhao, Y.; Tao, Y.; Cheng, C.; Yang, J.; Lu, X.; Hao, C.; Wang, T.; et al. PmiREN: A Comprehensive Encyclopedia of Plant MiRNAs. Nucleic Acids Res. 2020, 48, 1114–1121. [Google Scholar] [CrossRef] [Green Version]
  42. He, K.; Guo, A.; Gao, G.; Zhu, Q.; Liu, X.; Zhang, H.; Chen, X.; Gu, X.; Luo, J. Computational Identification of Plant Transcription Factors and the Construction of the PlantTFDB Database. Methods Mol. Biol. 2010, 674, 351–368. [Google Scholar] [CrossRef] [PubMed]
  43. Jin, J.; Tian, F.; Yang, D.; Meng, Y.; Kong, L.; Luo, J.; Gao, G. PlantTFDB 4.0: Toward a Central Hub for Transcription Factors and Regulatory Interactions in Plants. Nucliec Acid Res. 2017, 45, 1040–1045. [Google Scholar] [CrossRef] [Green Version]
  44. Feller, A.; MacHemer, K.; Braun, E.L.; Grotewold, E. Evolutionary and Comparative Analysis of MYB and BHLH Plant Transcription Factors. Plant J. 2011, 66, 94–116. [Google Scholar] [CrossRef]
  45. Perroud, P.F.; Haas, F.B.; Hiss, M.; Ullrich, K.K.; Alboresi, A.; Amirebrahimi, M.; Barry, K.; Bassi, R.; Bonhomme, S.; Chen, H.; et al. The Physcomitrella patens Gene Atlas Project: Large-Scale RNA-Seq Based Expression Data. Plant J. 2018, 95, 168–182. [Google Scholar] [CrossRef] [PubMed] [Green Version]
  46. Li, X.; Gao, B.; Zhang, D.; Liang, Y.; Liu, X.; Zhao, J.; Zhang, J.; Wood, A.J. Identification, Classification, and Functional Analysis of AP2/ERF Family Genes in the Desert Moss Bryum argenteum. Int. J. Mol. Sci. 2018, 19, 3637. [Google Scholar] [CrossRef] [PubMed] [Green Version]
  47. Dubos, C.; Stracke, R.; Grotewold, E.; Weisshaar, B.; Martin, C.; Lepiniec, L. MYB Transcription Factors in Arabidopsis. Trends Plant Sci. 2010, 15, 573–581. [Google Scholar] [CrossRef]
  48. Reboledo, G.; Agorio, A.; León, I.P. De Moss Transcription Factors Regulating Development and Defense Responses to Stress. Exp. Bot. 2022, 73, 4546–4561. [Google Scholar] [CrossRef]
  49. Englbrecht, C.C.; Schoof, H.; Böhm, S. Conservation, Diversification and Expansion of C2H2 Zinc Finger Proteins in the Arabidopsis thaliana Genome. BMC Genom. 2004, 5, 39. [Google Scholar] [CrossRef] [Green Version]
  50. Ritonga, F.N.; Chen, S. Physiological and Molecular Mechanism Involved in Cold Stress Tolerance in Plants. Plants 2020, 9, 560. [Google Scholar] [CrossRef]
  51. Müller, M.; Munné-bosch, S. Ethylene Response Factors: A Key Regulatory Hub in Hormone and Stress Signaling. Plant Physiol. 2015, 169, 32–41. [Google Scholar] [CrossRef] [PubMed] [Green Version]
  52. Meng, X.; Liang, Z.; Dai, X.; Zhang, Y.; Mahboub, S.; Ngu, D.W. Predicting Transcriptional Responses to Cold Stress across Plant Species. Proc. Natl. Acad. Sci. USA 2021, 118, e2026330118. [Google Scholar] [CrossRef] [PubMed]
  53. Knight, H.; Zarka, D.G.; Okamoto, H.; Thomashow, M.F.; Knight, M.R. Abscisic Acid Induces CBF Gene Transcription and Subsequent Induction of Cold-Regulated Genes via the CRT Promoter Element. Plant Physiol. 2004, 135, 1710–1717. [Google Scholar] [CrossRef] [Green Version]
  54. Göös, H.; Kinnunen, M.; Salokas, K.; Tan, Z.; Liu, X.; Zhang, Q.; Wei, G.; Varjosalo, M.; Yadav, L. Human trancriprion factor proten interaction Networks. Nat. Commun. 2022, 13, 766. [Google Scholar] [CrossRef] [PubMed]
  55. An, J.P.; Li, R.; Qu, F.J.; You, C.X.; Wang, X.F.; Hao, Y.J. R2R3-MYB Transcription Factor MdMYB23 Is Involved in the Cold Tolerance and Proanthocyanidin Accumulation in Apple. Plant J. 2018, 96, 562–577. [Google Scholar] [CrossRef] [Green Version]
  56. Nyikó, T.; Auber, A.; Szabadkai, L.; Benkovics, A.; Auth, M.; Mérai, Z.; Kerényi, Z.; Dinnyés, A.; Nagy, F.; Silhavy, D. Expression of the ERF1 Translation Termination Factor Is Controlled by an Autoregulatory Circuit Involving Readthrough and Nonsense-Mediated Decay in Plants. Nucleic Acids Res. 2017, 45, 4174–4188. [Google Scholar] [CrossRef] [PubMed] [Green Version]
  57. Chen, Y.; Zhang, L.; Zhang, H.; Chen, L.; Yu, D. ERF1 Delays Flowering through Direct Inhibition of FLOWERING LOCUS T Expression in Arabidopsis. J. Integr. Plant Biol. 2021, 63, 1712–1723. [Google Scholar] [CrossRef] [PubMed]
  58. Lorenzo, O.; Piqueras, R.; Sánchez-Serrano, J.J.; Solano, R. ETHYLENE RESPONSE FACTOR1 Integrates Signals from Ethylene and Jasmonate Pathways in Plant Defense. Plant Cell 2003, 15, 165–178. [Google Scholar] [CrossRef] [Green Version]
  59. Oh, E.; Kang, H.; Yamaguchi, S.; Park, J.; Lee, D.; Kamiya, Y.; Choi, G. Genome-Wide Analysis of Genes Targeted by PHYTOCHROME INTERACTING FACTOR 3-LIKE5 during Seed Germination in Arabidopsis. Plant Cell 2009, 21, 403–419. [Google Scholar] [CrossRef] [Green Version]
  60. Song, C.; Cao, Y.; Dai, J.; Li, G.; Manzoor, M.A.; Chen, C.; Deng, H. The Multifaceted Roles of MYC2 in Plants: Toward Transcriptional Reprogramming and Stress Tolerance by Jasmonate Signaling. Front. Plant Sci. 2022, 13, 868874. [Google Scholar] [CrossRef]
  61. Qin, G.; Mallik, S.; Mitra, R.; Li, A.; Jia, P.; Eischen, C.M.; Zhao, Z. MicroRNA and Transcription Factor Co-Regulatory Networks and Subtype Classification of Seminoma and Non-Seminoma in Testicular Germ Cell Tumors. Sci. Rep. 2020, 10, 852. [Google Scholar] [CrossRef] [Green Version]
  62. Singh, P.; Dutta, P.; Chakrabarty, D. MiRNAs Play Critical Roles in Response to Abiotic Stress by Modulating Cross-Talk of Phytohormone Signaling. Plant Cell Rep. 2021, 40, 1617–1630. [Google Scholar] [CrossRef] [PubMed]
  63. Gao, X.; Zhang, Q.; Zhao, Y.-Q.; Yang, J.; He, H.-B.; Jia, G.-X. The Lre-MiR159a-LrGAMYB Pathway Mediates Resistance to Grey Mould Infection in Lilium regale. Mol. Plant Pathol. 2020, 21, 749–760. [Google Scholar] [CrossRef] [PubMed] [Green Version]
  64. Biniaz, Y.; Tahmasebi, A.; Afsharifar, A.; Tahmasebi, A.; Poczai, P. Meta-Analysis of Common and Differential Transcriptomic Responses to Biotic and Abiotic Stresses in Arabidopsis thaliana. Plants 2022, 11, 502. [Google Scholar] [CrossRef] [PubMed]
  65. Sharma, A.; Badola, P.K.; Gautam, H.; Trivedi, P.K. Heterologous Expression of Arabidopsis MiR858 Modulates Biosynthesis of Secondary Metabolites and Affects Drought Tolerance in Tobacco. Plant Cell Tissue Organ Cult. 2022, 152, 287–298. [Google Scholar] [CrossRef]
  66. Snigdha, M.; Prasath, D. Transcriptomic Analysis to Reveal the Differentially Expressed MiRNA Targets and Their MiRNAs in Response to Ralstonia solanacearum in Ginger Species. BMC Plant Biol. 2021, 21, 355. [Google Scholar] [CrossRef]
  67. Li, X.; Liang, Y.; Gao, B.; Mijiti, M.; Bozorov, T.A.; Yang, H.; Zhang, D.; Wood, A.J. ScDREB10, an A-5c Type of DREB Gene of the Desert Moss Syntrichia caninervis, Confers Osmotic and Salt Tolerances to Arabidopsis. Genes 2019, 10, 146. [Google Scholar] [CrossRef] [Green Version]
  68. Liang, Y.; Li, X.; Zhang, D.; Gao, B.; Yang, H.; Wang, Y.; Guan, K.; Wood, A.J. ScDREB8, a Novel A-5 Type of DREB Gene in the Desert Moss Syntrichia caninervis, Confers Salt Tolerance to Arabidopsis. Plant Physiol. Biochem. 2017, 120, 242–251. [Google Scholar] [CrossRef]
  69. Feng, K.; Hou, X.L.; Xing, G.M.; Liu, J.X.; Duan, A.Q.; Xu, Z.S.; Li, M.Y.; Zhuang, J.; Xiong, A.S. Advances in AP2/ERF Super-Family Transcription Factors in Plant. Crit. Rev. Biotechnol. 2020, 40, 750–776. [Google Scholar] [CrossRef] [PubMed]
  70. Hiss, M.; Laule, O.; Meskauskiene, R.M.; Arif, M.A.; Decker, E.L.; Erxleben, A.; Frank, W.; Hanke, S.T.; Lang, D.; Martin, A.; et al. Large-Scale Gene Expression Profiling Data for the Model Moss Physcomitrella Patens Aid Understanding of Developmental Progression, Culture and Stress Conditions. Plant J. 2014, 79, 530–539. [Google Scholar] [CrossRef]
  71. Beike, A.K.; Lang, D.; Zimmer, A.D.; Florian, W.; Trautmann, D.; Wiedemann, G.; Beyer, P.; Decker, E.L.; Reski, R. Insights from the Cold Transcriptome of Physcomitrella patens: Global Specialization Pattern of Conserved Transcriptional Regulators and Identification of Orphan Genes Involved in Cold Acclimation. Plant J. 2015, 2, 869–881. [Google Scholar] [CrossRef] [Green Version]
  72. Oh, E.; Yamaguchi, S.; Hu, J.; Yusuke, J.; Jung, B.; Paik, I.; Lee, H.S.; Sun, T.P.; Kamiya, Y.; Choi, G. PIL5, a Phytochrome-Interacting BHLH Protein, Regulates Gibberellin Responsiveness by Binding Directly to the GAI and RGA Promoters in Arabidopsis Seeds. Plant Cell 2007, 4, 1192–1208. [Google Scholar] [CrossRef] [Green Version]
  73. Jin, R.; Kim, H.S.; Yu, T.; Zhang, A.; Yang, Y.; Liu, M.; Yu, W.; Zhao, P.; Zhang, Q.; Cao, Q.; et al. Identification and Function Analysis of BHLH Genes in Response to Cold Stress in Sweet potato. Plant Physiol. Biochem. 2021, 169, 224–235. [Google Scholar] [CrossRef]
  74. Le Hir, R.; Castelain, M.; Chakraborti, D.; Moritz, T.; Dinant, S.; Bellini, C. AtbHLH68 Transcription Factor Contributes to the Regulation of ABA Homeostasis and Drought Stress Tolerance in Arabidopsis thaliana. Physiol. Plant. 2017, 160, 312–327. [Google Scholar] [CrossRef] [PubMed] [Green Version]
  75. Jiang, Y.; Yang, B.; Deyholos, M.K. Functional Characterization of the Arabidopsis BHLH92 Transcription Factor in Abiotic Stress. Mol. Genet. Genom. 2009, 282, 503–516. [Google Scholar] [CrossRef] [PubMed]
  76. Liu, X.; Cao, X.; Shi, S.; Zhao, N.; Li, D.; Fang, P.; Chen, X.; Qi, W.; Zhang, Z. Comparative RNA-Seq Analysis Reveals a Critical Role for Brassinosteroids in Rose (Rosa hybrida) Petal Defense against Botrytis cinerea Infection. BMC Genet. 2018, 19, 62. [Google Scholar] [CrossRef]
  77. Segreto, R.; Hassel, K.; Bardal, R.; Stenøien, H.K. Desiccation Tolerance and Natural Cold Acclimation Allow Cryopreservation of Bryophytes without Pretreatment or Use of Cryoprotectants. Bryologist 2010, 113, 760–769. [Google Scholar] [CrossRef]
  78. Mistry, J.; Chuguransky, S.; Williams, L.; Qureshi, M.; Salazar, G.A.; Sonnhammer, E.L.L.; Tosatto, S.C.E.; Paladin, L.; Raj, S.; Richardson, L.J.; et al. Pfam: The Protein Families Database in 2021. Nucleic Acids Res. 2021, 49, D412–D419. [Google Scholar] [CrossRef]
  79. Szklarczyk, D.; Franceschini, A.; Wyder, S.; Forslund, K.; Heller, D.; Huerta-Cepas, J.; Simonovic, M.; Roth, A.; Santos, A.; Tsafou, K.P.; et al. Protein-Protein Interaction Networks, Integrated over the Tree of Life. Nucleic Acids Res. 2015, 43, D447–D452. [Google Scholar] [CrossRef]
  80. Oliver, M.J.; Hudgeons, J.; Dowd, S.E.; Payton, P.R. A Combined Subtractive Suppression Hybridization and Expression Profiling Strategy to Identify Novel Desiccation Response Transcripts from Tortula ruralis Gametophytes. Physiol. Plant. 2009, 136, 437–460. [Google Scholar] [CrossRef] [PubMed]
  81. Trapnell, C.; Williams, B.A.; Pertea, G.; Mortazavi, A.; Kwan, G.; van Baren, M.J.; Salzberg, S.L.; Wold, B.J.; Pachter, L. Transcript Assembly and Quantification by RNA-Seq Reveals Unannotated Transcripts and Isoform Switching during Cell Differentiation. Nat. Biotechnol. 2010, 28, 511–515. [Google Scholar] [CrossRef] [PubMed] [Green Version]
  82. Anders, S.; Huber, W. Differential Expression Analysis for Sequence Count Data. Genome Biol. 2010, 11, 106. [Google Scholar] [CrossRef] [PubMed] [Green Version]
  83. Benjamini, Y.; Hochberg, Y. Controlling the False Discovery Rate: A Practical and Powerful Approach to Multiple Testing. J. R. Stat. Soc. 1995, 57, 289–300. [Google Scholar] [CrossRef]
  84. Chen, C.; Chen, H.; Zhang, Y.; Thomas, H.R.; Frank, M.H.; He, Y.; Xia, R. TBtools: An Integrative Toolkit Developed for Interactive Analyses of Big Biological Data. Mol. Plant. 2020, 13, 1194–1202. [Google Scholar] [CrossRef]
  85. Li, X.; Yang, R.; Liang, Y.; Gao, B.; Li, S.; Bai, W.; Oliver, M.J. The ScAPD1-like Gene from the Desert Moss Syntrichia caninervis Enhances Resistance to Verticillium dahliae via Phenylpropanoid Gene Regulation. Plant J. 2022, 113, 75–91. [Google Scholar] [CrossRef]
  86. Li, Q.Q.; Skinner, J.; Bennett, J.E. Evaluation of Reference Genes for Real-Time Quantitative PCR Studies in Candida Glabrata Following Azole Treatment. BMC Mol. Biol. 2012, 13, 22. [Google Scholar] [CrossRef] [Green Version]
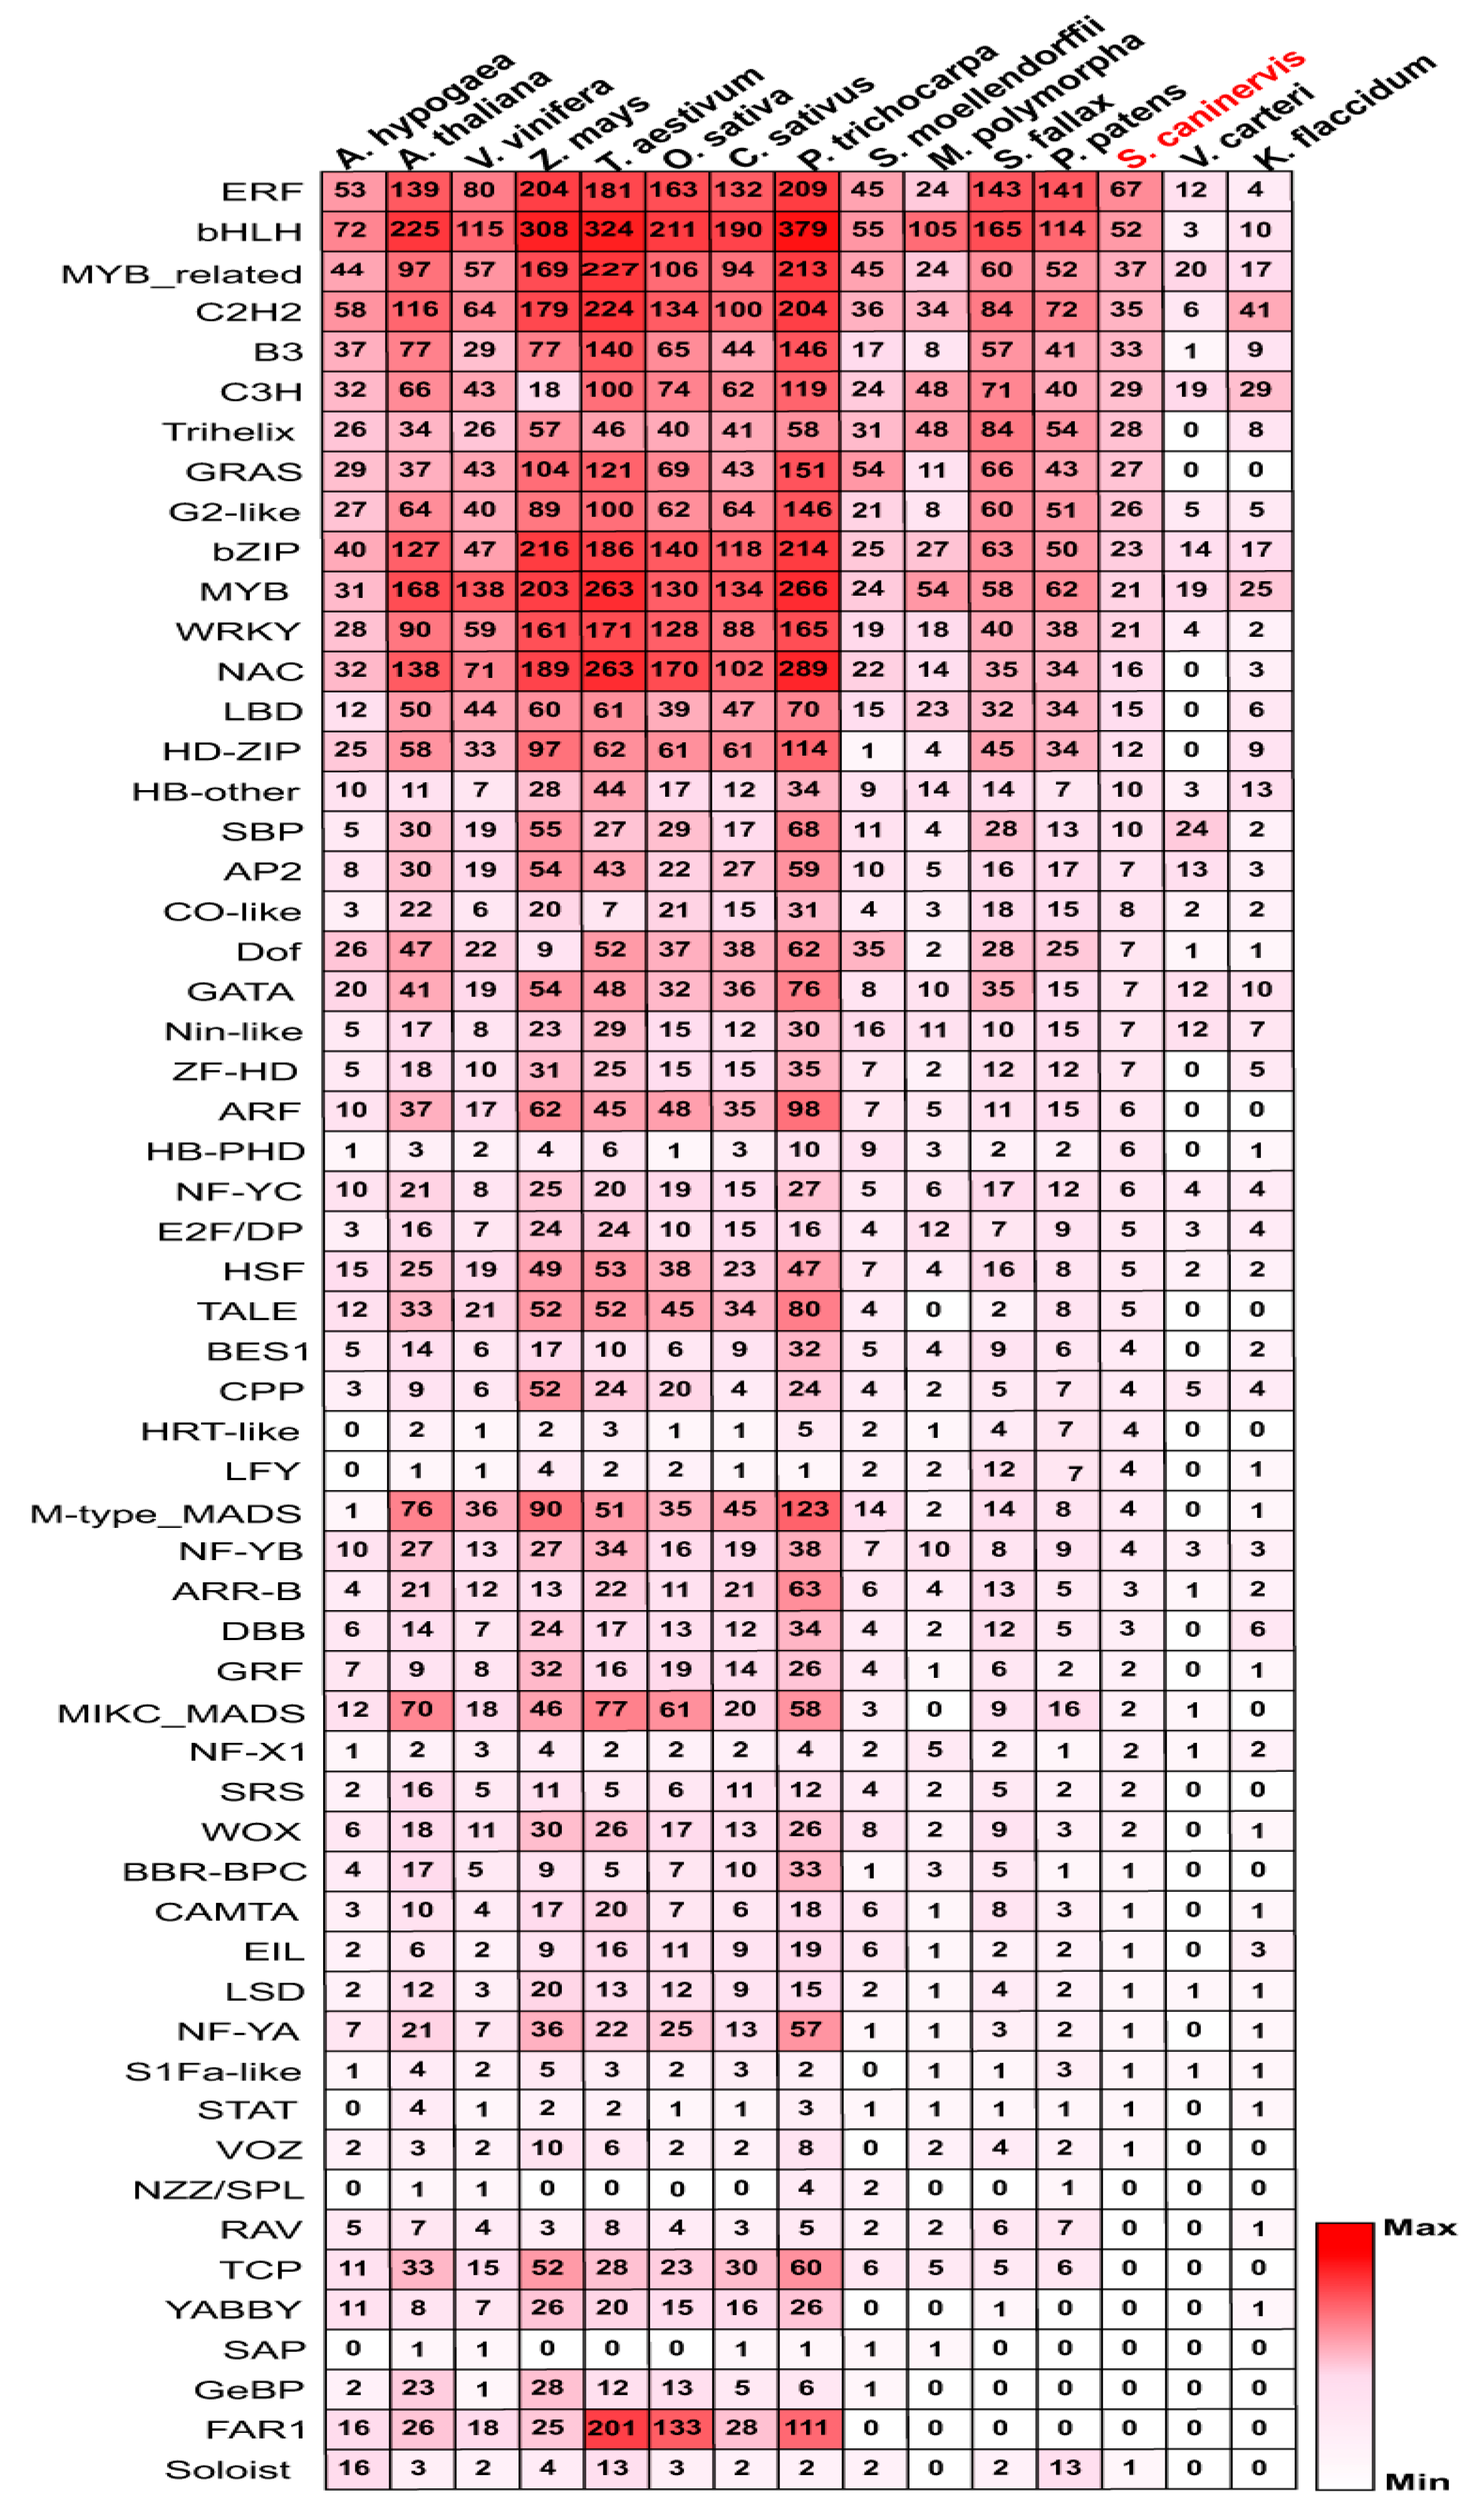
Figure 1. A list of different members of 591 TF families was observed in 14 represented plant species. The red color indicated the maximum number of TFs in different plant species. S. caninervis was labeled in red color.
Ijms 24 06137 g001
Figure 2. Chromosomal mapping of TF members on the S. caninervis genome based on their physical positions. The four most abundant TF families including, AP2/ERF, MYB, bHLH, C2H2, and others, were represented by different colors, such as red, green, orange, blue, and black, respectively.
Ijms 24 06137 g002
Figure 3. Molecular functional analysis of TF families in S. caninervis. (A) Gene ontology (GO) analysis of TF protein members. (B) KEGG pathway analysis of TF members. (C) Prediction of cis-element analysis of TF gene promoter regions.
Ijms 24 06137 g003
Figure 4. Molecular evolution analysis of the top four TF families in S. caninervis. Phylogenetic tree relationships of (A) AP2/ERF proteins. (B) bHLH proteins. (C) C2H2-zinc finger proteins. (D) MYB proteins in S. caninervis, A. thaliana, and P. patens. Black, green, and red dots mark S. caninervis, P. paten, and A. thaliana, respectively.
Ijms 24 06137 g004
Figure 5. Protein-protein interaction networks of four overrepresented transcription factor families (AP2/ERF, MYB, bHLH, and C2H2) in S. caninervis. Different node colors indicate different TF family genes, and each edge indicates an interaction between two proteins. Red, yellow, green, and blue nodes mark AP2/ERF, MYB, C2H2, and bHLH TF families, respectively. The number of interacting genes was indicated by cycle size.
Ijms 24 06137 g005
Figure 6. MicroRNA targeted four overrepresented TFs in S. caninervis. Cycle nodes indicate TFs and triangle nodes indicate microRNAs. Four TF family members were represented by different colors. Cycle and triangle sizes reflect the numbers of TFs or microRNAs.
Ijms 24 06137 g006
Figure 7. Expression analysis of the top four TF family genes was examined using hierarchical clustering in different time-series of chilling and freezing stresses. FPKM values of representative transcript levels of TF members. The standardized expression data was used to generate a heatmap with hierarchical clustering based on the Manhattan correlation with average linkage using the MeV software package. Expression levels of (A) AP2/ERF, (B) bHLH, (C) MYB, (D) C2H2-zinc finger genes under chilling and freezing stresses at 1, 8, and 24 h. The heatmap shows the change in the average log2 (fold-change) of each transcript.
Ijms 24 06137 g007
Figure 8. Expression profiles of the top four TF family genes were analyzed using hierarchical clustering in different time-series of dehydration-rehydration stress. FPKM values of representative transcript levels of TF members. The standardized expression data was used to generate a heatmap with hierarchical clustering based on the Manhattan correlation with average linkage using the MeV software package. Expression levels of (A) AP2/ERF, (B) bHLH, (C) MYB, (D), C2H2-zinc finger genes under dehydration stress at 2, 6, and 24 h, and rehydration conditions at 0.5, 2, 6, 24 and 48 h. The color scale below the heatmap represents the expression pattern; green shows down-regulated and red shows up-regulated genes. The heatmap shows the change of the average log2 (fold-change) of each transcript.
Ijms 24 06137 g008
Figure 9. The relative transcript abundance analysis of nine represented TFs in response to chilling (4 °C) and freezing (−4 °C) stresses by RT-qPCR at 0, 1, 8, and 24 h. Data are represented as means ± SD of three independent biological replicates of each treatment. The significant difference compared with the control (0 h), LSD multiple comparison tests: * p < 0.05, ** p < 0.01, ***, p < 0.001.
Ijms 24 06137 g009
Figure 10. The relative transcript abundance analysis of nine represented TFs in response to dehydration (2, 6, and 24 h) and rehydration (2, 6, 24, and 48 h) stresses by RT-qPCR. Data are represented as means ± SD of three independent biological replicates of each treatment. The significant difference compared with the control (0 h), LSD multiple comparison tests: * p < 0.05, ** p < 0.01, ***, p < 0.001.
Ijms 24 06137 g010
Disclaimer/Publisher’s Note: The statements, opinions and data contained in all publications are solely those of the individual author(s) and contributor(s) and not of MDPI and/or the editor(s). MDPI and/or the editor(s) disclaim responsibility for any injury to people or property resulting from any ideas, methods, instructions or products referred to in the content.