
Photobiomodulation Reduces the Cytokine Storm Syndrome Associated with COVID-19 in the Zebrafish Model

 , , , , ,
  , , ,
, , ,  ,
,  , , , , ,
  , , ,
, , ,  , , , ,
 ,
,  and
and 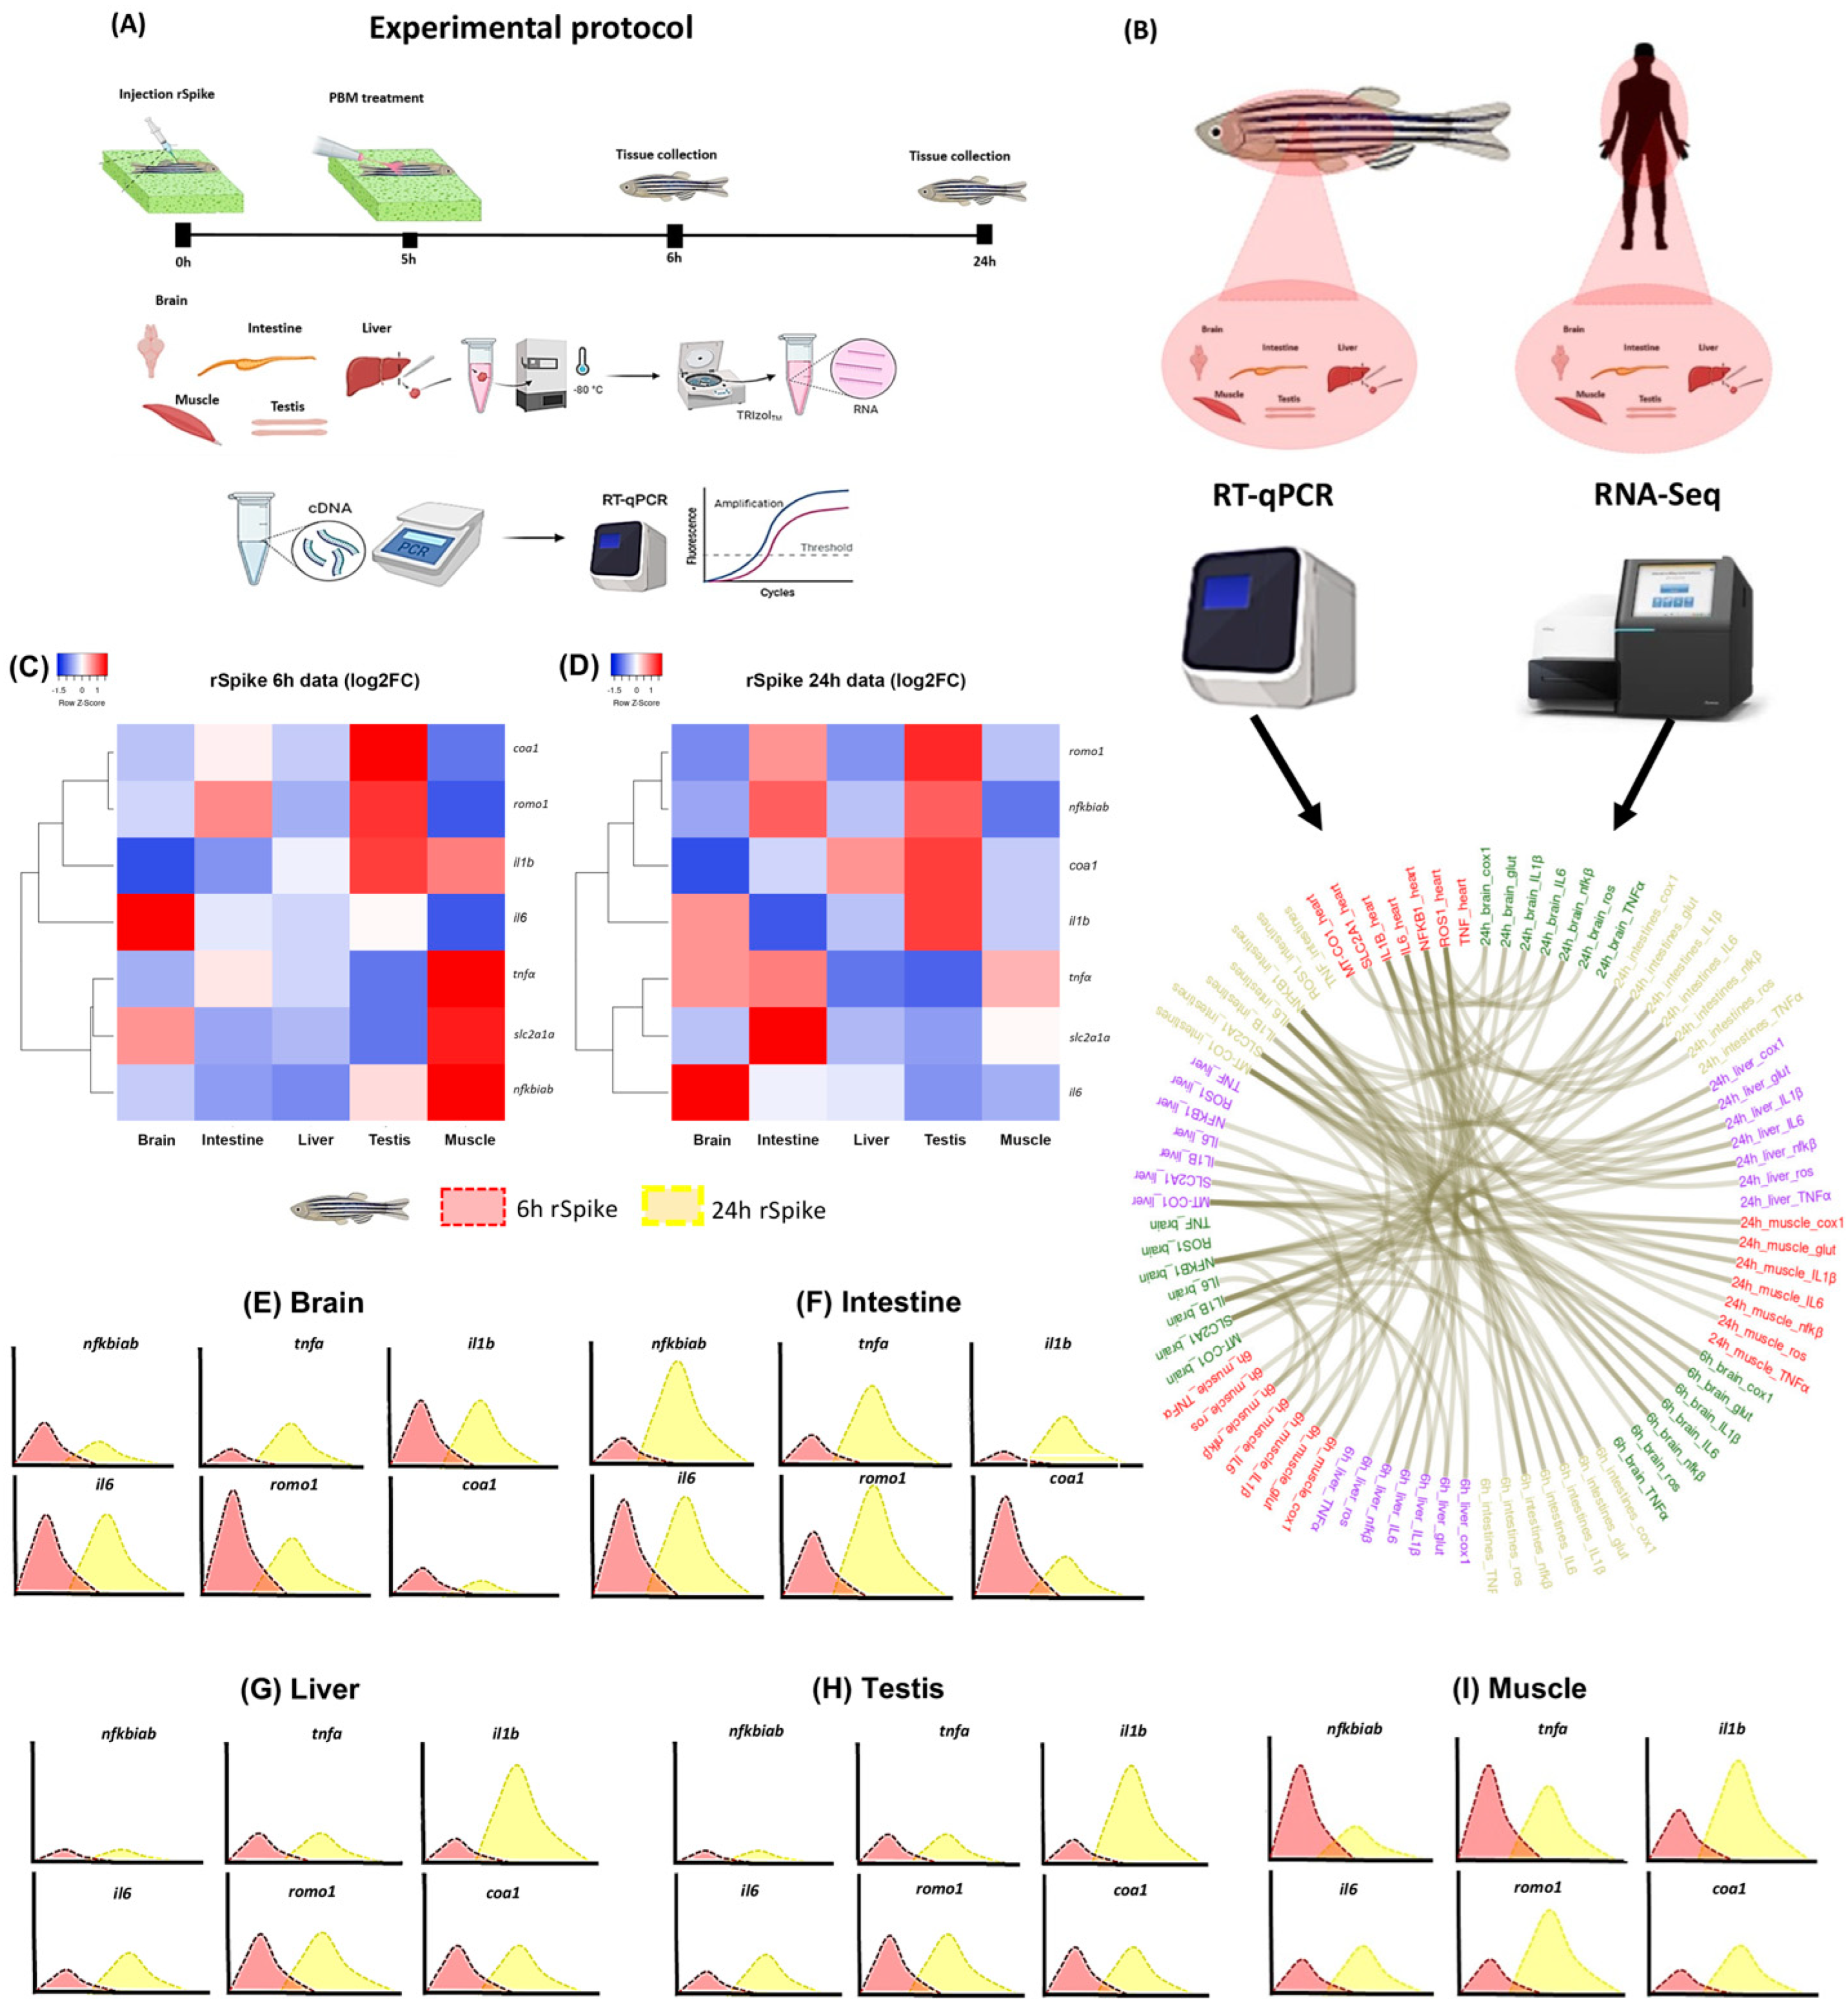
Abstract
1. Introduction
2. Results
2.1. rSpike Is Enough to Trigger the COVID-19-Associated Cytokine Storm Syndrome in Zebrafish
2.2. PBM Downregulates Inflammatory Response in COVID-19 Zebrafish Model
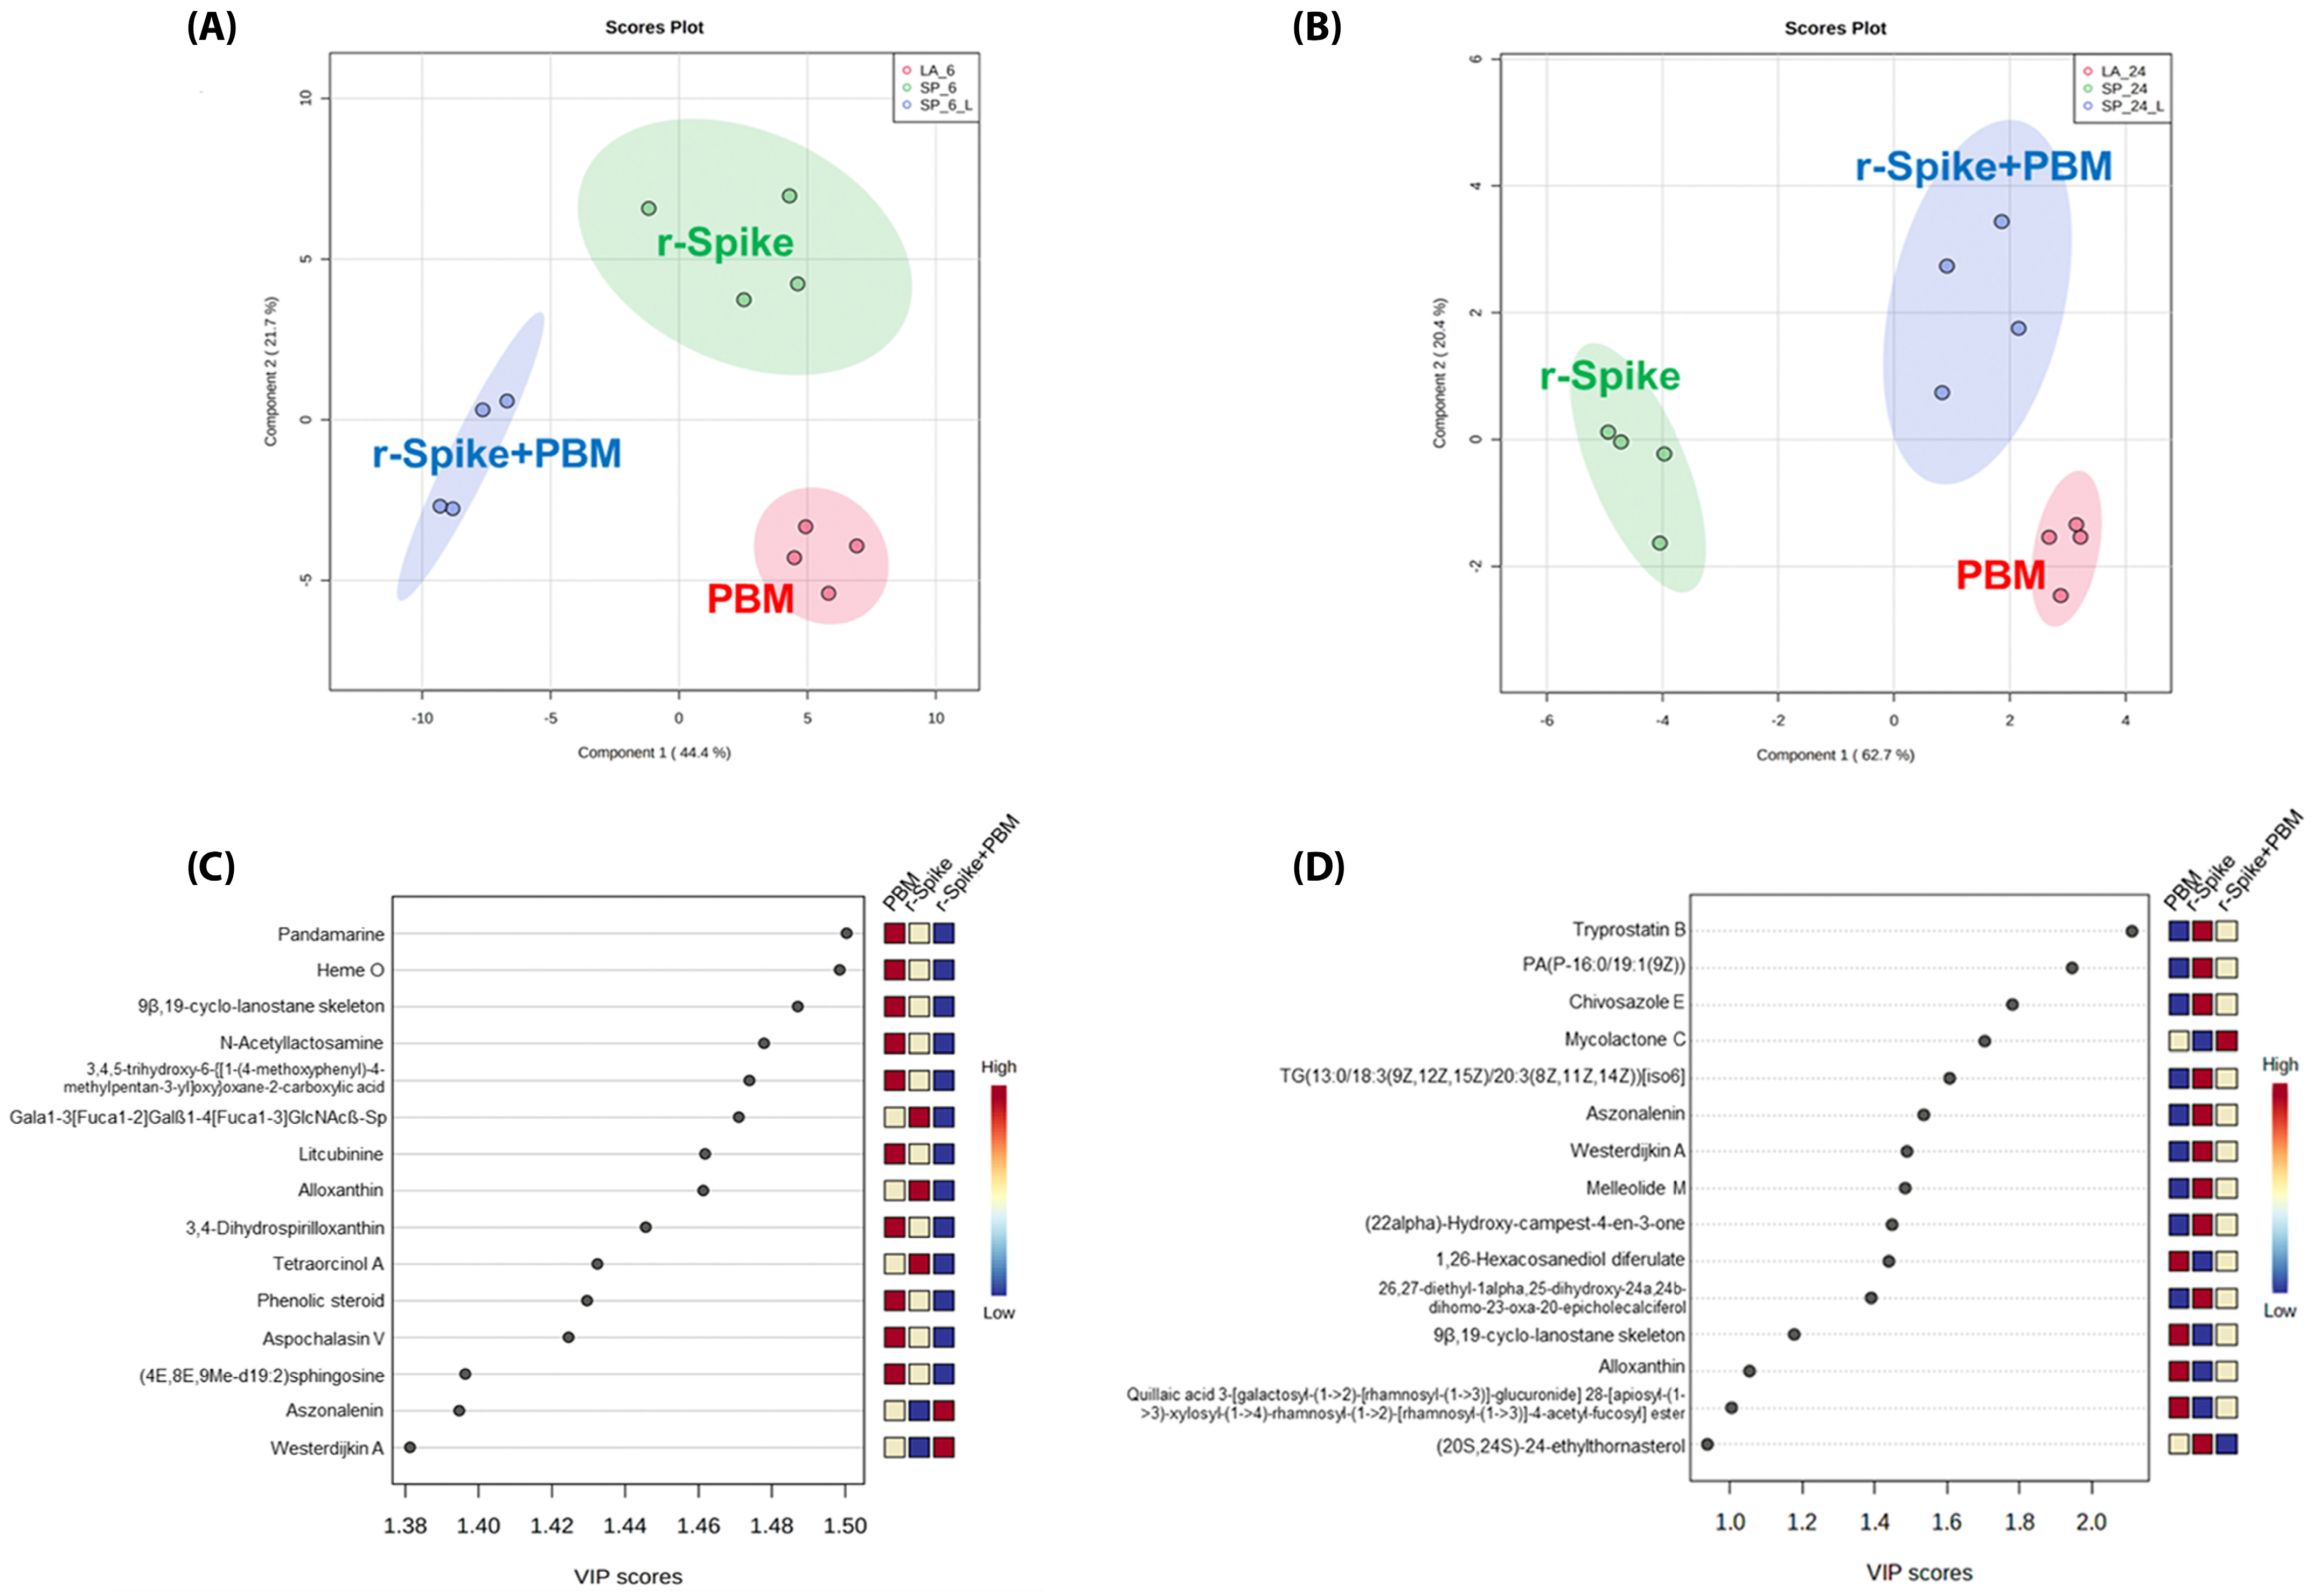
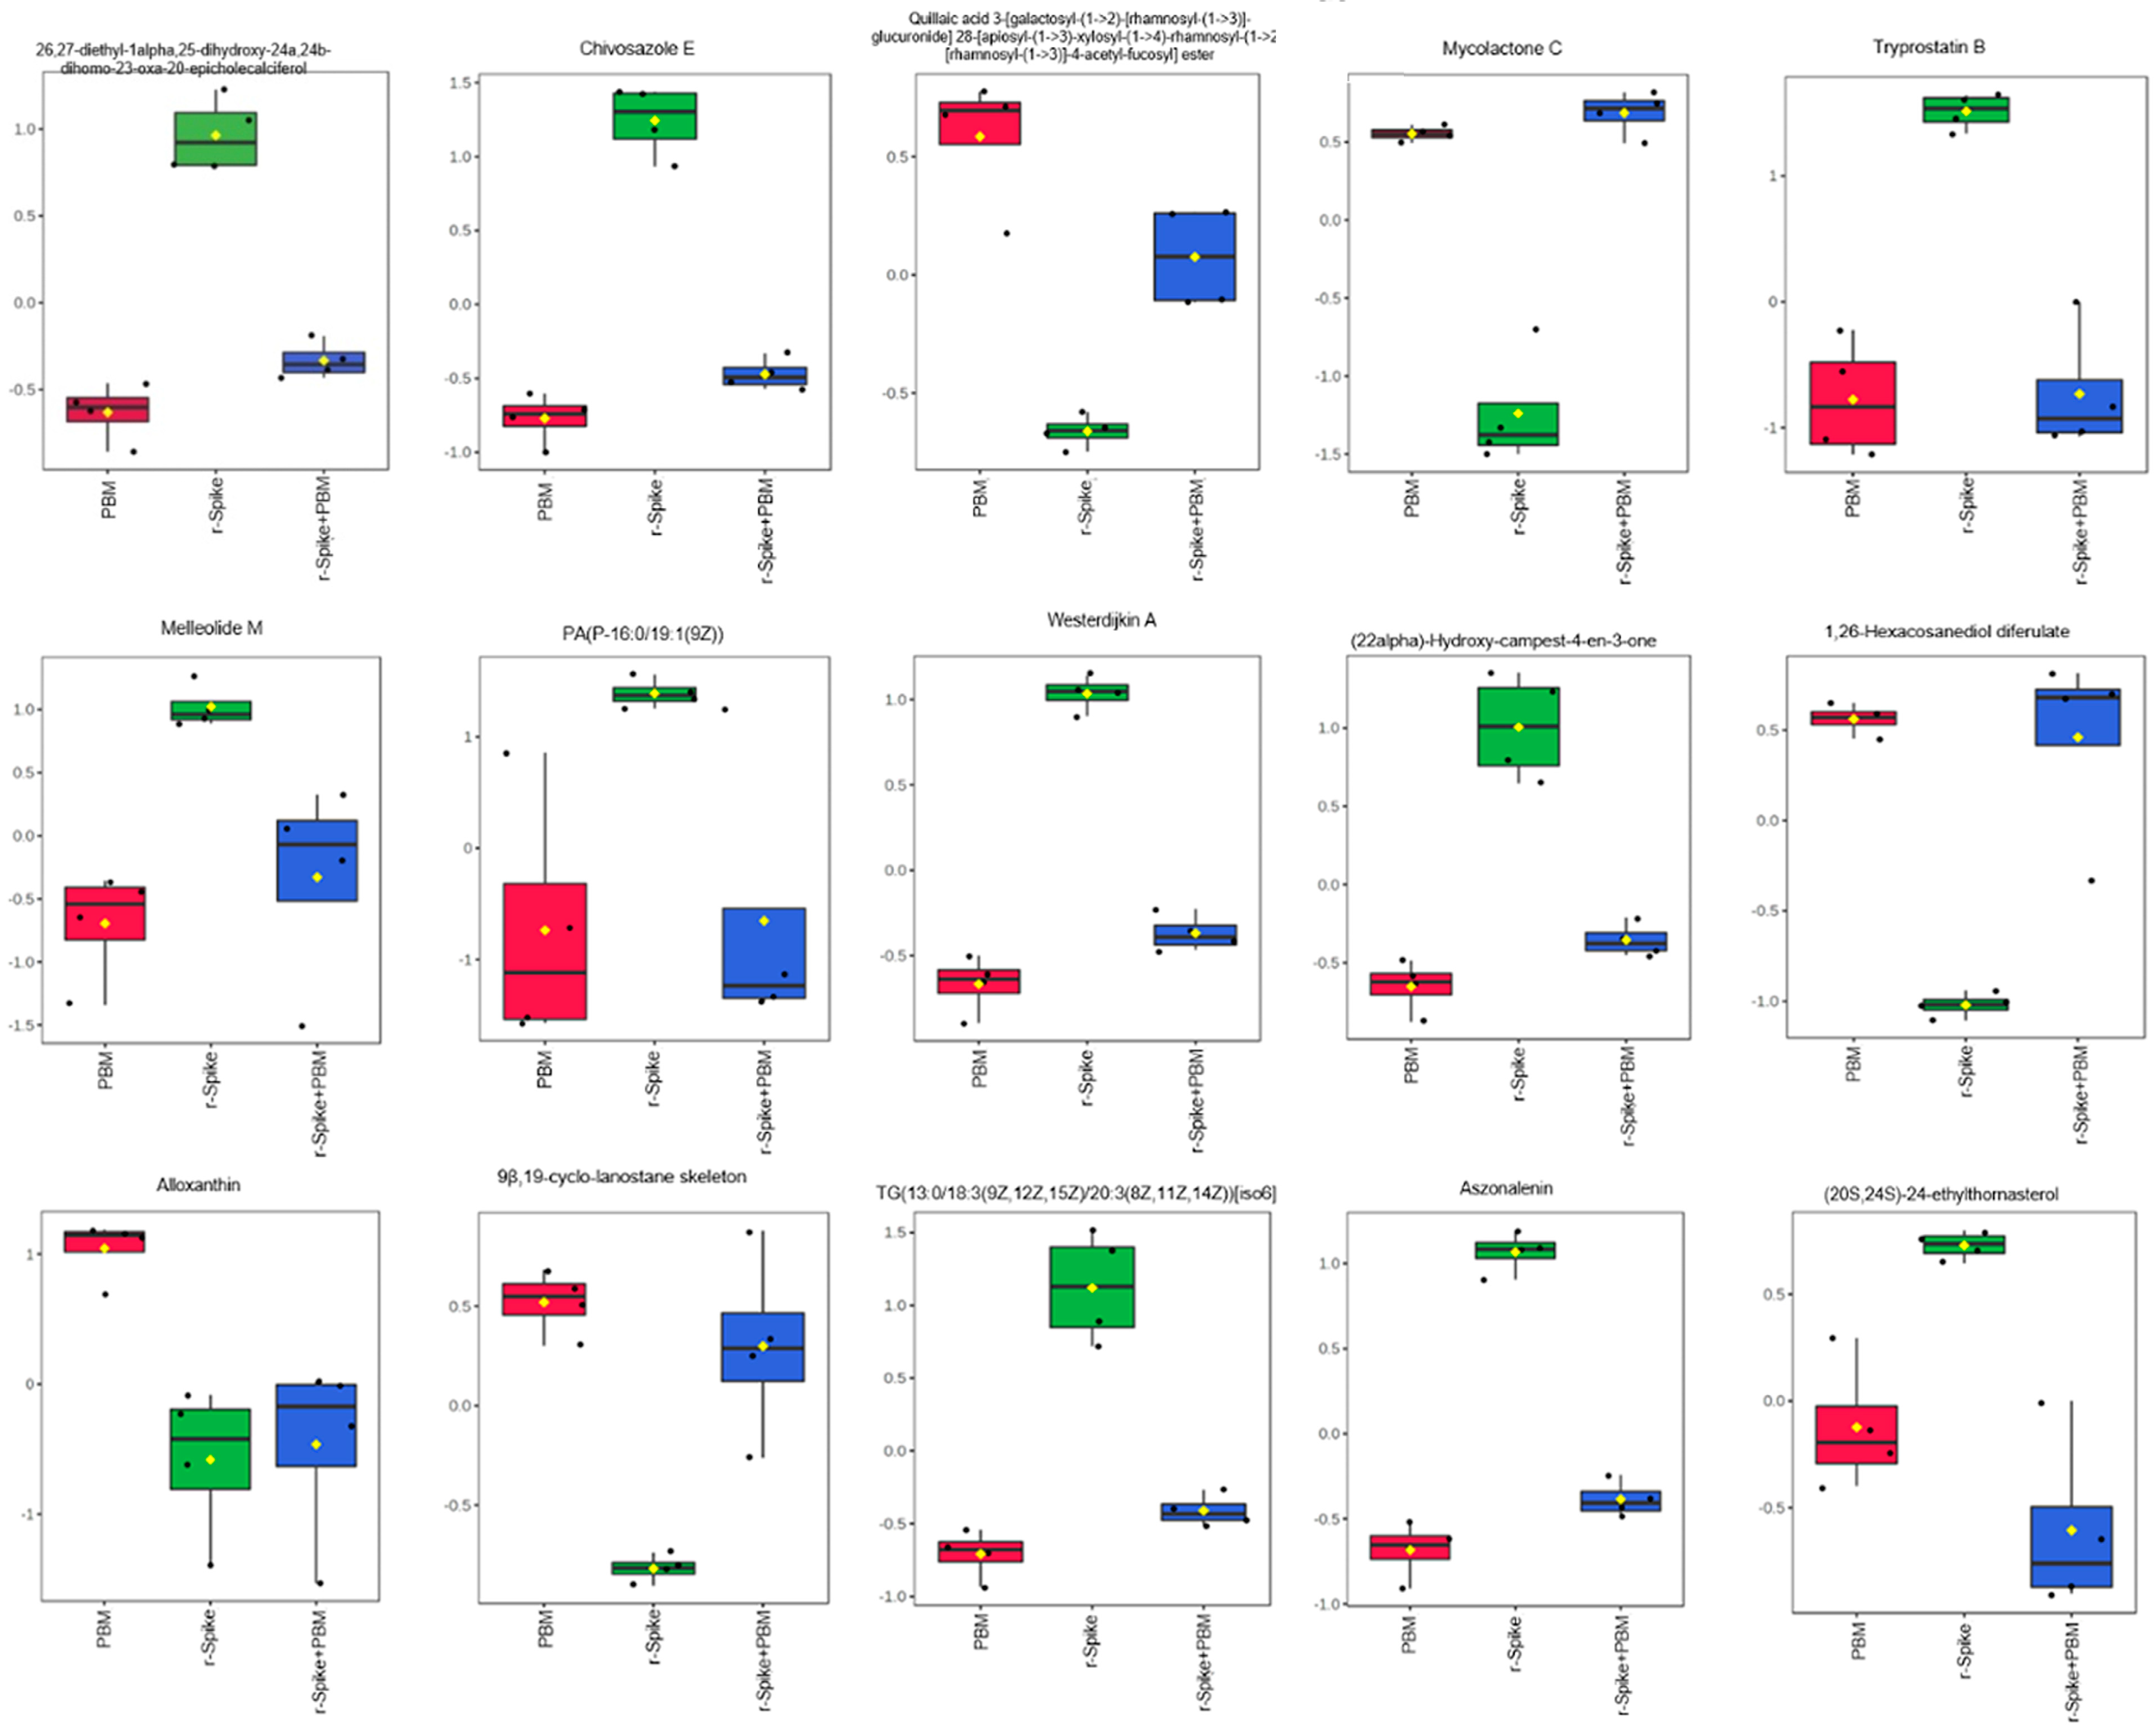
2.3. The Metabolic Signature in a Zebrafish Model of CSS-Associated with COVID-19
2.4. Metabolic Changes Induced by PBM Treatment in Zebrafish
2.5. PBM Cell Repairing Effect for CSS-Associated Treatment in the Zebrafish Model
3. Discussion
4. Materials and Methods
4.1. Cloning, Expression, and Recombinant SARS-CoV-2 Spike Protein Purification
4.2. Zebrafish Maintenance
4.3. Inoculation of SARS-COVID-2: rSpike
4.4. Photobiomodulation (PBM) Therapy
4.5. RNA Extraction and Gene Expression (qPCR)
4.6. Protein–Protein Interactions with SARS-CoV-2
4.7. Mapping of RNA-Seq Libraries and Differential Gene Expression Analysis
4.8. Histopathological Analysis
4.9. Metabolomic Analysis and Metabolite Extraction
4.10. Analysis by LC-MS
4.11. Metabolomics Data Analysis
4.12. Statistical Analysis
Supplementary Materials
Author Contributions
Funding
Institutional Review Board Statement
Data Availability Statement
Conflicts of Interest
References
- Cron, R.Q.; Caricchio, R.; Chatham, W.W. Calming the cytokine storm in COVID-19. Nat. Med. 2021, 27, 1674–1675. [Google Scholar] [CrossRef]
- Davies, N.G.; Abbott, S.; Barnard, R.C.; Jarvis, C.I.; Kucharski, A.J.; Munday, J.D.; Pearson, C.A.B.; Russell, T.W.; Tully, D.C.; Washburne, A.D.; et al. Estimated transmissibility and impact of SARS-CoV-2 lineage B. 1.1. 7 in England. Science 2021, 372, eabg3055. [Google Scholar] [CrossRef]
- Wu, W.; Wang, A.; Liu, M. Clinical features of patients infected with 2019 novel coronavirus in Wuhan, China. Lancet 2020, 395, 497–506. [Google Scholar]
- Walls, A.C.; Park, Y.J.; Tortorici, M.A.; Wall, A.; McGuire, A.T.; Veesler, D. Structure, function, and antigenicity of the SARS-CoV-2 spike glycoprotein. Cell 2020, 181, 281–292. [Google Scholar] [CrossRef]
- Casalino, L.; Gaieb, Z.; Goldsmith, J.A.; Hjorth, C.K.; Dommer, A.C.; Harbison, A.M.; Fogarty, C.A.; Barros, E.P.; Barros, B.C.; McLellan, J.S.; et al. Beyond shielding: The roles of glycans in the SARS-CoV-2 spike protein. ACS Cent. Sci. 2020, 6, 1722–1734. [Google Scholar] [CrossRef]
- Shang, J.; Ye, G.; Shi, K.; Wan, Y.; Luo, C.; Aihara, H.; Geng, Q.; Auerbach, A.; Li, F. Structural basis of receptor recognition by SARS-CoV-2. Nature 2020, 581, 221–224. [Google Scholar] [CrossRef]
- Chu, H.; Hu, B.; Huang, X.; Chai, Y.; Zhou, D.; Wang, Y.; Shuai, H.; Yuen, K.Y. Host and viral determinants for efficient SARS-CoV-2 infection of the human lung. Nat. Commun. 2021, 12, 134. [Google Scholar] [CrossRef]
- Fernandes BH, V.; Feitosa, N.M.; Barbosa, A.P.; Bomfim, C.G.; Garnique, A.M.; Rosa, I.F.; Rodrigues, M.S.; Charlie-Silva, I. Toxicity of spike fragments SARS-CoV-2 S protein for zebrafish: A tool to study its hazardous for human health? Sci. Total Environ. 2022, 813, 152345. [Google Scholar] [CrossRef]
- Ziegler, C.G.; Allon, S.J.; Nyquist, S.K.; Mbano, I.M.; Miao, V.N.; Tzouanas, C.N.; Cao, Y.; Zhang, K. SARS-CoV-2 receptor ACE2 is an interferon-stimulated gene in human airway epithelial cells and is detected in specific cell subsets across tissues. Cell 2020, 181, 1016–1035. [Google Scholar] [CrossRef]
- Zhang, Y.; Guo, R.; Kim, S.H.; Shah, H.; Zhang, S.; Liang, J.H.; Fang, Y.; Gentili, M.; O’ Leary, C.N.; Elledge, S.J.; et al. SARS-CoV-2 hijacks folate and one-carbon metabolism for viral replication. Nat. Commun. 2021, 12, 1676. [Google Scholar] [CrossRef]
- Laforge, M.; Elbim, C.; Frère, C.; Hémadi, M.; Massaad, C.; Nuss, P.; Benoliel, J.J.; Becker, C. Tissue damage from neutrophil-induced oxidative stress in COVID-19. Nat. Rev. Immunol. 2020, 20, 515–516. [Google Scholar] [CrossRef]
- Del Valle, D.M.; Kim-Schulze, S.; Huang, H.H.; Beckmann, N.D.; Nirenberg, S.; Wang, B.; Lavin, Y.; Swartz, T.H.; Swartz, D.; Stock, A.; et al. An inflammatory cytokine signature predicts COVID-19 severity and survival. Nat. Med. 2020, 26, 1636–1643. [Google Scholar] [CrossRef]
- Rodrigues, T.S.; de Sá, K.S.; Ishimoto, A.Y.; Becerra, A.; Oliveira, S.; Almeida, L.; Gonçalves, A.V.; Zamboni, D.S. Inflammasomes are activated in response to SARS-CoV-2 infection and are associated with COVID-19 severity in patients. J. Exp. Med. 2021, 218, e20201707. [Google Scholar] [CrossRef]
- Bager, P.; Wohlfahrt, J.; Fonager, J.; Rasmussen, M.; Albertsen, M.; Michaelsen, T.Y.; Møller, C.H.; Danish Covid-19 Genome Consortium. Risk of hospitalization associated with infection with SARS-CoV-2 lineage B. 1.1. 7 in Denmark: An observational cohort study. Lancet Infect. Dis. 2021, 21, 1507–1517. [Google Scholar] [CrossRef]
- Fajgenbaum, D.C.; June, C.H. Cytokine storm. N. Engl. J. Med. 2020, 383, 2255–2273. [Google Scholar] [CrossRef]
- Sinha, P.; Matthay, M.A.; Calfee, C.S. Is a “cytokine storm” relevant to COVID-19? JAMA Intern. Med. 2020, 180, 1152–1154. [Google Scholar] [CrossRef]
- Mehta, P.; McAuley, D.F.; Brown, M.; Sanchez, E.; Tattersall, R.S.; Manson, J.J. COVID-19: Consider cytokine storm syndromes and immunosuppression. Lancet 2020, 395, 1033–1034. [Google Scholar] [CrossRef]
- Izadi, Z.; Brenner, E.J.; Mahil, S.K.; Dand, N.; Yiu, Z.Z.N.; Yates, M.; Ungaro, R.C.; Zhang, X.; Agrawal, M.; Colombel, J.-F.; et al. Association between tumor necrosis factor inhibitors and the risk of hospitalization or death among patients with immune-mediated inflammatory disease and COVID-19. JAMA Netw. Open 2021, 4, e2129639. [Google Scholar] [CrossRef]
- Salesi, M.; Shojaie, B.; Farajzadegan, Z.; Salesi, N.; Mohammadi, E. TNF-α Blockers Showed Prophylactic Effects in Preventing COVID-19 in Patients with Rheumatoid Arthritis and Seronegative Spondyloarthropathies: A Case–Control Study. Rheumatol. Ther. 2021, 8, 1355–1370. [Google Scholar] [CrossRef]
- Veras, F.P.; Pontelli, M.C.; Silva, C.M.; Toller-Kawahisa, J.E.; de Lima, M.; Nascimento, D.C.; Schneider, A.H.; Cunha, F.Q. SARS-CoV-2–triggered neutrophil extracellular traps mediate COVID-19 pathology. J. Exp. Med. 2020, 217, e20201129. [Google Scholar] [CrossRef]
- Yun, S.H.; Kwok, S.J. Light in diagnosis, therapy and surgery. Nat. Biomed. Eng. 2017, 1, 8. [Google Scholar] [CrossRef]
- Lee, S.Y.; Jeon, S.; Kwon, Y.W.; Kwon, M.; Kang, M.S.; Seong, K.-Y.; Park, T.-E.; Yang, S.Y.; Han, D.-W.; Hong, S.W.; et al. Combinatorial wound healing therapy using adhesive nanofibrous membrane equipped with wearable LED patches for photobiomodulation. Sci. Adv. 2022, 8, eabn1646. [Google Scholar] [CrossRef]
- Arany, P.R.; Cho, A.; Hunt, T.D.; Sidhu, G.; Shin, K.; Hahm, E.; Huang, G.X.; Weaver, J.; Chen, A.C.-H.; Padwa, B.L.; et al. Photoactivation of endogenous latent transforming growth factor–β1 directs dental stem cell differentiation for regeneration. Sci. Transl. Med. 2014, 6, 238ra69. [Google Scholar] [CrossRef]
- Zhang, Q.; Dong, T.; Li, P.; Wu, M.X. Noninvasive low-level laser therapy for thrombocytopenia. Sci. Transl. Med. 2016, 8, 349ra101. [Google Scholar] [CrossRef]
- De Filippis, A.; Perfetto, B.; Guerrera, L.P.; Oliviero, G.; Baroni, A. Q-switched 1064 nm Nd-Yag nanosecond laser effects on skin barrier function and on molecular rejuvenation markers in keratinocyte-fibroblasts interaction. Lasers Med. Sci. 2019, 34, 595–605. [Google Scholar] [CrossRef]
- Amaroli, A.; Ravera, S.; Baldini, F.; Benedicenti, S.; Panfoli, I.; Vergani, L. Photobiomodulation with 808-nm diode laser light promotes wound healing of human endothelial cells through increased reactive oxygen species production stimulating mitochondrial oxidative phosphorylation. Lasers Med. Sci. 2019, 34, 495–504. [Google Scholar] [CrossRef]
- Tsuka, Y.; Kunimatsu, R.; Gunji, H.; Abe, T.; Medina, C.C.; Hiraki, T.; Nakatani, A.; Sakata, S.; Rikitake, K.; Aisyah, P.N.; et al. Examination of the effect of combined use of Er:YAG laser irradiation and mechanical force loading on bone metabolism using primary human gingival fibroblasts. Lasers Med. Sci. 2020, 35, 2059–2064. [Google Scholar] [CrossRef]
- Sakurai, Y.; Yamaguchi, M.; Abiko, Y. Inhibitory effect of low-level laser irradiation on LPS-stimulated prostaglandin E2 production and cyclooxygenase-2 in human gingival fibroblasts. Eur. J. Oral Sci. 2000, 108, 29–34. [Google Scholar] [CrossRef]
- Nomura, K.; Yamaguchi, M.; Abiko, Y. Inhibition of interleukin-1beta production and gene expression in human gingival fibroblasts by low-energy laser irradiation. Lasers Med. Sci. 2001, 16, 218–223. [Google Scholar] [CrossRef]
- Basso, F.G.; Pansani, T.N.; Soares, D.G.; Scheffel, D.L.; Bagnato, V.S.; de Souza Costa, C.A.; Hebling, J. Biomodulation of inflammatory cytokines related to oral mucositis by low-level laser therapy. Photochem. Photobiol. 2015, 91, 952–956. [Google Scholar] [CrossRef]
- Balkrishna, A.; Solleti, S.K.; Verma, S.; Varshney, A. Application of humanized zebrafish model in the suppression of SARS-CoV-2 spike protein induced pathology by tri-herbal medicine coronil via cytokine modulation. Molecules 2020, 25, 5091. [Google Scholar] [CrossRef]
- Tyrkalska, S.D.; Martinez-Lopez, A.; Arroyo, A.B.; Martinez-Morcillo, F.J.; Candel, S.; Mesa-del-Castillo, P.; Cayuela, M.L.; Mulero, V. A zebrafish model of COVID-19-associated cytokine storm syndrome reveals differential pro-inflammatory activities of Spike proteins of SARS-CoV-2 variants of concern. bioRxiv 2021. [Google Scholar] [CrossRef]
- Liu, M.; Chen, F.; Liu, T.; Chen, F.; Liu, S.; Yang, J. The role of oxidative stress in influenza virus infection. Microbes Infect. 2017, 19, 580–586. [Google Scholar] [CrossRef]
- Patra, T.; Meyer, K.; Geerling, L.; Isbell, T.S.; Hoft, D.F.; Brien, J.; Pinto, A.K.; Ray, R. SARS-CoV-2 spike protein promotes IL-6 trans-signaling by activation of angiotensin II receptor signaling in epithelial cells. PLoS Pathog. 2020, 16, e1009128. [Google Scholar] [CrossRef]
- Huang, X.; Wei, F.; Hu, L.; Wen, L.; Chen, K. Epidemiology and clinical characteristics of COVID-19. Arch. Iran. Med. 2020, 23, 268–271. [Google Scholar] [CrossRef] [PubMed]
- Zhang, H.; Tang, Y.; Tao, J. Sex-related overactivation of NLRP3 inflammasome increases lethality of the male COVID-19 patients. Front. Mol. Biosci. 2021, 8, 671363. [Google Scholar] [CrossRef] [PubMed]
- Lambadiari, V.; Kousathana, F.; Raptis, A.; Katogiannis, K.; Kokkinos, A.; Ikonomidis, I. Pre-existing cytokine and NLRP3 inflammasome activation and increased vascular permeability in diabetes: A possible fatal link with worst COVID-19 infection outcomes? Front. Immunol. 2020, 11, 557235. [Google Scholar] [CrossRef]
- Calado, M.B.; da Silva Santana, C.E.; Crovella, S. Do inflammasome impact COVID-19 severity? Virusdisease 2021, 32, 410–420. [Google Scholar] [CrossRef]
- Gholaminejhad, M.; Forouzesh, M.; Ebrahimi, B.; Mahdavi, S.A.; Mirtorabi, S.D.; Liaghat, A.; Monabati, S.J.; Hamza, M.O.; Hassanzadeh, G. Formation and activity of NLRP3 inflammasome and histopathological changes in the lung of corpses with COVID-19. J. Mol. Histol. 2022, 53, 883–890. [Google Scholar] [CrossRef]
- de Rivero Vaccari, J.C.; Dietrich, W.D.; Keane, R.W.; de Rivero Vaccari, J.P. The inflammasome in times of COVID-19. Front. Immunol. 2020, 11, 583373. [Google Scholar] [CrossRef]
- Schönrich, G.; Raftery, M.J.; Samstag, Y. Devilishly radical NETwork in COVID-19: Oxidative stress, neutrophil extracellular traps (NETs), and T cell suppression. Adv. Biol. Regul. 2020, 77, 100741. [Google Scholar] [CrossRef]
- Beltrán-García, J.; Osca-Verdegal, R.; Pallardó, F.V.; Ferreres, J.; Rodríguez, M.; Mulet, S.; Sanchis-Gomar, F.; Carbonell, C.; García-Giménez, J.L. Oxidative stress and inflammation in COVID-19-Associated sepsis: The potential role of anti-oxidant therapy in avoiding disease progression. Antioxidants 2020, 9, 936. [Google Scholar] [CrossRef] [PubMed]
- Biswas, S.K. Does the interdependence between oxidative stress and inflammation explain the antioxidant paradox? Oxid. Med. Cell. Longev. 2016, 2016, 5698931. [Google Scholar] [CrossRef] [PubMed]
- Lorenzen, I.; Mullen, L.; Bekeschus, S.; Hanschmann, E.M. Redox regulation of inflammatory processes is enzymatically controlled. Oxid. Med. Cell. Longev. 2017, 2017, 8459402. [Google Scholar] [CrossRef] [PubMed]
- Zuo, L.; Prather, E.R.; Stetskiv, M.; Garrison, D.E.; Meade, J.R.; Peace, T.I.; Zhou, T. Inflammaging and oxidative stress in human diseases: From molecular mechanisms to novel treatments. Int. J. Mol. Sci. 2019, 10, 4472. [Google Scholar] [CrossRef]
- Saleh, J.; Peyssonnaux, C.; Singh, K.; Edeas, M. Mitochondria and microbiota dysfunction in COVID-19 pathogenesis. Mitochondrion 2020, 54, 1–7. [Google Scholar] [CrossRef]
- Icard, P.; Lincet, H.; Wu, Z.; Coquerel, A.; Forgez, P.; .Alifano, M.; Fournel, L. The key role of Warburg effect in SARS-CoV-2 replication and associated inflammatory response. Biochimie 2021, 180, 169–177. [Google Scholar] [CrossRef]
- de Cavanagh, E.M.V.; Inserra, F.; Ferder, M.; Ferder, L. From mitochondria to disease: Role of the renin-angiotensin system. Am. J. Nephrol. 2007, 27, 545–553. [Google Scholar] [CrossRef]
- Tang, Y.-S.; Zhao, Y.-H.; Zhong, Y.; Li, X.-Z.; Pu, J.-X.; Luo, Y.-C.; Zhou, Q.-L. Neferine inhibits LPS-ATP-induced endothelial cell pyroptosis via regulation of ROS/NLRP3/Caspase-1 signaling pathway. Inflamm. Res. 2019, 68, 727–738. [Google Scholar] [CrossRef]
- Murphy, M.P. How mitochondria produce reactive oxygen species. Biochem. J. 2009, 417, 1–13. [Google Scholar] [CrossRef]
- Srinivasan, S.; Avadhani, N.G. Cytochrome c oxidase dysfunction in oxidative stress. Free. Radic. Biol. Med. 2012, 53, 1252–1263. [Google Scholar] [CrossRef]
- Szewczuk, L.M.; Forti, L.; Stivala, L.A.; Penning, T.M. Resveratrol is a peroxidase-mediated inactivator of COX-1 but not cox-2 a mechanistic approach to the design of cox-1 selective agents. J. Biol. Chem. 2004, 279, 22727–22737. [Google Scholar] [CrossRef] [PubMed]
- Yan, Q.; Li, P.; Ye, X.; Huang, X.; Feng, B.; Ji, T.; Chen, Z.; Li, F.; Zhang, Y.; Luo, K.; et al. Longitudinal peripheral blood transcriptional analysis reveals molecular signatures of disease progression in COVID-19 patients. J. Immunol. 2021, 206, 2146–2159. [Google Scholar] [CrossRef]
- Tuner, J.; Biostimulation, L. The Laser Therapy Handbook; Prima Books AB: Grangesberg, Sweden, 2007; pp. 61–94. [Google Scholar]
- Frozanfar, A.; Ramezani, M.; Rahpeyma, A.; Khajehahmadi, S.; Arbab, H.R. The effects of low level laser therapy on the expression of collagen type I gene and proliferation of human gingival fibroblasts (Hgf3-Pi 53): In vitro study. Iran. J. Basic Med. Sci. 2013, 16, 1071. [Google Scholar]
- Ohsugi, Y.; Niimi, H.; Shimohira, T.; Hatasa, M.; Katagiri, S.; Aoki, A.; Iwata, T. In vitro cytological responses against laser photobiomodulation for periodontal regeneration. Int. J. Mol. Sci. 2020, 21, 9002. [Google Scholar] [CrossRef] [PubMed]
- Park, J.H.; Koun, S.; Kim, K.E.; Kim, I.H. Identification of the fate and regenerative mechanism of zebrafish melanocyte progenitor cells and melanocytes after laser-induced pigment ablation. Lasers Surg. Med. 2021, 54, 281–288. [Google Scholar] [CrossRef] [PubMed]
- Huang, T.H.; Lu, Y.C.; Kao, C.T. Low-level diode laser therapy reduces lipopolysaccharide (LPS)-induced bone cell inflammation. Lasers Med. Sci. 2012, 27, 621–627. [Google Scholar] [CrossRef]
- Mokmeli, S.; Vetrici, M. Low level laser therapy as a modality to attenuate cytokine storm at multiple levels, enhance recovery, and reduce the use of ventilators in COVID-19. Can. J. Respir. Ther. CJRT Rev. Can. Ther. Respir. RCTR 2020, 56, 25. [Google Scholar] [CrossRef]
- Aimbire, F.; Albertini, R.; Pacheco, M.; Castro-Faria-Neto, H.; Leonardo, P.; Iversen, V.; Lopes-Martins, R.; Bjordal, J.M. Low-level laser therapy induces dose-dependent reduction of TNFα levels in acute inflammation. Photomed. Laser Surg. 2006, 24, 33–37. [Google Scholar] [CrossRef]
- Aimbire, F.; Ligeiro de Oliveira, A.P.; Albertini, R.; Correa, J.C.; Ladeira de Campos, C.B.; Lyon, J.P.; Silva, J.A., Jr.; Costa, M.S. Low-level laser therapy (LLLT) decreases pulmonary microvascular leakage, neutrophil influx, and IL-1β levels in the airway and lung of rat subjected to LPS-induced inflammation. Inflammation 2008, 31, 189–197. [Google Scholar] [CrossRef]
- Mafra de Lima, F.; Costa, M.S.; Albertini, R.; Silva, J.A., Jr.; Aimbire, F. Lowlevel laser therapy (LLLT): Attenuation of cholinergic hyperreactivity, β2 adrenergic hyporesponsiveness and TNF-α mRNA expression in rat bronchi segments in E. coli lipopolysaccharide-induced airway inflammation by a NF-κB dependent mechanism. Lasers Surg. Med. Off. J. Am. Soc. Laser Med. Surg. 2009, 41, 68–74. [Google Scholar]
- Vatankhah, Z.; Mokmeli, S.; Boshbishe, S. Evaluation of the effect of low-level laser therapy (LLLT) in the treatment of asthma, added to conventional drug therapy (crossover, case-control clinical trial). Photodiagn. Photodyn. Ther. 2008, 5 (Suppl. S1), S22. [Google Scholar] [CrossRef]
- Arza, R.A. Upper and lower respiratory conditions. In Laser Therapy in Veterinary Medicine; Riegel, R.J., Godbold, J.C., Eds.; John Wiley & Sons, Inc.: Hoboken, NJ, USA, 2017; pp. 150–160. [Google Scholar]
- Fekrazad, R. Photobiomodulation and antiviral photodynamic therapy as a possible novel approach in COVID-19 management. Photobiomodul. Photomed. Laser Surg. 2020, 38, 255–257. [Google Scholar] [CrossRef]
- Sigman, S.A.; Mokmeli, S.; Monici, M.; Vetrici, M.A. A 57-year-old African American man with severe COVID-19 pneumonia who responded to supportive photobiomodulation therapy (PBMT): First use of PBMT in COVID-19. Am. J. Case Rep. 2020, 21, e926779. [Google Scholar] [CrossRef] [PubMed]
- Nejatifard, M.; Asefi, S.; Jamali, R.; Hamblin, M.R.; Fekrazad, R. Probable positive effects of the photobiomodulation as an adjunctive treatment in COVID-19: A systematic review. Cytokine 2021, 137, 155312. [Google Scholar] [PubMed]
- Vetrici, M.A.; Mokmeli, S.; Bohm, A.R.; Monici, M.; Sigman, S.A. Evaluation of adjunctive photobiomodulation (PBMT) for COVID-19 pneumonia via clinical status and pulmonary severity indices in a preliminary trial. J. Inflamm. Res. 2021, 14, 965. [Google Scholar]
- Dias, S.S.G.; Soares, V.C.; Ferreira, A.C.; Sacramento, C.Q.; Fintelman-Rodrigues, N.; Temerozo, J.R.; Teixeira, L.; Bozza, P.T. Lipid droplets fuel SARS-CoV-2 replication and production of inflammatory mediators. PLoS Pathog. 2020, 16, e1009127. [Google Scholar]
- Abu-Farha, M.; Thanaraj, T.A.; Qaddoumi, M.G.; Hashem, A.; Abubaker, J.; Al-Mulla, F. The role of lipid metabolism in COVID-19 virus infection and as a drug target. Int. J. Mol. Sci. 2020, 21, 3544. [Google Scholar] [CrossRef]
- Casari, I.; Manfredi, M.; Metharom, P.; Falasca, M. Dissecting lipid metabolism alterations in SARS-CoV-2. Prog. Lipid Res. 2021, 82, 101092. [Google Scholar]
- Kaur, G.; Ji, X.; Rahman, I. SARS-cov2 infection alters tryptophan catabolism and phospholipid metabolism. Metabolites 2021, 11, 659. [Google Scholar] [CrossRef]
- Fantacuzzi, M.; Amoroso, R.; Ammazzalorso, A. PPAR ligands induce antiviral effects targeting perturbed lipid metabolism during SARS-CoV-2, HCV, and HCMV infection. Biology 2022, 11, 114. [Google Scholar] [PubMed]
- Baek, Y.B.; Kwon, H.J.; Sharif, M.; Lim, J.; Lee, I.C.; Ryu, Y.B.; Lee, J.I.; Cho, K.O. Therapeutic strategy targeting host lipolysis limits infection by SARS-CoV-2 and influenza A virus. Signal Transduct. Target. Ther. 2022, 7, 367. [Google Scholar]
- Farías, M.A.; Diethelm-Varela, B.; Navarro, A.J.; Kalergis, A.M.; González, P.A. Interplay between Lipid Metabolism, Lipid Droplets, and DNA Virus Infections. Cells 2022, 11, 2224. [Google Scholar] [PubMed]
- Vieira-De-Abreu, A.; Assis, E.F.; Gomes, G.S.; Castro-Faria-Neto, H.C.; Weller, P.F.; Bandeira-Melo, C.; Bozza, P.T. Allergic challenge-elicited lipid bodies compartmentalize in vivo leukotriene C 4 synthesis within eosinophils. Am. J. Respir. Cell Mol. Biol. 2005, 33, 254–261. [Google Scholar] [CrossRef]
- Pacheco, P.; Bozza, F.A.; Gomes, R.N.; Bozza, M.; Weller, P.F.; Castro-Faria-Neto, H.C.; Bozza, P.T. Lipopolysaccharide-induced leukocyte lipid body formation in vivo: Innate immunity elicited intracellular loci involved in eicosanoid metabolism. J. Immunol. 2002, 169, 6498–6506. [Google Scholar] [CrossRef]
- Pacheco, P.; Vieira-De-Abreu, A.; Gomes, R.N.; Barbosa-Lima, G.; Wermelinger, L.B.; Maya-Monteiro, C.M.; Silva, A.R.; Bozza, M.T.; Castro-Faria-Neto, H.C.; Bandeira-Melo, C.; et al. Monocyte chemoattractant protein-1/CC chemokine ligand 2 controls microtubule-driven biogenesis and leukotriene b4-synthesizing function of macrophage lipid bodies elicited by innate immune response. J. Immunol. 2007, 179, 8500–8508. [Google Scholar] [CrossRef]
- Pereira-Dutra, F.S.; Teixeira, L.; de Souza Costa, M.F.; Bozza, P.T. Fat, fight, and beyond: The multiple roles of lipid droplets in infections and inflammation. J. Leukoc. Biol. 2019, 106, 563–580. [Google Scholar] [PubMed]
- Herker, E.; Ott, M. Emerging role of lipid droplets in host/pathogen interactions. J. Biol. Chem. 2012, 287, 2280–2287. [Google Scholar]
- Shaterzadeh-Yazdi, H.; Noorbakhsh, M.F.; Hayati, F.; Samarghandian, S.; Farkhondeh, T. Immunomodulatory and anti-inflammatory effects of thymoquinone. Cardiovasc. Haematol. Disord.-Drug Targets (Former. Curr. Drug Targets-Cardiovasc. Hematol. Disord.) 2018, 18, 52–60. [Google Scholar] [CrossRef]
- Bailey, M.; Engler, H.; Hunzeker, J.; Sheridan, J.F. The hypothalamic-pituitary-adrenal axis and viral infection. Viral Immunol. 2003, 16, 141–157. [Google Scholar]
- Reimand, J.; Arak, T.; Adler, P.; Kolberg, L.; Reisberg, S.; Peterson, H.; Vilo, J. g:Profiler-a web server for functional interpretation of gene lists (2016 update). Nucleic Acids Res. 2016, 44, W83–W89. [Google Scholar]
- Shannon, P.; Markiel, A.; Ozier, O.; Baliga, N.S.; Wang, J.T.; Ramage, D.; Amin, N.; Schwikowski, B.; Ideker, T. Cytoscape: A software environment for integrated models of biomolecular interaction networks. Genome Res. 2003, 13, 2498–2504. [Google Scholar] [PubMed]
- ABolger, M.; Lohse, M.; Usadel, B. Trimmomatic: A flexible trimmer for Illumina sequence data. Bioinformatics 2014, 30, 2114–2120. [Google Scholar]
- Simpson, J.T.; Durbin, R. Efficient de novo assembly of large genomes using compressed data structures. Genome Res. 2012, 22, 549–556. [Google Scholar] [CrossRef]
- Patro, R.; Duggal, G.; Love, M.I.; Irizarry, R.A.; Kingsford, C. Salmon provides fast and bias-aware quantification of transcript expression. Nat. Methods 2017, 14, 417–419. [Google Scholar]
- Love, M.I.; Huber, W.; Anders, S. Moderated estimation of fold change and dispersion for RNA-seq data with DESeq2. Genome Biol. 2014, 15, 550. [Google Scholar] [PubMed]
- Mi, H.; Muruganujan, A.; Huang, X.; Ebert, D.; Mills, C.; Guo, X.; Thomas, P.D. Protocol Update for Large-Scale Genome and Gene Function Analysis With the PANTHER Classification System (v.14.0). Nat. Protoc. 2019, 14, 703–721. [Google Scholar] [PubMed]
- Bligh, E.G.; Dier, W.J. A rapid method of total lipid extraction and purification. Can. J. Biochem. Physiol. 1959, 37, 911–917. [Google Scholar] [CrossRef] [PubMed]
- Wu, H.; Southam, A.D.; Hines, A.; Viant, M.R. High-throughput tissue extraction protocol for NMR- and MS-based metabolomics. Anal. Biochem. 2008, 372, 204–212. [Google Scholar]
- Faria, J.M.S.; Barrulas, P.; Teixeira, D.M.; Pinto, A.P.; Brito, I.; Carvalho, M. Laser Ablation-Inductively Coupled Plasma-Mass Spectrometry (LA-ICP-MS) Mapping of Element Distribution in Leaves of Wheat Colonized by Intact Arbuscular Mycorrhiza Extraradical Mycelium. Biol. Life Sci. Forum 2021, 3, 56. [Google Scholar]


Disclaimer/Publisher’s Note: The statements, opinions and data contained in all publications are solely those of the individual author(s) and contributor(s) and not of MDPI and/or the editor(s). MDPI and/or the editor(s) disclaim responsibility for any injury to people or property resulting from any ideas, methods, instructions or products referred to in the content. |
© 2023 by the authors. Licensee MDPI, Basel, Switzerland. This article is an open access article distributed under the terms and conditions of the Creative Commons Attribution (CC BY) license (https://creativecommons.org/licenses/by/4.0/).
Share and Cite
Rosa, I.F.; Peçanha, A.P.B.; Carvalho, T.R.B.; Alexandre, L.S.; Ferreira, V.G.; Doretto, L.B.; Souza, B.M.; Nakajima, R.T.; da Silva, P.; Barbosa, A.P.; et al. Photobiomodulation Reduces the Cytokine Storm Syndrome Associated with COVID-19 in the Zebrafish Model. Int. J. Mol. Sci. 2023, 24, 6104. https://doi.org/10.3390/ijms24076104
Rosa IF, Peçanha APB, Carvalho TRB, Alexandre LS, Ferreira VG, Doretto LB, Souza BM, Nakajima RT, da Silva P, Barbosa AP, et al. Photobiomodulation Reduces the Cytokine Storm Syndrome Associated with COVID-19 in the Zebrafish Model. International Journal of Molecular Sciences. 2023; 24(7):6104. https://doi.org/10.3390/ijms24076104
Chicago/Turabian StyleRosa, Ivana F., Ana P. B. Peçanha, Tábata R. B. Carvalho, Leonardo S. Alexandre, Vinícius G. Ferreira, Lucas B. Doretto, Beatriz M. Souza, Rafael T. Nakajima, Patrick da Silva, Ana P. Barbosa, and et al. 2023. "Photobiomodulation Reduces the Cytokine Storm Syndrome Associated with COVID-19 in the Zebrafish Model" International Journal of Molecular Sciences 24, no. 7: 6104. https://doi.org/10.3390/ijms24076104
APA StyleRosa, I. F., Peçanha, A. P. B., Carvalho, T. R. B., Alexandre, L. S., Ferreira, V. G., Doretto, L. B., Souza, B. M., Nakajima, R. T., da Silva, P., Barbosa, A. P., Gomes-de-Pontes, L., Bomfim, C. G., Machado-Santelli, G. M., Condino-Neto, A., Guzzo, C. R., Peron, J. P. S., Andrade-Silva, M., Câmara, N. O. S., Garnique, A. M. B., ... Charlie-Silva, I. (2023). Photobiomodulation Reduces the Cytokine Storm Syndrome Associated with COVID-19 in the Zebrafish Model. International Journal of Molecular Sciences, 24(7), 6104. https://doi.org/10.3390/ijms24076104