Article

Gene Structure, Expression and Function Analysis of MEF2 in the Pacific White Shrimp Litopenaeus vannamei

1
School of Life and Sciences, Qingdao University, Qingdao 266071, China
2
CAS and Shandong Province Key Laboratory of Experimental Marine Biology, Institute of Oceanology, Chinese Academy of Sciences, Qingdao 266071, China
3
College of Earth Science, University of Chinese Academy of Sciences, Beijing 100049, China
4
Laboratory for Marine Biology and Biotechnology, Qingdao National Laboratory for Marine Science and Technology, Qingdao 266237, China
5
Center for Ocean Mega-Science, Chinese Academy of Sciences, Qingdao 266071, China
*
Authors to whom correspondence should be addressed.
Int. J. Mol. Sci. 2023, 24(6), 5832; https://doi.org/10.3390/ijms24065832
Submission received: 7 February 2023 / Revised: 8 March 2023 / Accepted: 15 March 2023 / Published: 18 March 2023
(This article belongs to the Section Molecular Genetics and Genomics)

Abstract

:
The Pacific white shrimp Litopenaeus vannamei is the most economically important crustacean in the world. The growth and development of shrimp muscle has always been the focus of attention. Myocyte Enhancer Factor 2 (MEF2), a member of MADS transcription factor, has an essential influence on various growth and development programs, including myogenesis. In this study, based on the genome and transcriptome data of L. vannamei, the gene structure and expression profiles of MEF2 were characterized. We found that the LvMEF2 was widely expressed in various tissues, mainly in the Oka organ, brain, intestine, heart, and muscle. Moreover, LvMEF2 has a large number of splice variants, and the main forms are the mutually exclusive exon and alternative 5′ splice site. The expression profiles of the LvMEF2 splice variants varied under different conditions. Interestingly, some splice variants have tissue or developmental expression specificity. After RNA interference into LvMEF2, the increment in the body length and weight decreased significantly and even caused death, suggesting that LvMEF2 can affect the growth and survival of L. vannamei. Transcriptome analysis showed that after LvMEF2 was knocked down, the protein synthesis and immune-related pathways were affected, and the associated muscle protein synthesis decreased, indicating that LvMEF2 affected muscle formation and the immune system. The results provide an important basis for future studies of the MEF2 gene and the mechanism of muscle growth and development in shrimp.

1. Introduction

The abdominal muscles of penaeid shrimps account for more than 65% of their body weight. Improving muscle production and quality is an important topic in the shrimp industry. The muscle type of the shrimp is primarily striated muscle [1,2], and a series of intricate morphological, physiological and biochemical changes occur during the growth and development process of shrimp muscles. However, there are few studies on the genes regulating muscle growth and development in shrimp.
Myocyte Enhancer Factor 2 (MEF2), a member of the MADS transcription factor family [3], was first discovered in mammalian muscle cell culture, which directs various cellular functions, including muscle cell development and growth [4]. There are four paralogs in invertebrates, designated MEF2A, B, C, and D [5]; meanwhile, in invertebrates, such as sea urchins and Drosophila, there is only single MEF2 gene. The MEF2 gene of vertebrates has various forms of alternative splice variants; for example, in common carp (Cyprinus carpio) the invertebrate subfamilies, except MEF2B, all have alternative splicing, among which MEF2C has the most splice variants [6]; in chimpanzees (Pan troglodytes), 16 and 17 transcripts were found for the MEF2C and MEF2D genes, respectively [7]. Numerous isoforms and complex alternative splicing result in structural diversity in the vertebrate MEF2 gene.
Structural diversity corresponds to functional complexity. The critical functional domains of MEF2 include the N-terminal highly conserved MADS-box (determining DNA-binding specificity) and the MEF2 domain (for high-affinity DNA binding and dimerization) [8]; meanwhile, its C-terminal, which is required for transcriptional activation, varies widely among species. In addition, MEF2 also has a conserved domain HJURP-C, whose function remains to be analyzed. The MEF2 is a member of the evolutionarily ancient MADS family of transcription factors [9], and the active site of MEF2 has been found to exist in the cis-regulatory modules (CRMs) of muscle-specific genes, which regulate muscle gene expression [10]. In livestock, MEF2 could coordinately control the type of muscle fiber differentiation by binding in the E-box region of the MSTN promoter region. MSTN promoter activity is significantly enhanced by MEF2C overexpression [11]. The 5’UTR (untranslated region) of sheep myosin light-chain family genes contains the binding sites of MEF2, which indicates that the transcription factor is important for muscle growth and contraction [12,13]. It had been found that MRFS family members (MyoD, MyoG, MRF5, and MRF4) and MEF2 could act synergistically to not only promote, but also inhibit skeletal muscle differentiation. For example, a study in rabbits showed that TRIM72, a novel negative feedback regulator of muscle, was co-activated at the transcriptional level by MyoD (or myogenin) and MEF2, which bind to the E-box and MEF2 sites of the TRIM72 promoter, respectively. Mutations in these sites resulted in decreased TRIM72 promoter activity; however, the activity could be restored by synergistically enhancing MyoD and MEF2 [14]. Recent studies have also found that MRF4 can control muscle mass by inhibiting the activity of MEF2 in adult skeletal muscle [15]. Other studies have shown that MEF2 also plays an important role in neurodevelopment and cancer development [16]. In carp, MEF2A, MEF2B, and MEF2Cb play a role in early neurodevelopment, and MEF2A, MEF2Ca, MEF2Cb, and MEF2D play a role in early carp muscle development [6]. However, the structure and functions of crustacean MEF2 genes remain largely unexplored.
Previous studies on crustacean muscle growth-related genes have mainly focused on Actin [17], Myosin [18], myostatin (Mstn) [19], p38 [20], and so on, while the MEF2 gene has barely been investigated. In 2015, the MEF2 gene was first identified in the mesoderm of the kuruma shrimp Marsupenaeus japonicus [21]. Wei et al. (2017) reported the MEF2 gene in the Pacific white shrimp Litopenaeus vannamei [22], and found that MEF2 was strongly expressed during the limb bud stage, suggesting that MEF2 played an essential role in the early development of penaeid shrimp. Another study found that MEF2 began to express after mesoderm proliferation and persisted in developing the musculature of the amphipod crustacean Parhyale hawaiensis, which is believed to activate muscle differentiation and promote muscle growth and development [23]. In banana shrimp Fenneropenaeus merguiensis, it was reported that the 2 kb upstream promoter region of the FmMSTN contained putative response elements of MEF2 [24]. However, the expression profile and function of MEF2 in adult shrimp are still unknown.
In this study, by analyzing the gene structure, expression profile, and the effect of RNA interference, we explored the characteristics and functions of the MEF2 gene in L. vannamei, which provided an important basis for the further study of the MEF2 gene in shrimp and crustaceans.

2. Results

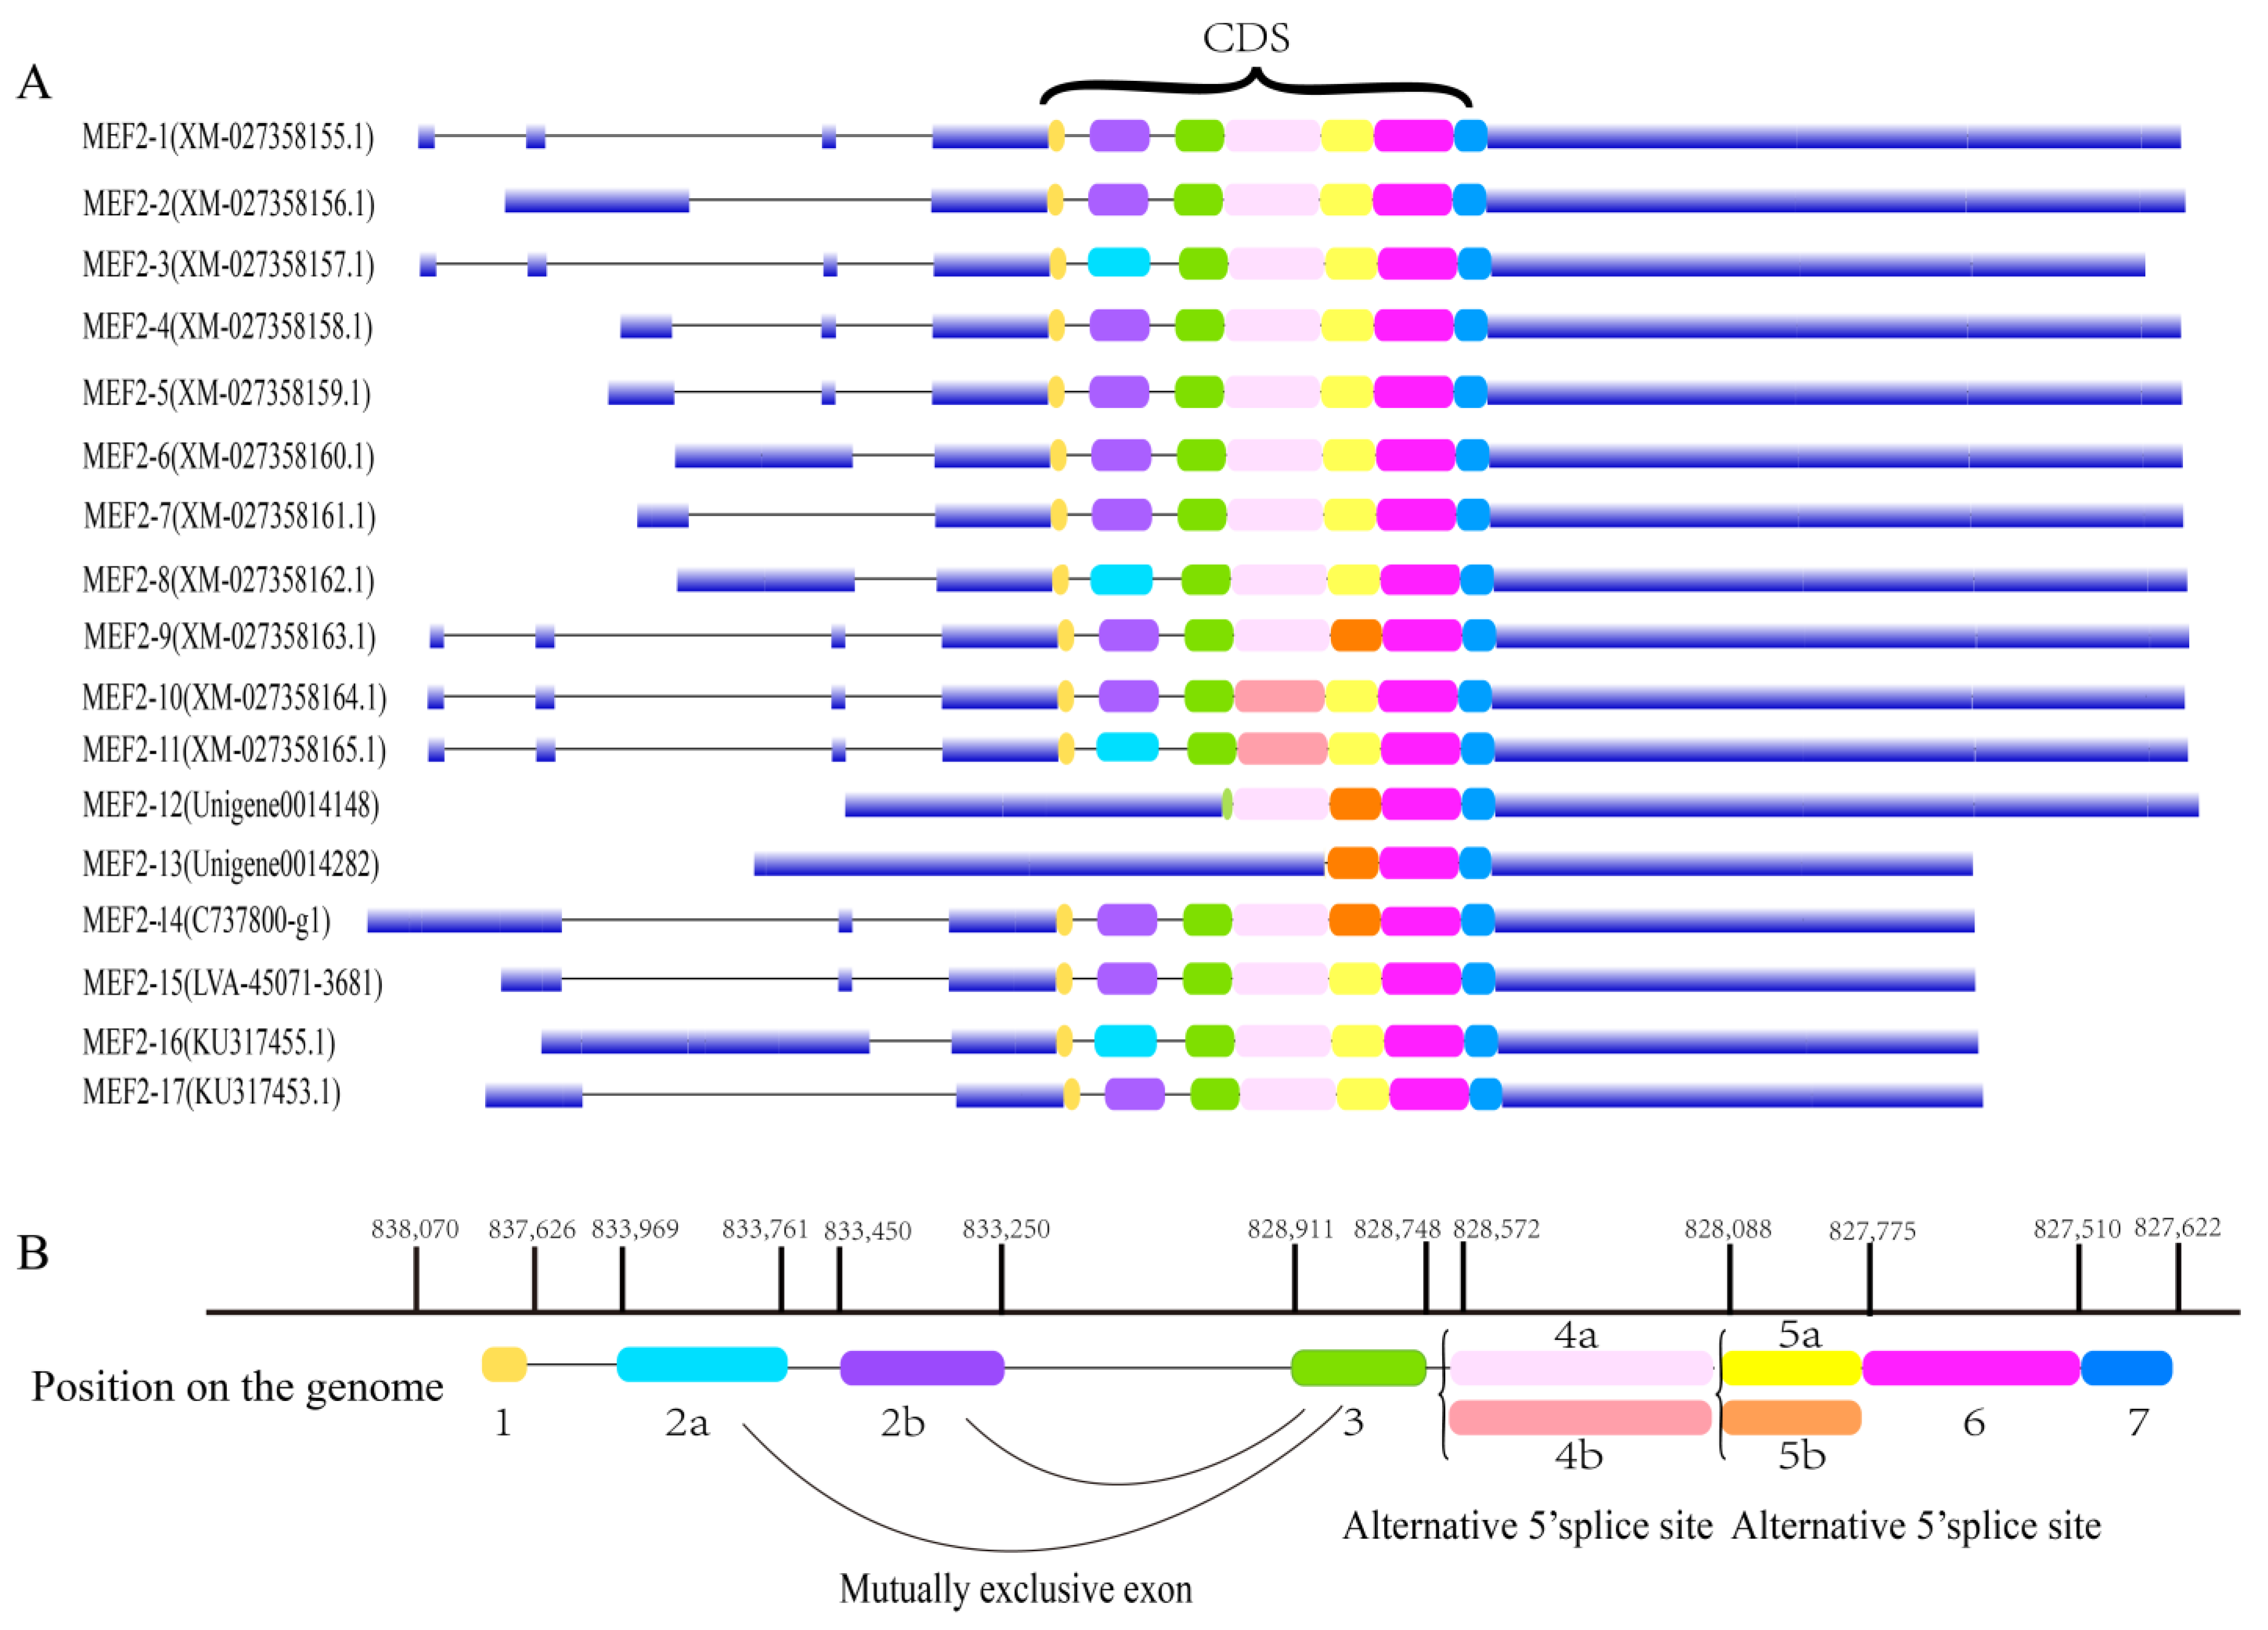
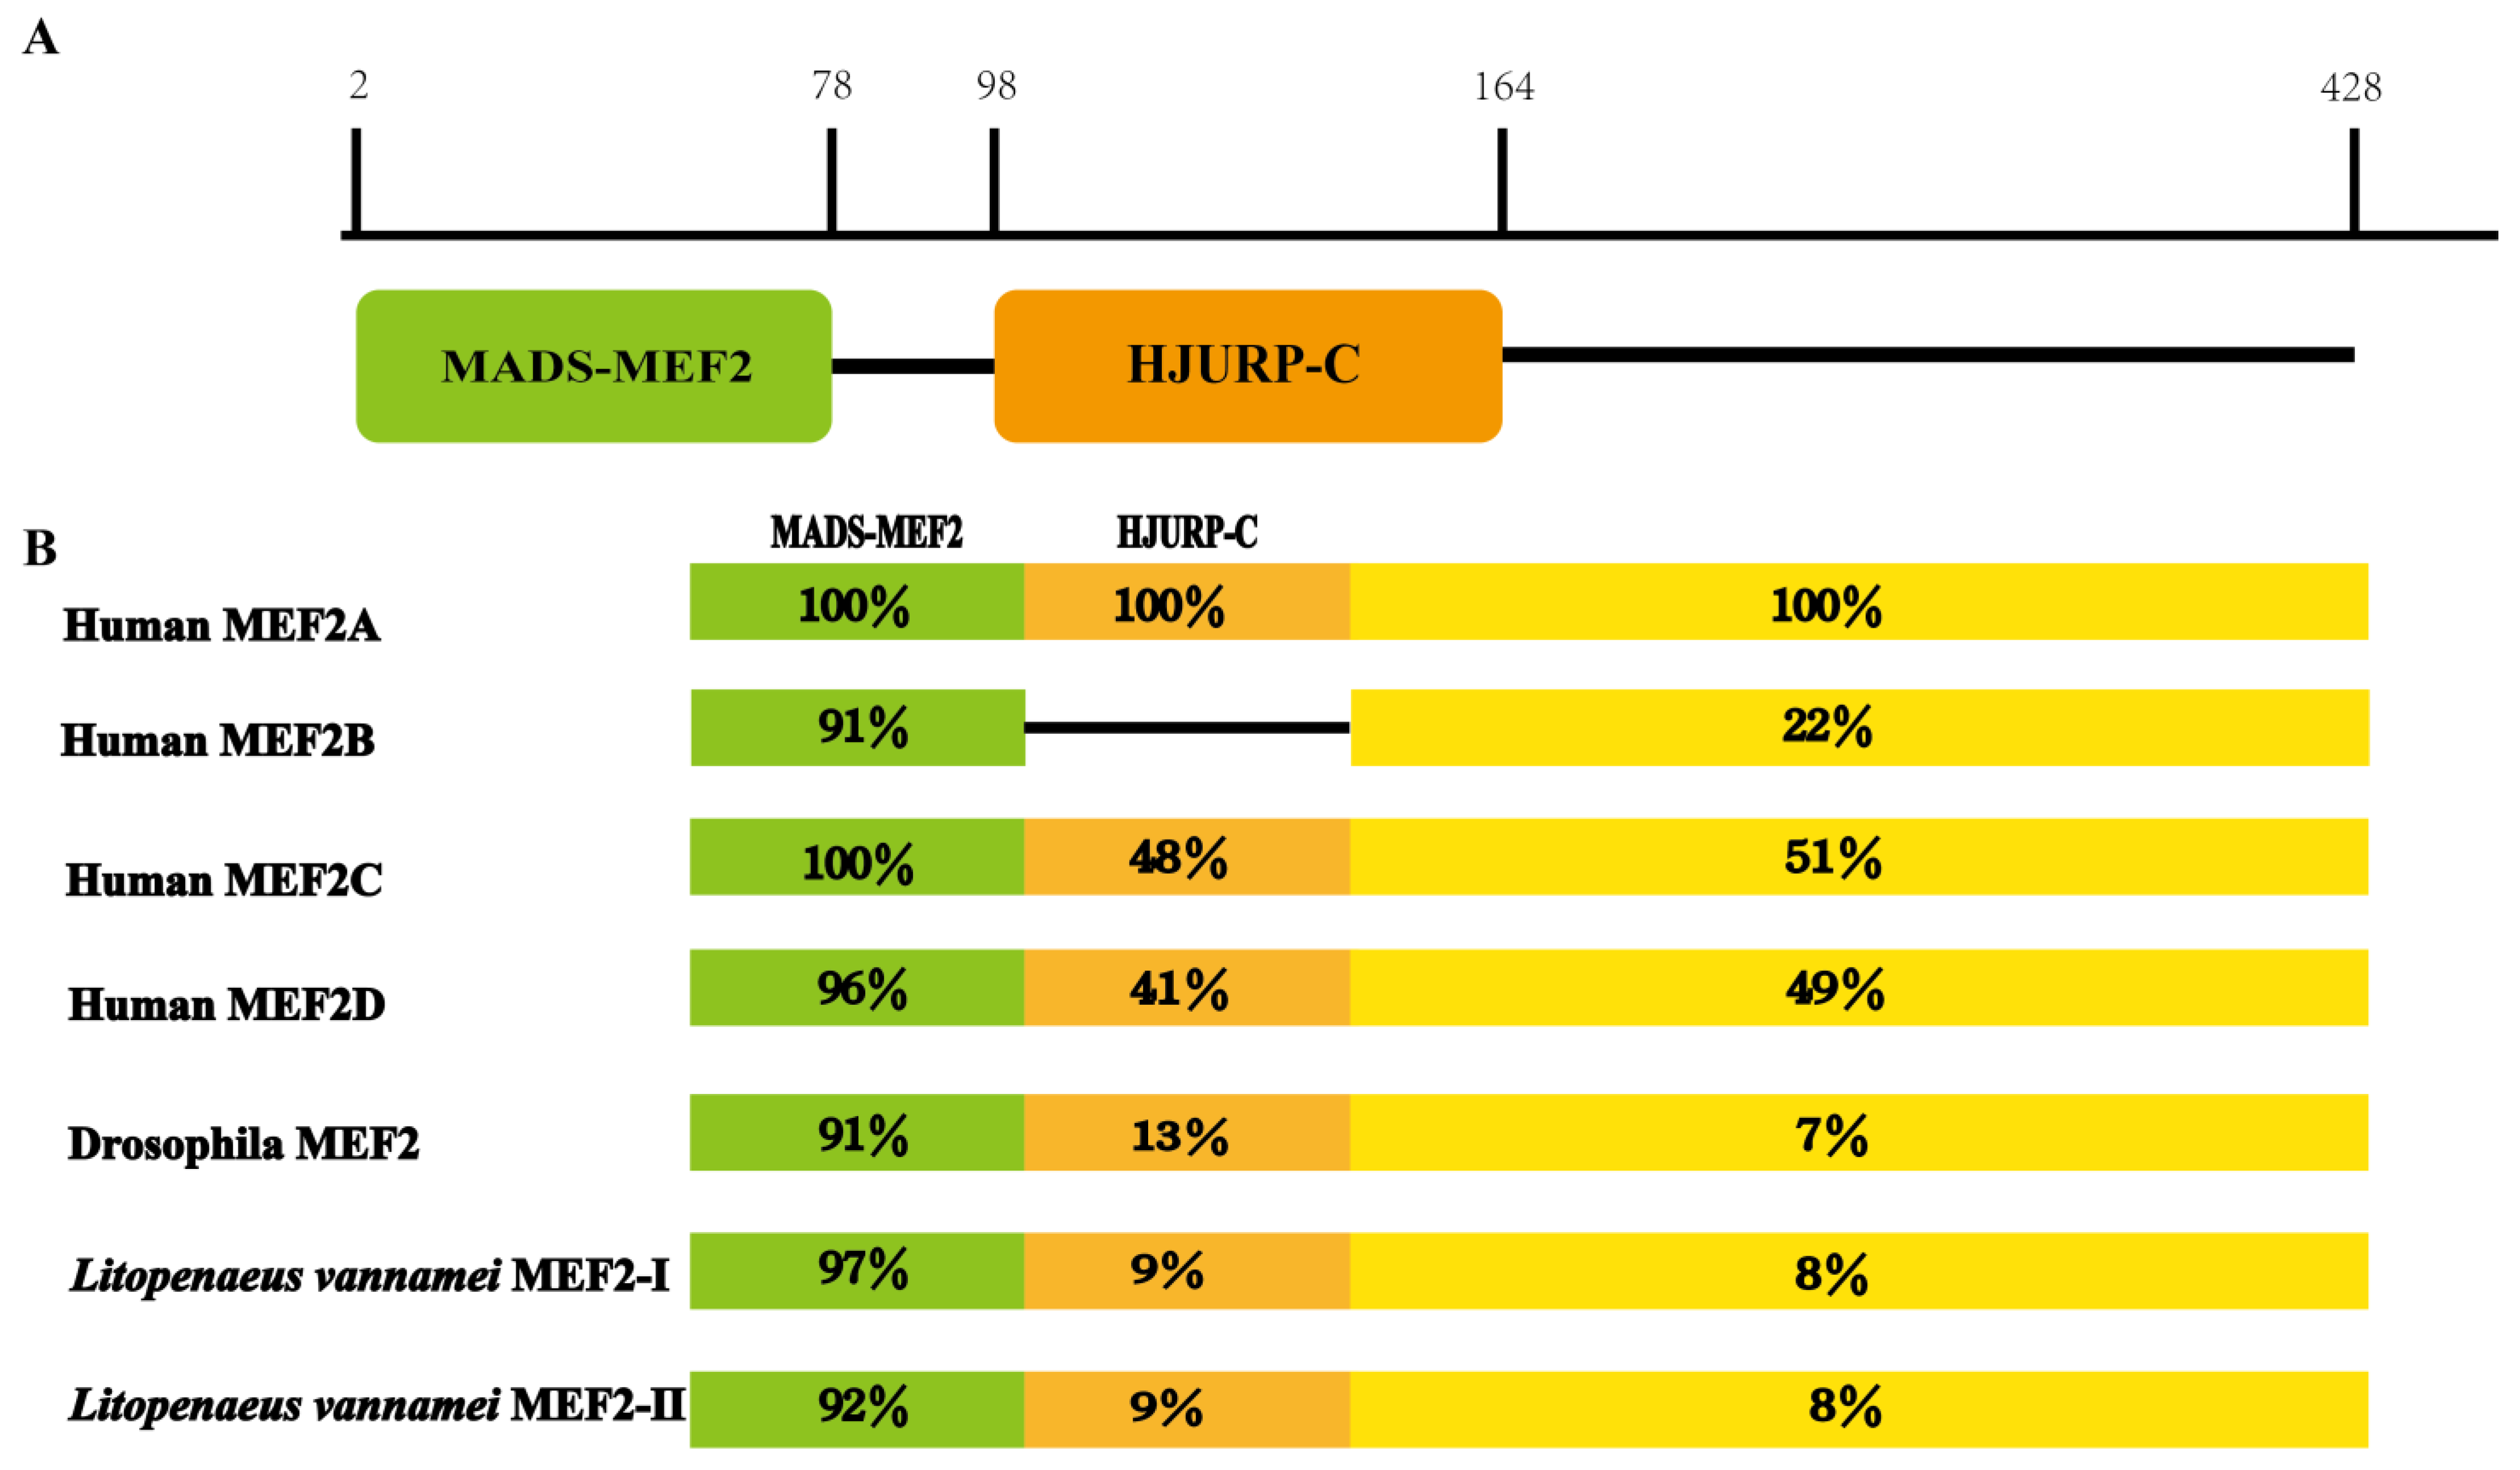
2.1. Structural Analysis of the LvMEF2 Gene

A total of 17 transcripts, annotated as the MEF2 gene, were obtained from the genome and multiple transcriptome data of L. vannamei. Gene location analysis showed that these sequences were all mapped on the same gene (LvMEF2, or LVAN10676), and that the 17 transcripts were named MEF2-1 to MEF2-17 (Supplementary Data S1). A gene structure analysis showed that most of these transcripts’ CDS (coding sequence) region was composed of seven exons, except MEF2-12 and MEF2-13 (Figure 1A). These findings showed that LvMEF2 had a variety of alternative splicing forms with different types, such as alternative promoter, alternative terminator, alternative 5′ splice site, alternative 3′ splice site, exon skipping, and intron retention. Here, we focused on the alternative splicing of the CDS region. By mapping to the genome of L. vannamei, it was found that there were three main alternative splicing sites in the CDS region of LvMEF2, including a mutually exclusive exon 2 and an alternative 5′ splice site in exon 4 and exon 5. Moreover, these exons can be arranged in different combinations, and thus far, eight different CDS transcripts forms of LvMEF2 have been found (Figure 1B).
The 17 transcripts were translated into amino acids to obtain their protein sequences. Through multiple sequence alignment, it was found that there were three main protein sequence difference regions (Supplementary Figure S1) and that the corresponding positions were the site of alternative splicing. The 17 deduced proteins all had a typical MADS-MEF2 domain and a HTURP-C domain (Figure 2A), except for MEF2-12 and MEF2-13. Therefore, a typical LvMEF2 consists of 7 exons. The MEF2-16 and MEF2-17, were mutually exclusive exons for splicing and were named LvMEF2-Ι and LvMEF2-ΙI.
By comparing the functional domains of the MEF2 genes in different species, the MADS domain showed extensive sequence similarity, the HJURP-C domain was less conserved, and the C-terminal sequence had diverged considerably (Figure 2B). A multiple sequence alignment of the MEF2 genes for different species is shown in Supplementary Figure S2.
The MEF2-16 (LvMEF2-Ι) and MEF2-17 (LvMEF2-ΙI) were selected to analyze their physicochemical properties. LvMEF2-Ι encoded 428 amino acids with an estimated molecular weight of 46.67 kDa, they were mainly composed of proline (Pro, 12.1%) and serine (Ser, 12.1%); the theoretical isoelectric point (pI) was 8.95, the average hydrophobicity was −0.815, and the instability coefficient was 61.85. LvMEF2-ΙI encoded 428 amino acids with a predicted molecular weight of 46.7 kDa, they were mainly composed of proline (Pro, 12.1%) and serine (Ser, 12.6%), the theoretical isoelectric point (pI) was 8.82, the average hydrophobicity was −0.804, and the instability coefficient was 58.48.

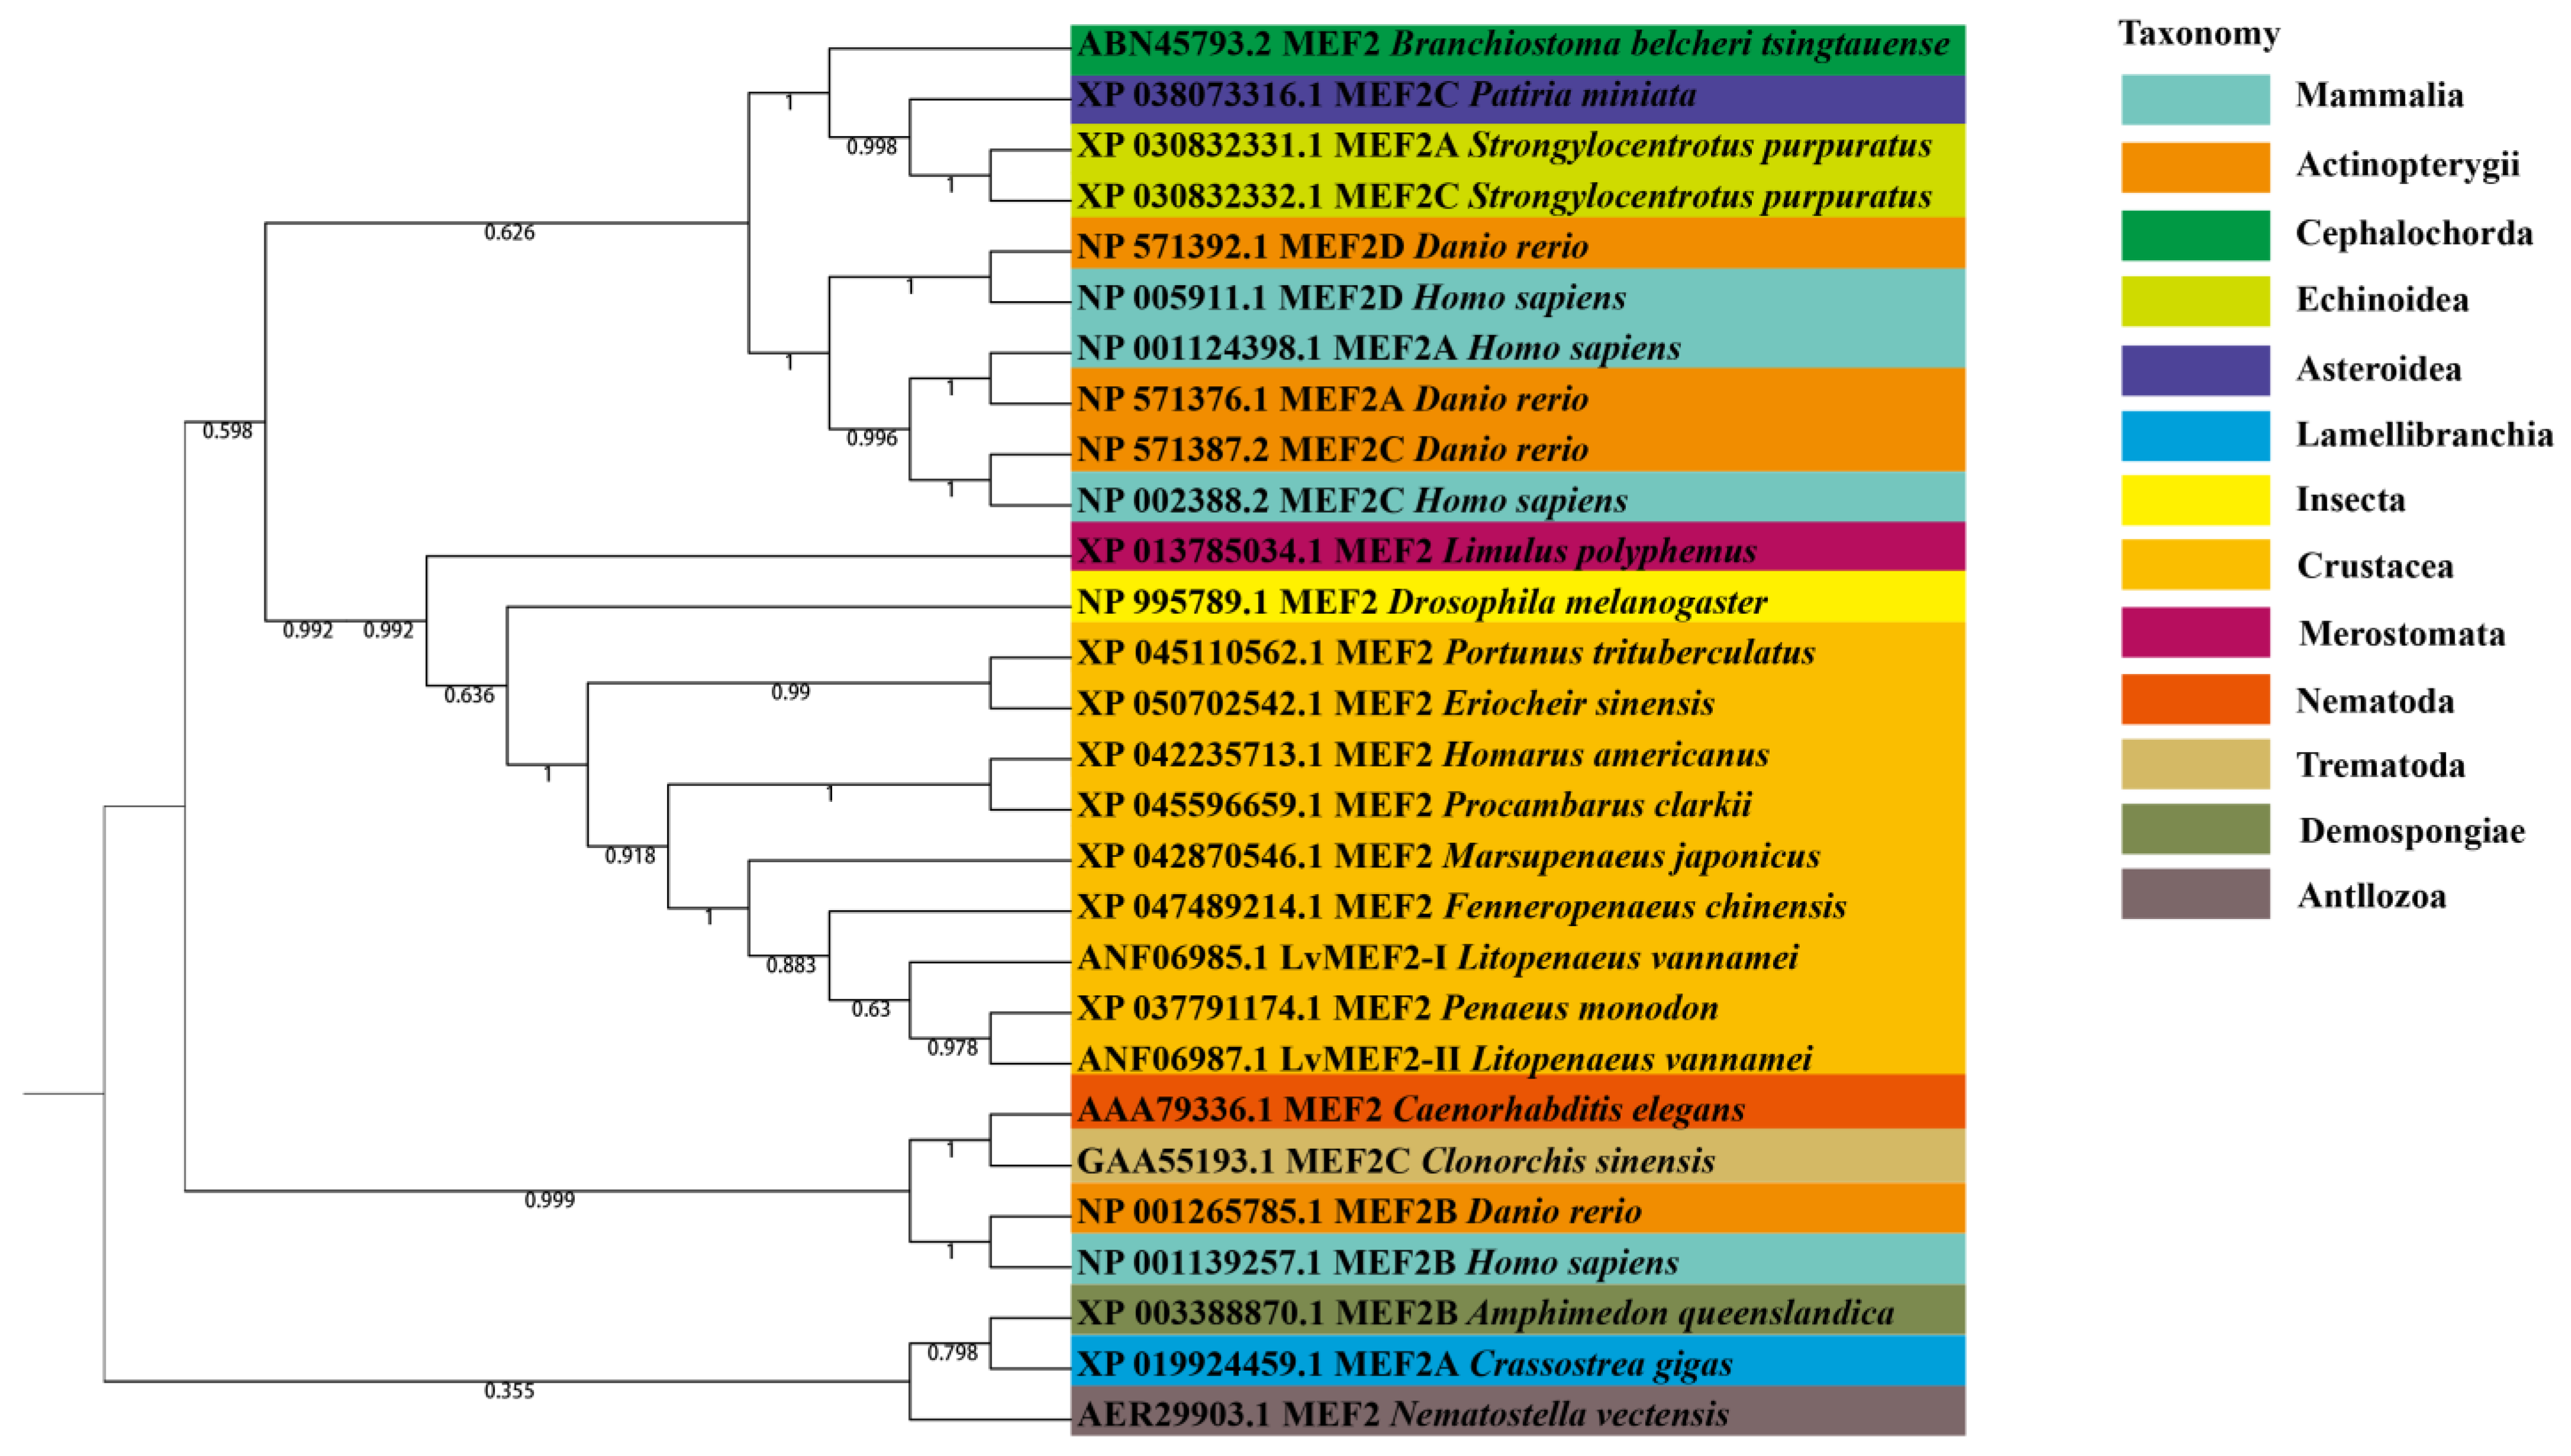
2.2. Phylogenetic Analysis of LvMEF2 Gene

Deduced amino acid sequences of two splice variants of LvMEF2 (LvMEF2-Ι and LvMEF2-ΙI) and 27 MEF2 protein sequences from different species (Table 1) were selected for phylogenetic tree construction. Through phylogenetic analysis, it could be found that the four paralogs of MEF2 in vertebrates had different evolutionary rates (Figure 3). Among them, the MEF2B of vertebrates belongs to an evolutionary group alone, which is in a relatively primitive clade and clustered together with nematode Caenorhabditis elegans and trematode Clonorchis sinensis. However, the remaining three paralogs of MEF2 in vertebrates were closely related and belonged to the other evolutionary group. The MEF2 of arthropods were clustered well together and constituted an independent clade, which was relatively close to the clade of MEF2A, C, and D of vertebrates, as well to as the clade of echinoderms and amphioxus.

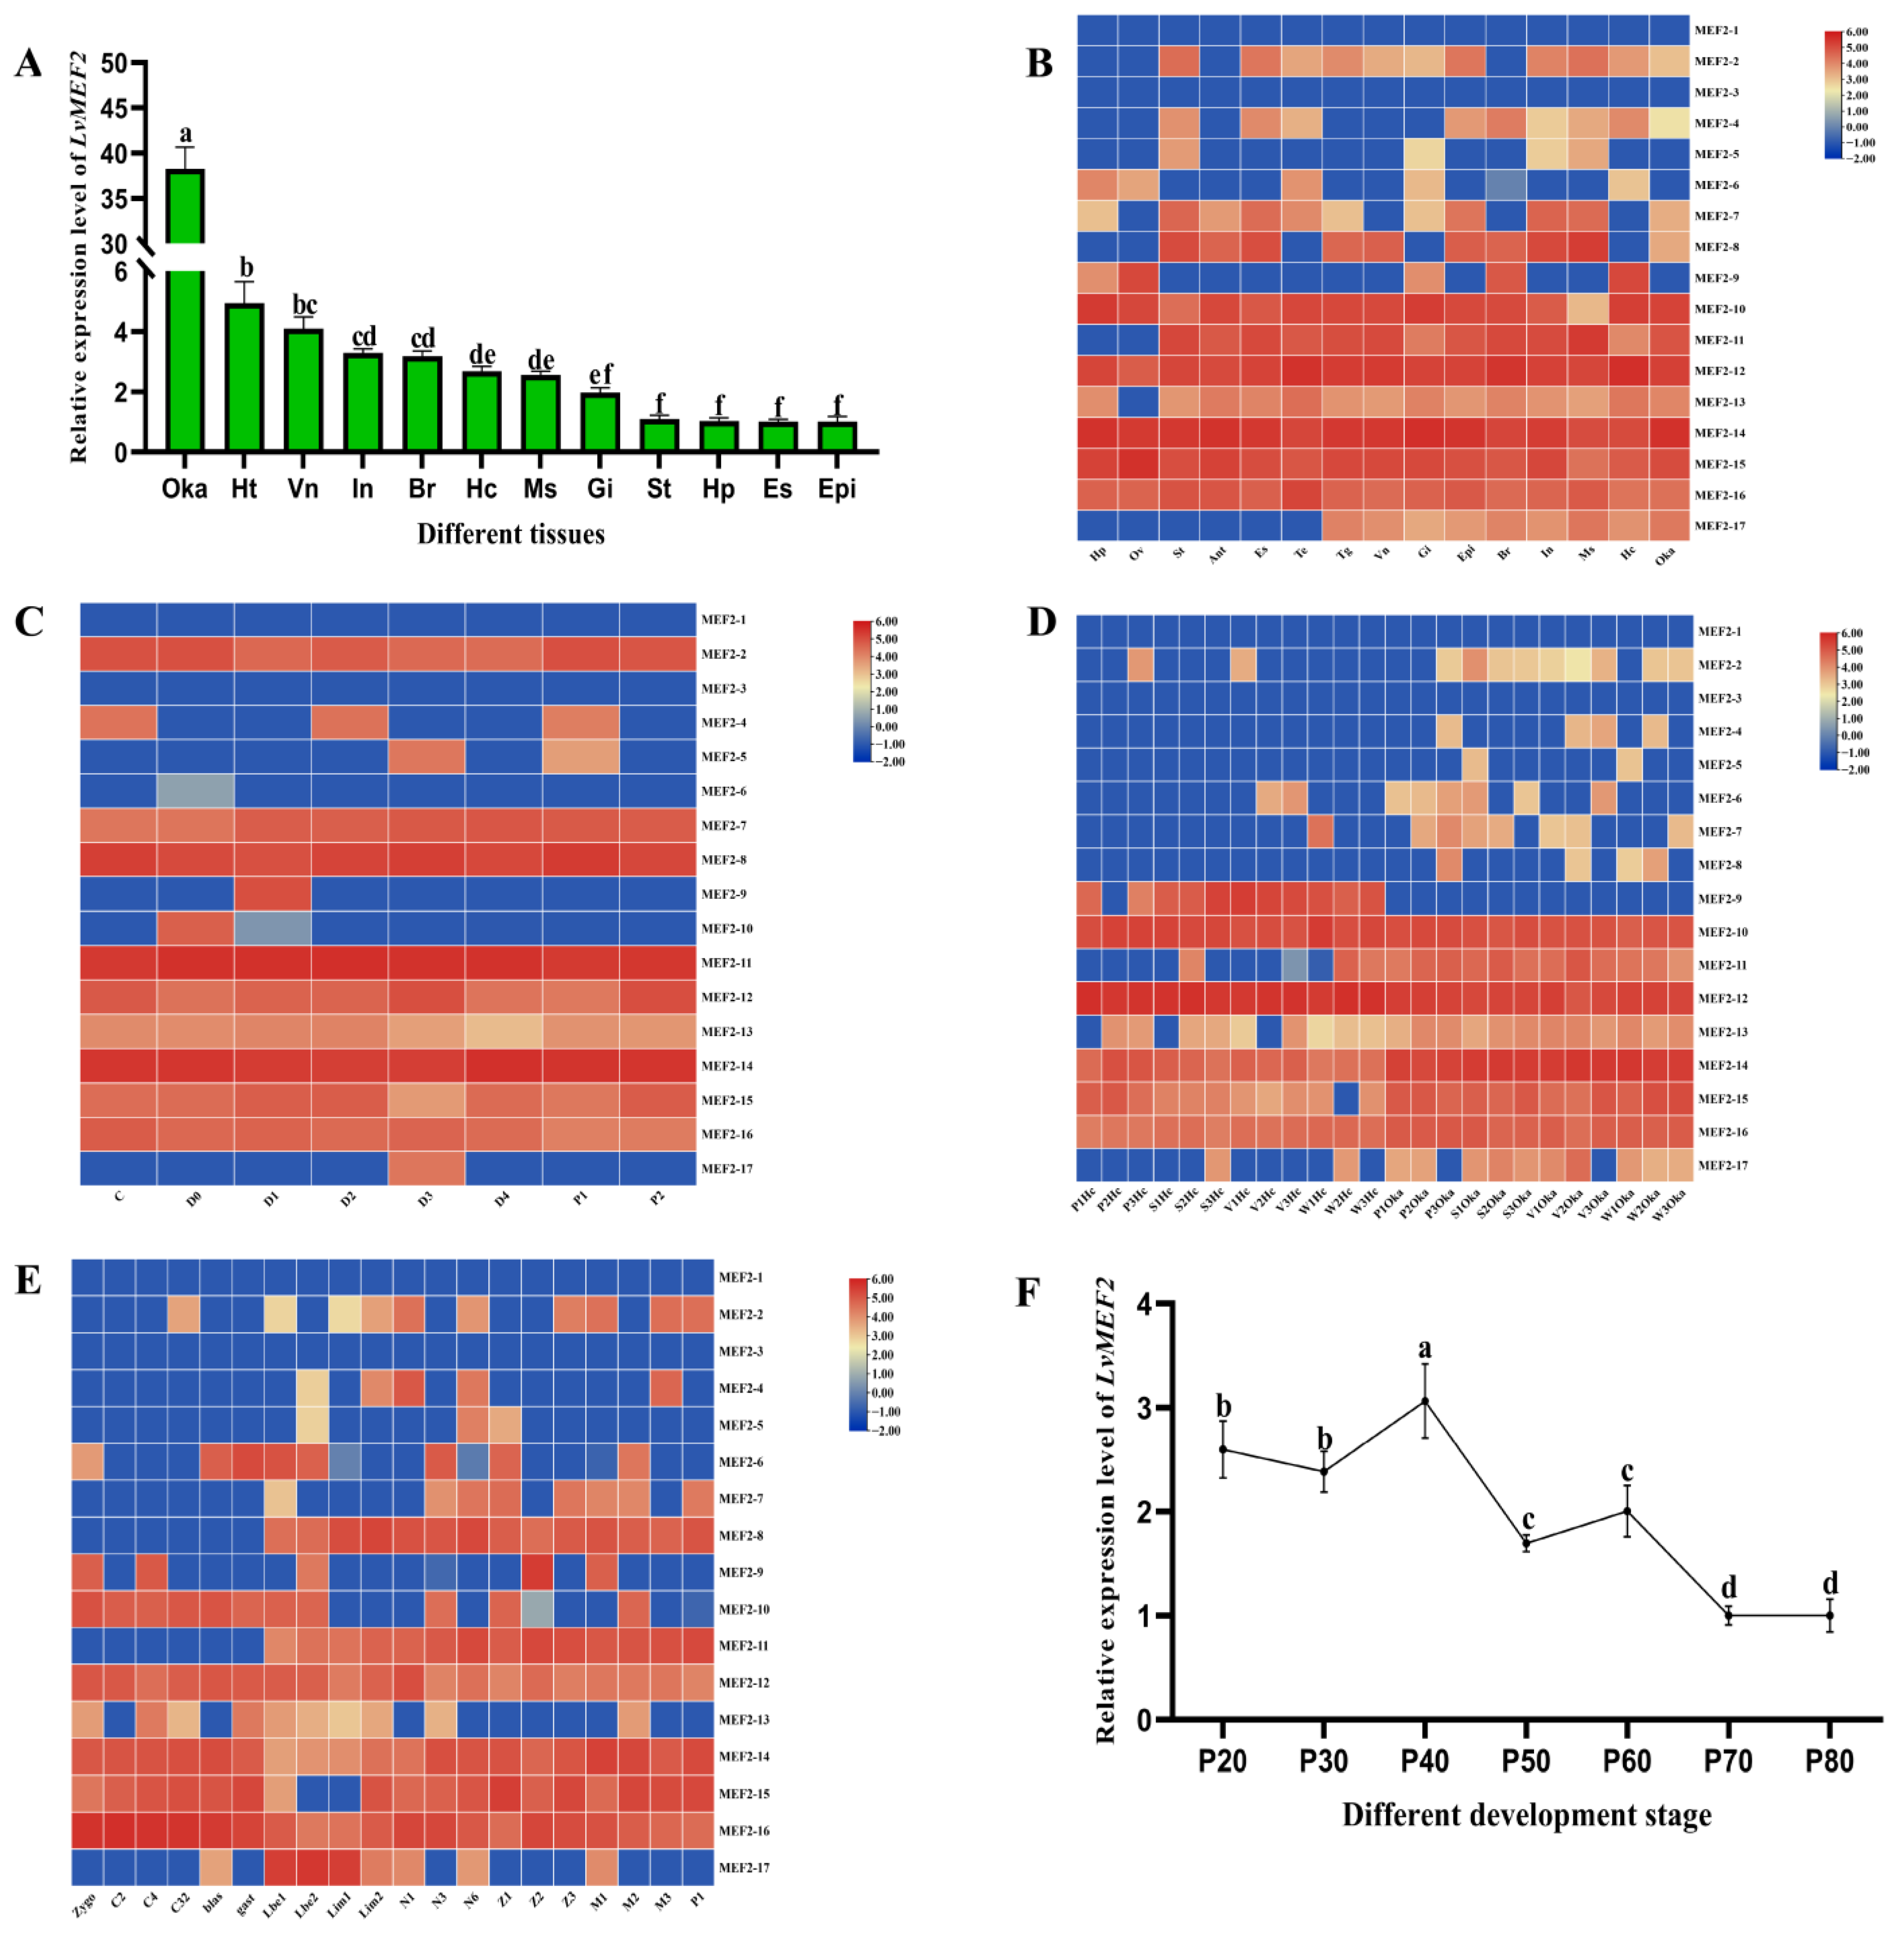
2.3. LvMEF2 Gene Expression Profiles

We analyzed the expression level of LvMEF2 in different adult shrimp tissues and found that LvMEF2 was expressed in all 13 detected tissues. The highest expression was in the Oka organ, followed by the heart, abdominal nerve, muscle, and intestine (Figure 4A). Through transcriptome data from different tissues, we found that LvMEF2 expressed in various splice variants and showed higher expression in the Oka, neural tissue, muscle, and intestine (Figure 4B). Among them, MEF2-17 was expressed in the Oka organ, muscle, brain, epidermis, hemocytes, and a few other tissues, while MEF2-16 was highly expressed in all detected tissues. Interestingly, LvMEF2 contained several specific splice variants in different molting stages. For example, MEF2-4 was expressed in C, D2, and P1 stages, MEF2-5 was expressed in D3 and P1 stages, MEF2-9 was only expressed in D1 stage, MEF2-17 was only expressed in D3 stage, and some splice variants were barely expressed during the molting phase, such as MEF2-6 (Figure 4C). During infection by different pathogens, many splice variants of LvMEF2 were differentially expressed. More interestingly, whether or not infected by a pathogen, MEF2-9 was only expressed in hemocytes, MEF2-11 was definitely expressed in the Oka and occasionally in hemocytes, and MEF2-17 also showed an especially high expression in the Oka but not in hemocytes. In addition, the types of LvMEF2 splice variants were more in the Oka than in hemocytes when stimulated by pathogens (Figure 4D). At the same time, during early development, LvMEF2 was highly expressed in limb bud stage, and the most types of splice variants were also found in the limb bud stage (Figure 4E). Then, LvMEF2 expression was detected from the cephalothorax samples of L. vannamei from 20 to 80 days after post-larvae (P20-P80) by qPCR, the expression level of LvMEF2 fluctuated, and the overall trend was gradually decreased with the growth of the shrimp (Figure 4F).

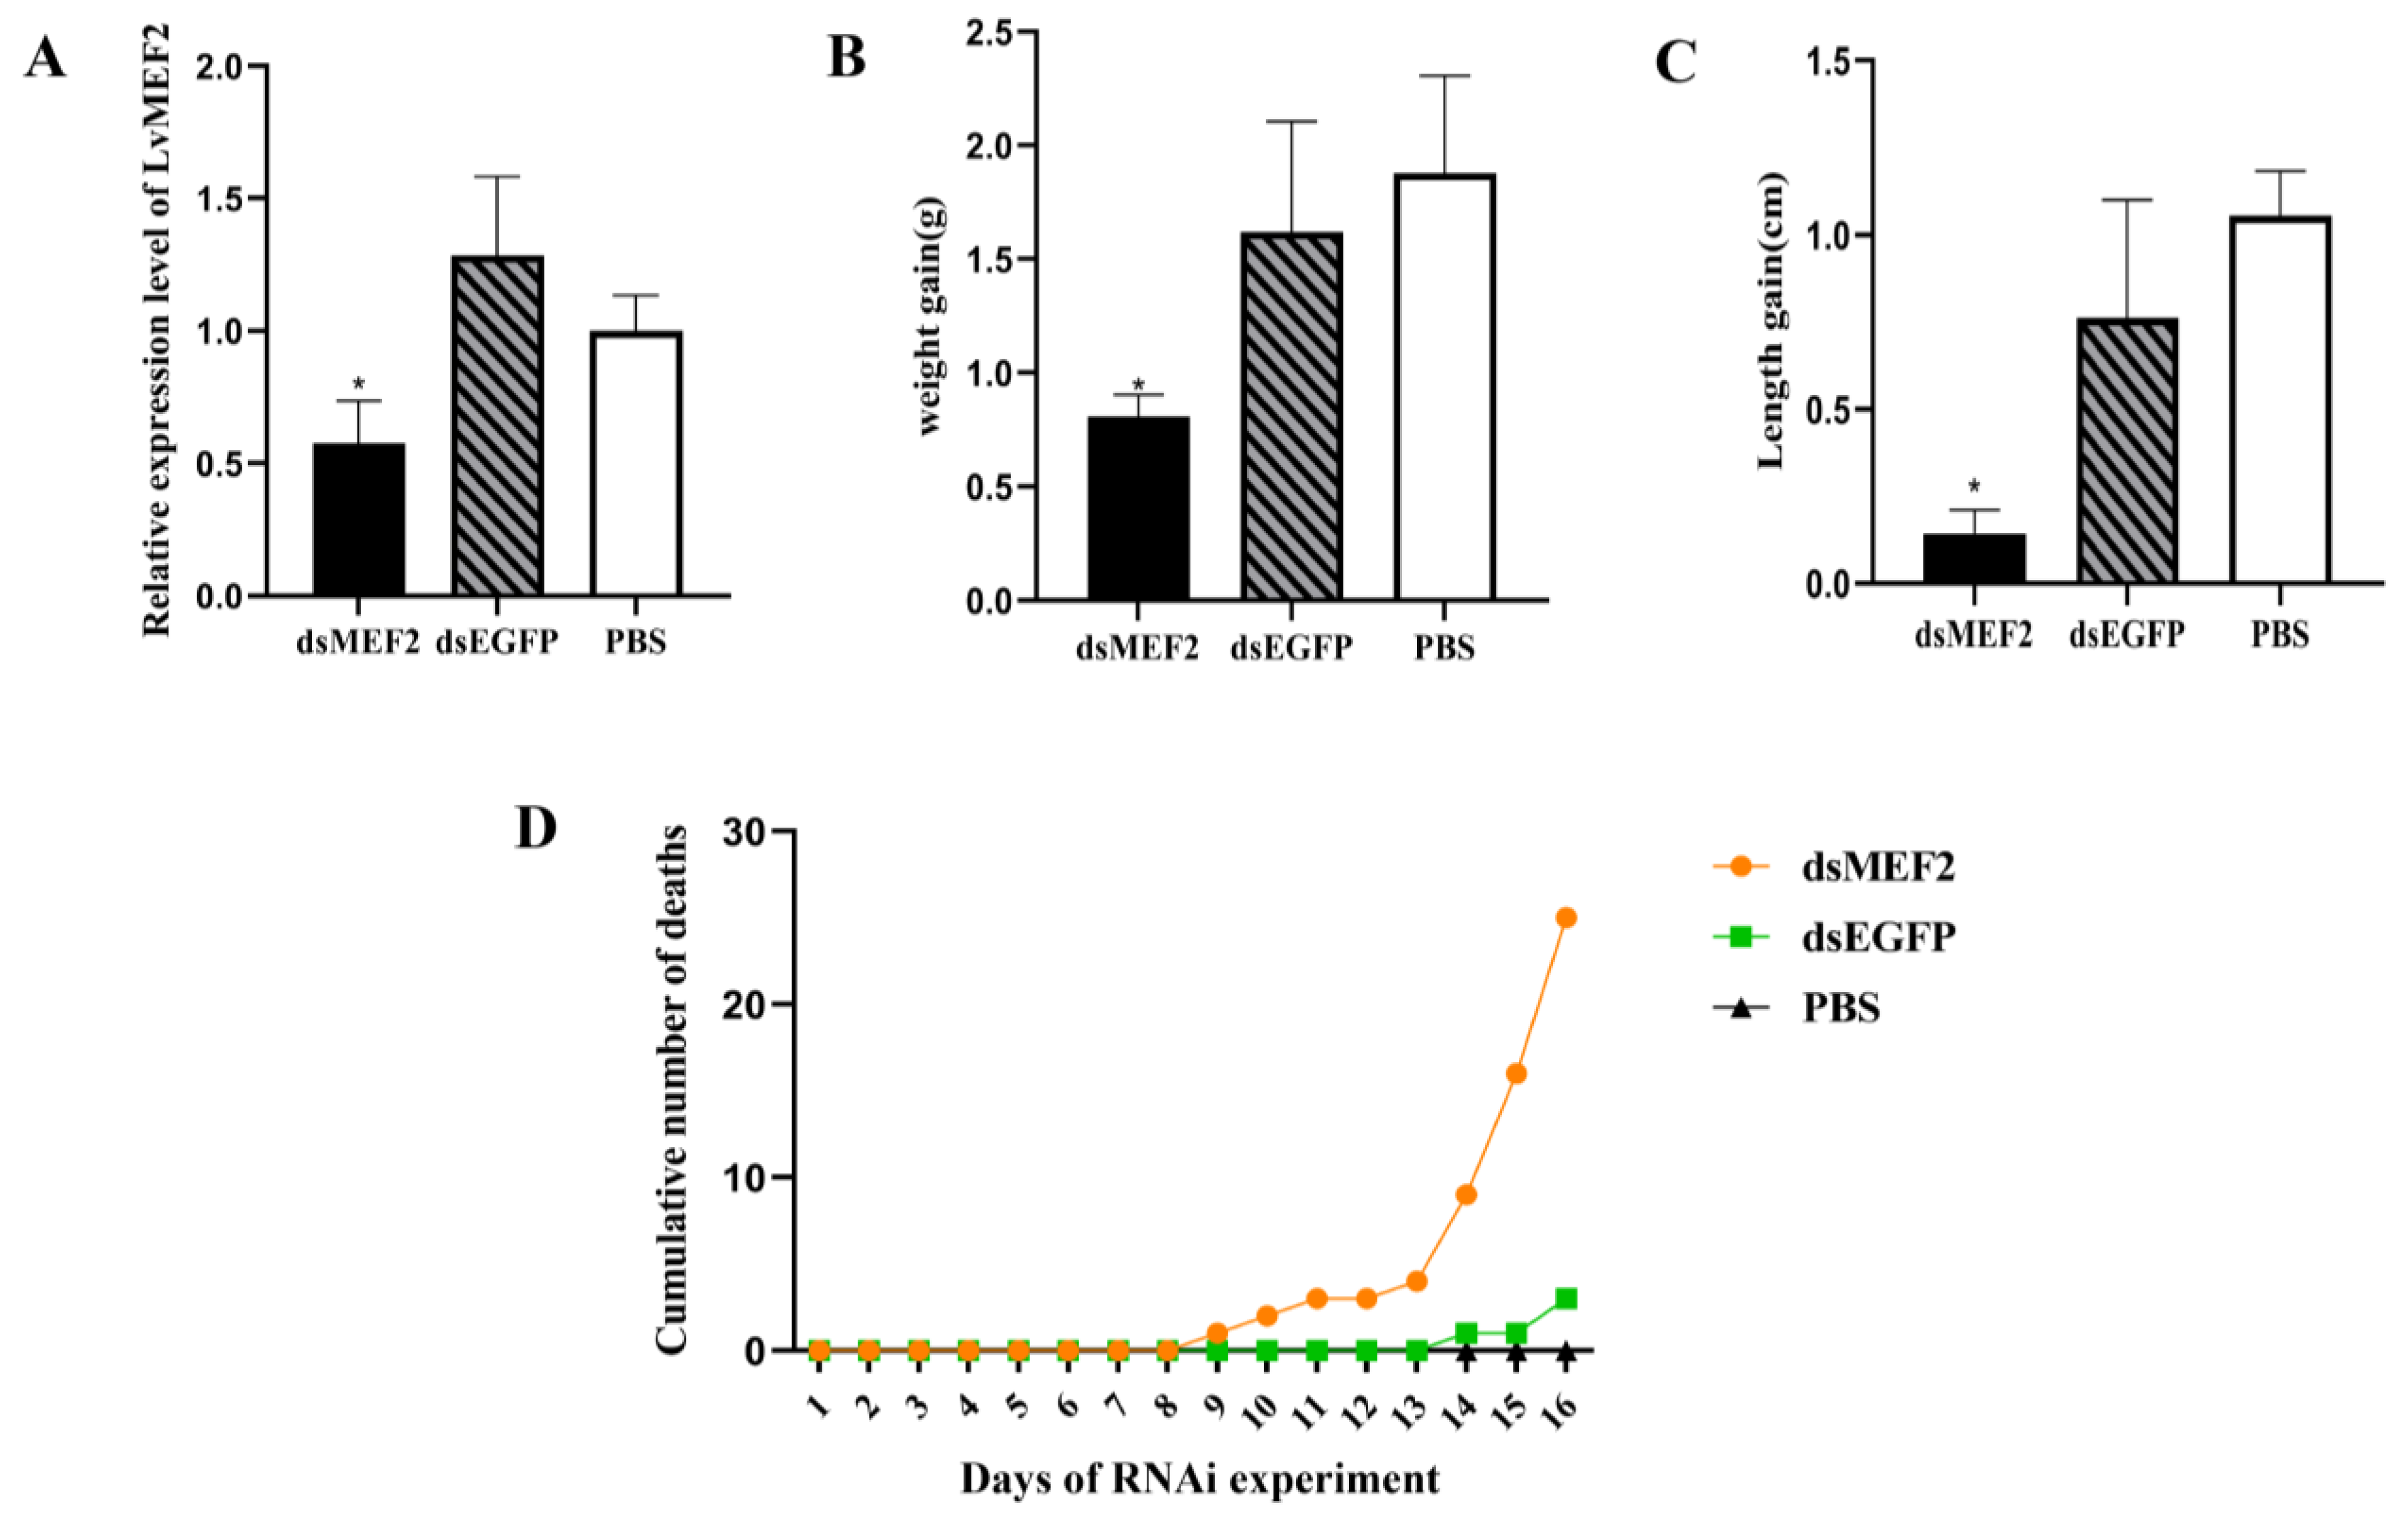
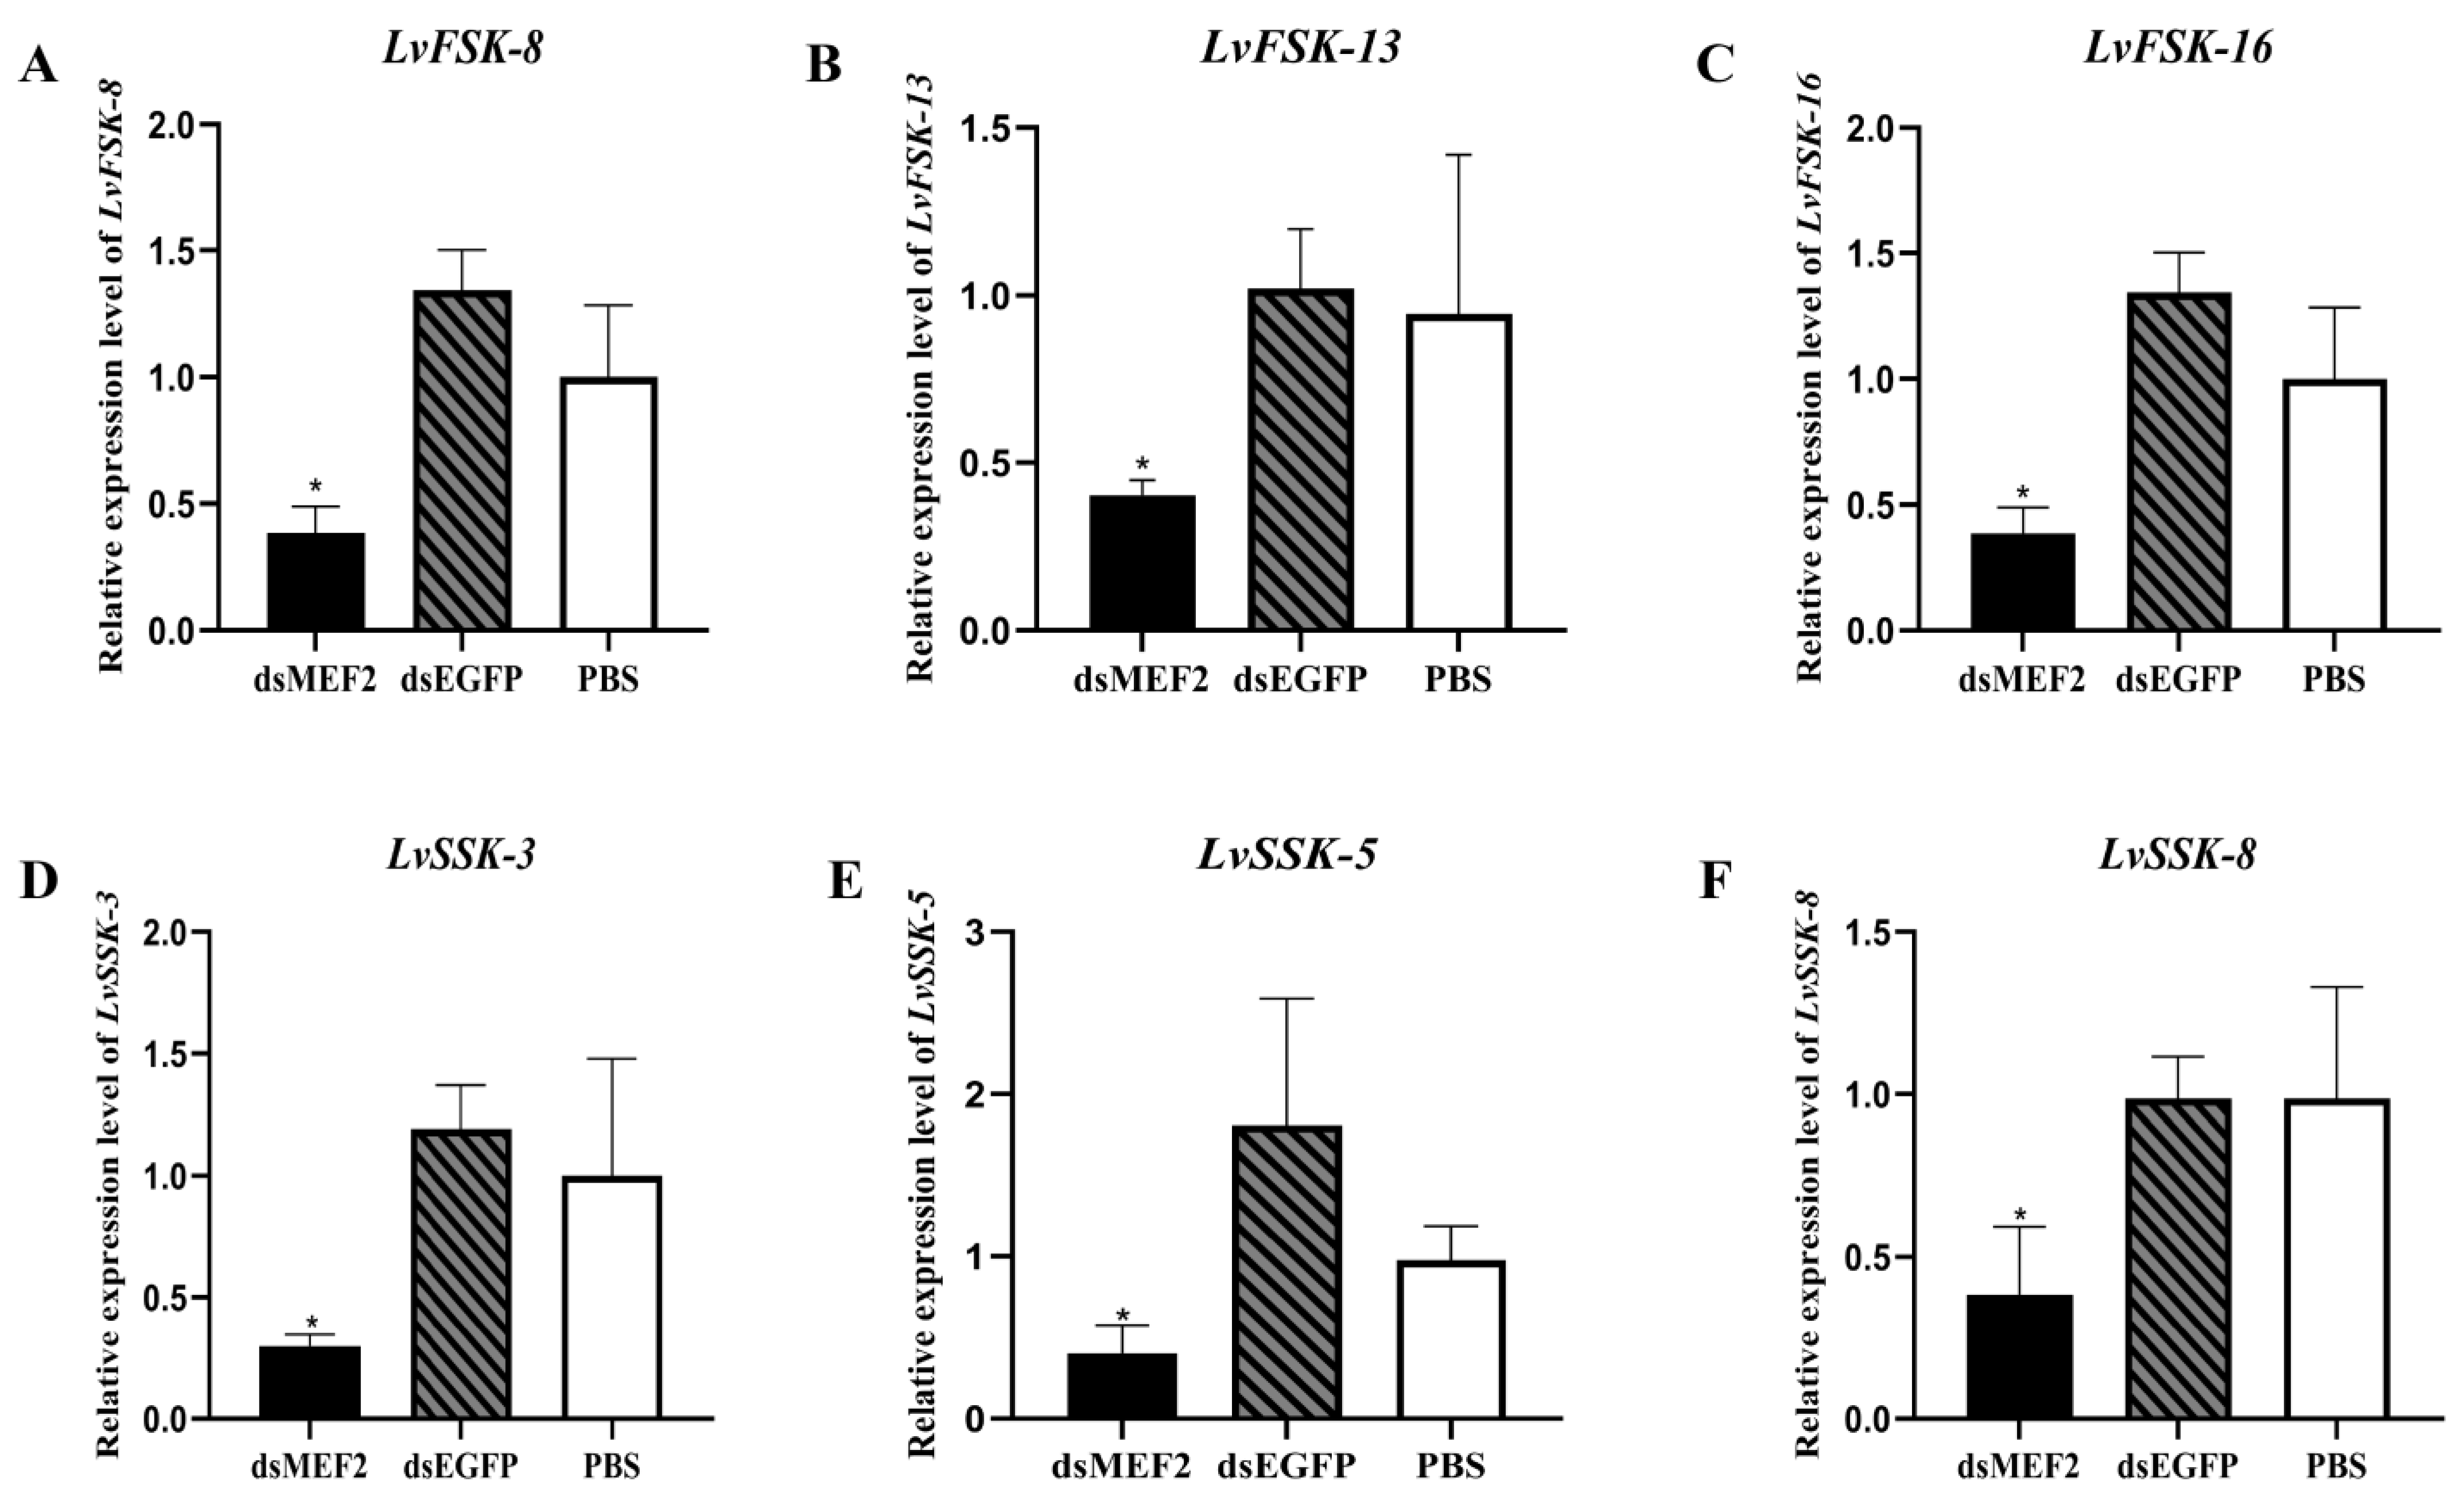
2.4. LvMEF2 RNA Interference

Before conducting the formal RNA interference experiment for LvMEF2, the optimal RNA double-stranded dose was explored using a pre-experiment. By RT-qPCR, the highest interference efficiency of 60% was found when the dosage was 2 μg/individual (Supplementary Figure S3). According to the pre-experimental dose, the experimental shrimp was continuously interfered with for half a month. The results showed that a continuous injection of dsMEF2 RNA significantly down-regulated the expression level of LvMEF2 in muscle (Figure 5A). After half a month of RNA interference, the body length and weight gain in the experimental group (dsMEF2) was significantly lower than that in the two control groups (PBS and EGFP(Enhanced Green Fluorescent Protein) groups) (Figure 5B,C). By recording the cumulative number of deaths, it could be found that the survival of the shrimps had been affected after LvMEF2 RNA interference (Figure 5D). During the experiment, we also counted the molting number of shrimps, which showed a delayed peak during the interference (Supplementary Figure S4).
In order to understand the effect of LvMEF2 knockdown on shrimp muscle, the expression of muscle-related genes was detected. The result showed that the expressions of fast-type skeletal muscle actin (FSK) and slow-type skeletal muscle actin (SSK) genes were all significantly down-regulated after RNA interference compared with the control groups (Figure 6), which showed that LvMEF2 RNA interference can affect muscle growth and development, both FSK and SSK.

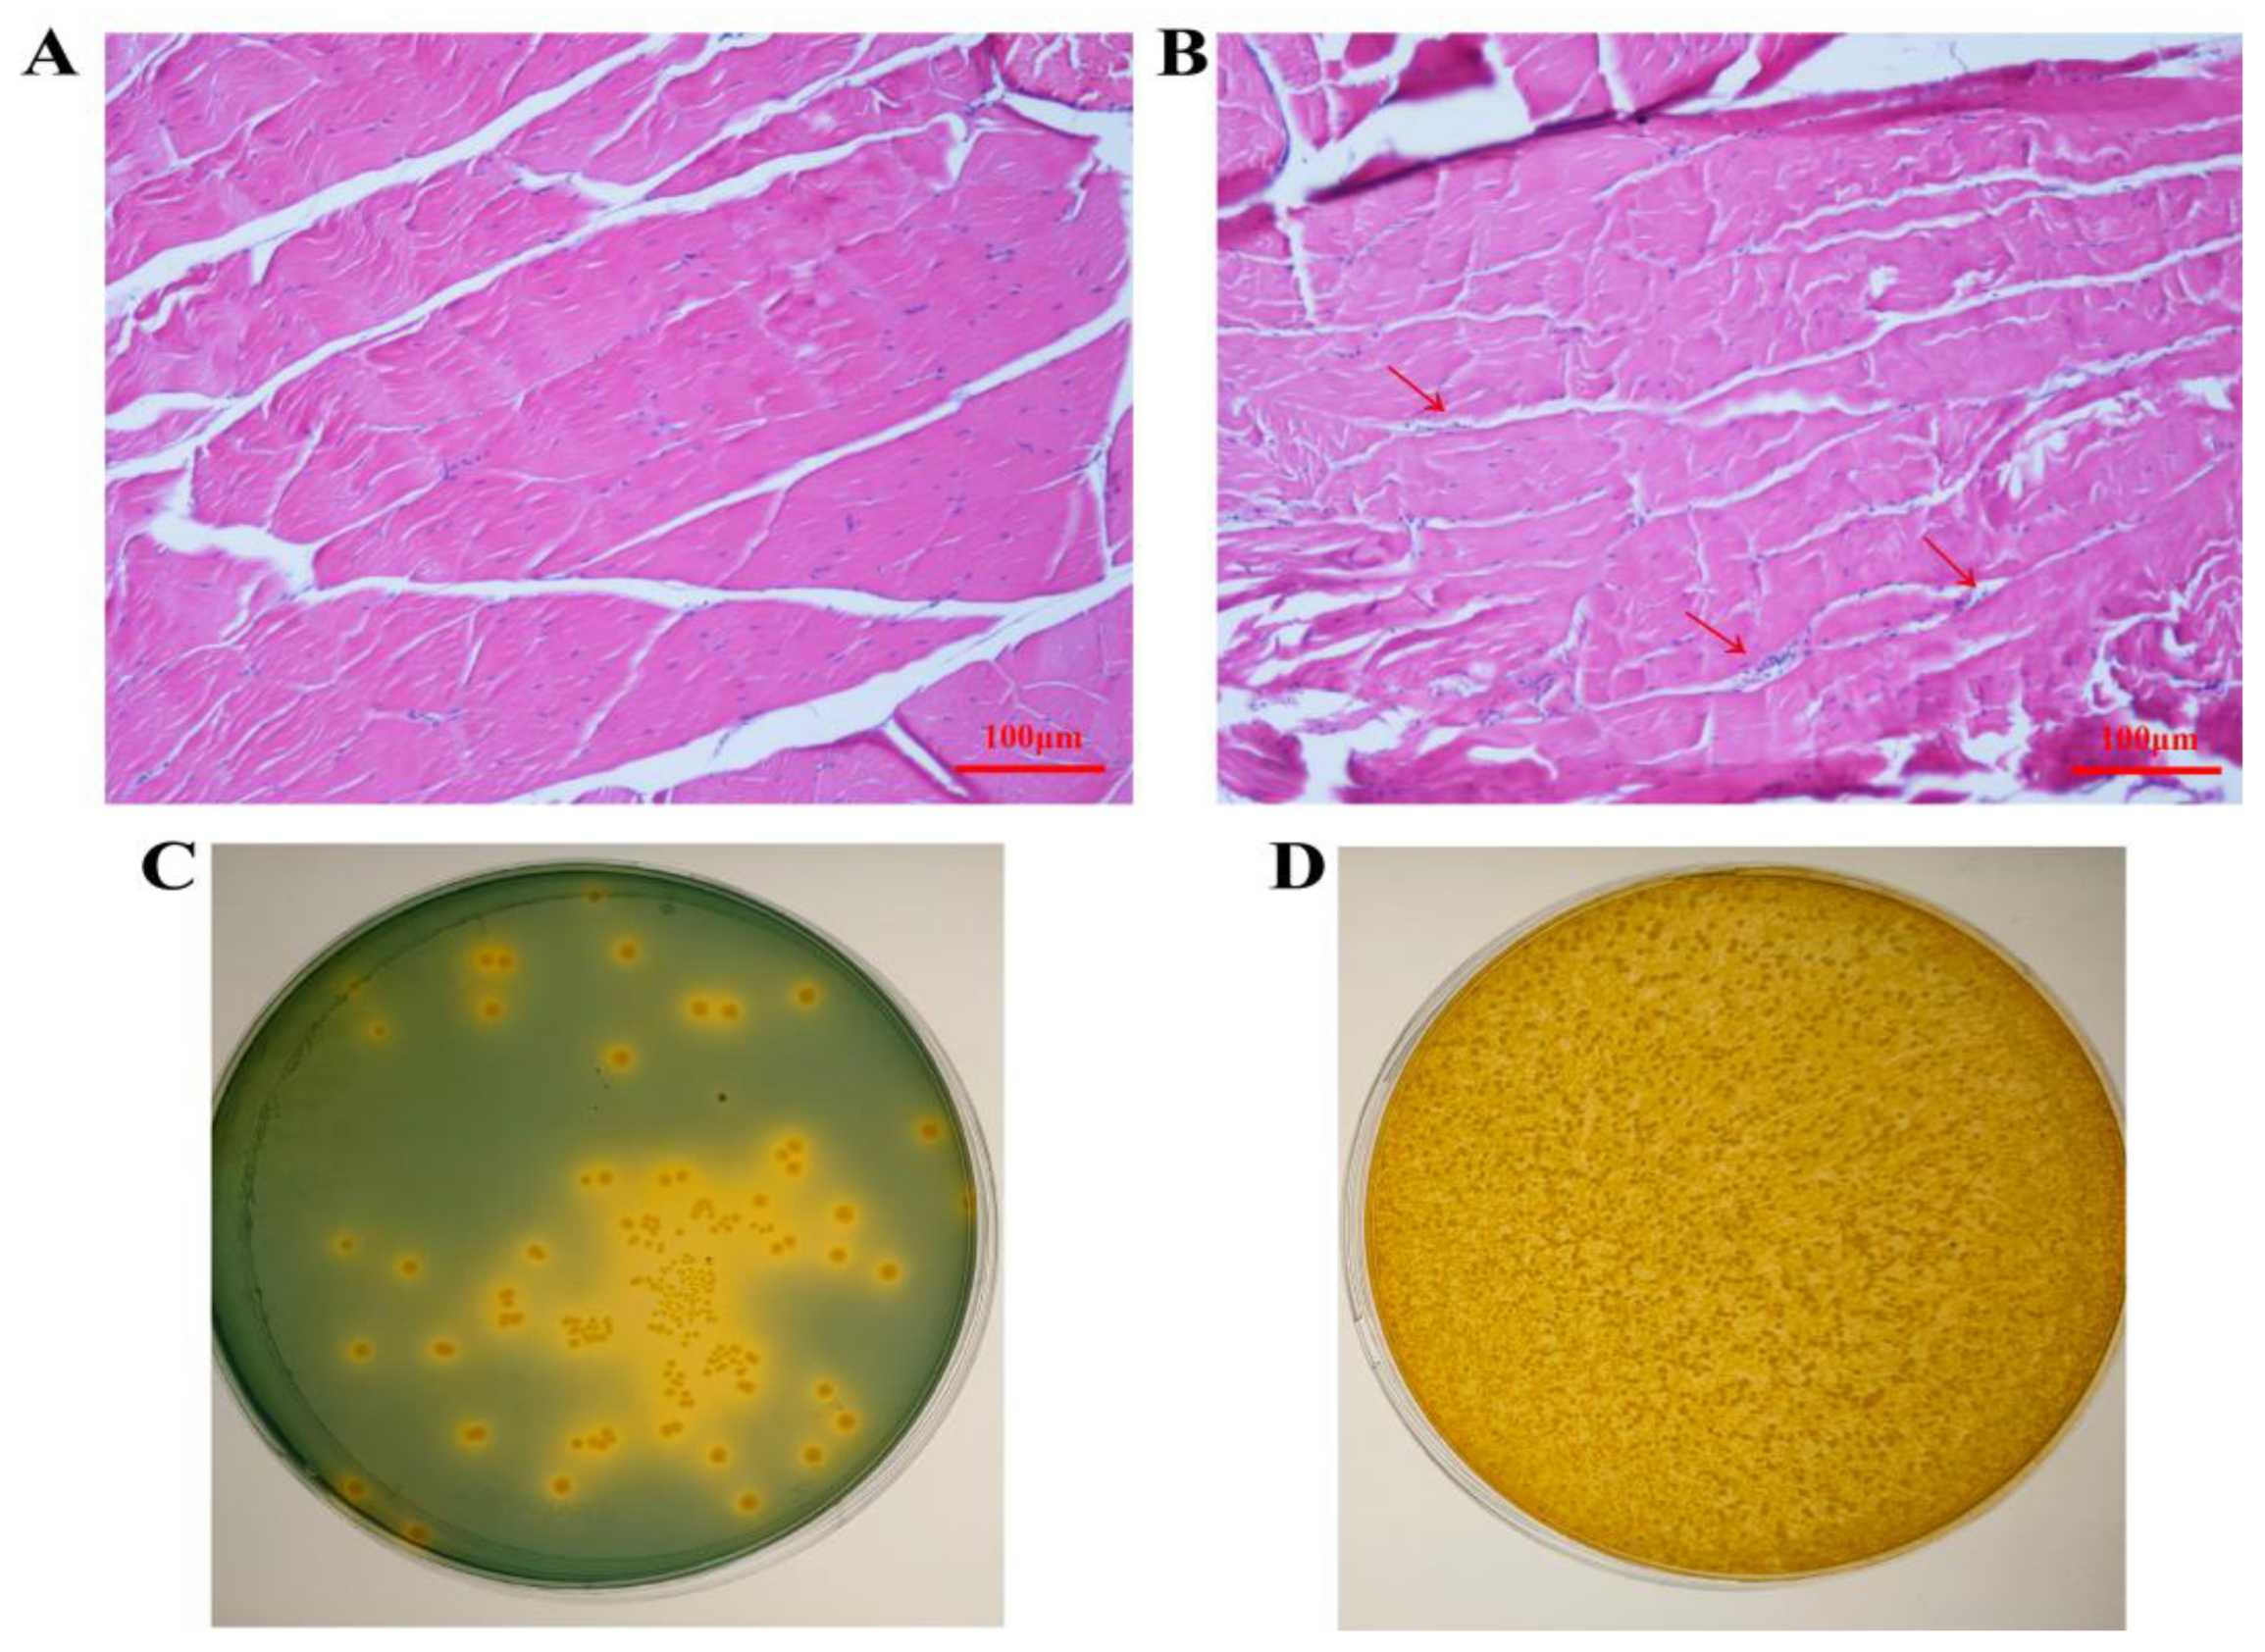
2.5. Histology and Total Viable Bacteria Count after LvMEF2 Knockdown

In the RNA interference experiment, after the third injection (9 days), the shrimp of the dsMEF2 group showed a decline in vitality, had a reduced food intake, and even died. Muscle samples were sampled at the end of the interference experiment and it was found that the muscle of the dsMEF2 group was softer than the control groups. Furthermore, the abdominal muscles were sampled for sections to observe the histological changes. The result showed that the muscles of the dsMEF2 group had nuclear agglutination and an increased tissue interspace (Figure 7A,B), indicating that the muscle structure may have been impaired. The hepatopancreas were sampled for their total viable bacteria count to examine the bacterial count in the dsMEF2 and control groups. The results showed that the conditional bacterial count in the dsMEF2 group was much higher than that of the control groups after LvMEF2 interference (Figure 7C,D).

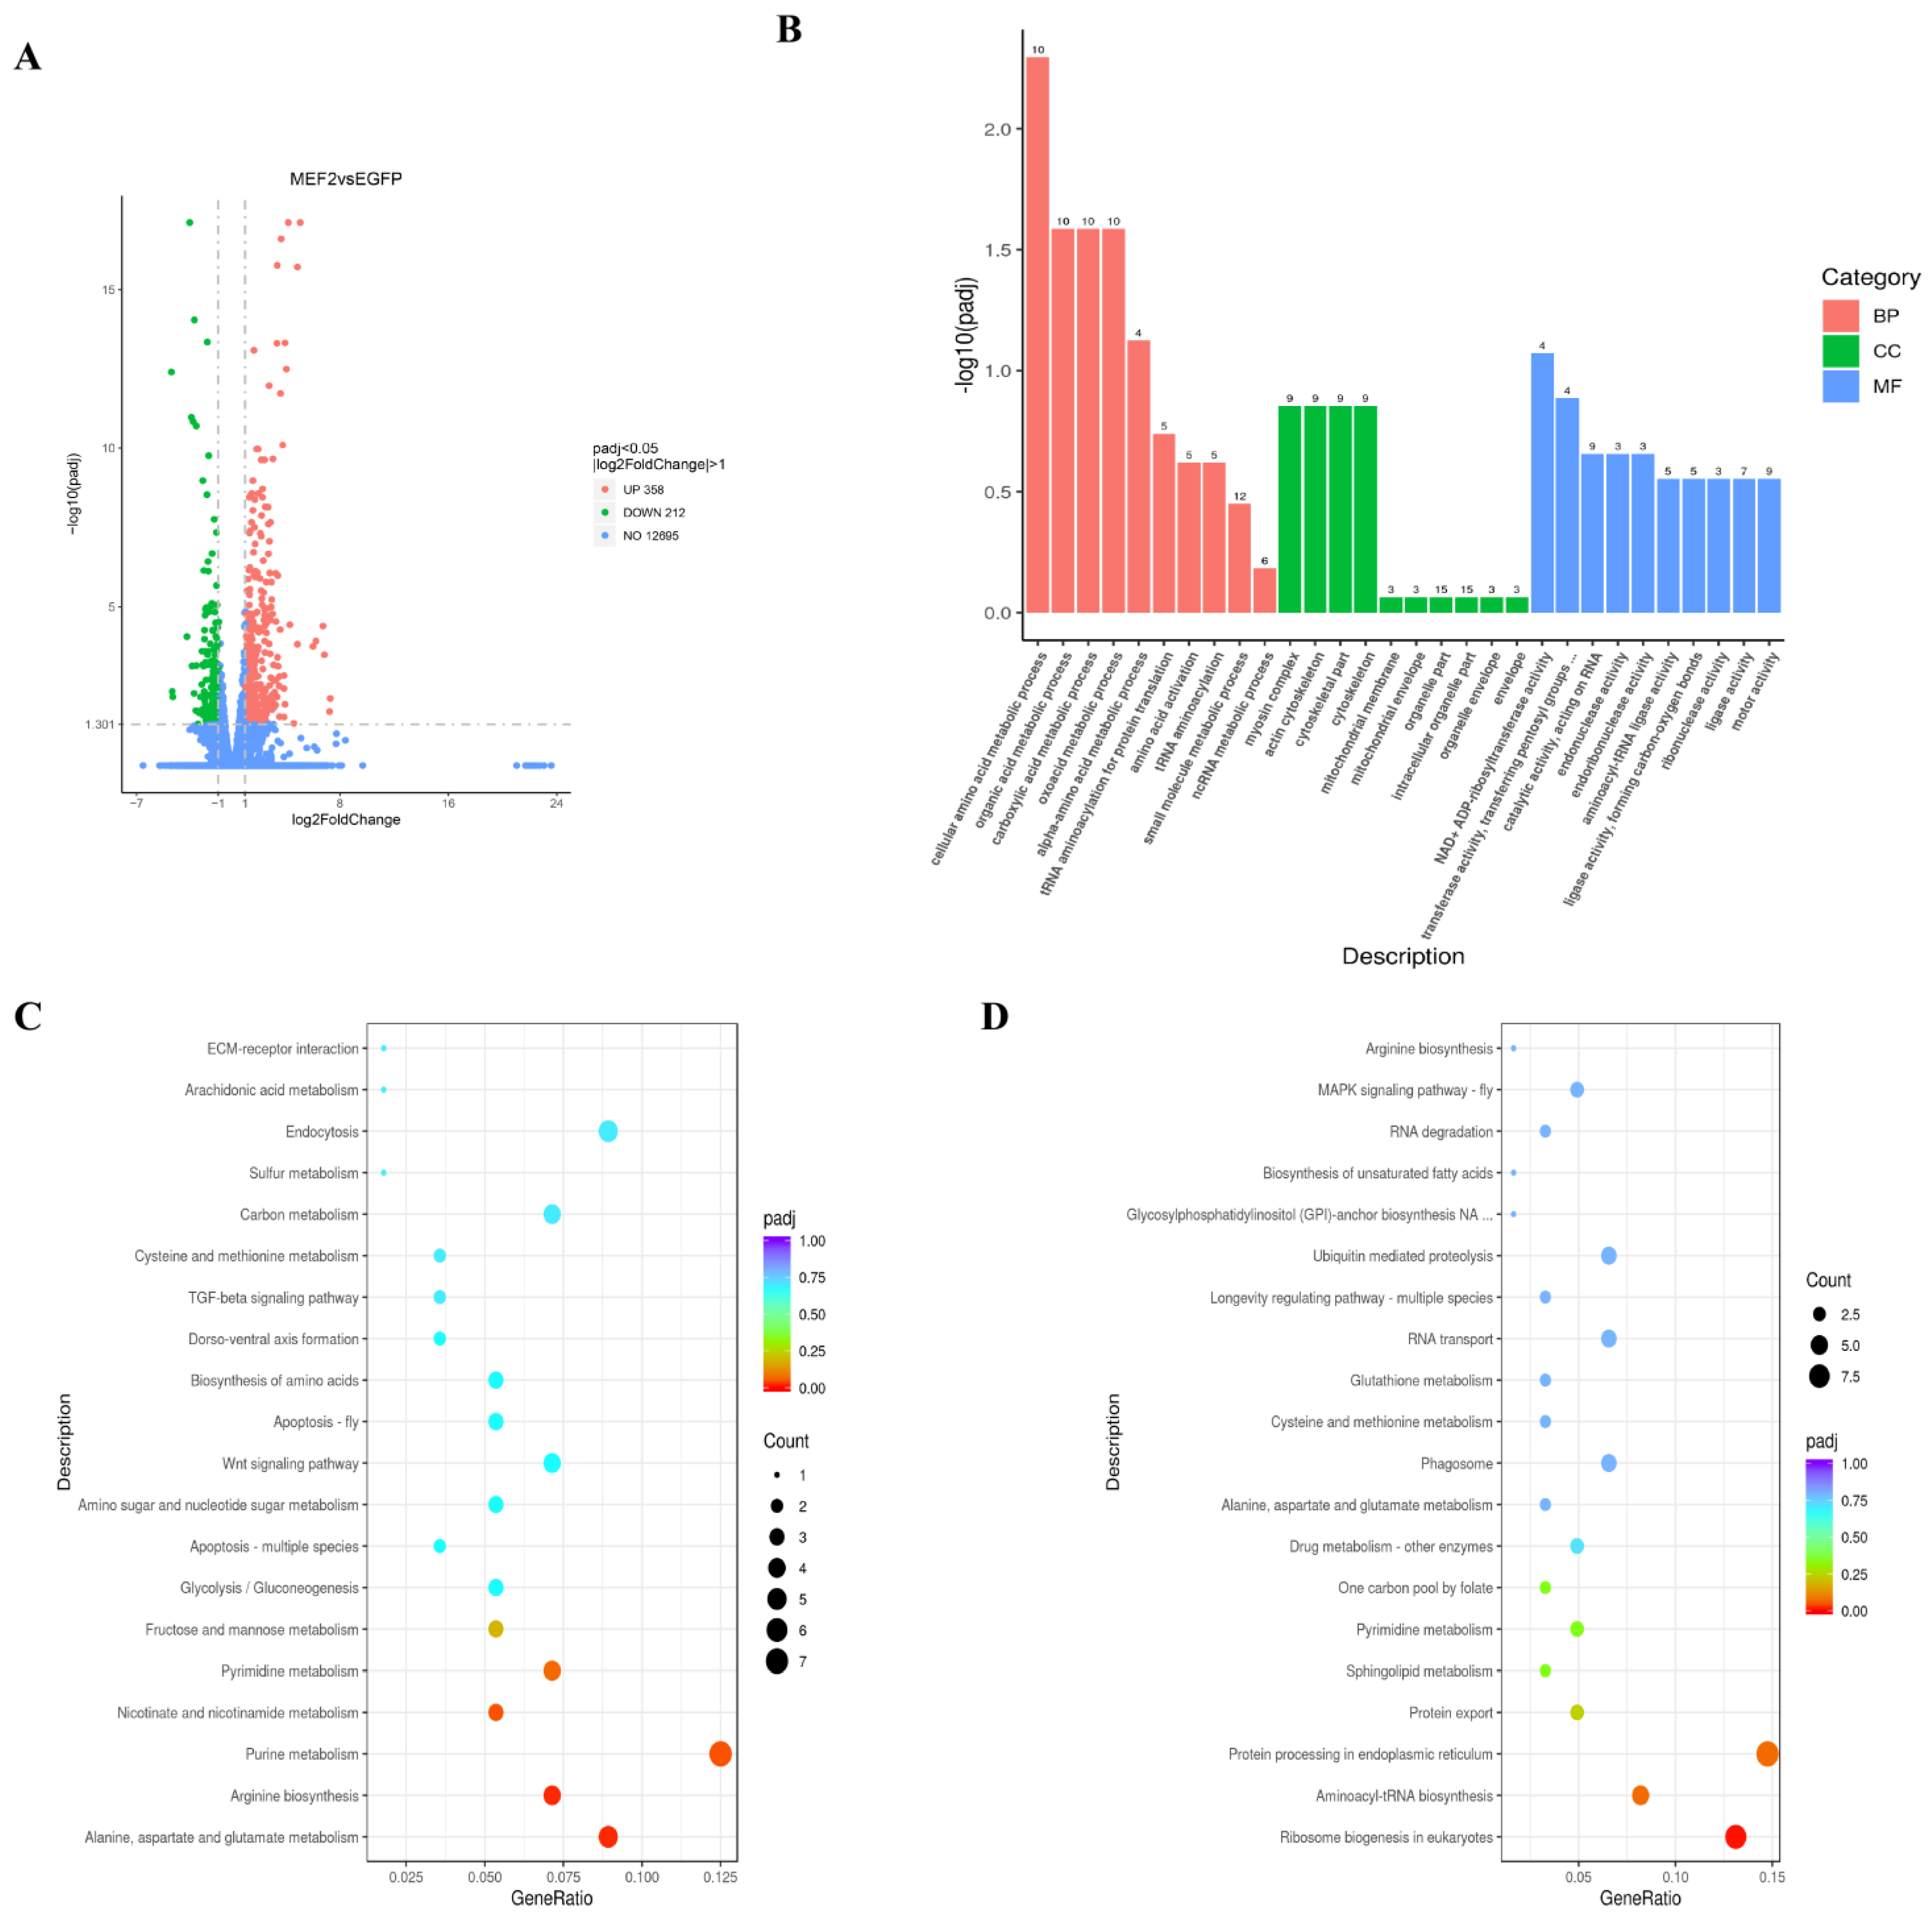
2.6. Differentially Expressed Genes (DEGs) in Muscle after LvMEF2 Knockdown

After LvMEF2 interference, the muscle of the experimental and control group was used for RNA-Seq sequencing and analysis. A total of 570 DEGs were identified, including 358 up-regulated genes and 212 down-regulated genes (Figure 8A). The up-regulated and down-regulated DEGs were mainly focused on muscle composition, immune response, protein synthesis and mitochondrial function, etc. (Table 2). Ten differential genes were chosen for expression verification, which confirmed the accuracy of the RNA-Seq results (Supplementary Figure S5).
To understand the function of DEGs after LvMEF2 interference in shrimp, all genes were mapped to terms in the GO database (Figure 8B). In the biological processes, DEGs were mainly concentrated in GO terms of “small molecule metabolic processes”, “cellular amino acid metabolic processes”, “organic acid metabolic processes”, “carboxylic acid metabolic processes”, “oxoacid metabolic processes”, “protein folding”, etc. The enriched DEGs were mainly aspartate–tRNA synthetase, glutamine–tRNA synthetase, phenylalanine–tRNA ligase, glutamate dehydrogenase, tyrosine–tRNA ligase, valine–tRNA ligase, and heat shock proteins. Thus, with the LvMEF2 knockdown, the protein synthesis processes were affected, in which the expression of genes related to amino acid translation was reduced, and protein synthesis was inhibited.
In the cellular component aspects, DEGs were mainly enriched in GO terms of “organelle components”, “myosin complex”, “actin cytoskeleton”, “cytoskeletal components”, “mitochondrial membrane envelope”, etc. The corresponding differential genes were Myosin N-terminal SH3-like domain, Myosin-4, Myosin heavy chain 13 (skeletal muscle), mitochondrial import receptor, and other genes. These results showed that the expressions of muscle composition genes were affected, and myocyte differentiation was impaired. The expression of genes, such as the mitochondrial import receptor, was down-regulated, indicating that the mitochondrial membrane in muscle was impaired and energy metabolism was inhibited after LvMEF2 was knocked down.
In the molecular function aspects, the DEGs were mainly enriched in “pyrophosphatase activity”, “hydrolase activity”, “cation binding”, “NAD+ ADP-ribosyltransferase activity”, “transferase activity”, “endonuclease activity”, “aminoacyl-tRNA ligase activity” and other GO terms, and the enriched differential genes were mainly Aspartate-tRNA ligase, glutamine ligase, Myosin heavy chain, Myosin-4, Myosin-13, etc. The results showed that the interference of LvMEF2 affected the binding of amino acids to tRNA and the polypeptide chain formation in muscle.
Signaling pathways were defined using the KEGG database, and the top 20 pathways are shown in Figure 8C,D. Among them, the top five pathways (enriched for up-regulated DEGs) and top three pathways (enriched for down-regulated DEGs) had significant differences after LvMEF2 interference. In up-regulated pathways, the major differential genes enriched in the “alanine, aspartate, and glutamate metabolic” pathways were glutamyl-alanine transaminase, glutaminase, glutamate dehydrogenase, and glutamine synthetase. Pyruvate was provided by glycolysis in the muscle, and glutamate and pyruvate undergo transamination to form alanine, which was used by the organism as a carrier of ammonia from the muscle to the liver as an expression of the organism’s economy in maintaining life activities. The up-regulation of the alanine metabolic pathway indicates that metabolic activity in the muscle of L. vannamei was affected by LvMEF2 interference, and that the interconversion between alanine and pyruvate was reduced.
In addition, after LvMEF2 was knocked down, “eukaryotic ribosome formation”, “aminoacyl-tRNA biosynthesis”, and “protein processing” pathways related to the endoplasmic reticulum were down-regulated, and the main differential genes were tyrosine kinase, serine/threonine protein kinase, ribosomal proteins, and aspartate/glutamine/tyrosine/phenylalanine/valine–tRNA ligase genes. The tRNA ligase genes were incorporated into the polypeptide chain at the ribosome and covalently formed aminoacyl-tRNA with the transfer RNA, and with the aminoacyl-tRNA, bound to specific sites in the mRNA. After LvMEF2 was disturbed, the expression of tRNA ligase genes was down-regulated, indicating that the associated amino acids were unable to bind properly to tRNA and protein synthesis was blocked. We also found the up-regulation of gene expression in related immune pathways; the corresponding genes were immunoglobulins, heat shock proteins, NFX1-type zinc finger-containing protein 1, interferon-related developmental regulator, MFS-1, Ras family-related proteins, etc., which were related to the immunity of shrimp.

3. Discussion

So far, there have been numerous studies on the regulation of MEF2 genes in terms of the muscle growth and development of vertebrates and model organisms. Many other studies have also reported that MEF2 is closely associated with neurodevelopment and the development and progression of certain tumors. However, the structure and function of the MEF2 gene in crustaceans have been still largely unclear. In this study, based on the identification of alternative splice variants, an analysis of expression profiles, an RNA interference experiment, muscle tissue histology, and a transcriptome analysis of the MEF2 gene in L. vannamei, we gained a preliminary understanding of the expression profiles and possible function of MEF2 in shrimp.

3.1. LvMEF2 Has Multiple Splice Variants

Alternative RNA splicing is a way to diversify gene function. In L. vannamei, although only one MEF2 gene is present in the genome, we found numerous splice variants of this gene. The alternative splice types of LvMEF2 were mainly exon exclusivity and alternative 5’ splice site, and the different exons could be arranged in different combinations, making a boom of its alternative splicing transcripts. In vertebrates, there are multiple transcripts in MEF2A, C, and D genes, most of which include muscle-specific splicing with a conserved MADS-MEF2 domain and HJURP-C domain [25]. However, the MEF2Bs lack muscle-specific splice variants and several conserved domains (they only have the MADS-MEF2 domain) [26,27]. In this study, domain prediction showed that LvMEF2 contained a MADS-MEF2 domain and a HJURP-C domain. The phylogenetic analysis showed that LvMEF2 clustered well with the MEF2 of crustaceans and was closely related to the vertebrate MEF2A, C, and D family, but distantly related to MEF2B. The diversity of the alternative splice variants of the MEF2 gene enables functional diversification. Therefore, we speculated that the diversity in the LvMEF2 alternative splice variants of L. vannamei corresponded to functional diversity, which deserves further study.

3.2. LvMEF2 Has Complex Expression Profiles

The temporal and spatial expression of LvMEF2 was also complex and diverse. LvMEF2 was mainly expressed in the early stage of L. vannamei, and its expression level gradually decreased as juvenile shrimp matured, indicating that LvMEF2 might mainly play a role in the early muscle development of shrimp. This pattern was similar to the expression of MEF2 gene in vertebrates. In the processes of the early muscle development stage of the Nanyang cattle [28], MEF2A and MEF2D were highly expressed, and then their expression levels gradually decreased, showing an apparent tendency to ascend first and descend later. In L. vannamei, the expression of LvMEF2 could be detected in the muscle, ventral nerve, eye stalk, hepatopancreas, heart, and almost all tissue, consistent with the expression profiles of many vertebrates and invertebrates, such as zebrafish [29], crap [6] and scallop [30]. In this study, the expression profiles of the LvMEF2 splice variants were analyzed in different tissues, different developmental stages, different molting stages, and with infection by different pathogens. The results showed that LvMEF2 was not only ubiquitously expressed in different tissues, but that most of the splice variants were expressed. The muscle, intestine, and the Oka tissues contained the most alternative splicing, indicating that LvMEF2 plays a crucial role in muscle growth, food digestion, and immune processes [31,32].
In comparison to LvMEF2-Ι and LvMEF2-ΙI, which were two typical alternative splicing transcripts in L. vannamei, LvMEF2-Ι was expressed in all the detected tissue and also expressed in every developmental stage, whereas LvMEF2-ΙI was only expressed in several special tissues and in special early developmental stages, suggesting that LvMEF2-ΙI may play a more specific role. Some of the splice variants (MEF2-4/5/9/10/17) showed specific expression at different molt stages. Interestingly, the abundant expression of LvMEF2 transcripts was detected in the main immune tissues (Oka and hemocytes) of the shrimp after infection with different pathogens, and many of the splice variants were found to be specifically expressed in the Oka only, especially MEF2-11 and MEF2-17(LvMEF2-ΙI), which were highly specific in the Oka. However, there were few splice variants present in hemocytes, and only MEF2-9 was highly expressed in hemocytes. It was reported that MEF2 played a role in the development of human muscle, heart, bone, vascular, nerve, hemocyte, and immune system cells, and influenced cell proliferation, differentiation, migration, apoptosis, and metabolism [33]. In mice, MEF2C was a regulator of B-cell homeostasis, and the absence of MEF2C in hemocytes led to a higher proportion of prophase B-cell apoptosis and necrosis [34]. The splice variants of LvMEF2 were hypothesized to play different roles in the immune process of shrimp, which is worth more in-depth attention.

3.3. LvMEF2 Affects the Growth and Immunity of the Shrimp

MEF2 genes produce different proteins by alternative splicing, and these proteins can undergo post-translational modifications and interact with diverse partner proteins, thus further performing different functions. In this study, after half a month of LvMEF2 interference, the experimental group shrimp showed significant inhibition in their body length and weight gain, and shrimp had even died. Histological observation showed that the muscle structure of the shrimp was abnormal after LvMEF2 knockdown, and that the expression of muscle genes was significantly down-regulated; these results indicate that the long-term interference of the MEF2 gene could inhibit the expression of downstream muscle genes, and in turn, affect the growth of shrimp. In GO analysis, many genes, such as ligase, myosin, and actin, were differentially expressed. In mice, the deletion of MEF2C led to the disintegration of the sarcomere, suggesting that MEF2 activity was associated with the regulation of the cytoskeletal structure of skeletal muscle [35]. Another study examined MEF2A DNA binding sites in mouse cardiac myocytes and found that candidate target genes were mainly enriched in the functional pathways associated with cardiac and muscle development and cytoskeletal organization [36]. At the same time, we found that the genes associated with mitochondria were significantly down-regulated after LvMEF2 interference. The MEF2 gene of yeast Saccharomyces cerevisiae has been reported to be a mitochondrial protein translation factor, and evidence suggests that it participates in ribosome recycling and plays an important role in maintaining mitochondrial health, which may also be shared by other mitochondrial protein synthesis factors [37]. Therefore, when MEF2 is knocked down, organelles in muscle (especially mitochondria) may be damaged.
KEGG analysis showed that the DGEs were significantly enriched in metabolism pathways, especially protein synthesis-related pathways, such as “alanine, aspartate and glutamate metabolism”, “ribosome biogenesis in eukaryotes”, “aminoacyl-tRNA biosynthesis”, and “protein processing in the endoplasmic reticulum”. The changes indicated that the protein synthesis of L. vannamei was drastically affected after LvMEF2 interference. It has been reported that MEF2 is a regulator of muscle fiber homeostasis when the MEF2 function is weakened, resulting in the expansion of glutamine, which leads to skeletal muscle atrophy [38]. In Drosophila, the mutation of a single MEF2 gene results in muscle cells that do not differentiate [39]. Previous studies have also shown that MEF2 plays a crucial role in the early stage of myoblast fusion, and myoblasts lacking the MEF2 gene cannot fuse into myotubes normally [40]. In addition, MEF2 have roles in regulating apoptosis, in the expression of MEF2 in endothelial cells and in the development of neurons inhibiting apoptosis downstream of MAPK signaling [41,42].
In L. vannamei, in addition to having a higher expression in muscle, LvMEF2 expression was highest in the Oka organ. A transcriptome analysis of muscle samples for 48 h of LvMEF2 interference showed that protein synthesis and mitochondria were damaged, and that the expression of related genes in the immune pathway was up-regulated after LvMEF2 knockdown. These results suggest that MEF2 played an important role not only in muscle formation and growth, but also in the immunity of shrimp. It was reported that MEF2 was phosphorylated at a conserved site in healthy Drosophila, which promoted the expression of lipogenic enzymes and glycogen synthase kinase. However, when infected by pathogens, this phosphorylation would be lost, and the activity of MEF2 changes and promotes the production of antimicrobial peptides [43]. Therefore, MEF2 was considered to be a key transcriptional switch between metabolism and immunity in adult Drosophila, and similar processes may exist in shrimp.

4. Materials and Methods

4.1. Experimental Animals

The healthy shrimp L. vannamei used in this experiment were cultured in the shrimp breeding laboratory of the aquarium building, Institute of Oceanology, Chinese Academy of Sciences. The shrimp used in this experiment had a body length of 7.5 ± 0.5 cm and a body weight of 4.5 ± 0.5 g. Before the experiment, the shrimp were cultured in the breeding tank for a week, and the temperature of the aerated seawater was maintained at 25 ± 1 °C, with a salinity of 30‰ and pH of 7.5 ± 0.1. During the experiment, seawater was changed once a day, and shrimp were fed regularly and quantitatively with commercial food pellets thrice a day. All experimental shrimp were handled and treated according to the guidelines approved by the Animal Ethics Committee [2020(37)] at the Institute of Oceanology, Chinese Academy of Sciences (Qingdao, China). No rare or endangered animals were used in this study.

4.2. Identification and Analysis of MEF2 Gene in L. vannamei

To identify the MEF2 gene in L. vannamei, all annotated MEF2 sequences were extracted from the genome (http://www.shrimpbase.net/lva.dowload.html, accessed on 15 July 2021) and transcriptome data obtained previously in our laboratory from different tissues, different early development stages, different molting stages and the three pathogens (Staphylococcus aureus, Vibrio parahaemolyticus and white spot syndrome virus (WSSV)) [22,44,45]. The ORF Finder (https://www.ncbi.nlm.nih.gov/orffinder/, accessed on 19 July 2021) and ExPASy translate tool (https://web.expasy.org/translate/, accessed on 19 July 2021) were used to obtain the corresponding amino acid sequences and the corresponding ranges of CDS regions for these transcripts. GSDS2.0 (http://gsds.gao-lab.org/, accessed on 25 July 2021) was used to analyze and map the gene structure of the transcripts. The domains were analyzed for these transcripts through the online website InterProscan (https://www.ebi.ac.uk/interpro/about/InterProscan/, accessed on 10 November 2022). Various forms of alternative splicing (Supplementary Data S1) were identified by mapping to the genome sequences. The two longest nucleotide sequences in the typical splice variants were selected for additional structural and phylogenetic analyses.

4.3. Construction of Phylogenetic Tree

To understand the phylogeny of the MEF2 gene in L. vannamei and other species, a total of 26 MEF2 amino acid sequences (Supplementary Data S2) from representative organisms in different taxa were downloaded from NCBI (https://www.ncbi.nlm.nih.gov/, accessed on 15 October 2022). The sequence IDs used in the phylogenetic analysis are shown in Table 2, with 20 sequences from invertebrates and 9 sequences from vertebrates. The MEGA 11 platform was used for the construction of phylogenetic trees, and the MEF2 sequences of different species were aligned using the Cluster W algorithm under the default model. The phylogenetic tree was constructed based on the neighbor-joining (NJ) method using the default values for all parameters. Finally, the phylogenetic tree was visualized and ornamented through the I-TOL tree online website (https://itol.embl.de/, accessed on 22 October 2022 ).

4.4. RNA Extraction and cDNA Synthesis

RNA was isolated using RNAiso Plus Reagent (Takara Bio Inc., Kyoto, Japan) according to the manufacturer’s instructions. The quality and concentration of RNA were detected using 1% agarose gel electrophoresis and Nano Drop 2000 (Thermo Fisher Science, Waltham, MA, USA), respectively. Then, first-strand cDNA was synthesized by reverse transcription-polymerase chain reaction (RT-PCR) using 1 μg of RNA and the Prime Scrip First Stand cDNA Synthesis kit (Takara, Kyoto, Japan). The reaction was carried out in two steps. In the first step, a gDNA eraser was used to eliminate DNA from the genome, and the reaction was carried out at 42 °C for 5 min. In the second step, cDNA was synthesized using reverse transcription, and the reaction was performed at 37 °C for 1 h and 85 °C for 5 s. The synthesized cDNA was stored at −20 °C.

4.5. Gene Expression Pattern Analysis

In order to detect the expression of the LvMEF2 in L. vannamei, RNA was extracted from different adult tissues, and the cephalothorax of seven different developmental stages after post-larvae; then, the reverse transcription and quantitative fluorescence PCR (qPCR) were performed. The primers were shown in Supplementary Table S1. The qPCR reaction conditions were as follows: firstly, pre-denaturation for 30 s at 95 °C, and then at 95 °C for 5 s, followed by the annealing temperature (according to the primer annealing temperature) for 35 s; this was repeated for a total of 40 cycles. The 2−ΔΔCt method [46] was used for relative quantitative analysis. The data were analyzed by one-way analysis of variance using GraphPad Prism 9.3.1.471 software. Different letters were used to represent significance levels. The expression heat maps of the splice variants of LvMEF2 in different tissues, different developmental periods, different molting periods, and infection with different pathogens were drawn by TBtools V1.098 software based on the transcriptome data of our previous studies [22,44,45].

4.6. Double-Stranded RNA Synthesis and Interference Experiments of LvMEF2

Double-stranded RNA (dsRNA) with a length of 500 to 600 bp was designed based on the conserved domains of LvMEF2 and EGFP (enhanced green fluorescent protein, as control). Primers were designed to amplify them (Supplementary Table S3). Double-stranded RNAs were synthesized in vitro using the TranscriptAid T7 High Yield Transcription Kit (Thermo Scientific, Vilnius, Lithuania) and the primers containing the T7 promoter; the annealing temperatures are shown in Supplementary Table S1. The quantitative real-time PCR was run on Eppendorf Mastercycler ep realplex (Eppendorf, Hamburg, Germany). The THUNDERBIRDTM SYBR® qPCR Mix Without ROX kit (Toyobo, Osaka, Japan) was used for qRT-PCR with the primers named MEF2-YG-F and MEF2-YG-R. The 18S was used as an internal reference. The 10 μL system contained 5 μL of PreMix, 1 μL of template, 1 μL of upstream and downstream primers, and RNA-free water supplemented to 10 μL. The PCR procedure was as follows: firstly, pre-denaturation at 94 °C for 5 min, then denaturation at 94 °C for 30 s, annealing at 60 °C for 30 s, extension at 72 °C for 40 s by 40 cycles, and at last, an extension of 10 min.
A total of 84 shrimp were used in the pre-experiment with the body weight of 4.56 ± 0.5 g, respectively. The purified and qualified dsRNA was diluted with 1 × PBS. The experimental group was named dsMEF2 (injected with LvMEF2 dsRNA), the dsEGFP group (injected with EGFP dsRNA) and PBS (solvent) group were used as controls. Each group was set up with three biological replicates (four individuals/replicate) with three gradients of 0.5 μg, 1 μg, and 2 μg. Then, dsRNA 10 µL of solvent was injected into the last abdominal segment of each shrimp separately. At 48 h post-dsRNA injection, the RNA was extracted from muscle, and the dsRNA interference efficiency was detected. The dosage of 2 µg of dsRNA per individual was selected for further RNAi experiments. In the formal experiment, a total of 216 individuals in the pre-molt stage (D1–D2) were randomly divided into three groups (the experimental group, the dsEGFP and PBS control groups). The body length and body weight of every shrimp were measured before injection with the optimal dose. The formal interference experiment lasted for half a month; the same injection was repeated every 4 days to keep the gene interference efficiency. After the experiment, the same method was used to measure the body weight and body length again. Then, abdominal muscles were sampled and frozen in liquid nitrogen and then stored at −80 °C, RNA was extracted, and the expression of LvMEF2 and muscle-related genes was detected by quantitative fluorescence PCR (qPCR). The data were analyzed by the t-test using GraphPad Prism software. p < 0.05 was marked as a single asterisk.

4.7. Tissue Section and Total Viable Bacteria Count after LvMEF2 Gene Knowdown

After half a month of interference, the muscle tissue in the second abdominal segment of L. vannamei was sampled for section preparation. Briefly, the tissue was fixed with 4% paraformaldehyde and dehydrated with different concentrations of ethanol. Then, the tissue was treated with xylene and embedded in paraffin (Sigma, Roedermark, Germany). The embedded tissues were sliced with a microtome, and the thickness of the slices was about 7 μm. Then, the sections were stained with hematoxylin-eosin (HE) and examined under a microscope.
In order to detect the total viable bacteria count in shrimp hepatopancreas after interference, the hepatopancreas of 6 shrimp were sampled from the experimental and control groups, respectively. The collected hepatopancreas samples were weighted, crushed, and blended in sterile PBS separately. Then, 100 μL of the suspension with a 5-fold dilution was seeded onto TCBS agar. After incubation at 28 °C for 18 h, the number of total bacterial colonies on the plate was counted.

4.8. Transcriptome Sequencing Analysis of Muscle Samples after LvMEF2 Interference

Muscle samples from L. vannamei after LvMEF2 interference were sampled for transcriptome sequencing. Total RNA was separately extracted using the Trizol reagent kit (Invitrogen, Waltham, MA, USA) according to the manufacturer’s instructions. The RNA completeness and concentration were checked using 1% RNase-free agarose gel electrophoresis and Agilent 2100 Bioanalyzer (Agilent Technologies, Santa Clara, CA, USA). Subsequently, library construction and quality inspection were conducted. mRNA was enriched by Oligo (dT) beads and then fragmented and reverse-transcribed into first-strand cDNA with random primers. After the second-strand cDNA was synthesized, the cDNA fragments were purified using a QiaQuick PCR extraction kit (Qiagen, Hilden, Germany). The synthesized cDNA fragments were repaired, an adapter was added and specific length fragments (generally 250–300 bp) were recovered to complete the construction of the cDNA library. After the library was constructed, qRT-PCR was used to accurately quantify the effective concentration of the library. Finally, the paired-end cDNA library was sequenced using Illumina NavoSeq 6000 platform (Illumina, San Diego, CA, USA) in Novogene Corporation Inc (Beijing, China).
To obtain high-quality clean reads, adapter sequences and low-quality reads were filtered by fastp, and the ribosome RNA (rRNA) mapped reads were further removed by Bowtie2 (version 2.2.8) [47]. All raw reads were deposited on the NCBI Sequence Reading Archive (SRA) website (SRR23060691-SRR23060696). The remaining paired-end clean reads of each sample were separately mapped to the shrimp genome [45] using HISAT2 (version 2.4) [48] with default parameters. Then, the mapped reads of all samples were assembled using StringTie (version 1.3.1) [49] with on a reference-based approach. To quantify the expression abundance, a FPKM (fragment per kilobase of transcript per million mapped reads) value for each transcription region was calculated using StringTie software [50].
To estimate the change in the transcript levels after LvMEF2 interference, a differential expression analysis of the gene expression between the experimental and control groups was performed using DESeq2 software (1.20.0) with padj ≤0.05 and|log2(foldchange)| ≥ 1 as a significant difference. In order to illustrate the DEG cell composition, molecular function, and biological processes, the Novogene online tools (https://magic.novogene.com/, accessed on 7 November 2022) continued the GO and KEGG enrichment analysis. The expression of DEGs was visualized by TBtools (V1.098).
In order to verify the reliability and accuracy of the transcriptome sequencing and analysis, muscle tissues from the dsMEF2 and dsEGFP groups were sampled, and four biological replicates were set up in each group. The total RNA from the samples was extracted and reverse transcribed into cDNA, as mentioned above. Ten DEGs were selected to detect the expression by RT-qPCR.

5. Conclusions

In this study, we identified a MEF2 gene in L. vannamei and found that it has multiple splice variants. By analyzing the expression profiles of LvMEF2 in different developmental stages, different adult tissues, different molting stages, after infection with different pathogens, as well as after RNA interference, we found that LvMEF2 had a significant effect on the growth and development of L. vannamei, not only in body length and weight, but also in survival rate. Further transcriptome analysis showed that LvMEF2 could significantly affect metabolism, growth, and immunity in the shrimp. This study provides an important basis for further investigation into the role of MEF2 gene in the growth, development, and immune processes of shrimp and crustaceans.

Supplementary Materials

The following supporting information can be downloaded at: https://www.mdpi.com/article/10.3390/ijms24065832/s1.

Author Contributions

Conceptualization, X.Z. (Xiaojun Zhang), Z.S. and F.L.; experiments performance Y.X. and X.Z. (Xiaoxi Zhang); data analyses Y.X., X.Z. (Xiaoyun Zhong), X.Z. (Xiaoxi Zhang) and C.L.; validation, Y.X; resources, Y.X., X.Z. (Xiaojun Zhang), J.Y. and X.Z. (Xiaoxi Zhang); writing—original draft preparation, Y.X.; writing—review and editing, X.Z. (Xiaojun Zhang); visualization, Y.X.; funding acquisition, X.Z. (Xiaojun Zhang) and F.L. All authors have read and agreed to the published version of the manuscript.

Funding

This research was funded by the National Key R&D Program of China (2018YFD0900103, 2022YFF1000304), the National Natural Sciences Foundation of China (31972782 and 32273102), and the Strategic Priority Research Program of the Chinese Academy of Sciences (Grant No. XDA24030105).

Institutional Review Board Statement

The study was reviewed and approved by the Animal Ethics Committee [2020(37)] of the Institute of Oceanology, Chinese Academy of Sciences.

Informed Consent Statement

Not applicable.

Data Availability Statement

The datasets presented in this study can be found in online repositories. The names of the repository/repositories and accession number(s) can be found in the article/Supplementary Materials.

Acknowledgments

We sincerely thank these researchers for their selfless help: Xinjia Lv, and Mingzhe Sun for their help in optimizing the experiment; Jie Hu, Miao Miao, Keke Zhang and Ruigang Niu for their help in the RNA interference experiment; Xinjia Lv, Miao Miao, and Jie Hu for their help with the experimental reagents; and Shuqing Si, Junqing Yang, Zhenning Bao and Qian Lv for their help in the sampling. This study was supported by the Oceanographic Data Center, IOCAS.

Conflicts of Interest

The authors declare no conflict of interest.

References

  1. Tian, Z.; Jiao, C. Muscle atrophy and growth induced by molting in Crustacean: A review. Fish. Sci. 2016, 35, 603–606. [Google Scholar] [CrossRef]
  2. Mykles, D.L.; Medler, S. Skeletal Muscle Differentiation, Growth, and Plasticity. In The Natural History of Crustacea, Volume 4: Physiology, 2nd ed.; Ernest, S., Martin, T., Eds.; Oxford University: Oxford, UK, 2015; pp. 134–167. [Google Scholar]
  3. Nurrish, S.J.; Treisman, R. DNA binding specificity determinants in MADS-box transcription factors. Mol. Cell. Biol. 1995, 15, 4076–4085. [Google Scholar] [CrossRef] [Green Version]
  4. Gossett, L.A.; Kelvin, D.J.; Sternberg, E.A.; Olson, E.N. A new myocyte-specific enhancer-binding factor that recognizes a conserved element associated with multiple muscle-specific gene. Mol. Cell. Biol. 1989, 9, 5022–5033. [Google Scholar] [CrossRef] [Green Version]
  5. Paulin, R.; Sutendra, G.; Gurtu, V.; Dromparis, P.; Haromy, A.; Provencher, S.; Bonnet, S.; Michelakis, E.D. A miR-208–Mef2 axis drives the decompensation of right ventricular function in pulmonary hypertension. Circ. Res. 2015, 116, 56–69. [Google Scholar] [CrossRef] [PubMed] [Green Version]
  6. He, M.; Zhou, D.; Ding, N.-Z.; Teng, C.-B.; Yan, X.-C.; Liang, Y. Common carp mef2 genes: Evolution and expression. Genes 2019, 10, 588. [Google Scholar] [CrossRef] [PubMed] [Green Version]
  7. Wu, W.; de Folter, S.; Shen, X.; Zhang, W.; Tao, S. Vertebrate paralogous MEF2 genes: Origin, conservation, and evolution. PLoS ONE 2011, 6, e17334. [Google Scholar] [CrossRef] [Green Version]
  8. Genikhovich, G.; Technau, U. Complex functions of MEF2 splice variants in the differentiation of endoderm and of a neuronal cell type in a Sea anemone. Development 2011, 138, 4911–4919. [Google Scholar] [CrossRef] [Green Version]
  9. Shore, P.; Sharrocks, A.D. The MADS-Box family of transcription factors. Chem. Eur. J. 1995, 229, 1–13. [Google Scholar] [CrossRef] [PubMed]
  10. Taylor, M.V.; Hughes, S.M. Mef2 and the skeletal muscle differentiation program. Semin. Cell Dev. Biol. 2017, 72, 33–44. [Google Scholar] [CrossRef]
  11. Hennebry, A.; Berry, C.; Siriett, V.; O′Callaghan, P.; Chau, L.; Watson, T.; Sharma, M.; Kambadur, R. Myostatin regulates fiber-type composition of skeletal muscle by regulating MEF2 and MyoD gene expression. Am. J. Physiol. Physiol. 2009, 296, C525–C534. [Google Scholar] [CrossRef]
  12. Zhang, C.; Wang, G.; Wang, J.; Ji, Z.; Dong, F.; Chao, T. Analysis of differential gene expression and novel transcript units of ovine muscle transcriptomes. PLoS ONE 2014, 9, e89817. [Google Scholar] [CrossRef]
  13. Zhang, C.; Wang, G.; Wang, J.; Ji, Z.; Liu, Z.; Pi, X.; Chen, C. Characterization and comparative analyses of muscle transcriptomes in dorper and small-tailed han sheep using RNA-Seq technique. PLoS ONE 2013, 8, e72686. [Google Scholar] [CrossRef] [Green Version]
  14. Jung, S.-Y.; Ko, Y.-G. TRIM72, a novel negative feedback regulator of myogenesis, is transcriptionally activated by the synergism of MyoD (or myogenin) and MEF2. Biochem. Biophys. Res. Commun. 2010, 396, 238–245. [Google Scholar] [CrossRef] [PubMed]
  15. Schiaffino, S.; Dyar, K.A.; Calabria, E. Skeletal muscle mass is controlled by the MRF4-MEF2 axis. Curr. Opin. Clin. Nutr. Metab. Care 2018, 21, 164–167. [Google Scholar] [CrossRef] [PubMed]
  16. Crittenden, J.R.; Skoulakis, E.M.C.; Goldstein, E.S.; Davis, R.L. Drosophila mef2 is essential for normal mushroom body and wing development. Biol. Open 2018, 7, bio035618. [Google Scholar] [CrossRef]
  17. Sun, P.S.; Soderlund, M.; Venzon, N.C.; Ye, D.; Lu, Y. Isolation and characterization of two actins of the Pacific white shrimp, Litopenaeus vannamei. Mar. Biol. 2007, 151, 2145–2151. [Google Scholar] [CrossRef]
  18. Zhang, X.; Yuan, J.; Zhang, X.; Liu, C.; Li, F.; Xiang, J. Genome-wide identification and expression profiles of myosin genes in the pacific white shrimp, Litopenaeus vannamei. Front. Physiol. 2019, 10, 610. [Google Scholar] [CrossRef] [Green Version]
  19. Lee, J.-H.; Momani, J.; Kim, Y.M.; Kang, C.-K.; Choi, J.-H.; Baek, H.-J.; Kim, H.-W. Effective RNA-silencing strategy of Lv-MSTN/GDF11 gene and its effects on the growth in shrimp, Litopenaeus vannamei. Comp. Biochem. Physiol. Part B Biochem. Mol. Biol. 2015, 179, 9–16. [Google Scholar] [CrossRef]
  20. Yan, B.; Xue, B.; Zhao, L.; Gao, H. Progress on the research of the growth-related genes in Crustaceans. J. Oceanol. Limnol. 2016, 151, 97–104. [Google Scholar] [CrossRef]
  21. Sellars, M.J.; Trewin, C.; McWilliam, S.M.; Glaves, R.S.; Hertzler, P.L. Transcriptome profiles of Penaeus (Marsupenaeus) japonicus animal and vegetal half-embryos: Identification of sex determination, germ line, mesoderm, and other developmental genes. Mar. Biotechnol. 2015, 17, 252–265. [Google Scholar] [CrossRef]
  22. Wei, J.K.; Zhang, X.J.; Yu, Y.; Huang, H.; Li, F.H.; Xiang, J.H. Comparative transcriptomic characterization of the early development in Pacific White Shrimp Litopenaeus vannamei. PLoS ONE 2014, 9, e106201. [Google Scholar] [CrossRef] [Green Version]
  23. Price, A.L.; Patel, N.H. Investigating divergent mechanisms of mesoderm development in arthropods: The expression ofPh-twist andPh-mef2 inParhyale hawaiensis. J. Exp. Zool. Part B Mol. Dev. Evol. 2008, 310B, 24–40. [Google Scholar] [CrossRef] [PubMed]
  24. Zhuo, R.Q.; Zhou, T.T.; Yang, S.P.; Chan, S.F. Characterization of a molt-related myostatin gene (FmMstn) from the banana shrimp Fenneropenaeus Merguiensis. Gen. Comp. Endocrinol. 2017, 248, 55–68. [Google Scholar] [CrossRef]
  25. Martin, J.F.; Miano, J.M.; Hustad, C.M.; Copeland, N.G.; Jenkins, N.A.; Olson, E.N. A MEF2 gene that generates a muscle-specific isoform via alternative messenger-RNA splicing Mol. Cell. Biol. 1994, 14, 1647–1656. [Google Scholar] [CrossRef] [Green Version]
  26. Molkentin, J.D.; Firulli, A.B.; Black, B.L.; Martin, J.F.; Hustad, C.M.; Copeland, N.; Jenkins, N.; Lyons, G.; Olson, E.N. MEF2B is a potent transactivator expressed in early myogenic lineages. Mol. Cell. Biol. 1996, 16, 3814–3824. [Google Scholar] [CrossRef] [Green Version]
  27. Wu, W.; Huang, X.; Cheng, J.; Li, Z.; de Folter, S.; Huang, Z.; Jiang, X.; Pang, H.; Tao, S. Conservation and evolution in and among SRF- and MEF2-type MADS domains and their binding sites. Mol. Biol. Evol. 2011, 28, 501–511. [Google Scholar] [CrossRef] [Green Version]
  28. Qi, Y.; Zhang, X.; Pang, Y.; Wang, Y.; Liao, h. Expression patterns of MyoD and MEF2 genes during the development of Nanyang cattle longissimus dorsi muscle. J. Henan Agric. Univ. 2012, 46, 558–561. [Google Scholar] [CrossRef]
  29. Xuefei, L.I.U.; Yuexiang, W.; Qiu, J.; Linxi, Q.; Guangwen, G.A.O.; Yongxin, D.; Tao, Z.; Houyan, S. MEF2C gene expression profile during zebrafish embryogenesis. Fudan Univ. J. Med. Sci. 2006, 33, 89–91. [Google Scholar]
  30. Zhu, K.; Liu, B.; Guo, H.; Zhang, N.; Zhang, D. Molecular cloning and expression characterization analysis of MEF2Cs in Chlamys nobilis. Freshw. Biol. 2018, 48, 32–38. [Google Scholar] [CrossRef]
  31. Moretti, I.; Ciciliot, S.; Dyar, K.A.; Abraham, R.; Murgia, M.; Agatea, L.; Akimoto, T.; Bicciato, S.; Forcato, M.; Pierre, P.; et al. MRF4 negatively regulates adult skeletal muscle growth by repressing MEF2 activity. Nat. Commun. 2016, 7, 12397. [Google Scholar] [CrossRef] [Green Version]
  32. Bird, L. Immunometabolism: MEF2 in sickness and in health. Nat. Rev. Immunol. 2013, 13, 845. [Google Scholar] [CrossRef] [PubMed]
  33. Pon, J.R.; Marra, M.A. MEF2 transcription factors: Developmental regulators and emerging cancer genes. OncoTargets Ther. 2016, 7, 2297–2312. [Google Scholar] [CrossRef] [Green Version]
  34. Wang, W.Y.; Montel-Hagen, A.; Sasidharan, R.; Mikkola, H.K.A. MEF2C maintains B cell homeostasis through the regulation of DNA repair machinery. Blood 2012, 120, 278. [Google Scholar] [CrossRef]
  35. Potthoff, M.J.; Arnold, M.A.; McAnally, J.; Richardson, J.A.; Bassel-Duby, R.; Olson, E.N. Regulation of skeletal muscle sarcomere integrity and postnatal muscle function by Mef2c. Mol. Cell. Biol. 2007, 27, 8143–8151. [Google Scholar] [CrossRef] [Green Version]
  36. Schlesinger, J.; Schueler, M.; Grunert, M.; Fischer, J.J.; Zhang, Q.; Krueger, T.; Lange, M.; Tönjes, M.; Dunkel, I.; Sperling, S.R. The cardiac transcription network modulated by Gata4, Mef2a, Nkx2.5, Srf, histone modifications, and MicroRNAs. PLoS Genet. 2011, 7, e1001313. [Google Scholar] [CrossRef]
  37. Callegari, S.; McKinnon, R.A.; Andrews, S.; Lopes, M.A.D.B. The MEF2 gene is essential for yeast longevity, with a dual role in cell respiration and maintenance of mitochondrial membrane potential. FEBS Lett. 2011, 585, 1140–1146. [Google Scholar] [CrossRef] [Green Version]
  38. Nath, S.R.; Lieberman, M.L.; Yu, Z.; Marchioretti, C.; Jones, S.T.; Danby, E.C.E.; Van Pelt, K.M.; Sorarù, G.; Robins, D.M.; Bates, G.P.; et al. MEF2 impairment underlies skeletal muscle atrophy in polyglutamine disease. Acta Neuropathol. 2020, 140, 63–80. [Google Scholar] [CrossRef] [Green Version]
  39. Lilly, B.; Zhao, B.; Ranganayakulu, G.; Paterson, B.M.; Schulz, R.A.; Olson, E.N. Requirement of MADS domain transcription factor D-MEF2 for muscle formation in Drosophila. Science 1995, 267, 688–693. [Google Scholar] [CrossRef]
  40. Bryantsev, A.L.; Baker, P.W.; Lovato, T.L.; Jaramillo, M.S.; Cripps, R.M. Differential requirements for myocyte enhancer factor-2 during adult myogenesis in Drosophila. Dev. Biol. 2012, 361, 191–207. [Google Scholar] [CrossRef] [PubMed] [Green Version]
  41. Hayashi, M.; Kim, S.W.; Imanaka-Yoshida, K.; Yoshida, T.; Abel, E.D.; Eliceiri, B.; Yang, Y.; Ulevitch, R.J.; Lee, J.D. Targeted deletion of BMK1/ERK5 in adult mice perturbs vascular integrity and leads to endothelial failure. J. Clin. Investig. 2004, 113, 1138–1148. [Google Scholar] [CrossRef] [PubMed] [Green Version]
  42. Li, M.; Linseman, D.A.; Allen, M.P.; Meintzer, M.K.; Wang, X.; Laessig, T.; Wierman, M.E.; Heidenreich, K.A. Myocyte enhancer factor 2A and 2D undergo phosphorylation and caspase-mediated degradation during apoptosis of rat cerebellar granule neurons. J. Neurosci. 2001, 21, 6544–6552. [Google Scholar] [CrossRef]
  43. Clark, R.I.; Tan, S.W.; Pean, C.B.; Roostalu, U.; Vivancos, V.; Bronda, K.; Pilatova, M.; Fu, J.; Walker, D.W.; Berdeaux, R.; et al. MEF2 is an in vivo immune-metabolic switch. Cell 2013, 155, 435–447. [Google Scholar] [CrossRef] [PubMed] [Green Version]
  44. Gao, Y.; Zhang, X.; Wei, J.; Sun, X.; Yuan, J.; Li, F.; Xiang, J. Whole transcriptome analysis provides insights into molecular mechanisms for molting in Litopenaeus vannamei. PLoS ONE 2015, 10, e0144350. [Google Scholar] [CrossRef] [PubMed] [Green Version]
  45. Zhang, X.; Yuan, J.; Sun, Y.; Li, S.; Gao, Y.; Yu, Y.; Liu, C.; Wang, Q.; Lv, X.; Zhang, X.; et al. Penaeid shrimp genome provides insights into benthic adaptation and frequent molting. Nat. Commun. 2019, 10, 356. [Google Scholar] [CrossRef] [Green Version]
  46. Livak, K.J.; Schmittgen, T.D. Analysis of relative gene expression data using real-time quantitative PCR and the 2−ΔΔCT method. Methods 2001, 25, 402–408. [Google Scholar] [CrossRef]
  47. Langmead, B.; Salzberg, S.L. Fast gapped-read alignment with Bowtie 2. Nat. Methods 2012, 9, 357–359. [Google Scholar] [CrossRef] [Green Version]
  48. Kim, D.; Paggi, J.; Park, C.; Bennett, C.; Salzberg, S. Graph-based genome alignment and genotyping with HISAT2 and HISAT-genotype. Nat. Biotechnol. 2019, 37, 1. [Google Scholar] [CrossRef]
  49. Pertea, M.; Pertea, G.M.; Antonescu, C.M.; Chang, T.C.; Mendell, J.T.; Salzberg, S.L. StringTie enables improved reconstruction of a transcriptome from RNA-seq reads. Nat. Biotechnol. 2015, 33, 290–295. [Google Scholar] [CrossRef] [PubMed] [Green Version]
  50. Pertea, M.; Kim, D.; Pertea, G.M.; Leek, J.T.; Salzberg, S.L. Transcript-level expression analysis of RNA-seq experiments with HISAT, stringtie and ballgown. Nat. Protoc. 2016, 11, 1650–1667. [Google Scholar] [CrossRef]
Figure 1. Alternative splicing of the MEF2 gene in L. vannamei. (A) The gene structures of 17 splice variants of LvMEF2. Different colors in the CDS region represent different exons, and the blue blocks which outside the CDS region are the 5′UTR and 3′UTR of the genes, respectively. (B) Different CDS combinations of transcripts of LvMEF2. Two forms of alternative splice variants, a mutually exclusive exon and an alternative 5′ splice site, exist in the CDS region of LvMEF2. Mutually exclusive exons are two exons that cannot be present in one transcript at the same time, as 2a and 2b. Alternative 5′splice site is the splice site at the 5′end of one exon was different, resulting in an extension of the 5′end of the exon in one of the transcripts, as 4a and 4b, and 5a and 5b. There are two forms in exon 4 in which 4a is missing 18 bp base at the 5′ end of exon 4 compared with 4b. There are two forms in exon 5 in which 5a is missing 3 bp bases at the 5′ end of exon 5 compared with 5b. The numbers 1, 3, 6, and 7 indicate exons 1, 3, 6, and 7 of LvMEF2, respectively.
Ijms 24 05832 g001
Figure 2. Deduced LvMEF2 domain composition and comparison with Drosophila and human. (A) Functional domain composition of MEF2 in L. vannamei. The black horizontal lines refer to the positions of amino acids that are not part of the functional domain. (B) Predicted MEF2 proteins of L. vannamei were compared with Drosophila and human. Numbers represent the similarity of the domains; human MEF2A is used as a molecular model in the (B), and the black horizontal line shows that MEF2B has no HTURP-C domain. The green blocks refer to MADS-MEF2 domain, the orange blocks refer to HTURP-C domain, the yellow blocks refer to the C-terminus.
Ijms 24 05832 g002
Figure 3. Phylogenetic analysis of LvMEF2 and MEF2s of other species. The bootstrap values are given at each branch node. Different colors represent different classes.
Ijms 24 05832 g003
Figure 4. The expression profiles of LvMEF2. (A) Expression of total LvMEF2 in different adult shrimp tissues, heart (Ht), epidermis (Epi), muscle (Ms), lymphoid organ (Oka), stomach (St), gills (Gi), eye stalk (Es), brain (Br), hemocytes (Hc), hepatopancreas (Hp), intestine (In), and abdominal nerve (Vn). These results were based on three independent biological replications and shown as mean values ± SD. Significant differences in the gene expression levels between the three treatments are shown as a, b, bc, cd, de, ef, and f. (B) The expressions of LvMEF2 splice variants in different tissues. heart (Ht), epidermis (Epi), muscle (Ms), lymphoid organ (Oka), stomach (St), gills (Gi), eye stalk (Es), brain (Br), hemocytes (Hc), hepatopancreas (Hp), intestine (In), and abdominal nerve (Vn), ovary(Ov), antenna(Ant), testis(Te), thoracic ganglion(Tg). (C) The expressions of LvMEF2 splice variants at different molting stages, inter molting (C), pre-molting (D0, D1, D2, D3, and D4), and post-molting (P1 and P2). (D) The expressions of LvMEF2 splice variants in Oka, hepatopancreas, and hemocytes after infection by different pathogens, i.e., Vibrio parahaemolyticus (V), Staphylococcus aureus (S), and WSSV (W); sterile phosphate-buffered saline (PBS) (P) was set as the control group. Three biological replicates were taken after each pathogen infection. (E) The expressions of LvMEF2 splice variants at different early developmental stages. Zygote (Zygo), 2 cells (C2), 4 cells (C4), 32 cells (C32), blastocyst (blas), gastrula (gast), limb bud embryo I (Lbe1), limb bud embryo II (Lbe2), larva in membrane Ι I (Lim1), larva in membrane Ⅱ (Lim2), nauplius I (N1), nauplius III (N3), nauplius VI (N6), zoea I (Z1), zoea II (Z2), zoea III (Z3), mysis I (M1), mysis II (M2), mysis III (M3), and post-molt stage 1 (P1). (F) Expression of total LvMEF2 during the period from juvenile to adult. Cephalothoraxes of L. vannamei were sampled and detected after the development of post-larvae 20 to 80 days. These results were based on three independent biological replications and shown as mean values ± SD. Significant differences in the gene expression levels between three treatments are shown as a, b, c, d.
Ijms 24 05832 g004
Figure 5. The effects of LvMEF2 RNA interference on L. vannamei. (A) Relative expression level of LvMEF2 in muscle after half a month of interference. dsEGFP(Enhanced Green Fluorescent Protein) and PBS were used as controls. The expression of target genes was detected by qRT-PCR, and 18S rRNA gene was simultaneously amplified as the internal reference. (B) Changes in shrimp body weight after half a month of RNA interference. (C) Changes in body length after half a month of RNA interference. These results were based on three independent biological replications and shown as mean values ± SD. Significant differences in the gene expression levels between three treatments are shown as * p < 0.05. (D) Cumulative number of deaths during the LvMEF2 gene interference.
Ijms 24 05832 g005
Figure 6. The expression of fast- and slow-type muscle genes after LvMEF2 RNA interference. (AC) are fast-type skeletal muscle actin (FSK), LvFSK-8, LvFSK-13, and LvFSK-16. (DF) was slow-type skeletal muscle actin (SSK), LvSSK-3, LvSSK-5, and LvSSK-8. Significant differences in the gene expression levels between three treatments are shown as * p < 0.05.
Ijms 24 05832 g006
Figure 7. Histological sections of muscles and total viable bacteria count after LvMEF2 interference. (A,C) control group(PBS); (B,D) dsMEF2 group. The arrows in panel (B) refers to the region of nuclear agglutination.
Ijms 24 05832 g007
Figure 8. Differentially expressed genes after LvMEF2 knockdown and their functional enrichment analysis. (A) Volcano plot displays DEGs between the dsMEF2 group and the EGFP control group. Blue dots indicate non-significant differential expressions, red dots indicate significantly up-regulated expressions, and green dots indicate significantly down-regulated expressions. (B) GO term distribution for the DEGs. The horizontal axis is the GO term, and the vertical axis is the significance level of GO term enrichment, which is represented by −log10(padj). Padj is the p-value after multiple hypothesis testing corrections; the higher the value, the more significant it is. Different colors represent the three GO subcategories: BP (biological process), CC (cellular component), and MF (molecular function). (C) The top 20 KEGG pathways enriched in muscle for up-regulated DEGs. The abscissa is the ratio of the number of differential genes annotated to the KEGG pathway to the total number of differential genes, and the ordinate is the KEGG pathway. (D) The top 20 KEGG pathways enriched in muscle for down-regulated DEGs.
Ijms 24 05832 g008
Table 1. MEF2 protein sequences for phylogenetic tree analysis.
PhylumClassSpeciesAccession NumberName
ChordataMammaliaHomo sapiensNP_001124398.1MEF2A
NP_001139257.1MEF2B
NP_002388.2MEF2C
NP_005911.1MEF2D
ActinopterygiiDanio rerioNP_571376.1MEF2A
NP_001265785.1MEF2B
NP_571387.2MEF2C
NP_571392.1MEF2D
CephalochordaBranchiostomaABN45793.2MEF2
EchinodermataEchinoideaStrongylocentrotus purpuratusXP_030832331.1MEF2A
XP_030832332.1MEF2C
AsteroideaPatiria miniataXP_038073316.1MEF2
MolluscaLamellibranchiaCrassostrea gigasXP_019924459.1MEF2A
ArthropodInsectaDrosophila melanogasterNP_995789.1MEF2
CrustaceaLitopenaeus vannameiANF06985.1LvMEF2-Ι
ANF06987.1LvMEF2-ΙI
Fenneropenaeus chinensisXP_047489214.1MEF2
Marsupenaeus japonicusXP_042870546.1MEF2
Penaeus monodonXP_037791174.1MEF2
Procambarus clarkiiXP_045596659.1MEF2
Homarus americanusXP_042235713.1MEF2
Eriocheir sinensisXP_050702542.1MEF2
Portunus trituberculatusXP_045110562.1MEF2
MerostomataLimulus polyphemusXP_013785034.1MEF2
NematodaNematodaCaenorhabditis elegansAAA79336.1MEF2
PlatyhelminthesTrematodaClonorchis sinensisGAA55193.1MEF2
CoelenterataAntllozoaNematostella vectensisAER29903.1MEF2
PoriferaDemospongiaeAmphimedon queenslandicaXP_003388870.1MEF2
Table 2. Differentially expressed genes enriched in muscle after LvMEF2 interference.
Gene IDGene Descriptionlog2Fold Change
Muscle-relatednovel.2155Myosin N-terminal SH3-like domain−4.509773837
LVAN04176Myosin-4−2.978206791
novel.4121Myosin heavy chain 13, skeletal muscle−1.772697548
LVAN16923ACT2_BOMMO Actin, muscle-type−4.386672998
LVAN16916ACT3_DROME Actin-57−2.098122282
LVAN16917ACT_MANSE Actin, muscle−2.036265474
Immunity and cellular-stress-relatedLVAN23842Heat shock protein 22−2.237662541
LVAN23843Heat shock protein 20−2.036169236
LVAN17308Heat shock protein 70−1.753724055
LVAN17629Heat shock protein 60−1.44127178
LVAN23851Heat shock protein 20−1.939231582
novel.751Heat shock protein 10, mitochondrial−1.216804722
LVAN09991Heat shock protein 90−1.75361939
LVAN17366Heat shock protein 70−1.2135562
novel.2459Heat shock protein 70−1.068649747
novel.386Heat shock protein 70−1.019314088
LVAN24387Heat shock protein 27−1.40954243
LVAN23841Heat shock protein 20/alpha-crystallin family−1.853351031
LVAN14669Heat shock protein 20/alpha-crystallin family−1.839008177
LVAN16387Immunoglobulin I-set domain1.62053716
LVAN04048Immunoglobulin I-set domain1.716095306
LVAN04045Immunoglobulin I-set domain3.467470081
LVAN10981Immunoglobulin I-set domain1.13315602
LVAN19532Immunoglobulin I-set domain1.175834599
LVAN14378Immunoglobulin I-set domain1.8356356
LVAN12953Ras-like GTP-binding protein Rho11.946771427
LVAN25515Ras-related protein Rab-2A1.317082979
novel.5097NFX1-type zinc finger-containing protein 12.242125717
LVAN22842NFX1-type zinc finger-containing protein 11.523548395
LVAN00304NFX1-type zinc finger-containing protein 13.012657901
novel.1678Interferon-related developmental regulator 1−4.437000125
novel.1677Interferon-related developmental regulator 2−1.275543979
LVAN11504MFS-1−2.807489076
Protein synthesis-relatedLVAN04287Glutamate–cysteine ligase catalytic subunit−1.984075309
LVAN14777Methionine synthase−1.947132225
novel.4193Aspartate–tRNA ligase−1.771238279
LVAN22403Eukaryotic translation initiation factor 2 subunit 1−1.674467809
novel.1790Tubulin beta-1 chain−1.648057083
LVAN06976Glutaminyl–tRNA synthetase−1.506118061
novel.2347E3 ubiquitin–protein ligase−1.489605619
novel.1785Glutamic–pyruvic transaminase−1.444998457
LVAN22801Serine/threonine–protein kinase−1.278572371
LVAN07472Tyrosine–tRNA ligase−1.25618501
novel.3677Serine/threonine–protein kinase−1.193831772
LVAN13244Phenylalanine–tRNA ligase beta subunit−1.114841361
novel.2206Valine–tRNA ligase−1.072706294
LVAN15077Casein kinase II subunit−1.026426438
Mitochondrial-relatedLVAN00040Mitochondrial import inner membrane translocase subunit−2.067899986
LVAN06526Mitochondrial glycine transporter−1.79981545
novel.716Mitochondrial pyruvate carrier 1−1.480260336
novel.2831Mitochondrial import receptor subunit−1.018535966
novel.2485Mitochondrial-processing peptidase subunit alpha−1.017153841
Disclaimer/Publisher’s Note: The statements, opinions and data contained in all publications are solely those of the individual author(s) and contributor(s) and not of MDPI and/or the editor(s). MDPI and/or the editor(s) disclaim responsibility for any injury to people or property resulting from any ideas, methods, instructions or products referred to in the content.

