
A Dynamic Recurrent Neural Network for Predicting Higher Heating Value of Biomass


Abstract
:1. Introduction
2. Results and Discussions
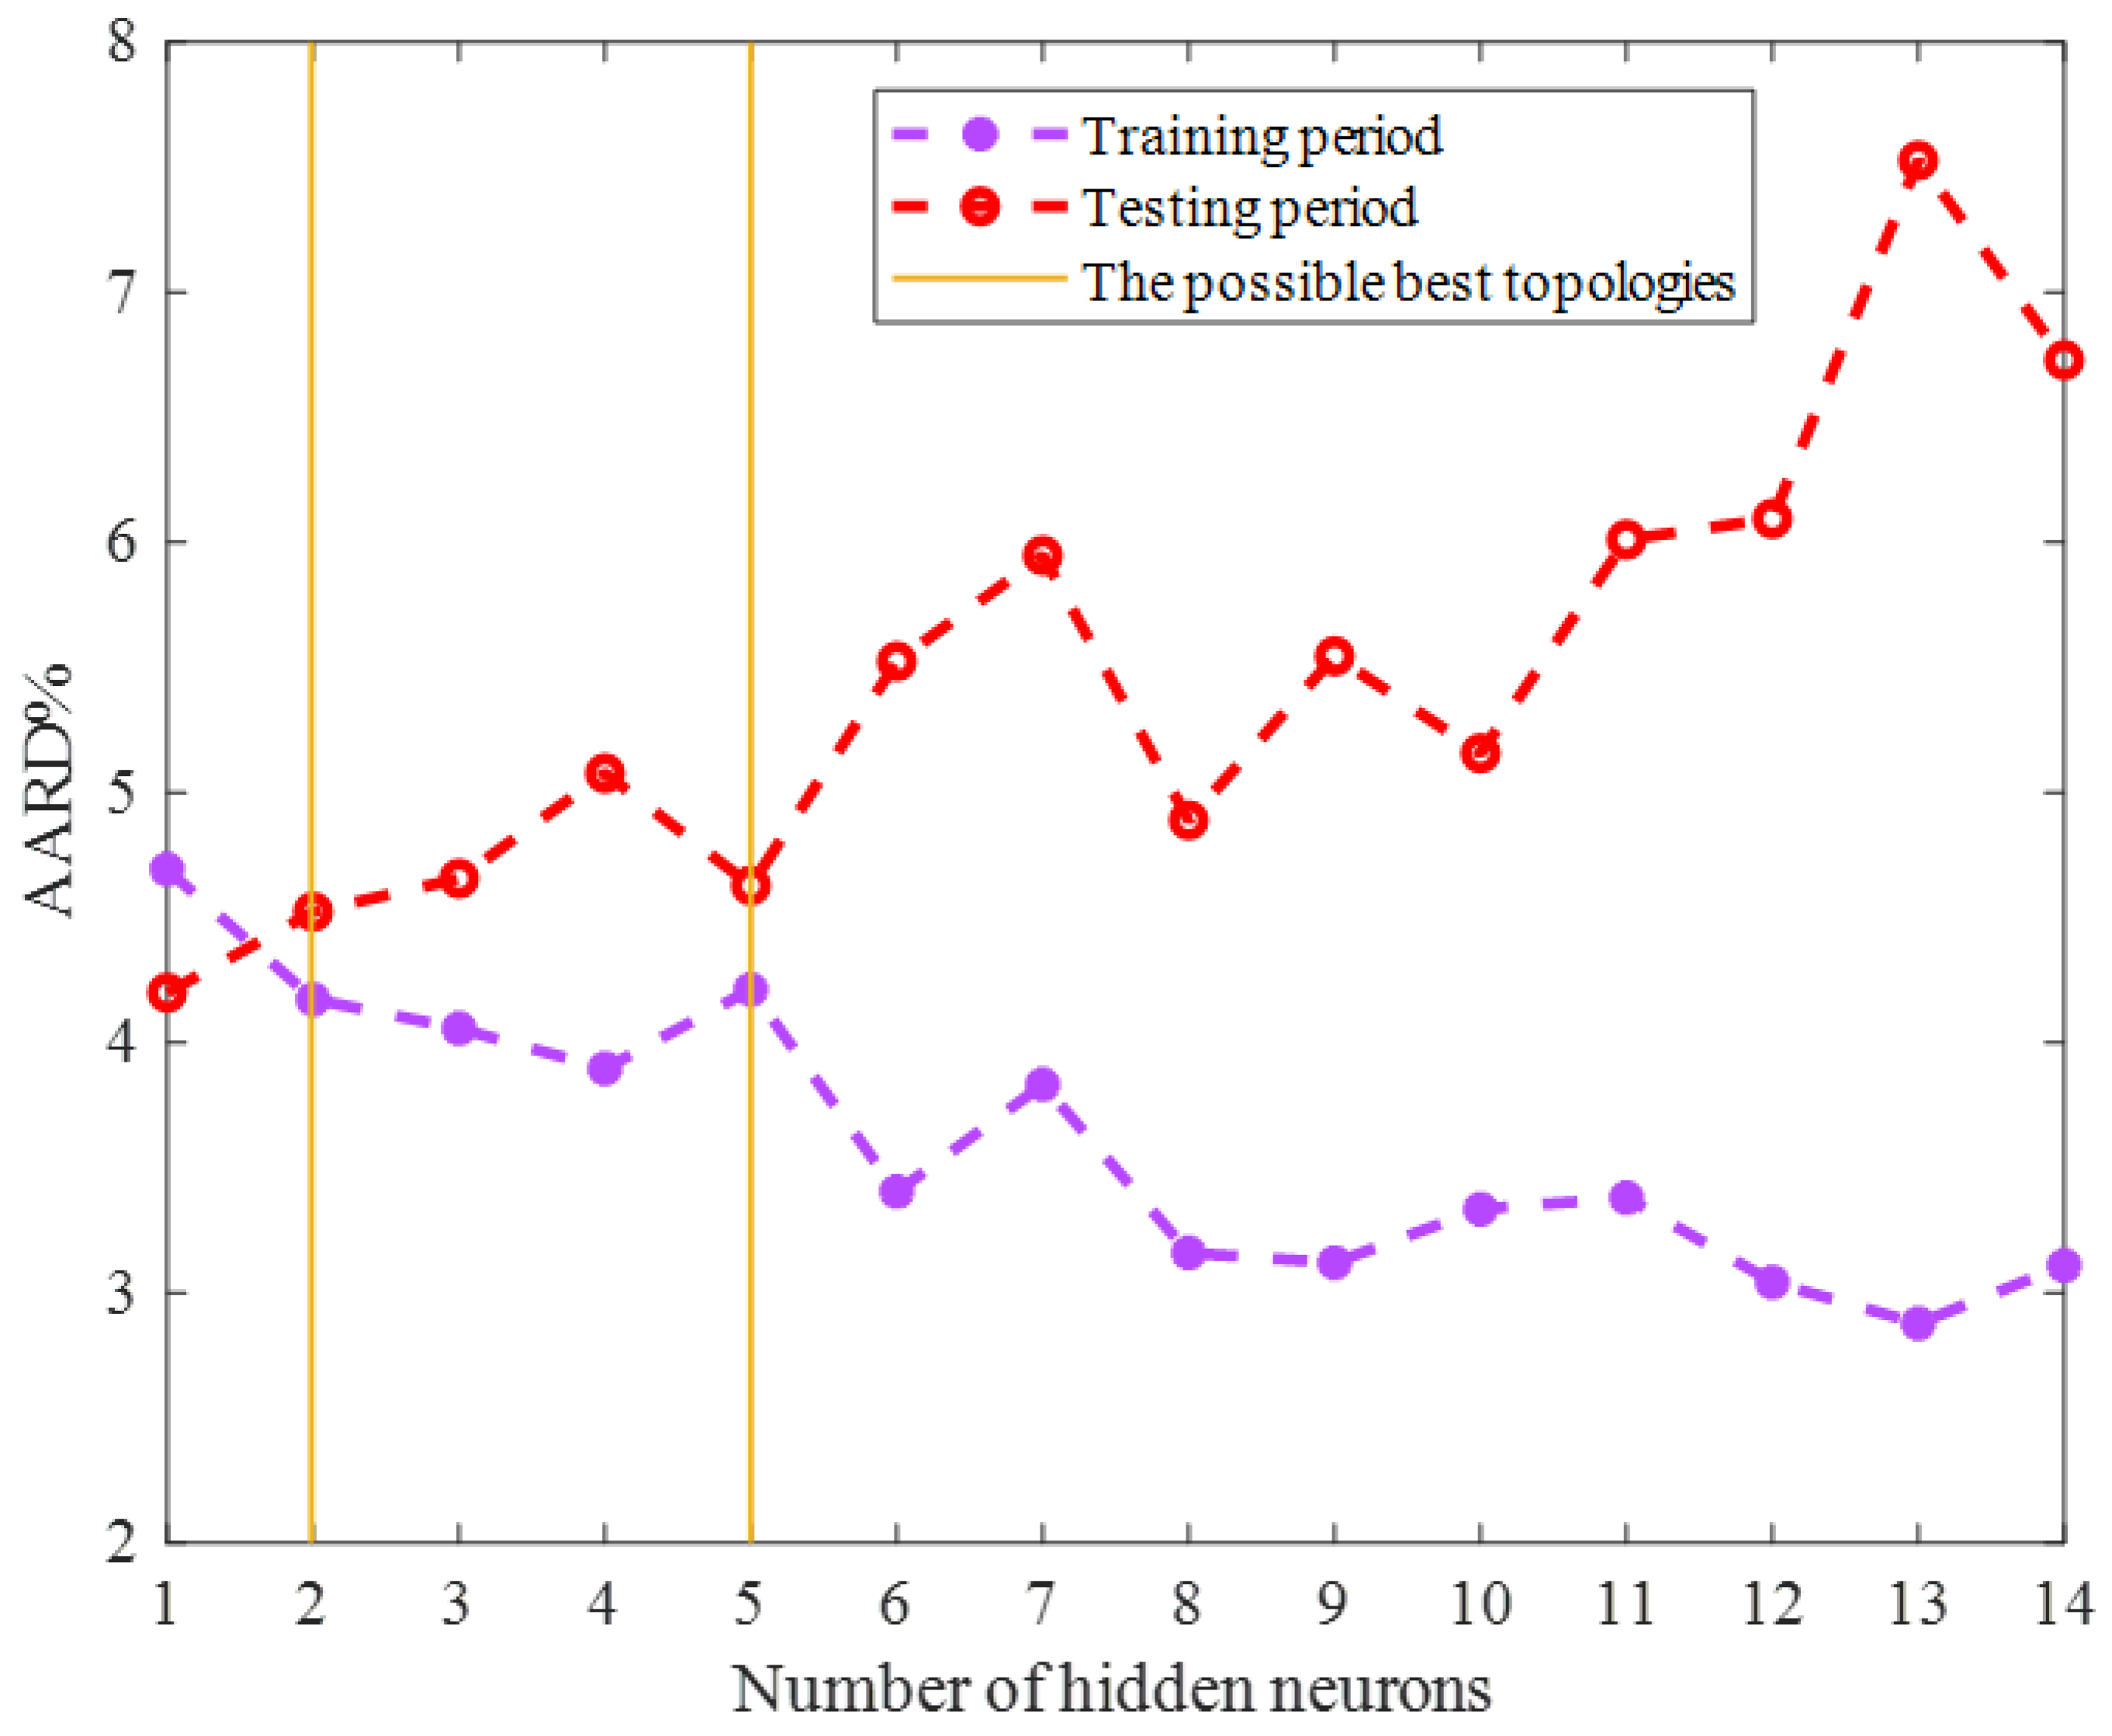
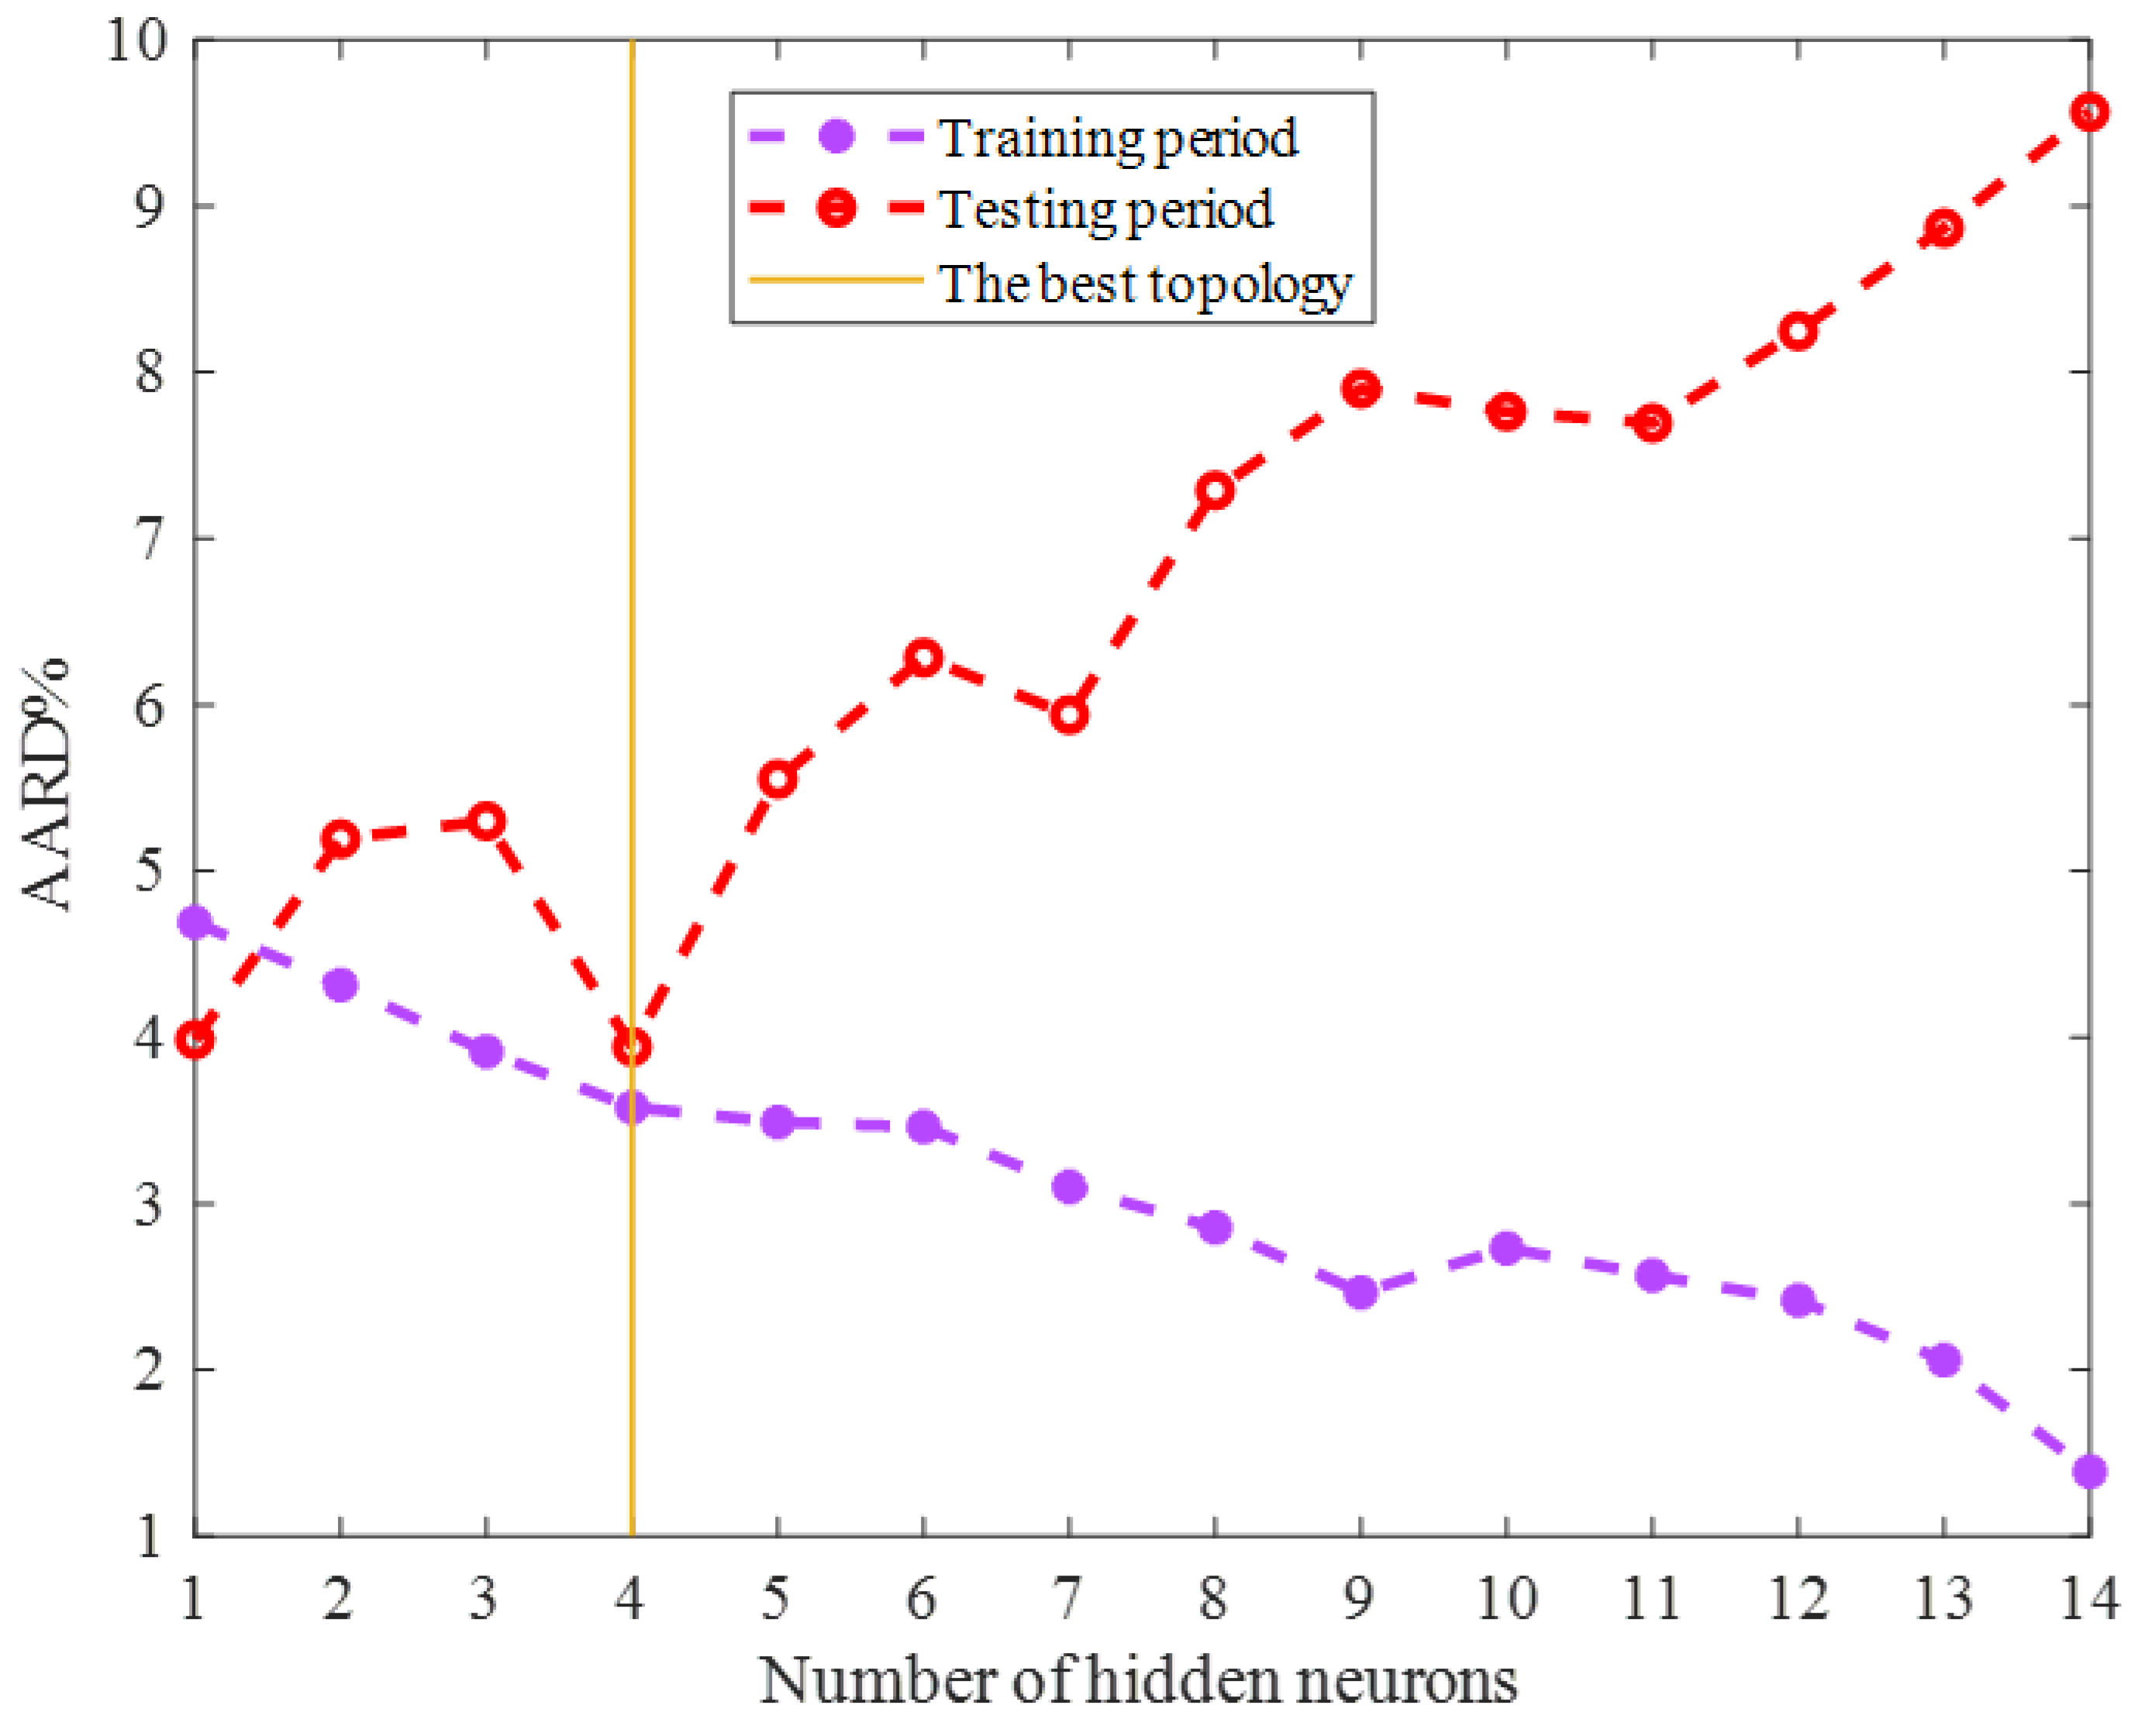
2.1. Topology Tuning the ENN Model
2.2. Performance Monitoring
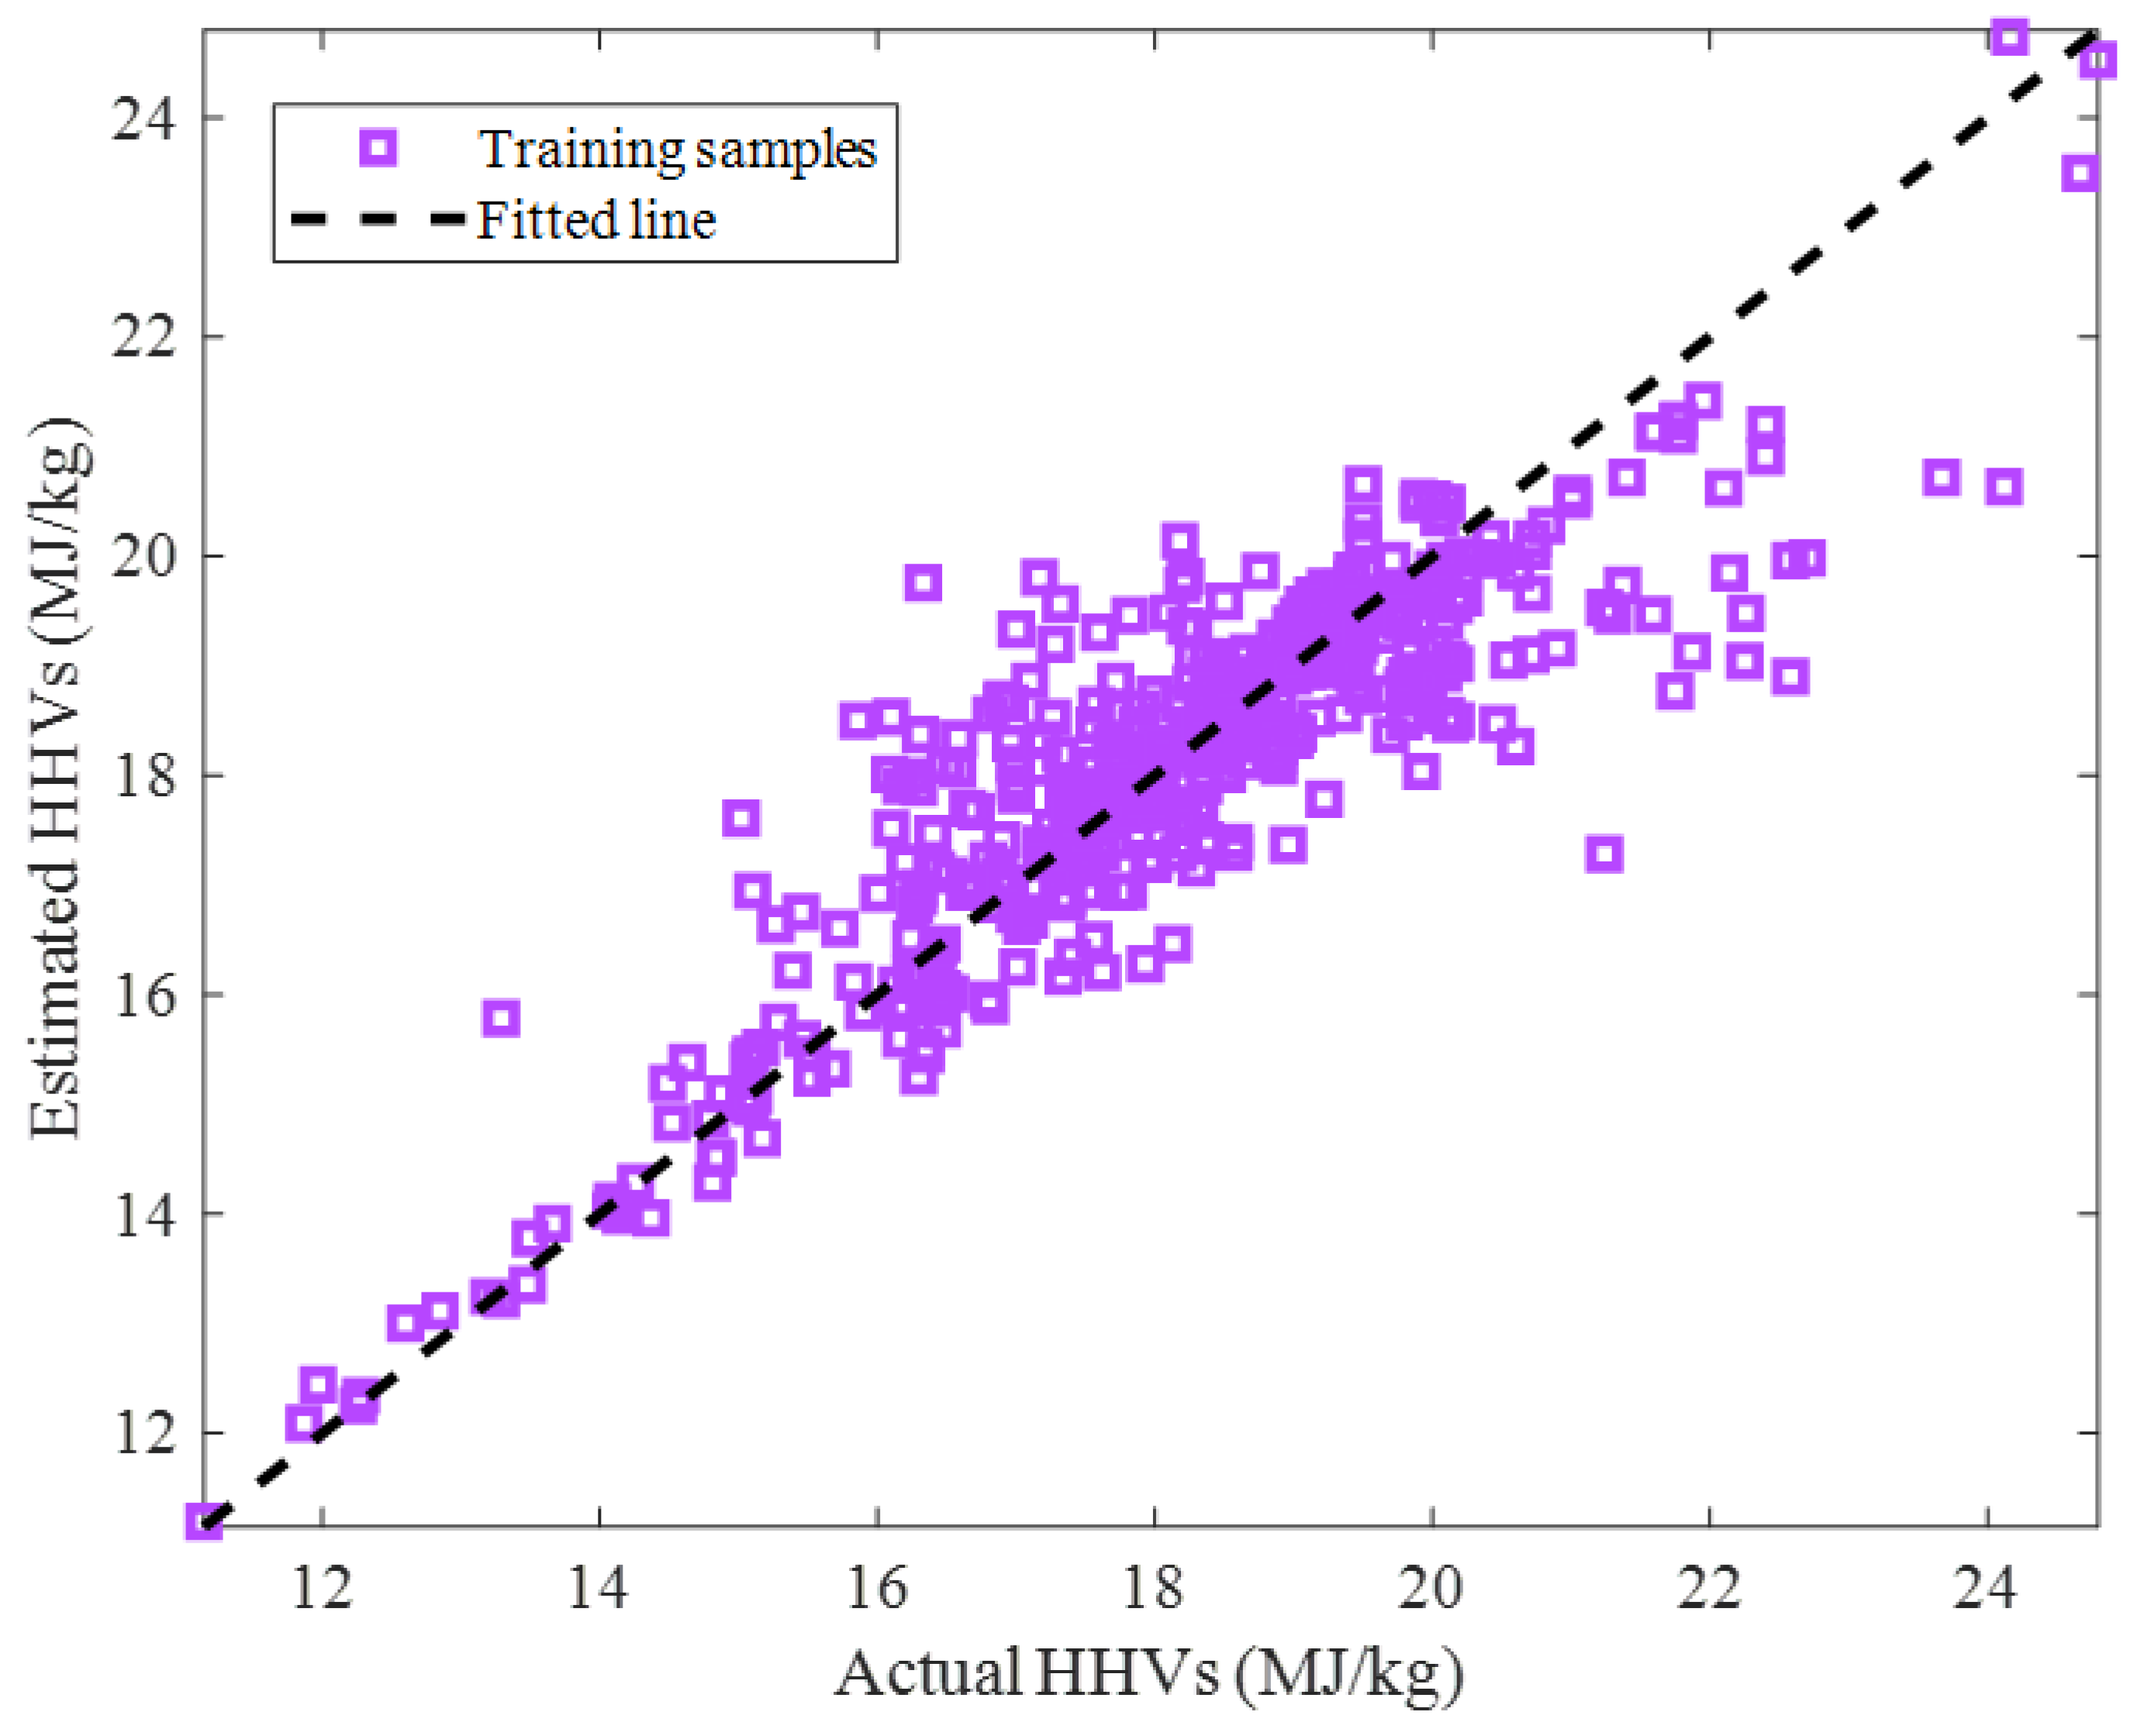
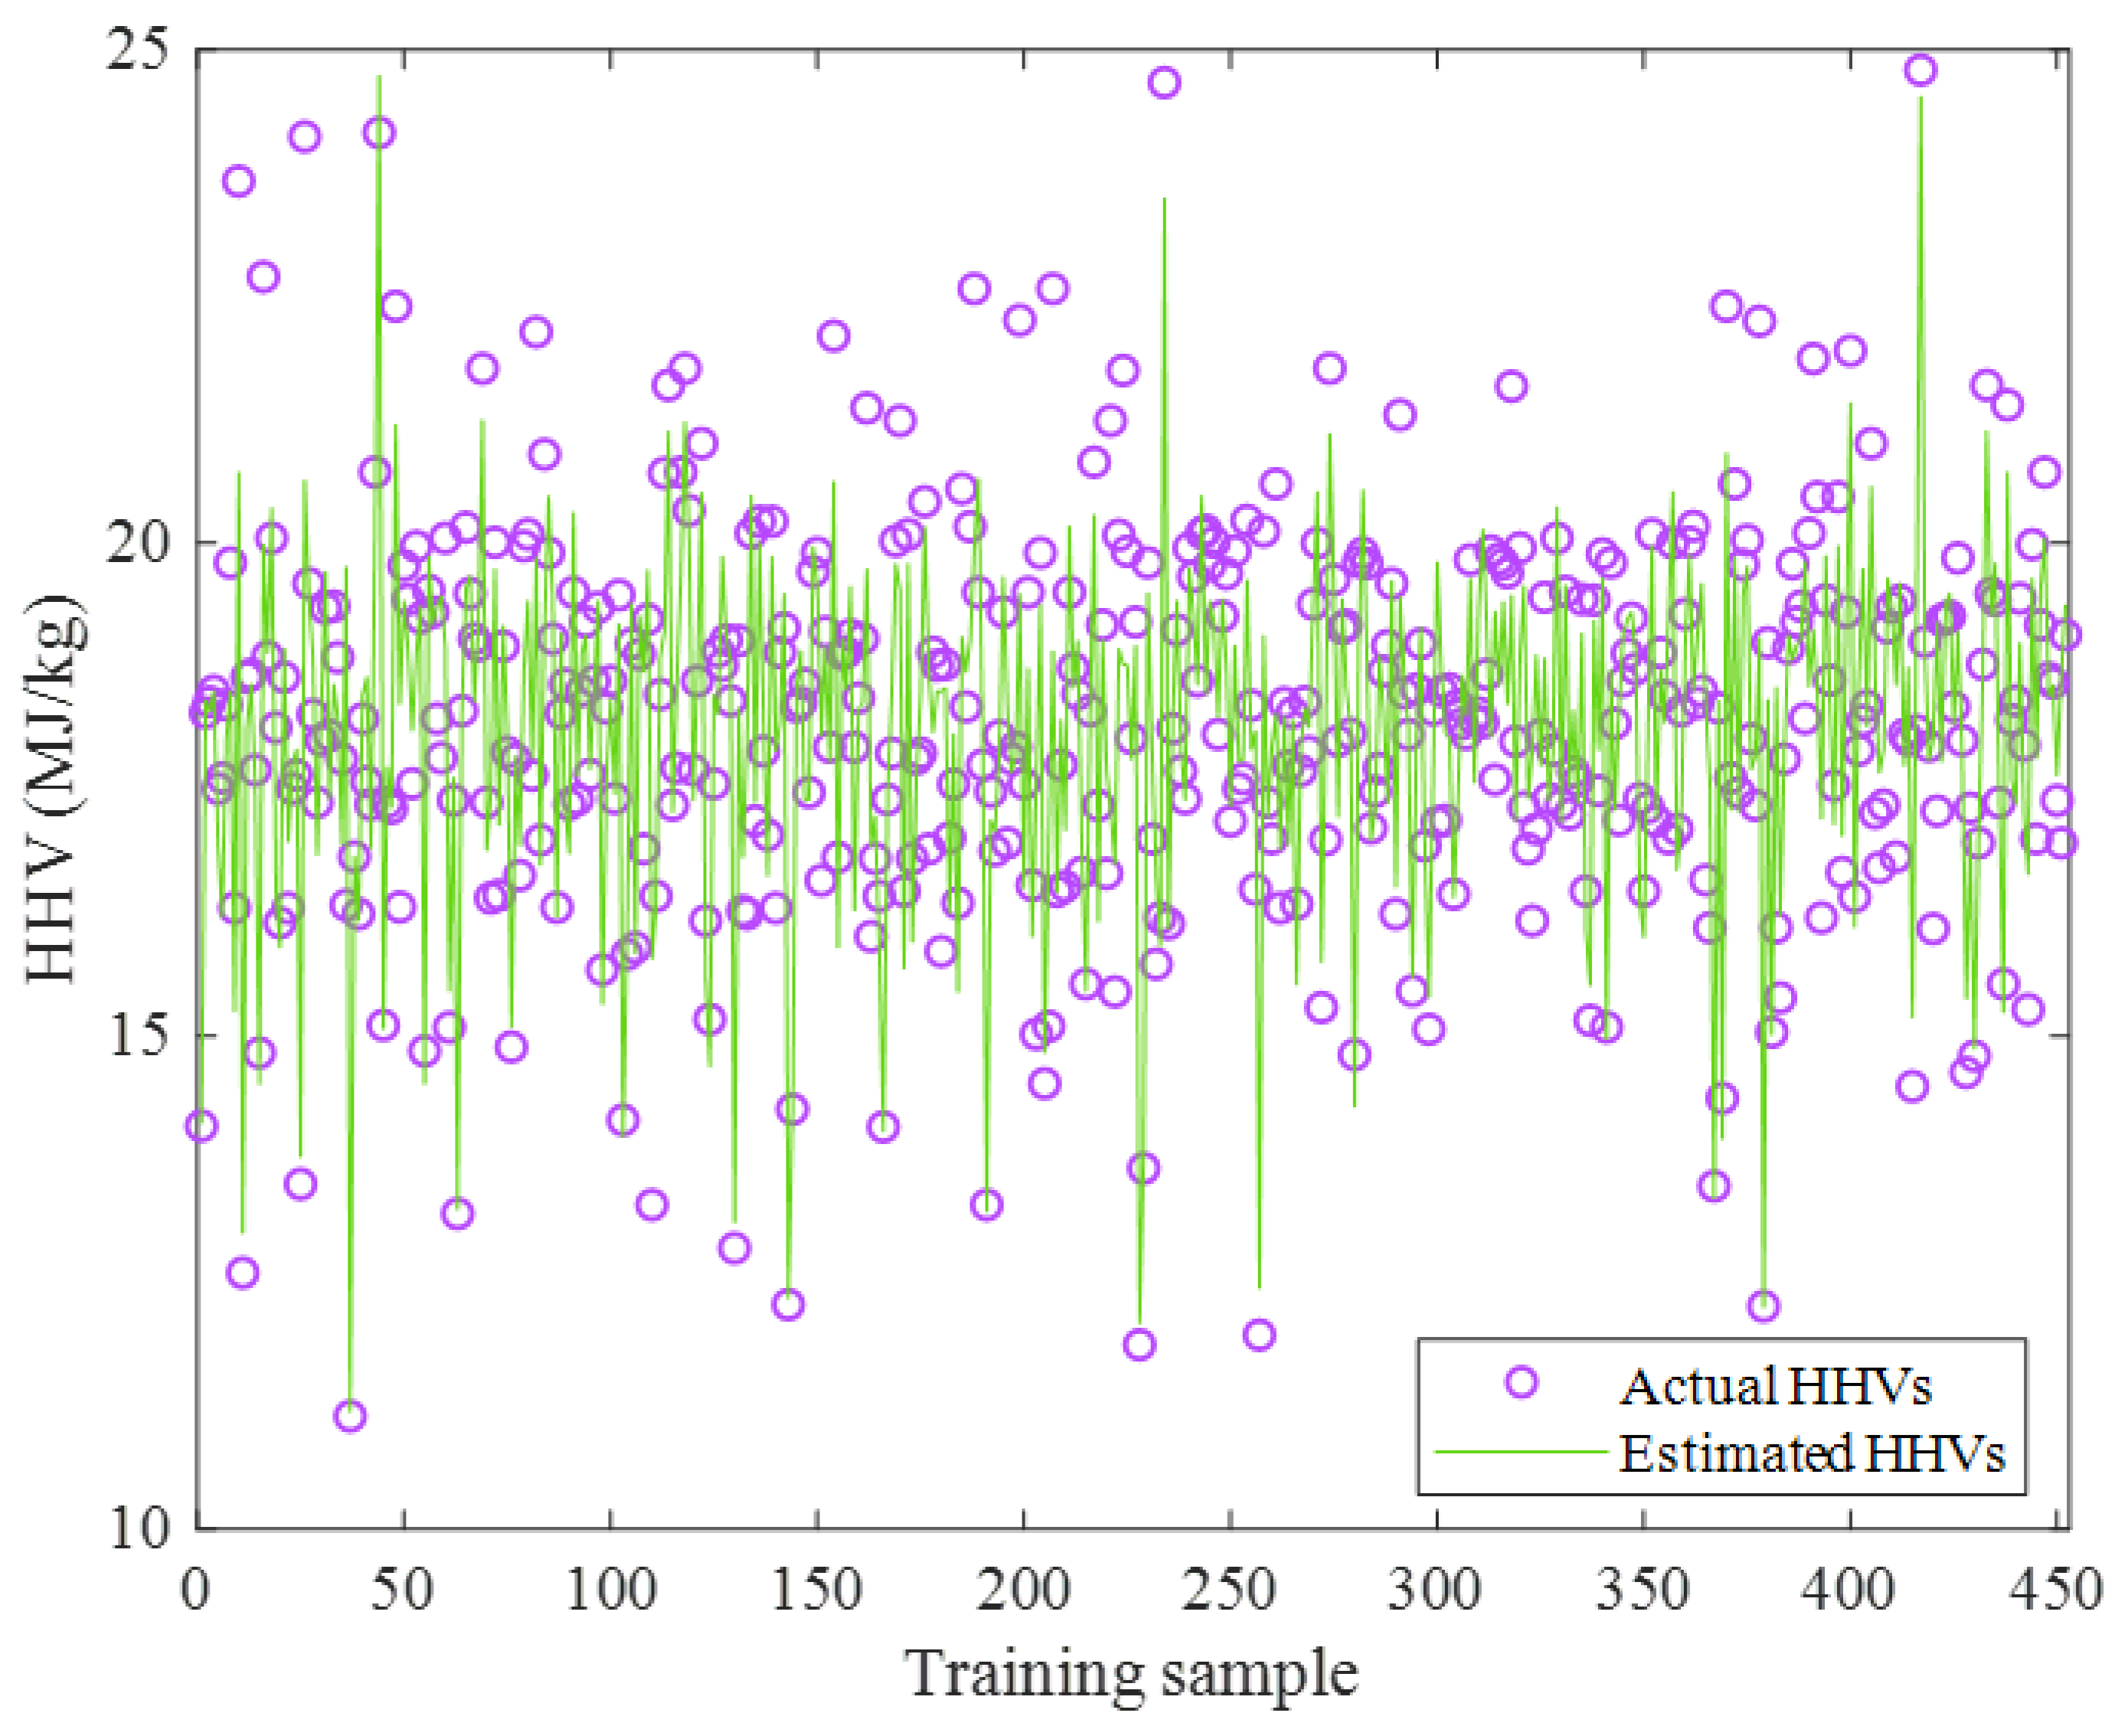
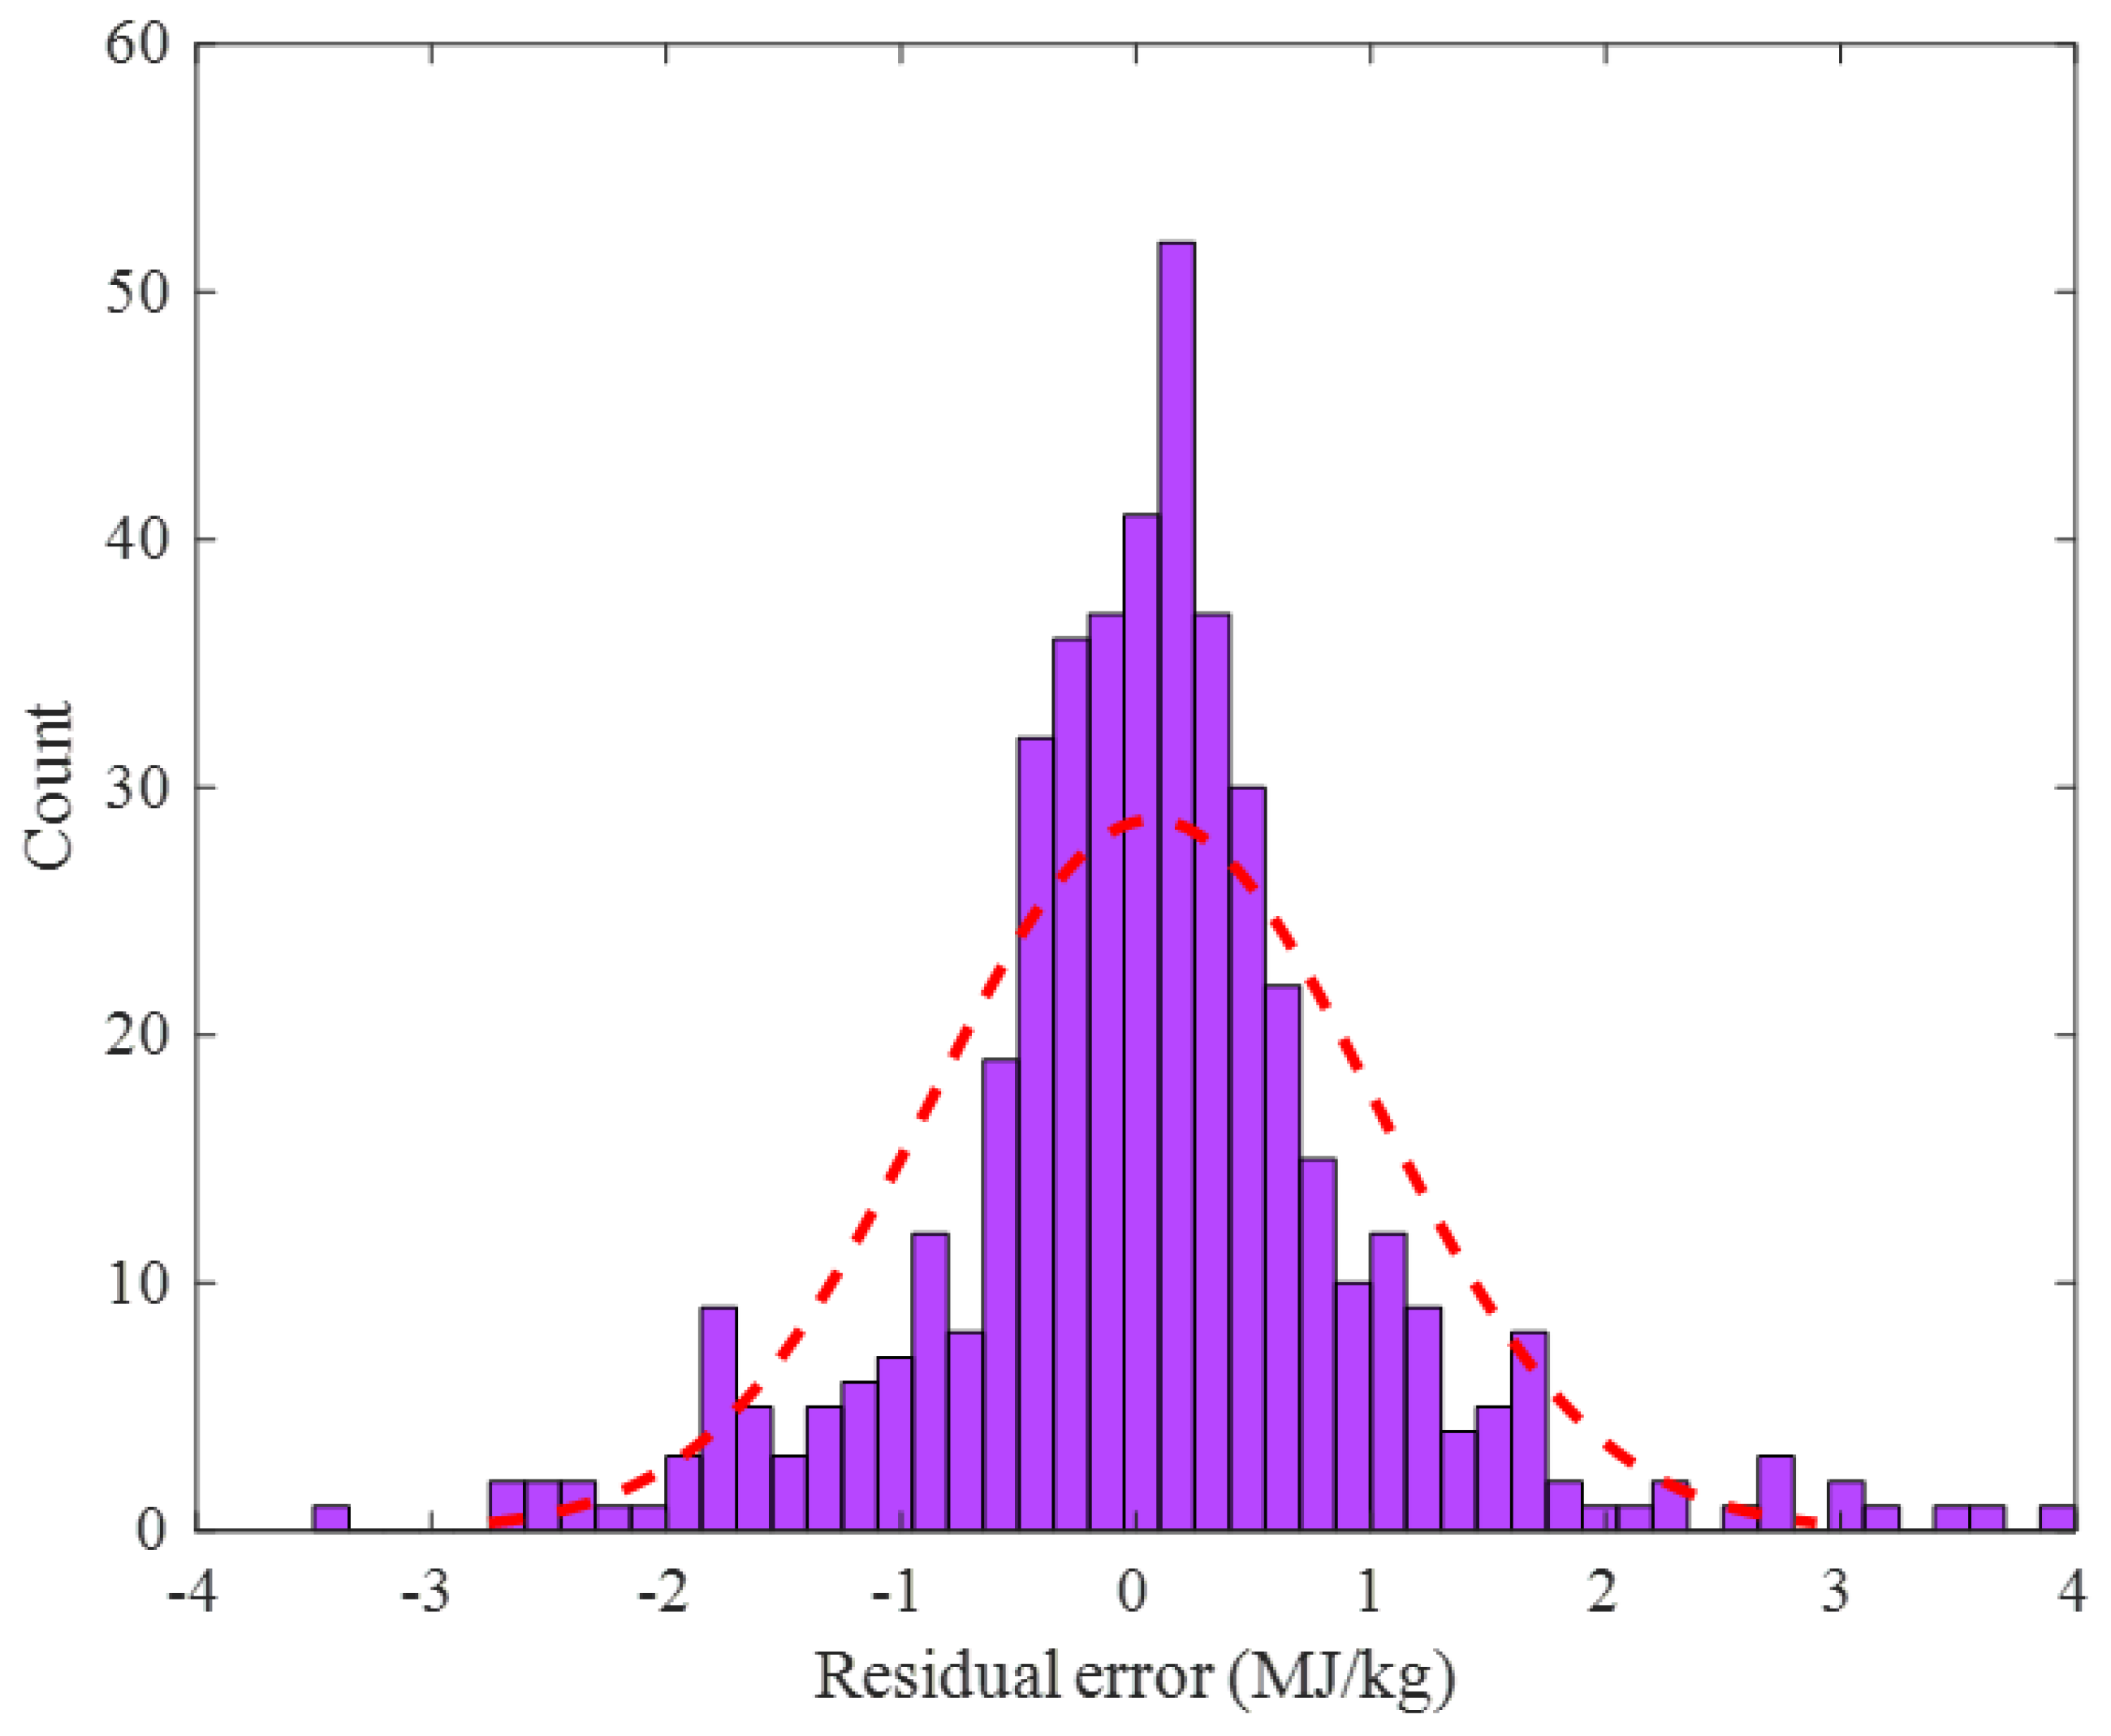
2.2.1. Training Stage
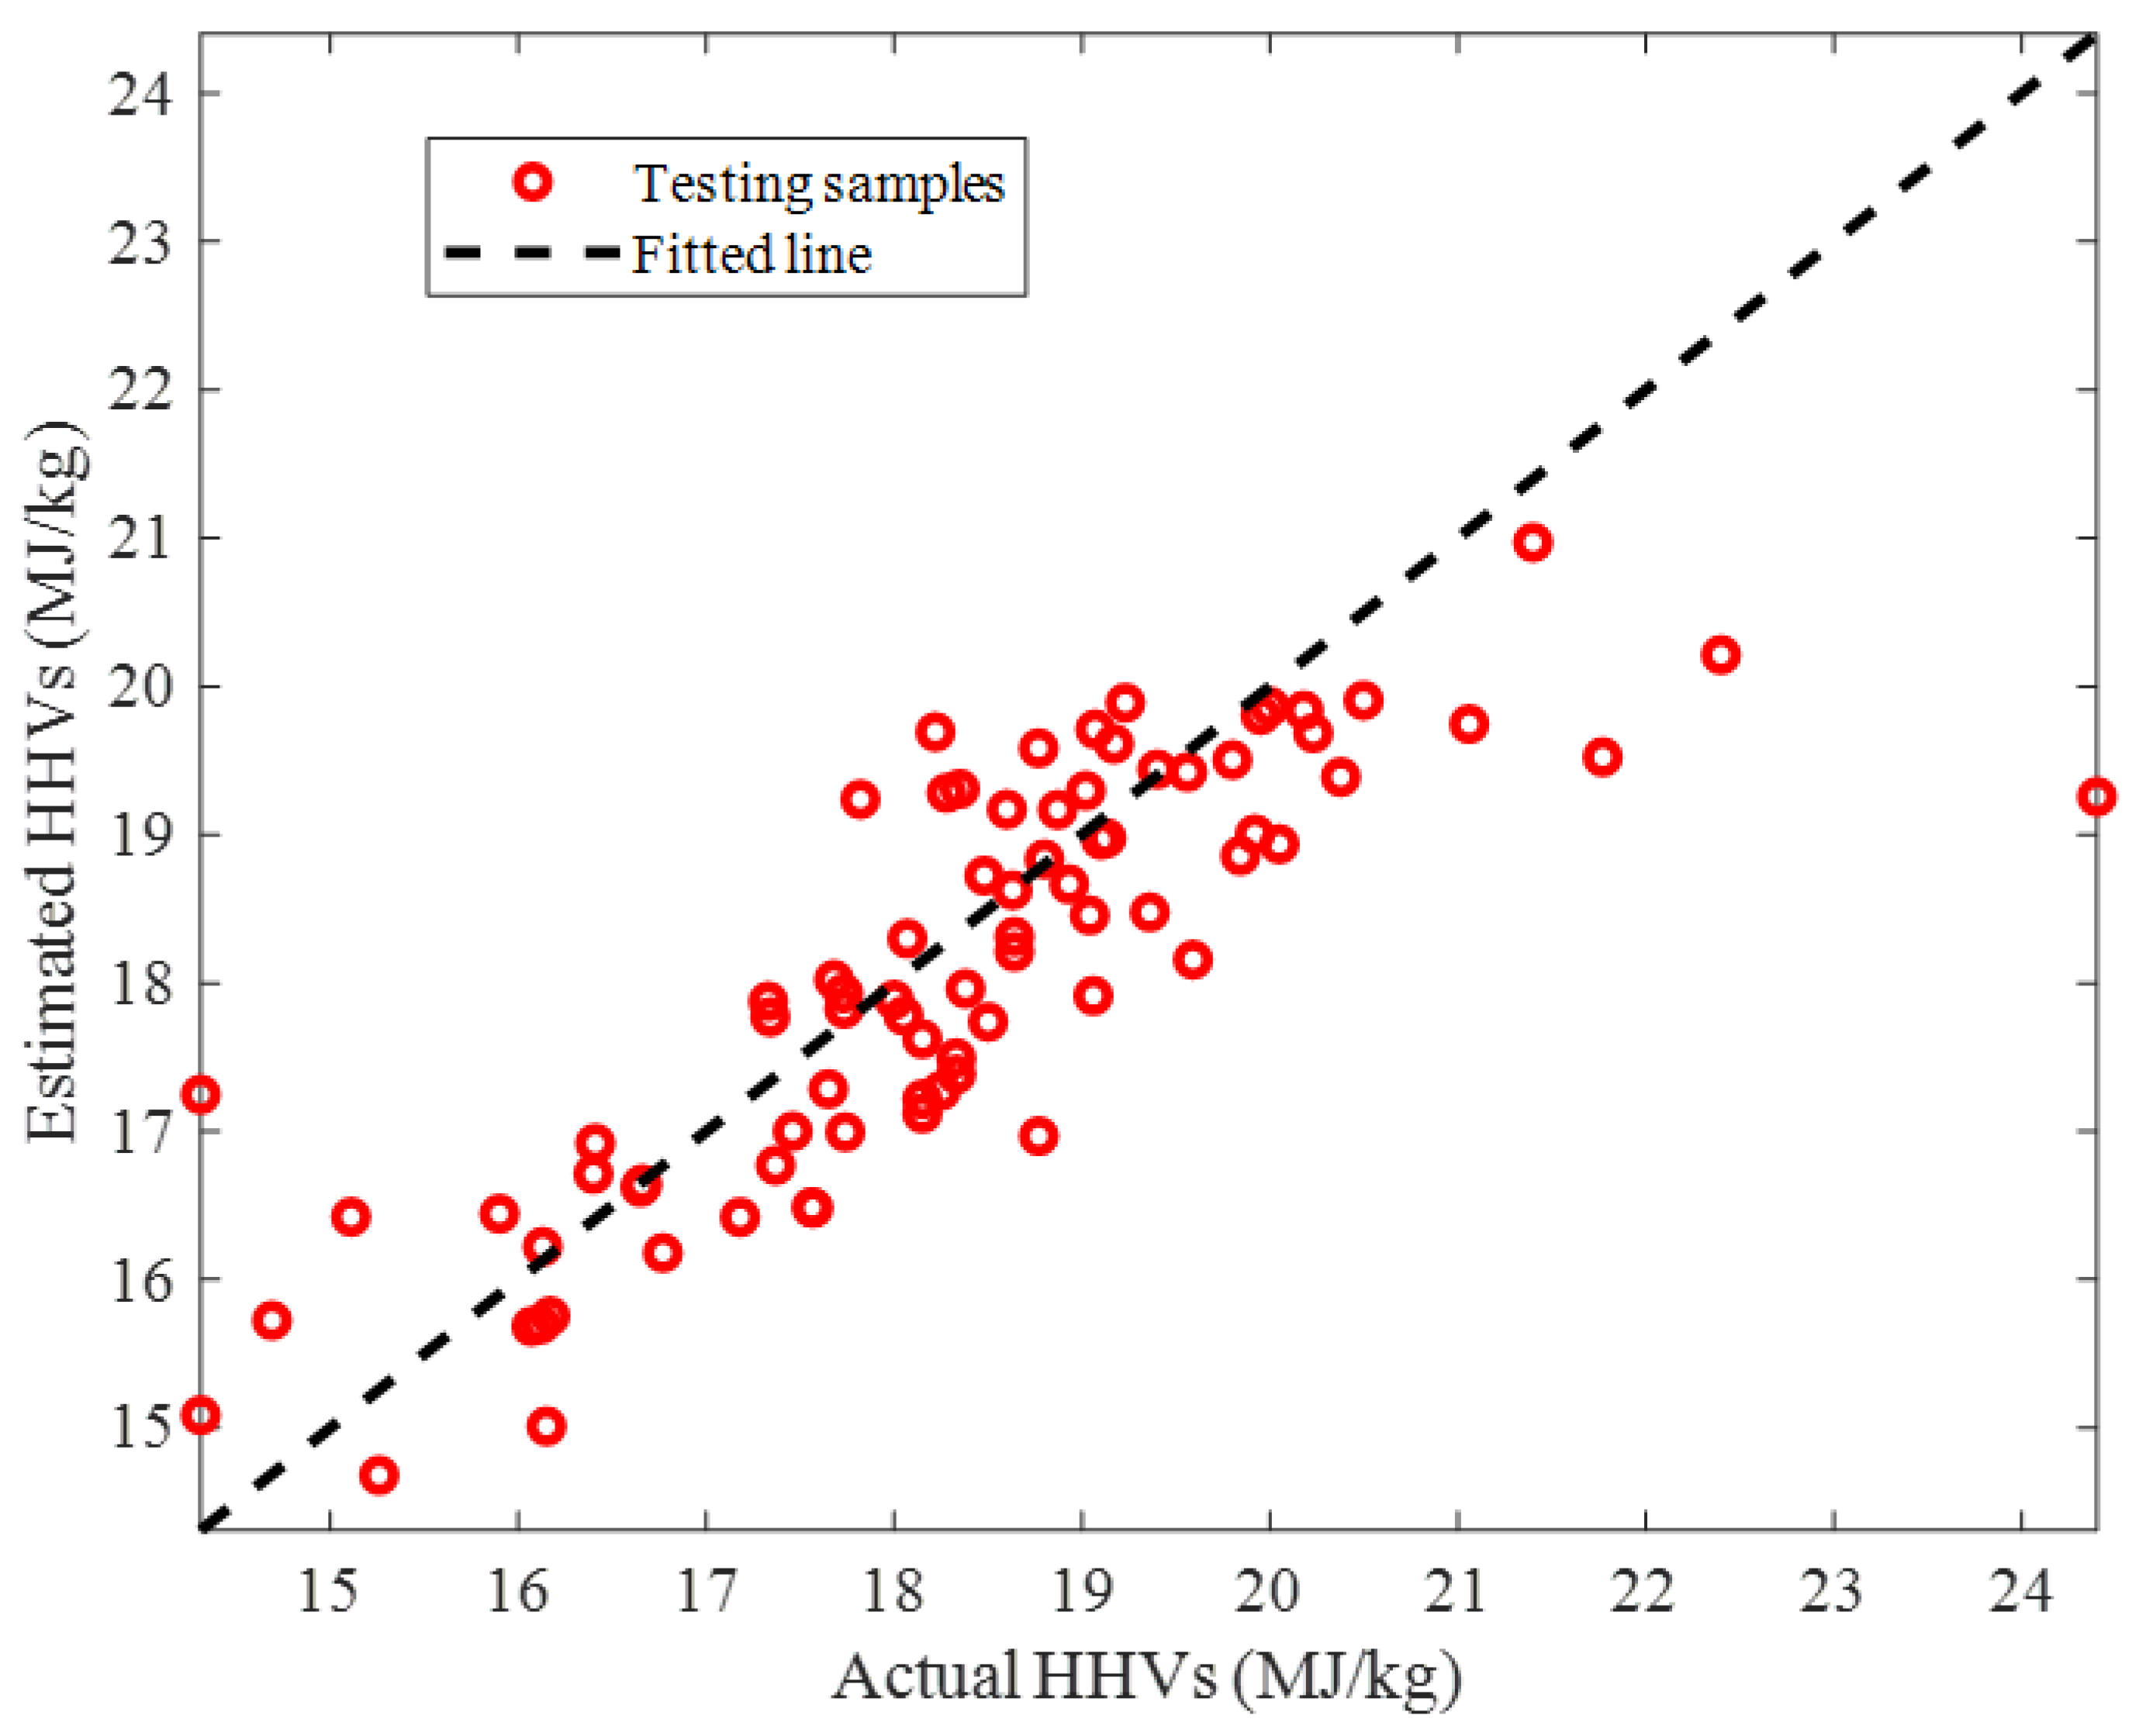
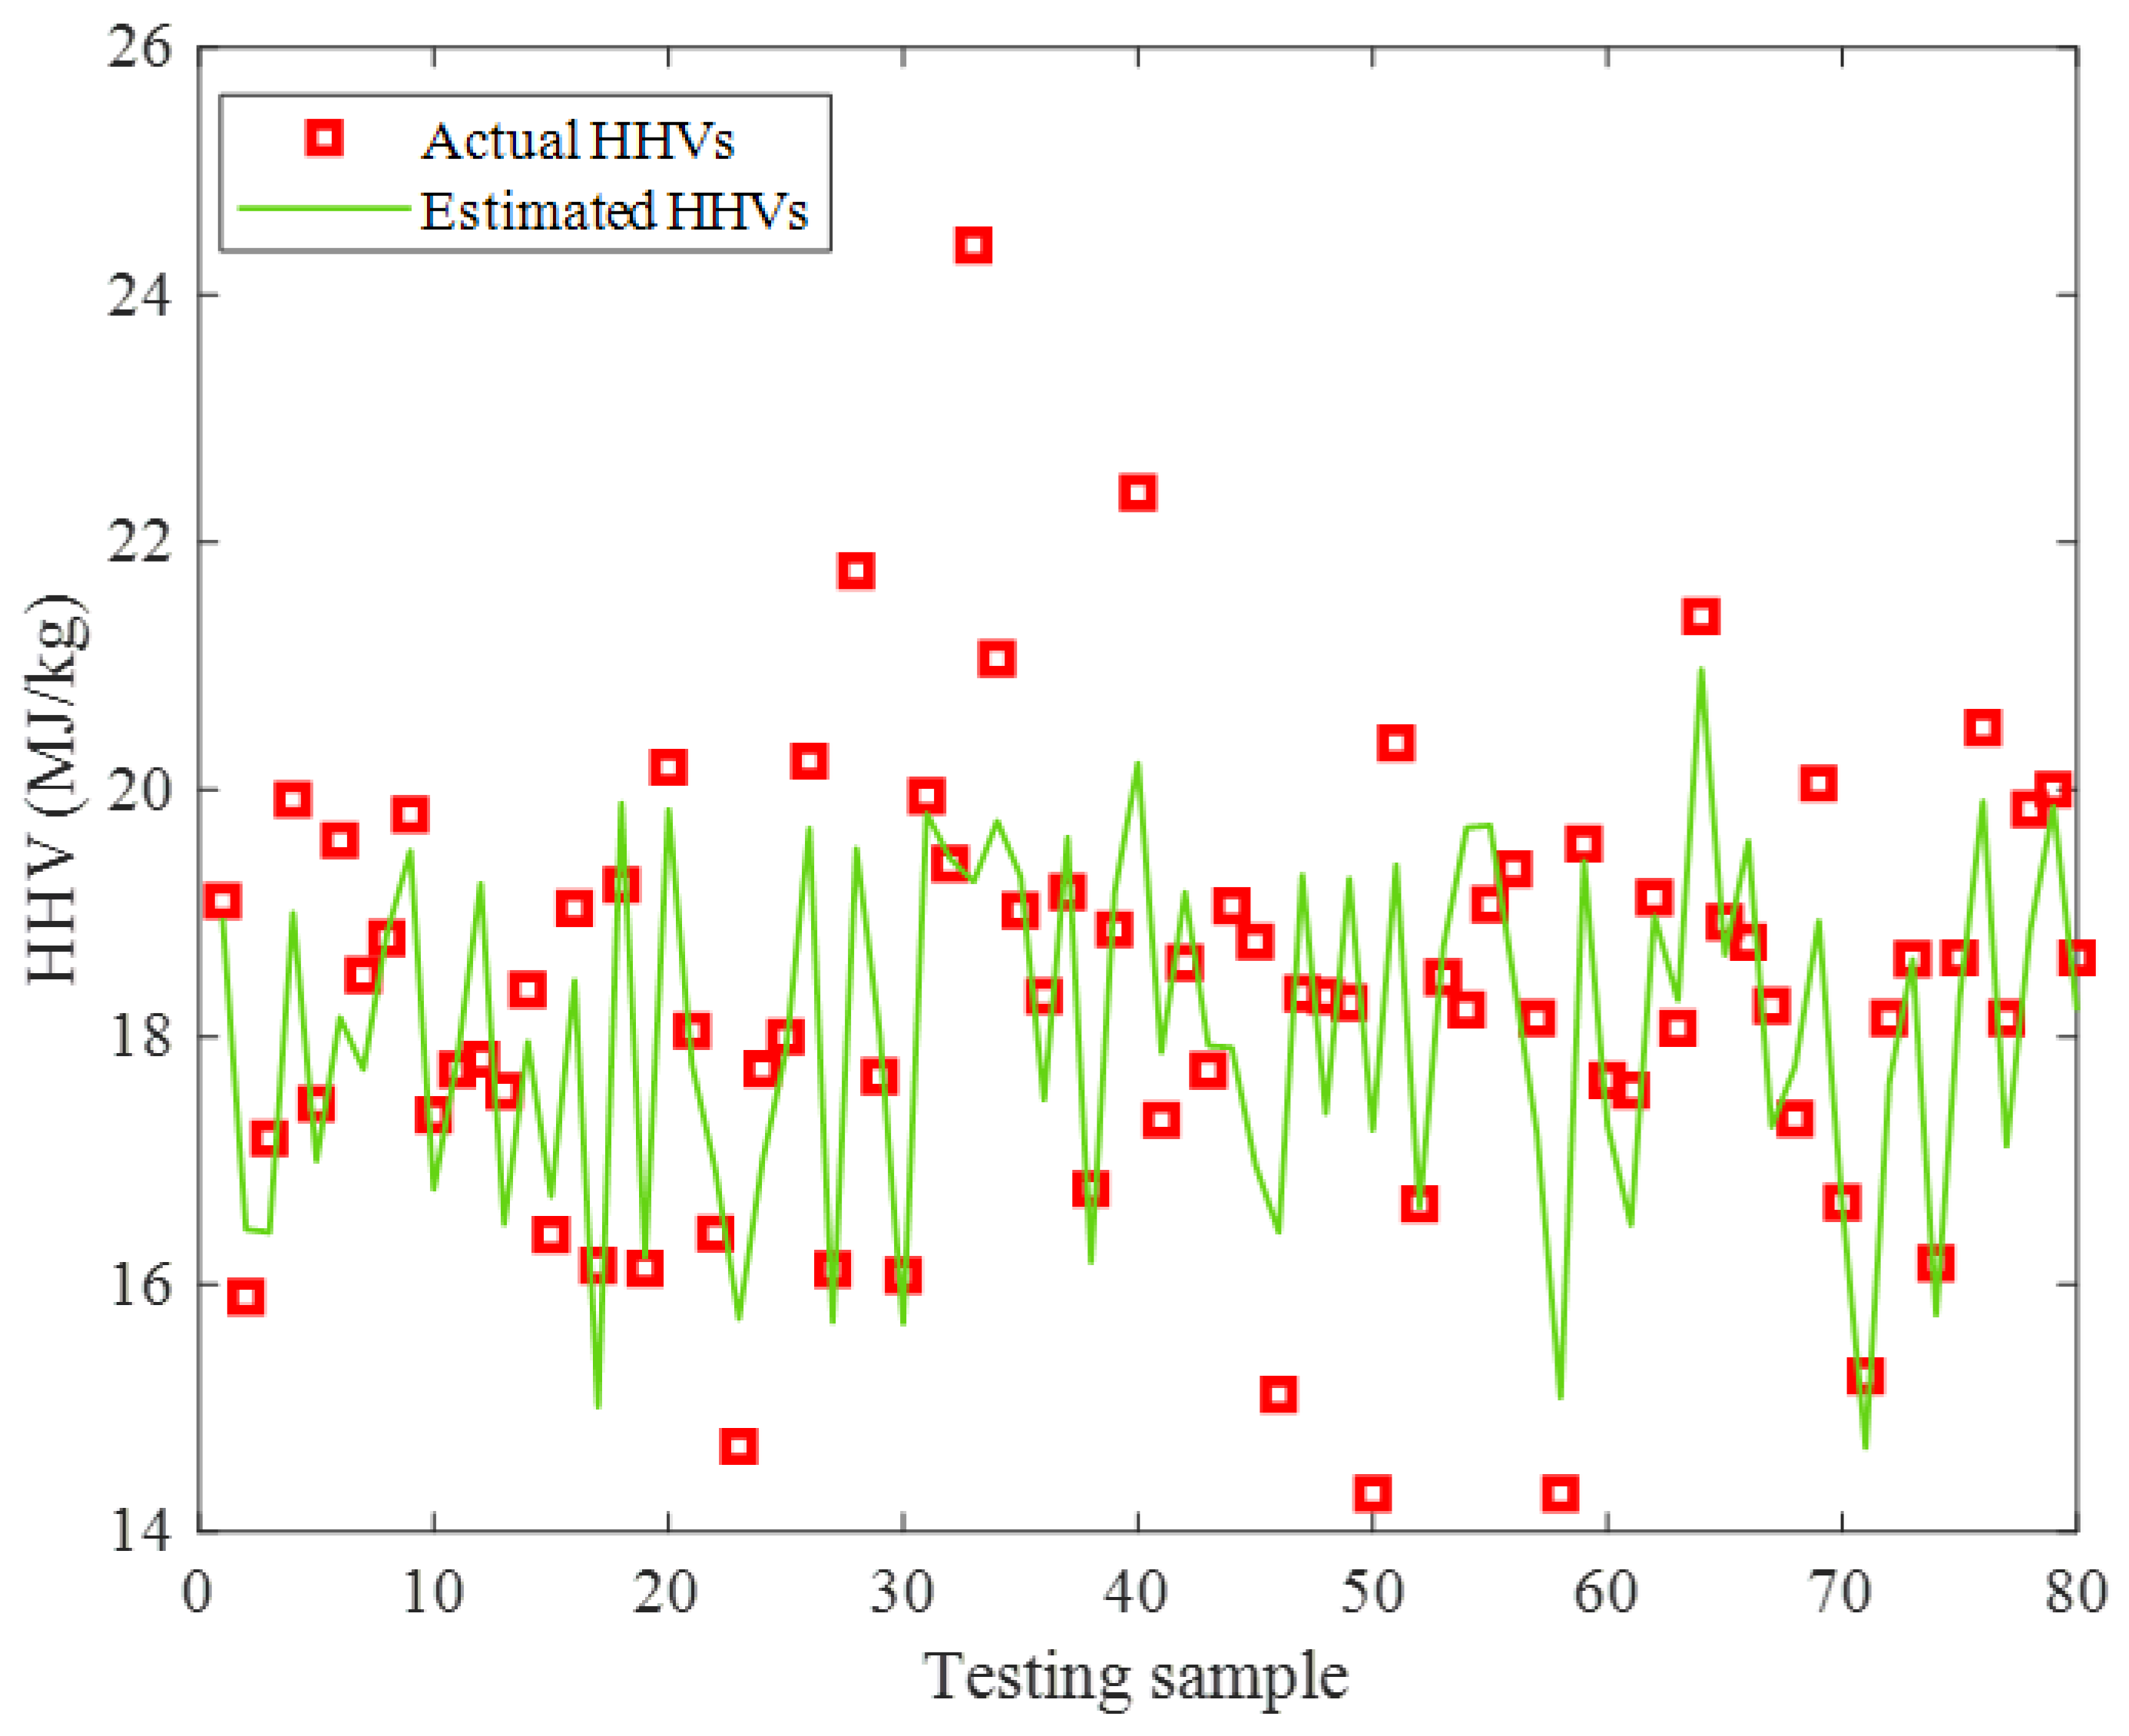
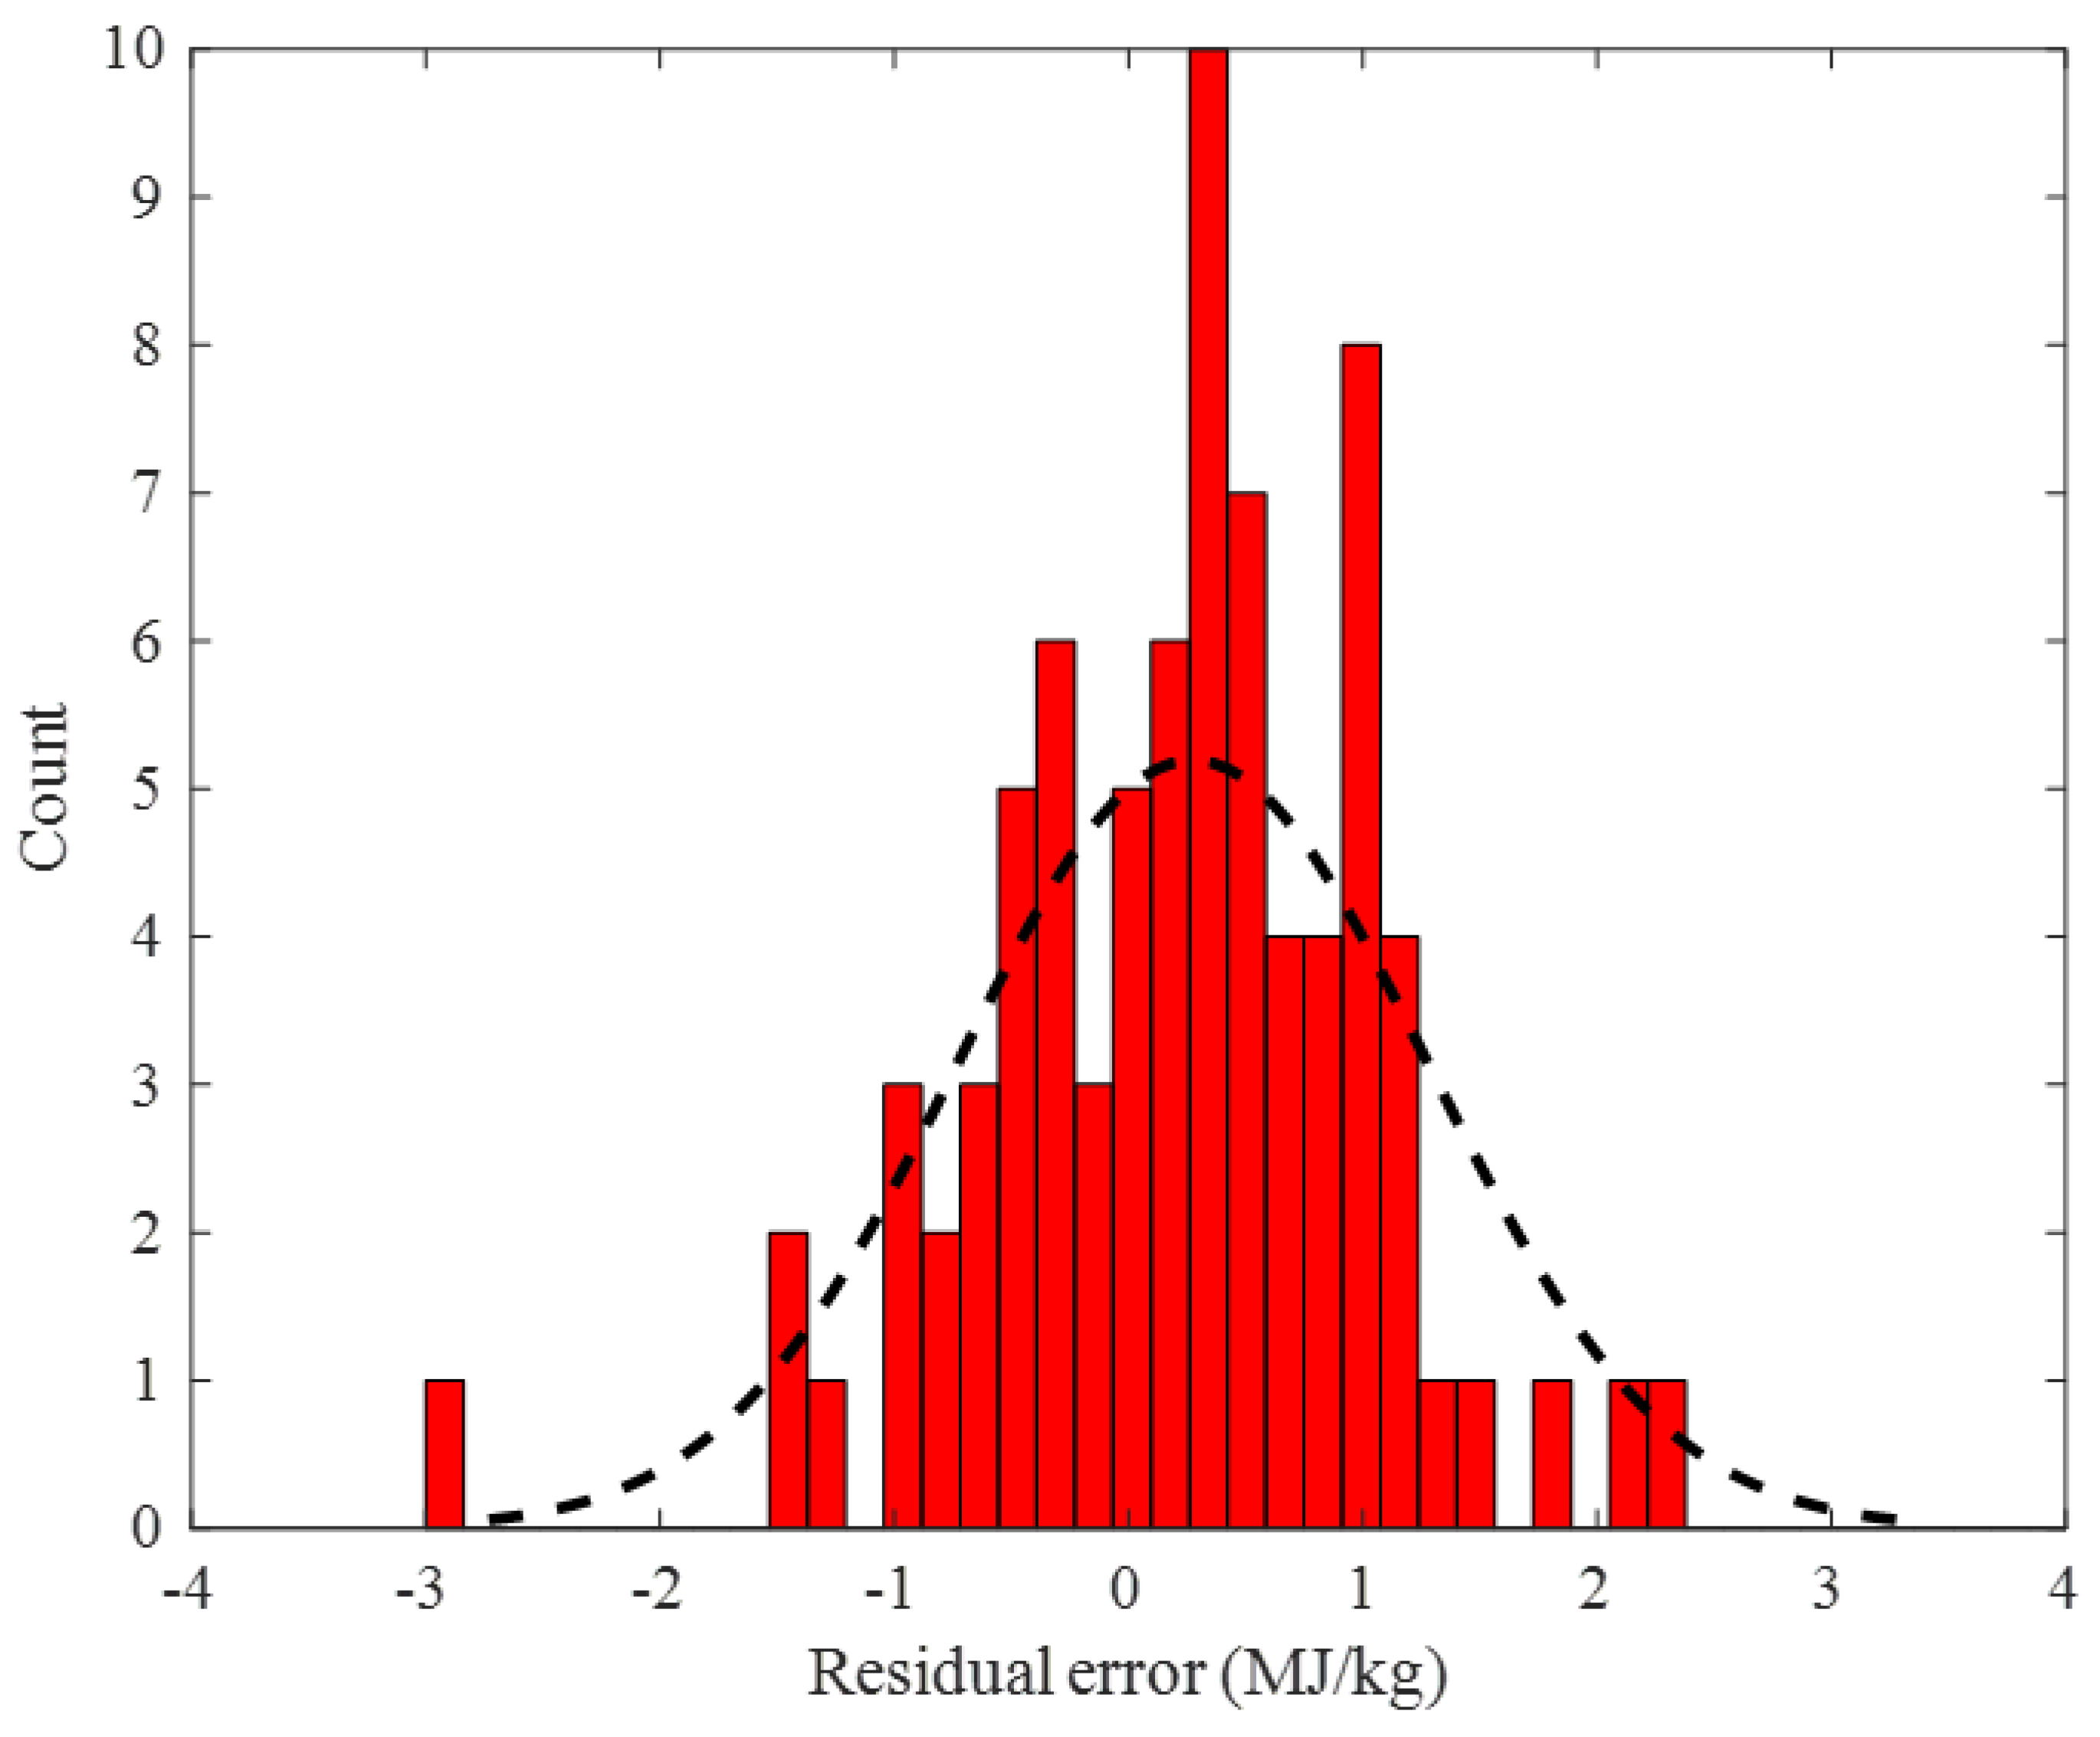
2.2.2. Testing Stage
2.2.3. Overall Data
3. Materials and Methods
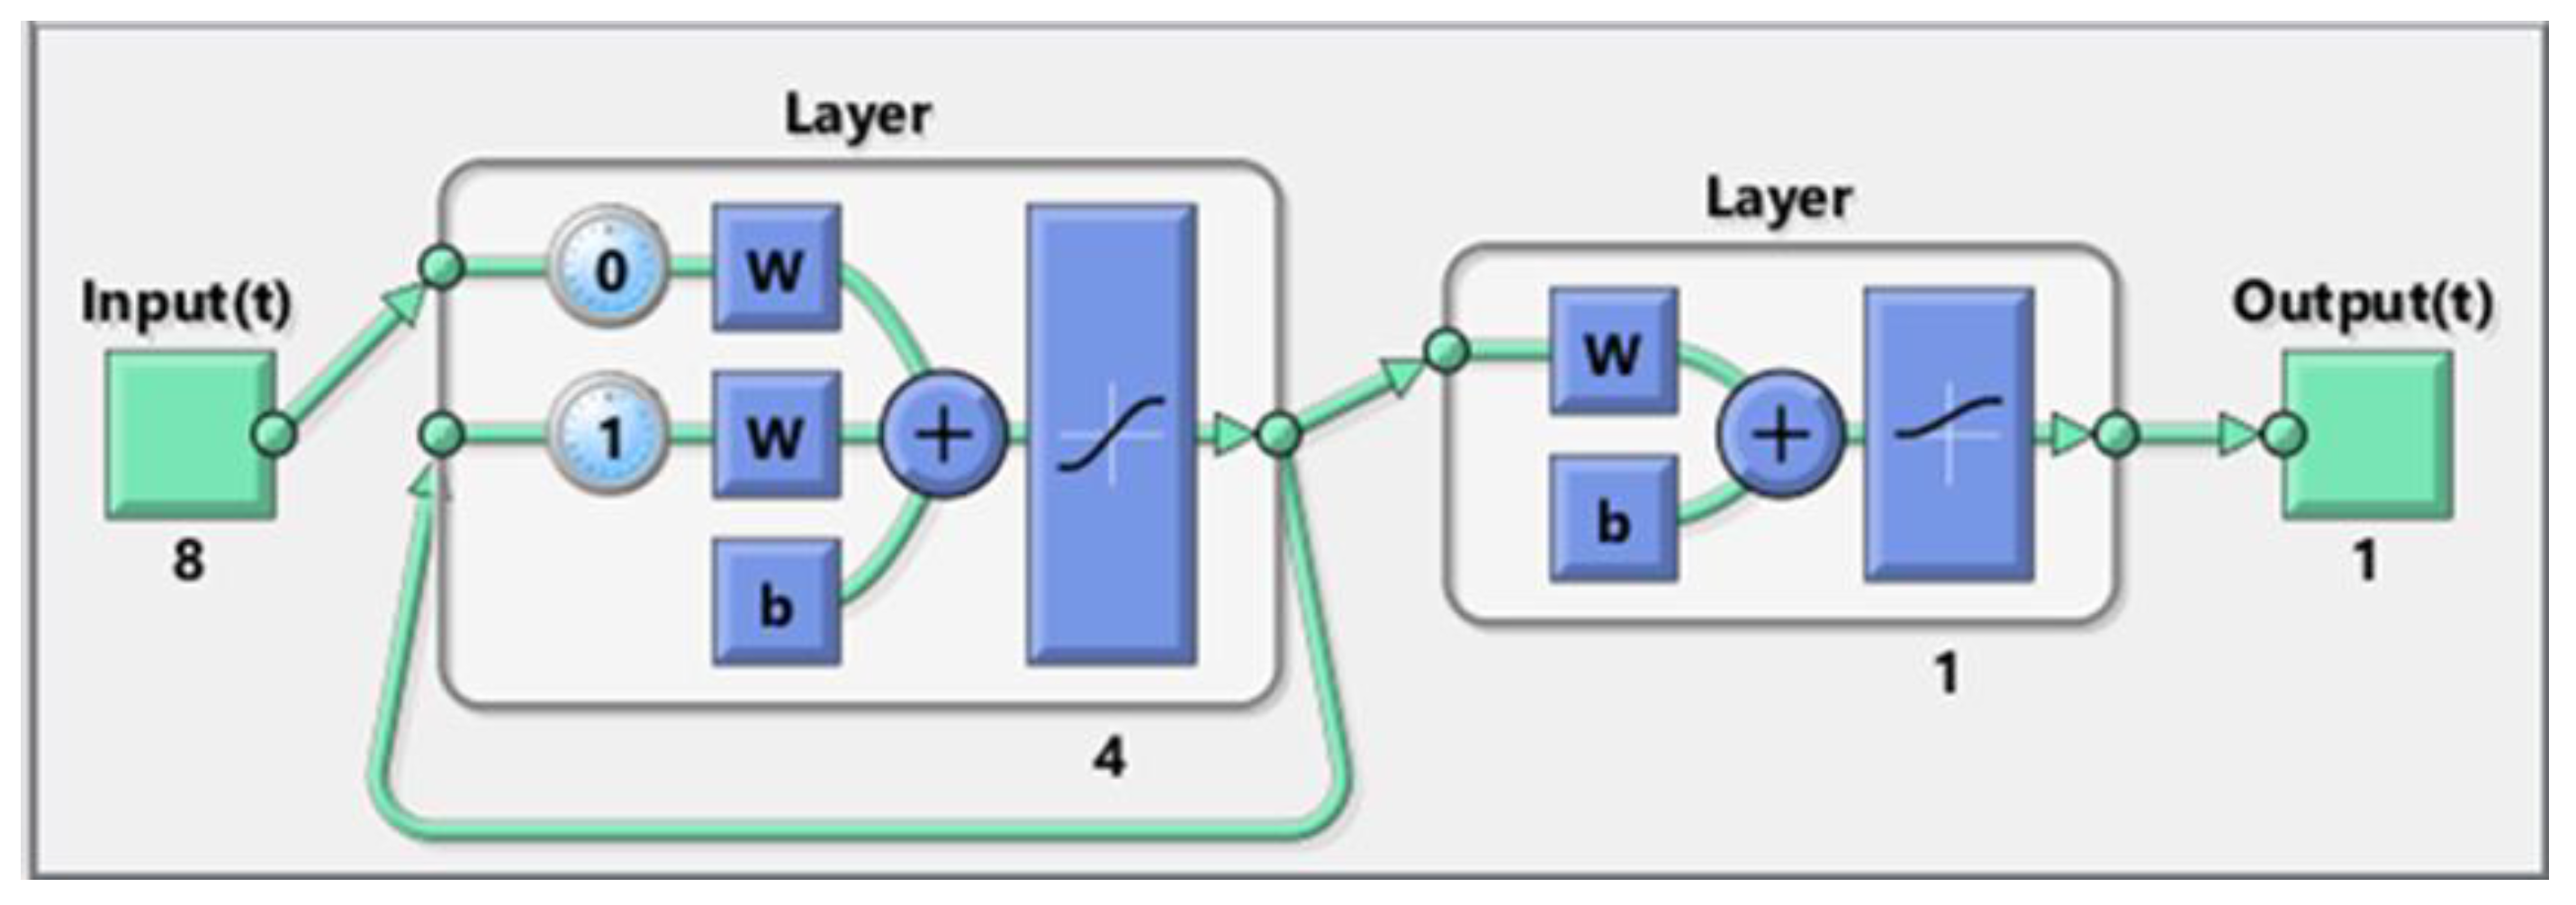
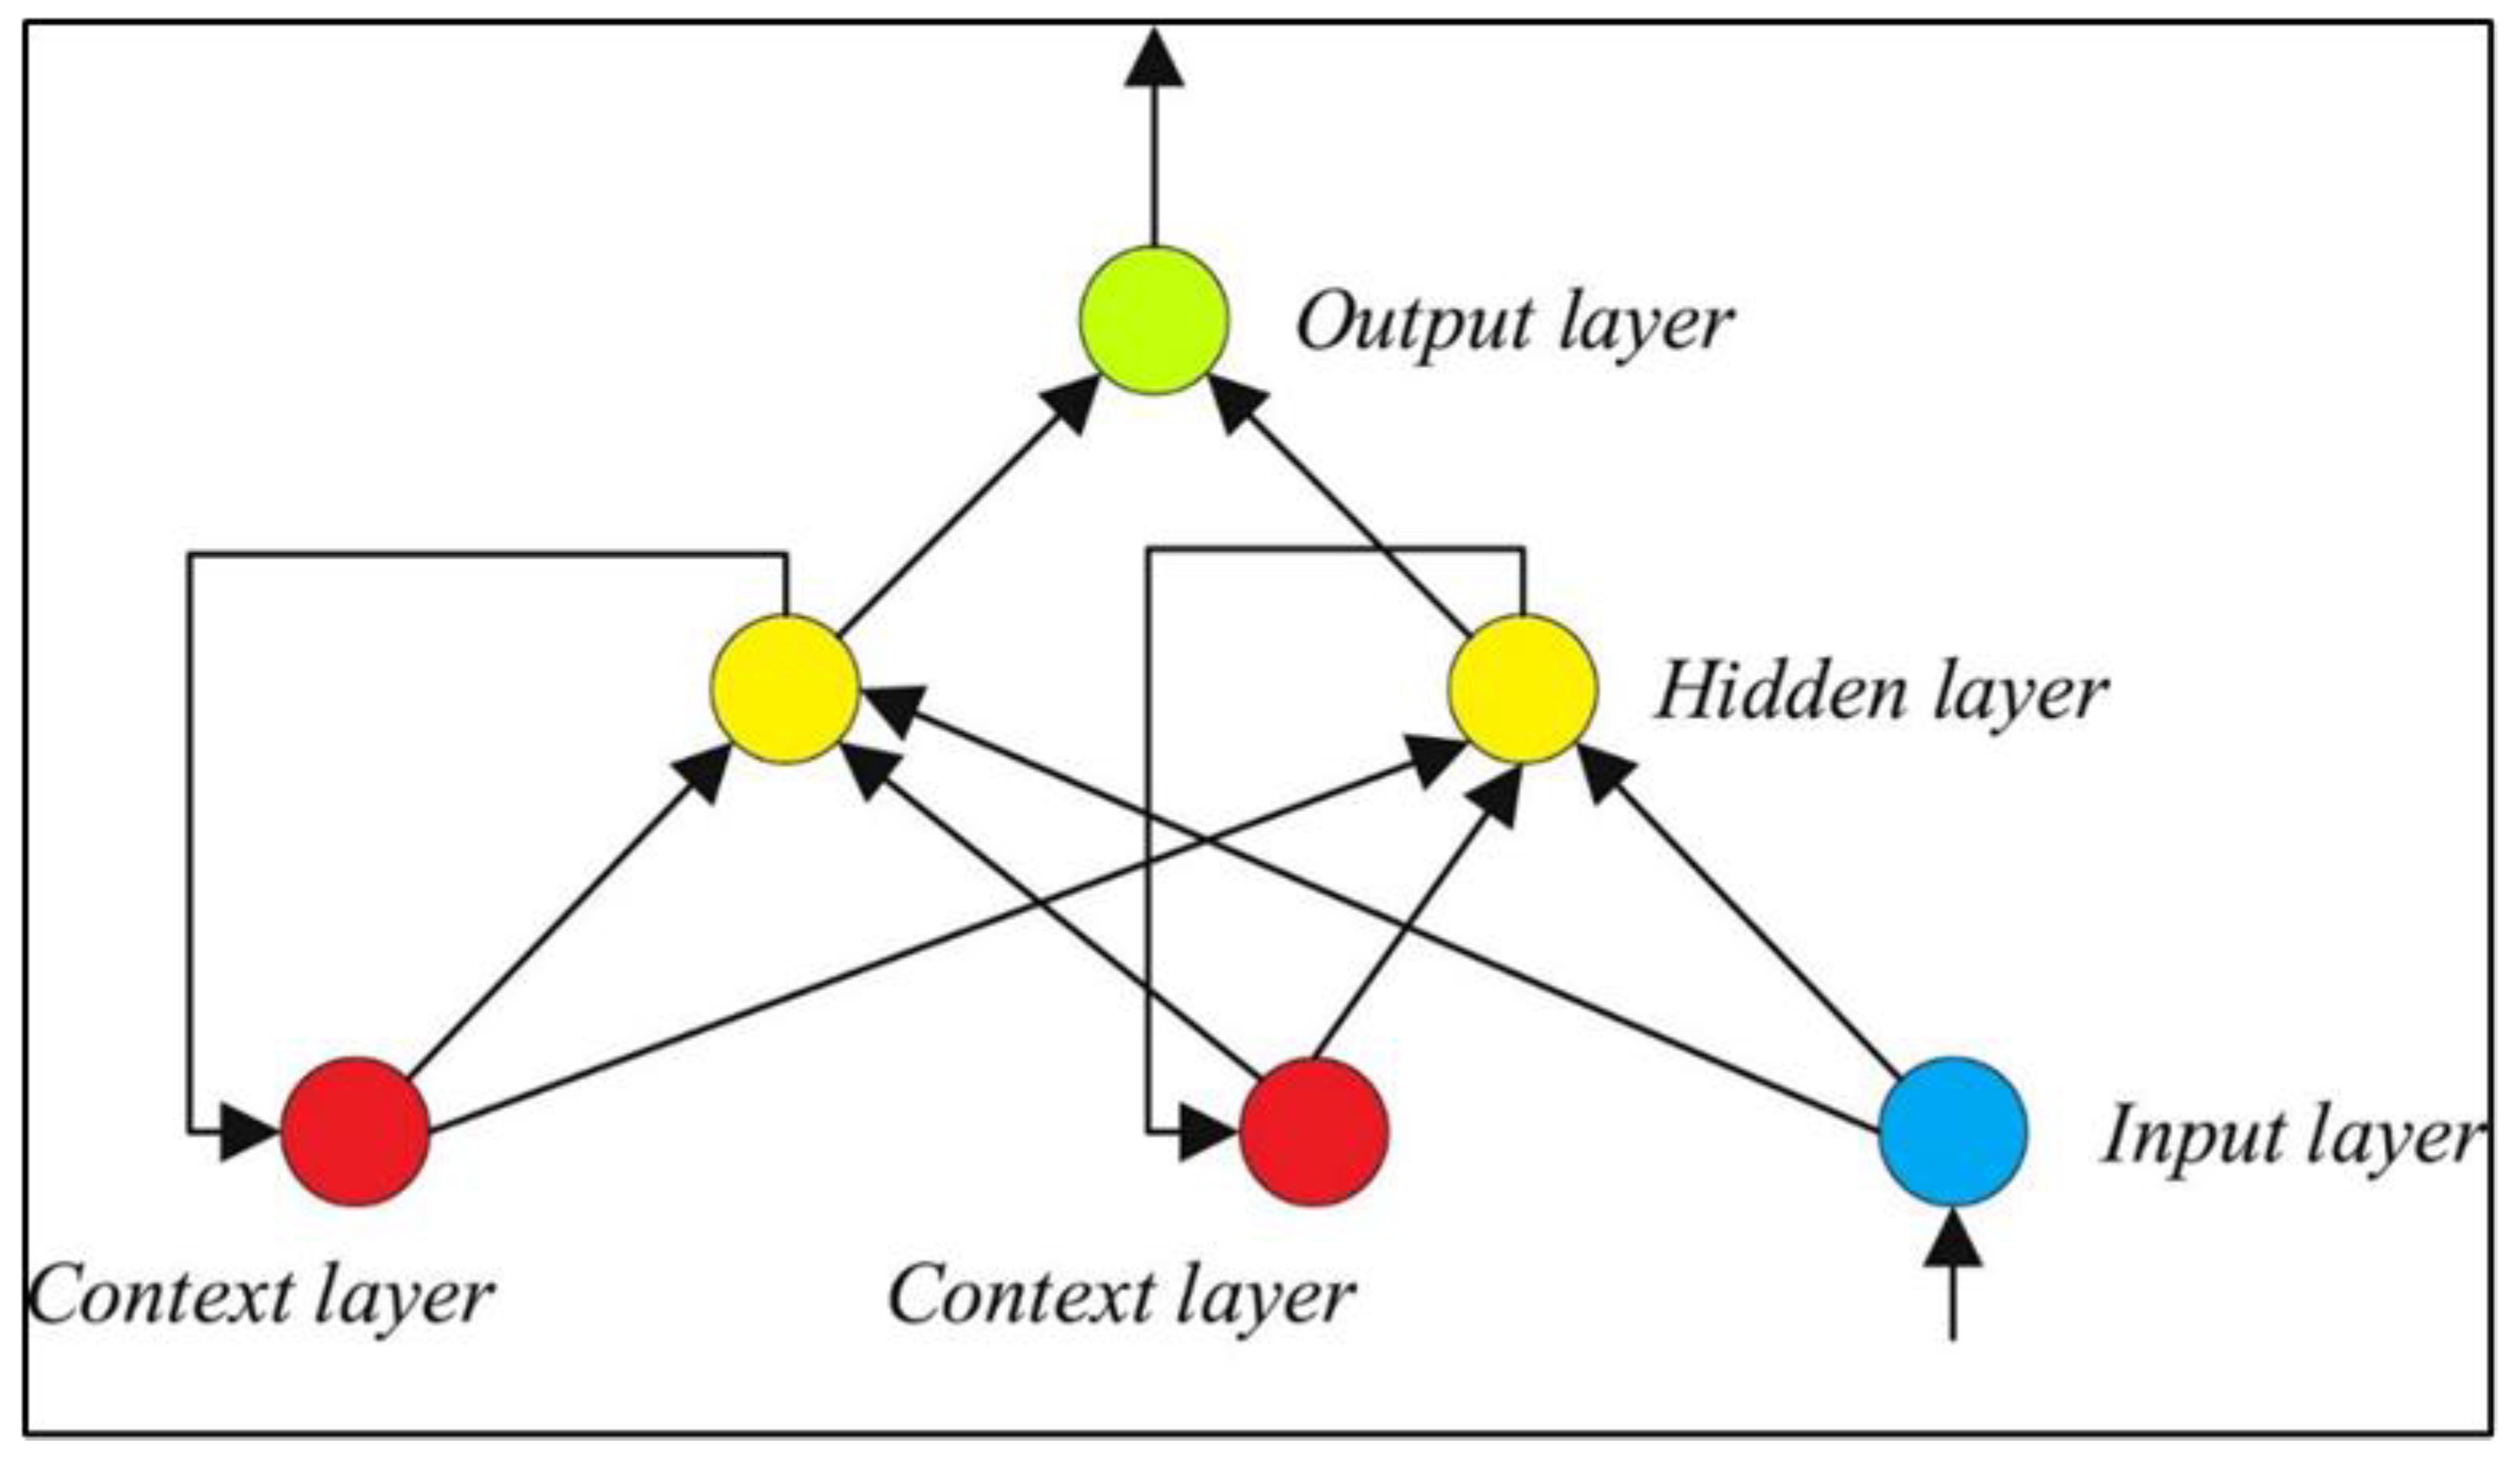
3.1. Elman Neural Network
3.2. Data Collection
3.2.1. Data Distribution in Model Development and Validation Stages
3.2.2. Accuracy Evaluation
4. Conclusions
Author Contributions
Funding
Institutional Review Board Statement
Informed Consent Statement
Data Availability Statement
Acknowledgments
Conflicts of Interest
References
- Liu, L.; Peng, Y.; Zhang, W.; Ma, X. Concept of rapid and controllable combustion for high power-density diesel engines. Energy Convers. Manag. 2023, 276, 116529. [Google Scholar] [CrossRef]
- Liu, L.; Wu, Y.; Wang, Y.; Wu, J.; Fu, S. Exploration of environmentally friendly marine power technology -ammonia/diesel stratified injection. J. Clean. Prod. 2022, 380, 135014. [Google Scholar] [CrossRef]
- De La Peña, L.; Guo, R.; Cao, X.; Ni, X.; Zhang, W. Accelerating the energy transition to achieve carbon neutrality. Resour. Conserv. Recycl. 2022, 177, 105957. [Google Scholar] [CrossRef]
- Aghel, B.; Mohadesi, M.; Sahraei, S.; Shariatifar, M. New heterogeneous process for continuous biodiesel production in microreactors. Can. J. Chem. Eng. 2017, 95, 1280–1287. [Google Scholar] [CrossRef]
- Si, Z.; Yang, M.; Yu, Y.; Ding, T. Photovoltaic power forecast based on satellite images considering effects of solar position. Appl. Energy 2021, 302, 117514. [Google Scholar] [CrossRef]
- Wang, P.; Yu, P.; Huang, L.; Zhang, Y. An integrated technical, economic, and environmental framework for evaluating the rooftop photovoltaic potential of old residential buildings. J. Environ. Manag. 2022, 317, 115296. [Google Scholar] [CrossRef]
- Karimi, M.; Aminzadehsarikhanbeglou, E.; Vaferi, B. Robust intelligent topology for estimation of heat capacity of biochar pyrolysis residues. Meas. J. Int. Meas. Confed. 2021, 183, 109857. [Google Scholar] [CrossRef]
- Aravani, V.P.; Sun, H.; Yang, Z.; Liu, G.; Wang, W.; Anagnostopoulos, G.; Syriopoulos, G.; Charisiou, N.D.; Goula, M.A.; Kornaros, M.; et al. Agricultural and livestock sector’s residues in Greece & China: Comparative qualitative and quantitative characterization for assessing their potential for biogas production. Renew. Sustain. Energy Rev. 2022, 154, 111821. [Google Scholar] [CrossRef]
- Jha, S.; Nanda, S.; Acharya, B.; Dalai, A.K. A Review of Thermochemical Conversion of Waste Biomass to Biofuels. Energies 2022, 15, 6352. [Google Scholar] [CrossRef]
- Vassilev, S.V.; Vassileva, C.G.; Vassilev, V.S. Advantages and disadvantages of composition and properties of biomass in comparison with coal: An overview. Fuel 2015, 158, 330–350. [Google Scholar] [CrossRef]
- Güleç, F.; Şimşek, E.H.; Tanıker Sarı, H. Prediction of Biomass Pyrolysis Mechanisms and Kinetics: Application of the Kalman Filter. Chem. Eng. Technol. 2022, 45, 167–177. [Google Scholar] [CrossRef]
- Dimitriadis, A.; Bezergianni, S. Hydrothermal liquefaction of various biomass and waste feedstocks for biocrude production: A state of the art review. Renew. Sustain. Energy Rev. 2017, 68, 113–125. [Google Scholar] [CrossRef]
- Jakšić, O.; Jakšić, Z.; Guha, K.; Silva, A.G.; Laskar, N.M. Comparing artificial neural network algorithms for prediction of higher heating value for different types of biomass. Soft Comput. 2022, 27, 1–18. [Google Scholar] [CrossRef]
- Fassinou, W.F.; Sako, A.; Fofana, A.; Blaise Koua, K.; Toure, S. Fatty acids composition as a means to estimate the high heating value (HHV) of vegetable oils and biodiesel fuels. Energy 2010, 35, 4949–4954, Corrigendum to Energy 2012, 46, 704. [Google Scholar] [CrossRef]
- Majumder, A.K.; Jain, R.; Banerjee, P.; Barnwal, J.P. Development of a new proximate analysis based correlation to predict calorific value of coal. Fuel 2008, 87, 3077–3081. [Google Scholar] [CrossRef]
- Güleç, F.; Pekaslan, D.; Williams, O.; Lester, E. Predictability of higher heating value of biomass feedstocks via proximate and ultimate analyses—A comprehensive study of artificial neural network applications. Fuel 2022, 320, 123944. [Google Scholar] [CrossRef]
- Demirbaş, A. Calculation of higher heating values of biomass fuels. Fuel 1997, 76, 431–434. [Google Scholar] [CrossRef]
- Noushabadi, A.S.; Dashti, A.; Ahmadijokani, F.; Hu, J.; Mohammadi, A.H. Estimation of higher heating values (HHVs) of biomass fuels based on ultimate analysis using machine learning techniques and improved equation. Renew. Energy 2021, 179, 550–562. [Google Scholar] [CrossRef]
- Qian, C.; Li, Q.; Zhang, Z.; Wang, X.; Hu, J.; Cao, W. Prediction of higher heating values of biochar from proximate and ultimate analysis. Fuel 2020, 265, 116925. [Google Scholar] [CrossRef]
- Telmo, C.; Lousada, J. The explained variation by lignin and extractive contents on higher heating value of wood. Biomass Bioenergy 2011, 35, 1663–1667. [Google Scholar] [CrossRef]
- Demirbas, A. Higher heating values of lignin types from wood and non-wood lignocellulosic biomasses. Energy Sources Part A Recover. Util. Environ. Eff. 2017, 39, 592–598. [Google Scholar] [CrossRef]
- Mateus, M.M.; Bordado, J.M.; Galhano dos Santos, R. Estimation of higher heating value (HHV) of bio-oils from thermochemical liquefaction by linear correlation. Fuel 2021, 302, 121149. [Google Scholar] [CrossRef]
- Roy, R.; Ray, S. Development of a non-linear model for prediction of higher heating value from the proximate composition of lignocellulosic biomass. Energy Sources Part A Recover. Util. Environ. Eff. 2020, 42, 1–14. [Google Scholar] [CrossRef]
- Ghugare, S.B.; Tiwary, S.; Elangovan, V.; Tambe, S.S. Prediction of Higher Heating Value of Solid Biomass Fuels Using Artificial Intelligence Formalisms. Bioenergy Res. 2014, 7, 681–692. [Google Scholar] [CrossRef]
- Cao, Z.; Zhang, L.; Ahmad, A.M.; Alsaadi, F.E.; Alassafi, M.O. Adaptive neural prescribed performance control for switched pure-feedback non-linear systems with input quantization. Assem. Autom. 2022, 42, 869–880. [Google Scholar] [CrossRef]
- Cheng, F.; Liang, H.; Wang, H.; Zong, G.; Xu, N. Adaptive Neural Self-Triggered Bipartite Fault-Tolerant Control for Nonlinear MASs With Dead-Zone Constraints. IEEE Trans. Autom. Sci. Eng. 2022, 19, 1–12. [Google Scholar] [CrossRef]
- Zhang, H.; Zou, Q.; Ju, Y.; Song, C.; Chen, D. Distance-based Support Vector Machine to Predict DNA N6-methyladenine Modification. Curr. Bioinform. 2022, 17, 473–482. [Google Scholar] [CrossRef]
- Li, Z.; Wang, J.; Huang, J.; Ding, M. Development and research of triangle-filter convolution neural network for fuel reloading optimization of block-type HTGRs. Appl. Soft Comput. 2023, 136, 110126. [Google Scholar] [CrossRef]
- Dang, W.; Guo, J.; Liu, M.; Liu, S.; Yang, B.; Yin, L.; Zheng, W. A Semi-Supervised Extreme Learning Machine Algorithm Based on the New Weighted Kernel for Machine Smell. Appl. Sci. 2022, 12, 9213. [Google Scholar] [CrossRef]
- Yin, J.; Sun, Q.; Zhou, J. Sensitivity analysis of the influencing factors of parking lot selection based on BP neural network. J. Comput. Methods Sci. Eng. 2022, 22, 137–145. [Google Scholar] [CrossRef]
- Safdari Shadloo, M.; Rahmat, A.; Li, L.K.B.; Mahian, O.; Alagumalai, A. High-performance computing and machine learning applied in thermal systems analysis. J. Therm. Anal. Calorim. 2021, 145, 1733–1737. [Google Scholar] [CrossRef]
- Yahya, S.I.; Aghel, B. Estimation of kinematic viscosity of biodiesel-diesel blends: Comparison among accuracy of intelligent and empirical paradigms. Renew. Energy 2021, 177, 318–326. [Google Scholar] [CrossRef]
- Hosseinpour, S.; Aghbashlo, M.; Tabatabaei, M.; Mehrpooya, M. Estimation of biomass higher heating value (HHV) based on the proximate analysis by using iterative neural network-adapted partial least squares (INNPLS). Energy 2017, 138, 473–479. [Google Scholar] [CrossRef]
- Akkaya, E. ANFIS based prediction model for biomass heating value using proximate analysis components. Fuel 2016, 180, 687–693. [Google Scholar] [CrossRef]
- Uzun, H.; Yıldız, Z.; Goldfarb, J.L.; Ceylan, S. Improved prediction of higher heating value of biomass using an artificial neural network model based on proximate analysis. Bioresour. Technol. 2017, 234, 122–130. [Google Scholar] [CrossRef]
- Pattanayak, S.; Loha, C.; Hauchhum, L.; Sailo, L. Application of MLP-ANN models for estimating the higher heating value of bamboo biomass. Biomass Convers. Biorefinery 2021, 11, 2499–2508. [Google Scholar] [CrossRef]
- Aladejare, A.E.; Onifade, M.; Lawal, A.I. Application of metaheuristic based artificial neural network and multilinear regression for the prediction of higher heating values of fuels. Int. J. Coal Prep. Util. 2022, 42, 1830–1851. [Google Scholar] [CrossRef]
- Li, P.; Yang, M.; Wu, Q. Confidence interval based distributionally robust real-time economic dispatch approach considering wind power accommodation risk. IEEE Trans. Sustain. Energy 2021, 12, 58–69. [Google Scholar] [CrossRef]
- Xu, X.; Wang, C.; Zhou, P. GVRP considered oil-gas recovery in refined oil distribution: From an environmental perspective. Int. J. Prod. Econ. 2021, 235, 108078. [Google Scholar] [CrossRef]
- Yang, Y.; Wang, P.; Gao, X.; Gao, H.; Qi, Z. Research and application of RBF neural network based on modified Levenberg-Marquardt. J. Comput. Methods Sci. Eng. 2022, 22, 1597–1619. [Google Scholar] [CrossRef]
- The MathWorks Inc. MATLAB version: R2019b, The MathWorks Inc. 2019. Available online: https://www.mathworks.com (accessed on 11 March 2023).
- Singh, K.V.; Bansal, H.O.; Singh, D. Fuzzy logic and Elman neural network tuned energy management strategies for a power-split HEVs. Energy 2021, 225, 120152. [Google Scholar] [CrossRef]
- Hosseini, S.; Vaferi, B. Determination of methanol loss due to vaporization in gas hydrate inhibition process using intelligent connectionist paradigms. Arab. J. Sci. Eng. 2022, 47, 5811–5819. [Google Scholar] [CrossRef]
- Zheng, Y.; Safdari Shadloo, M.; Nasiri, H.; Maleki, A.; Karimipour, A.; Tlili, I. Prediction of viscosity of biodiesel blends using various artificial model and comparison with empirical correlations. Renew. Energy 2020, 153, 1296–1306. [Google Scholar] [CrossRef]


| Model Name | Topology | Dataset | AARD% | MAE | RAE% | MSE | R |
|---|---|---|---|---|---|---|---|
| ENN–SCG 1 | 8-2-1 | Training collection | 4.17 | 0.76 | 51.61 | 1.09 | 0.83021 |
| Testing collection | 4.52 | 0.83 | 54.99 | 1.22 | 0.82787 | ||
| The whole data | 4.23 | 0.77 | 52.13 | 1.11 | 0.82914 | ||
| ENN–SCG 2 | 8-5-1 | Training collection | 4.21 | 0.77 | 51.16 | 1.06 | 0.84745 |
| Testing collection | 4.63 | 0.85 | 64.51 | 1.20 | 0.77340 | ||
| The whole data | 4.28 | 0.78 | 52.84 | 1.08 | 0.83733 | ||
| ENN–LM | 8-4-1 | Training collection | 3.58 | 0.66 | 43.54 | 0.94 | 0.88335 |
| Testing collection | 3.94 | 0.73 | 56.28 | 1.03 | 0.82255 | ||
| The whole data | 3.63 | 0.67 | 45.19 | 0.96 | 0.87566 |
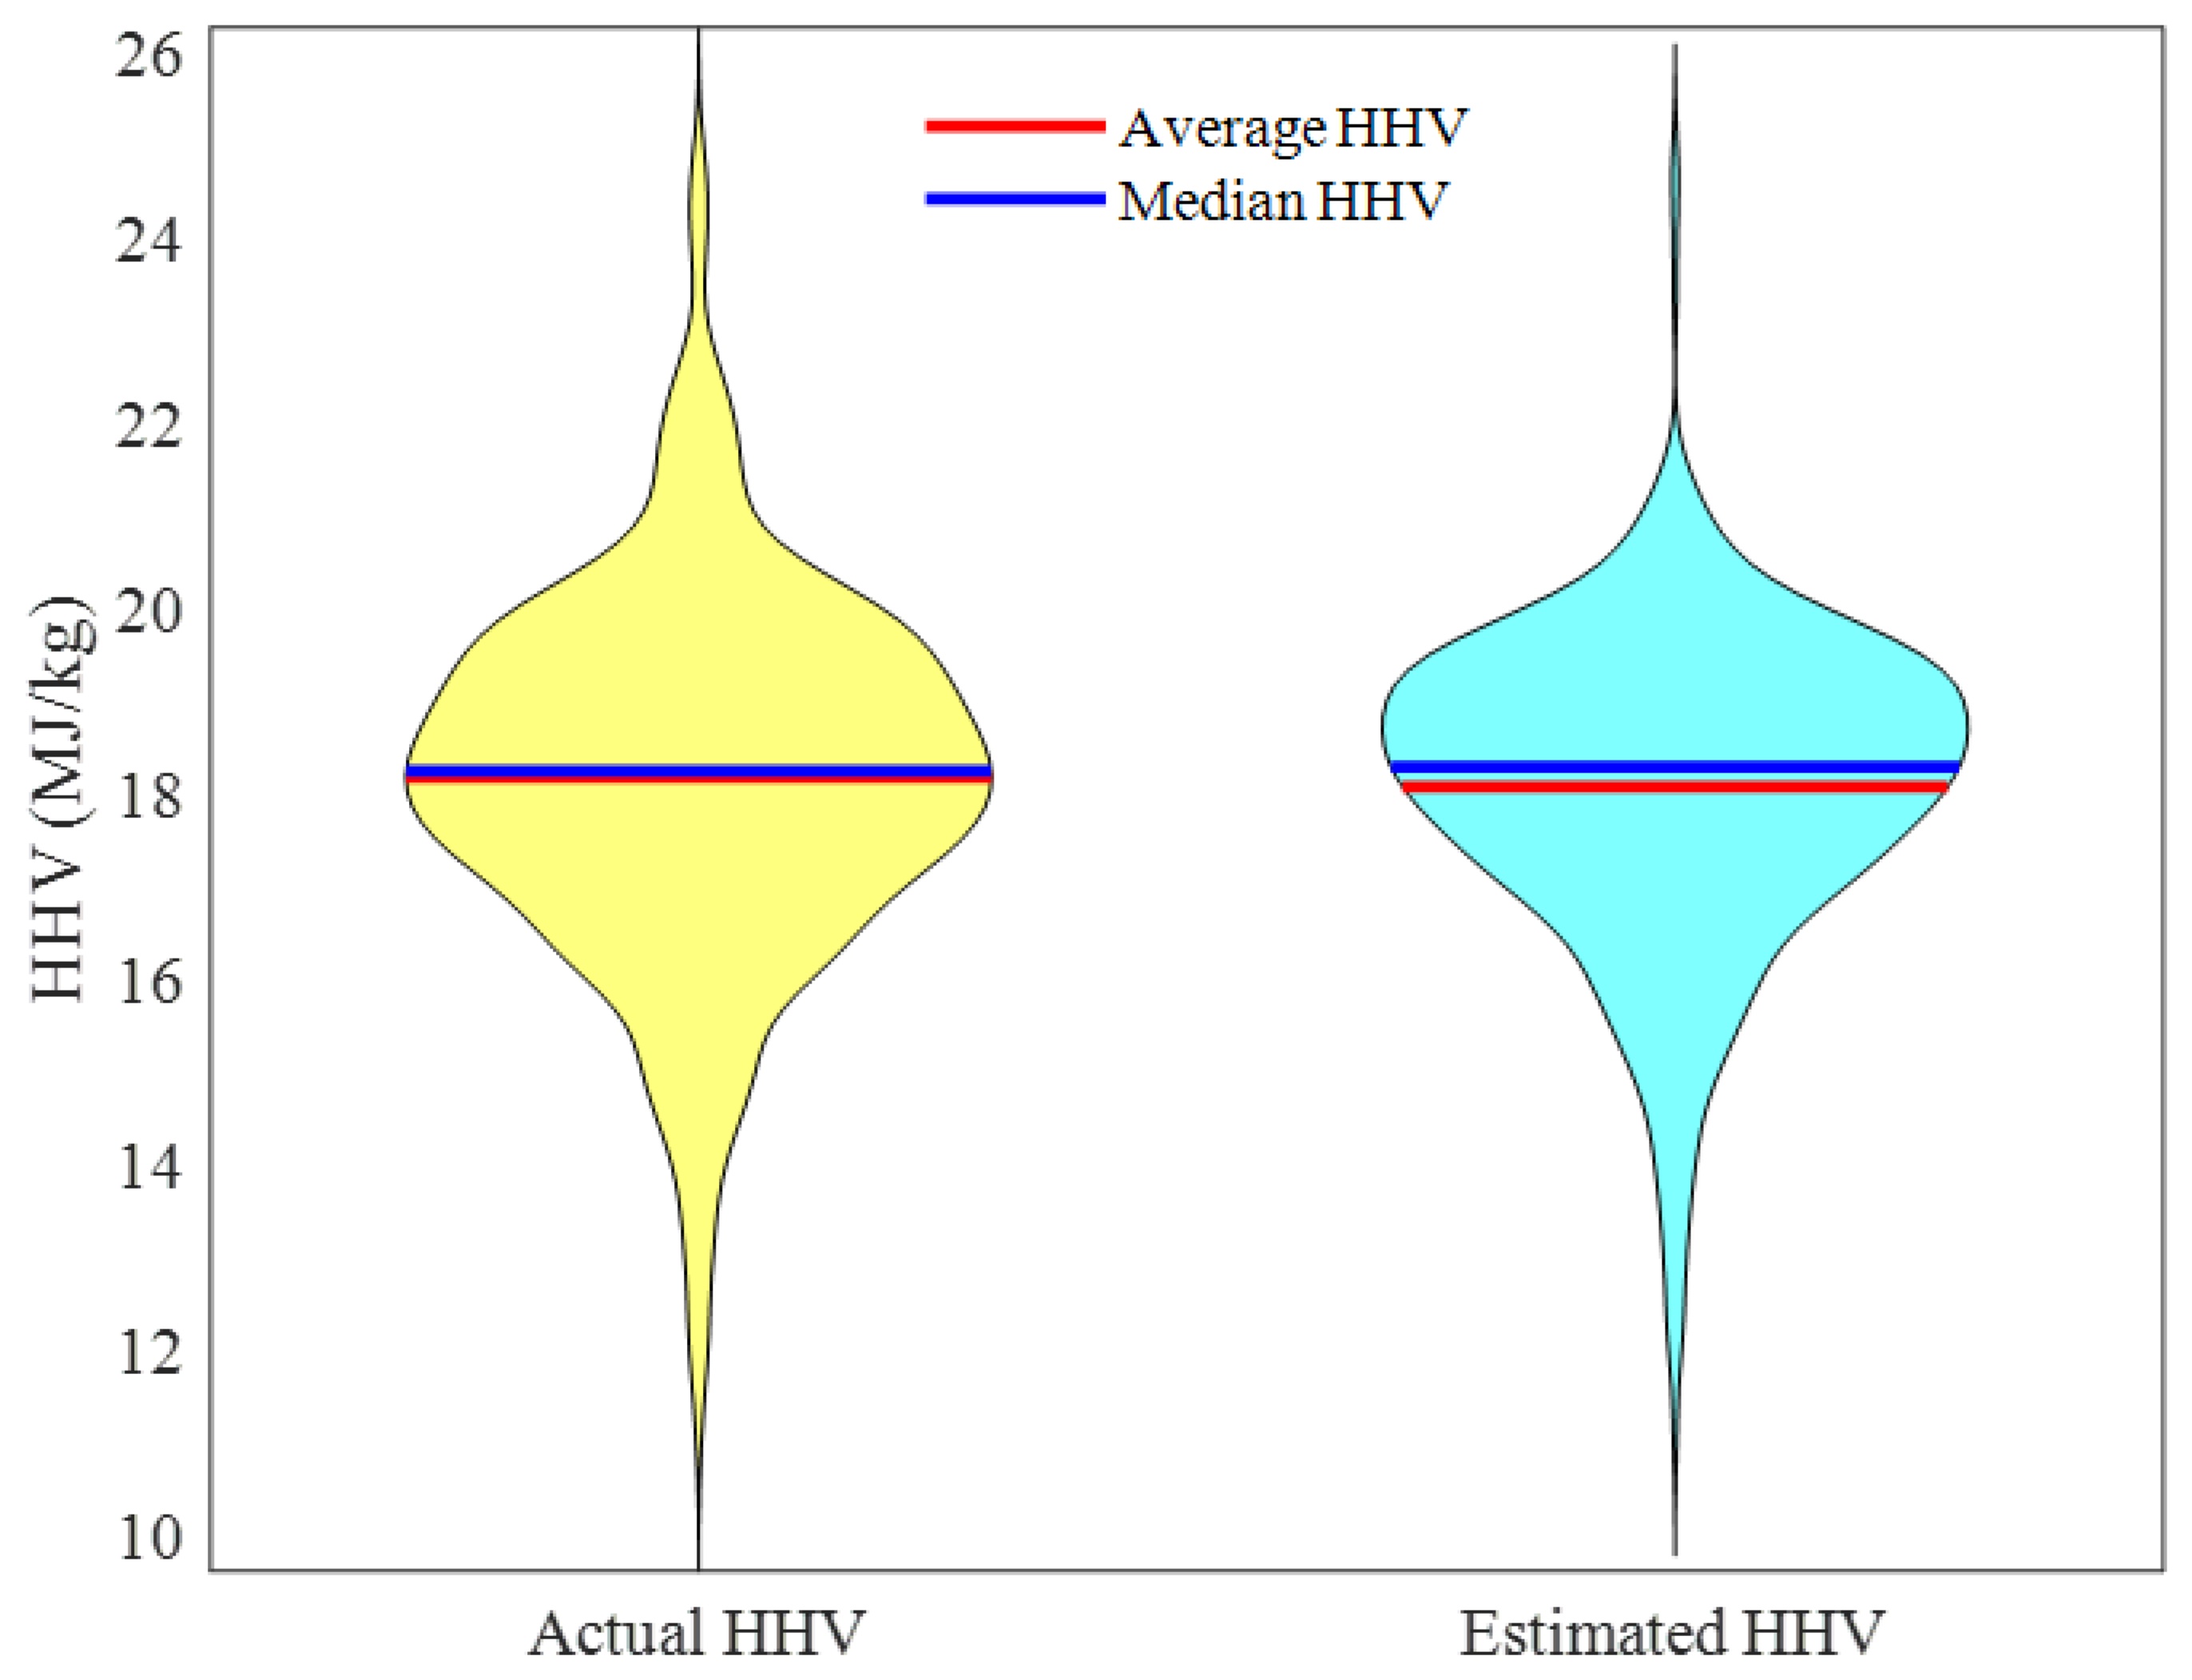
| Index | Formula | Actual HHV | Estimated HHV |
|---|---|---|---|
| Median HHV | 18.28 | 18.32 | |
| Average HHV | 18.21 | 18.11 |
| Variable (Unit) | Analysis Type | Average | Standard Deviation | Minimum | Maximum | Observations |
|---|---|---|---|---|---|---|
| Fixed carbon (wt%) | Proximate | 17.49 | 6.71 | 0.00 | 59.30 | 532 |
| Volatile matter (wt%) | 75.30 | 8.91 | 7.70 | 92.70 | 532 | |
| Ash (wt%) | 6.21 | 6.98 | 0.10 | 67.10 | 532 | |
| C (wt%) | Ultimate | 45.88 | 5.67 | 14.61 | 97.18 | 532 |
| H (wt%) | 5.88 | 0.99 | 0.41 | 11.55 | 532 | |
| O (wt%) | 43.26 | 7.16 | 0.00 | 81.80 | 532 | |
| N (wt%) | 1.04 | 1.07 | 0.00 | 6.75 | 532 | |
| S (wt%) | 0.19 | 0.34 | 0.00 | 4.90 | 532 | |
| HHV (MJ/kg) | - | 18.21 | 1.97 | 11.15 | 24.80 | 532 |
Disclaimer/Publisher’s Note: The statements, opinions and data contained in all publications are solely those of the individual author(s) and contributor(s) and not of MDPI and/or the editor(s). MDPI and/or the editor(s) disclaim responsibility for any injury to people or property resulting from any ideas, methods, instructions or products referred to in the content. |
© 2023 by the authors. Licensee MDPI, Basel, Switzerland. This article is an open access article distributed under the terms and conditions of the Creative Commons Attribution (CC BY) license (https://creativecommons.org/licenses/by/4.0/).
Share and Cite
Aghel, B.; Yahya, S.I.; Rezaei, A.; Alobaid, F. A Dynamic Recurrent Neural Network for Predicting Higher Heating Value of Biomass. Int. J. Mol. Sci. 2023, 24, 5780. https://doi.org/10.3390/ijms24065780
Aghel B, Yahya SI, Rezaei A, Alobaid F. A Dynamic Recurrent Neural Network for Predicting Higher Heating Value of Biomass. International Journal of Molecular Sciences. 2023; 24(6):5780. https://doi.org/10.3390/ijms24065780
Chicago/Turabian StyleAghel, Babak, Salah I. Yahya, Abbas Rezaei, and Falah Alobaid. 2023. "A Dynamic Recurrent Neural Network for Predicting Higher Heating Value of Biomass" International Journal of Molecular Sciences 24, no. 6: 5780. https://doi.org/10.3390/ijms24065780
APA StyleAghel, B., Yahya, S. I., Rezaei, A., & Alobaid, F. (2023). A Dynamic Recurrent Neural Network for Predicting Higher Heating Value of Biomass. International Journal of Molecular Sciences, 24(6), 5780. https://doi.org/10.3390/ijms24065780