Article

Characteristics of a Rollable Dielectric Barrier Discharge Plasma and Its Effects on Spinach-Seed Germination

1
Plasma Bioscience Research Center (PBRC), Kwangwoon University, Seoul 01897, Republic of Korea
2
Electrical and Biological Physics Department, Kwangwoon University, Seoul 01897, Republic of Korea
3
Institute of Plasma Technology, Korea Institute of Fusion Energy, Gunsan 54004, Republic of Korea
*
Author to whom correspondence should be addressed.
Int. J. Mol. Sci. 2023, 24(5), 4638; https://doi.org/10.3390/ijms24054638
Submission received: 18 January 2023 / Revised: 18 February 2023 / Accepted: 24 February 2023 / Published: 27 February 2023
(This article belongs to the Special Issue Bio-Plasma for Molecular Science)

Abstract

:
We investigated the characteristics of a rollable dielectric barrier discharge (RDBD) and evaluate its effects on seed germination rate and water uptake. The RDBD source was composed of a polyimide substrate and copper electrode, and it was mounted in a rolled-up structure for omnidirectional and uniform treatment of seeds with flowing synthetic air gas. The rotational and vibrational temperatures were measured to be 342 K and 2860 K, respectively, using optical emission spectroscopy. The chemical species analysis via Fourier-transform infrared spectroscopy and 0D chemical simulation showed that O3 production was dominant and NOx production was restrained at the given temperatures. The water uptake and germination rate of spinach seeds by 5 min treatment of RDBD was increased by 10% and 15%, respectively, and the standard error of germination was reduced by 4% in comparison with the controls. RDBD enables an important step forward in non-thermal atmospheric-pressure plasma agriculture for omnidirectional seed treatment.

1. Introduction

Non-thermal atmospheric-pressure plasma (NAP) is an emerging technology with numerous applications in a variety of fields, including semiconductor manufacturing, medicine, agriculture, and environmental decontamination [1,2,3,4,5,6]. NAP contains a large number of reactive oxygen species (ROS) and reactive nitrogen species (RNS), which react with contamination particles, cells, bacteria, tumors, and metal surfaces [7,8,9]. Previously, NAP was widely used in the polymer and electronic industries for surface modification and the functionalization of various polymers. However, in recent years, the applications of NAP have expanded to include the treatment of biological matter, such as food, cancers, and viral diseases [10,11,12]. Plasma jets, surface dielectric barrier discharge (DBD), pin-to-plate-type plasma, and other plasma devices were subsequently developed based on the demand [13,14,15,16,17]. The development of surface DBD devices has progressed owing to their large surface area treatment for wound healing and seed treatments at low temperatures. The general design of DBDs restricts their use on straight surfaces because the curvature of the sample must also be considered. Furthermore, the size and shape of the seeds vary based on the plant species, which makes it difficult to provide uniform treatment using conventional devices. In this case, a flexible DBD device may offer an alternative; however, a device that can effectively overcome this difficulty has not yet been proposed. Recently, a flexible DBD was developed for sterilization purposes [18,19,20]. Kim et al., developed this inkjet-printed flexible DBD source, which inhibited the growth of fungi in blueberries [18]. Guo et al., studied the inactivation of a virus on film and the sterilization of natural bacteria using a flexible DBD source [19]. In particular, plasma treatment could remove the cuticle and epidermis layer on seeds, which improves water absorbance into the inner layers [21]. These flexible DBD devices may provide an alternative for overcoming the abovementioned limitations; however, to our knowledge, there are no existing reports on an omnidirectional design. Herein, we present the design of a novel rollable dielectric barrier discharge (RDBD) device that includes 200 micro-discharge cells for a uniform and omnidirectional plasma seed treatment. We investigated the rotational and vibrational temperatures using optical emission spectroscopy and performed Fourier-transform infrared (FTIR) spectroscopy and 0D (zero-dimension) chemical simulation analysis of plasma in the RDBD device. Furthermore, the proposed RDBD device was tested to assess the effect on the germination rate and water uptake of spinach seeds.

2. Results and Discussions

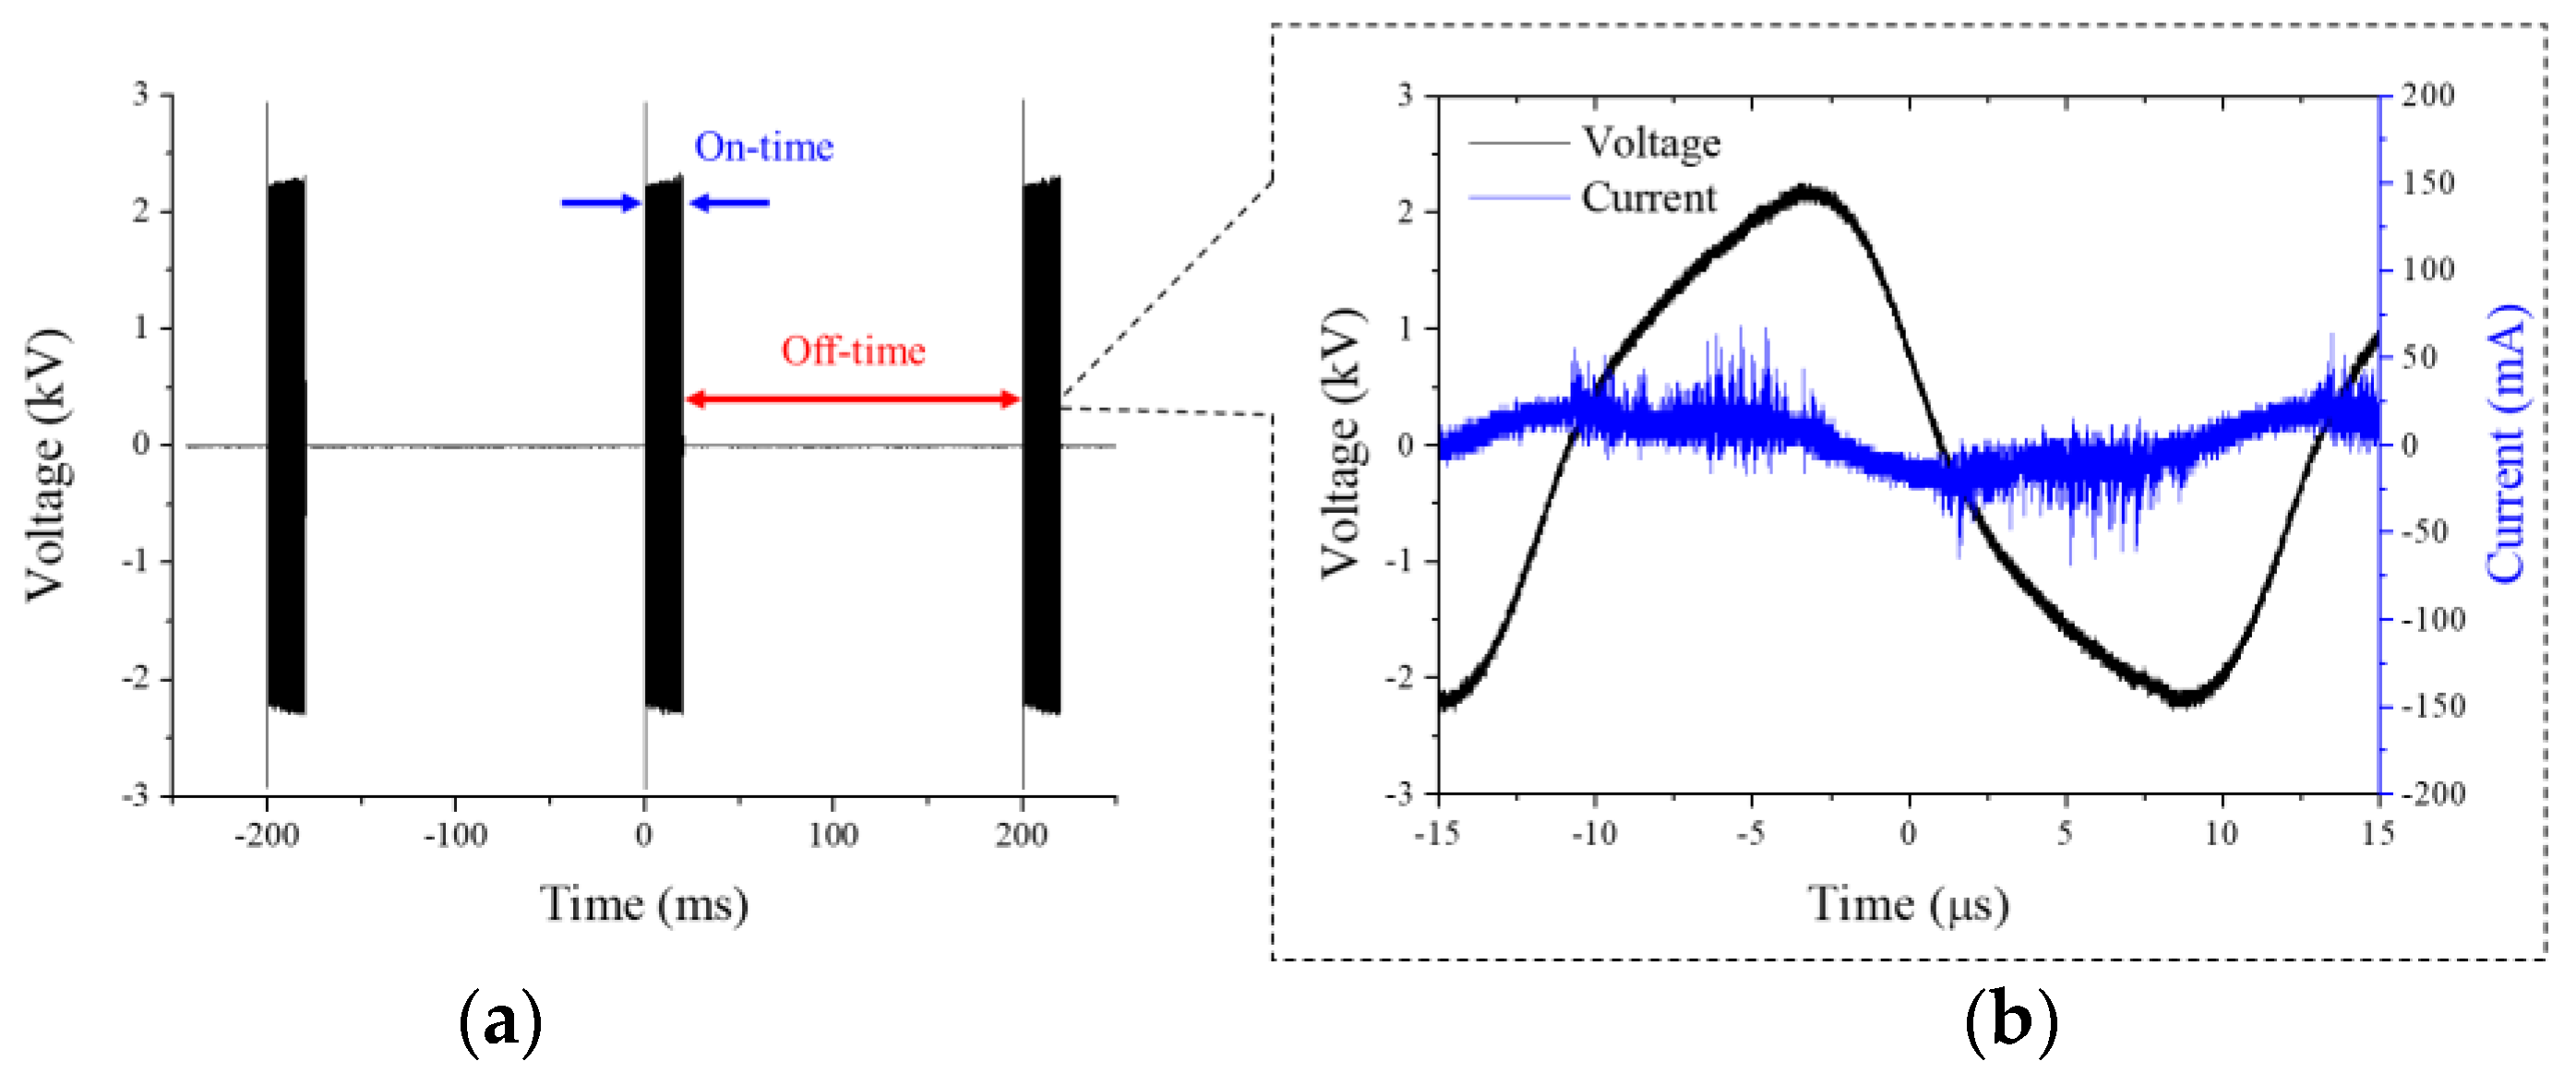
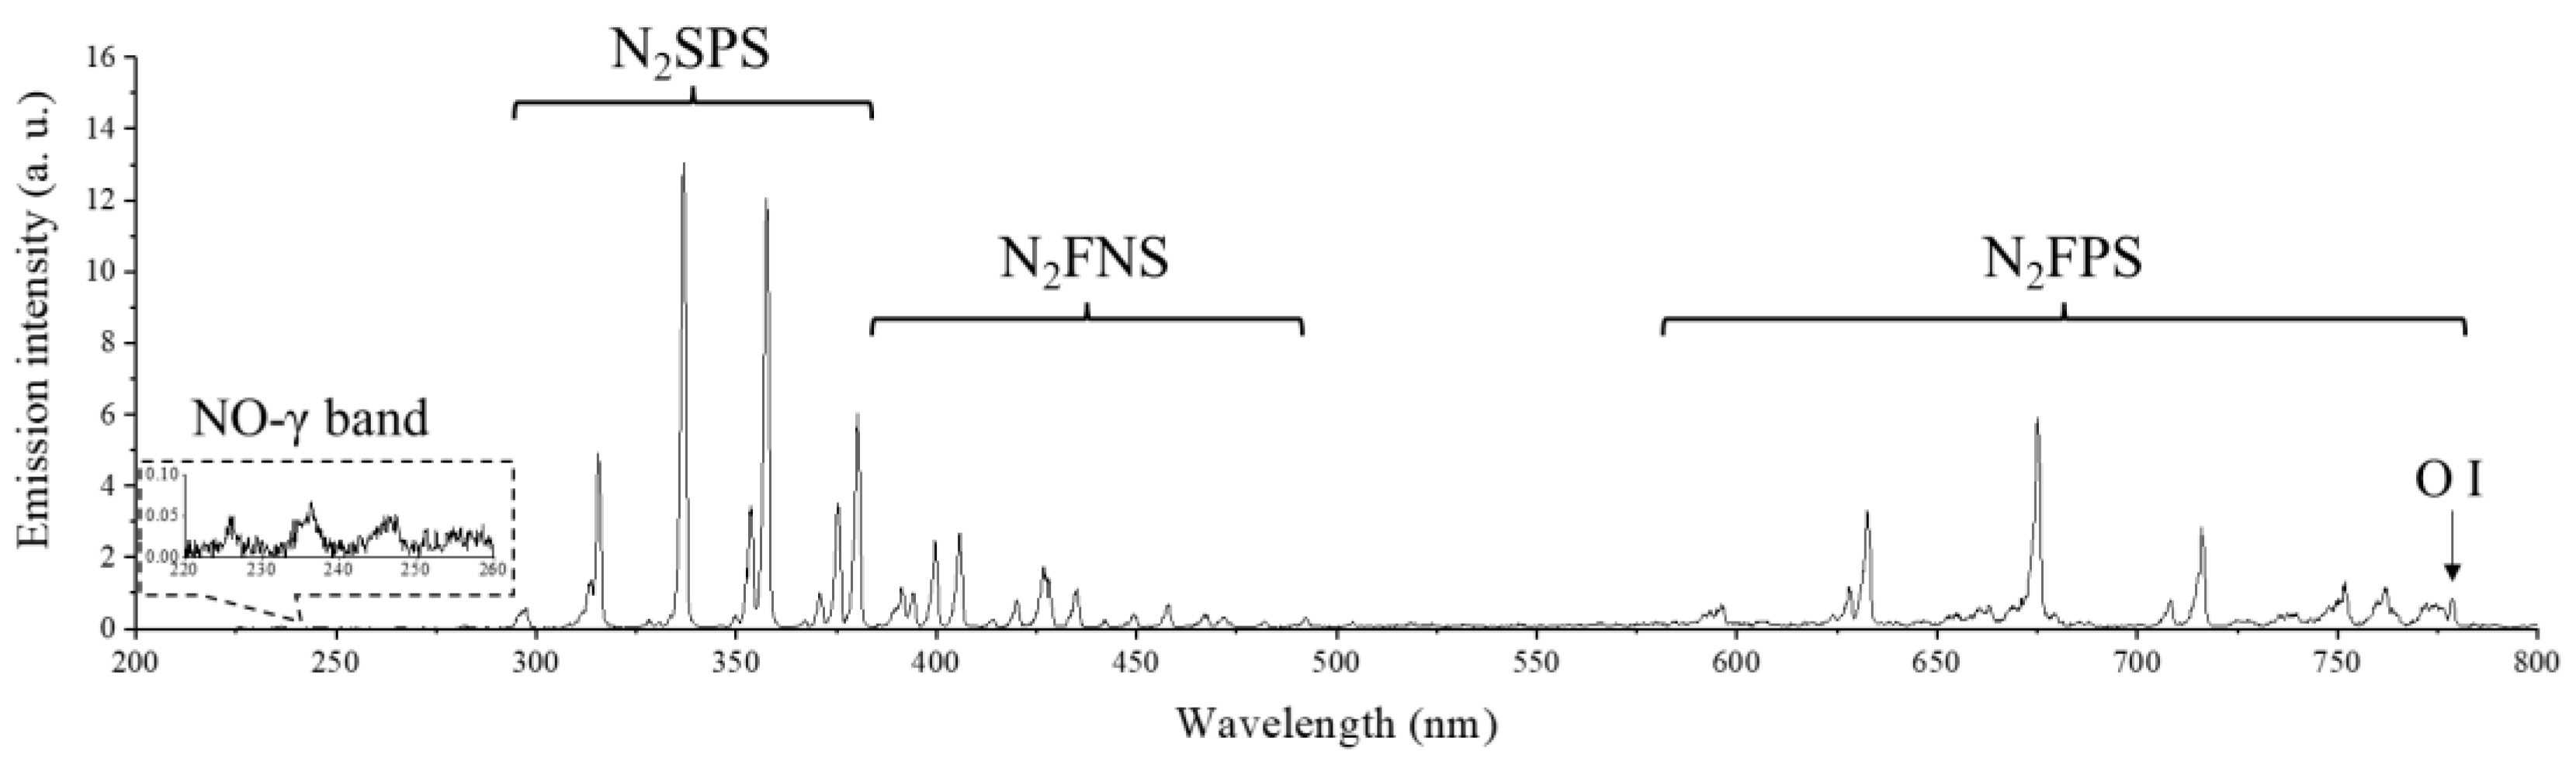
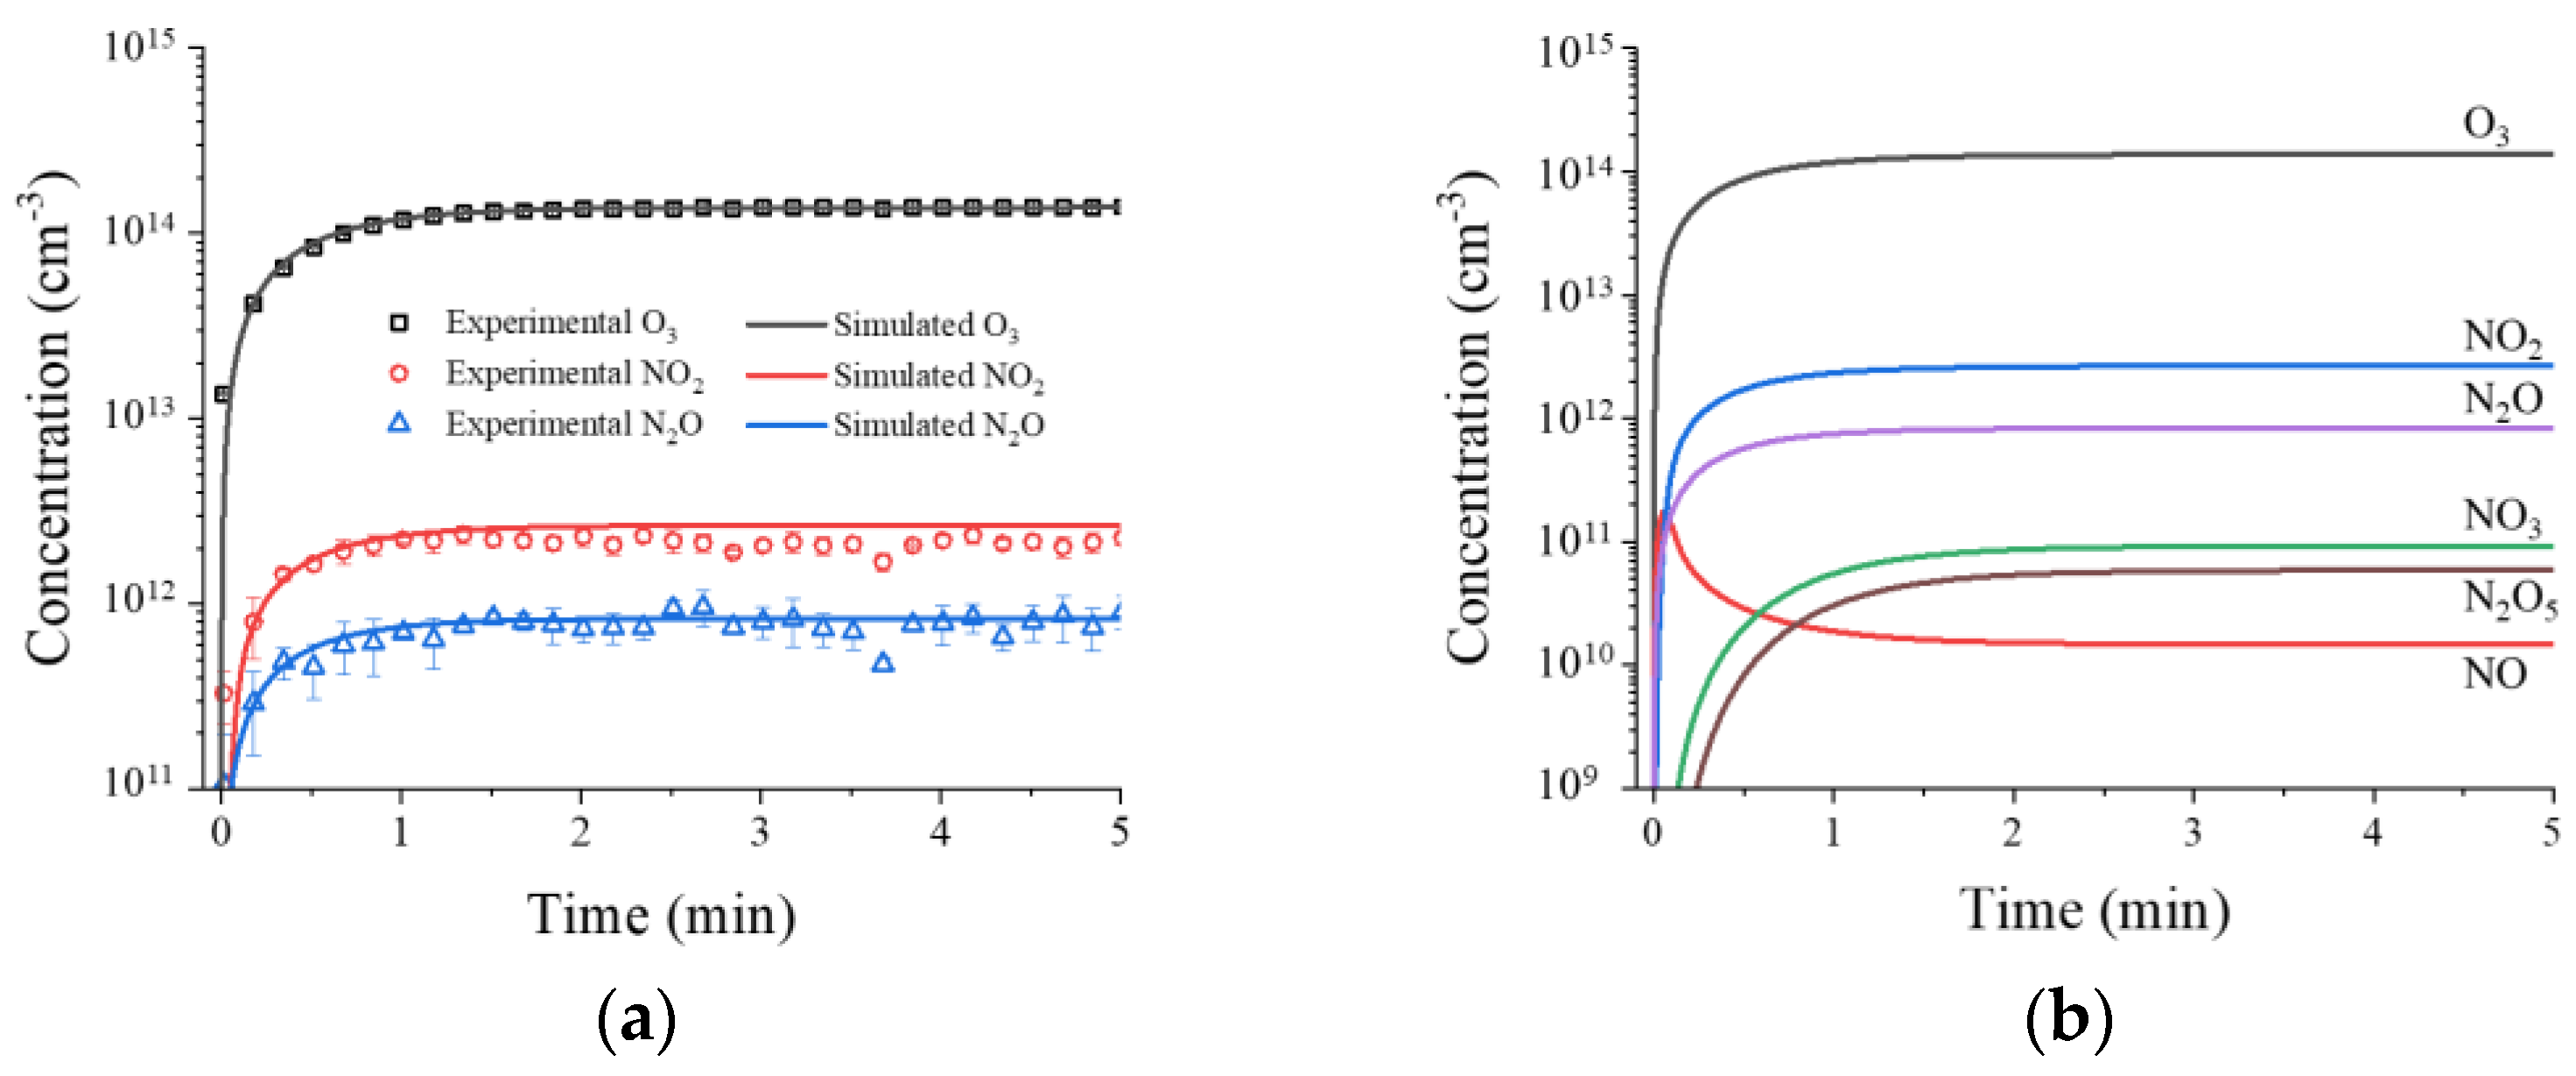
2.1. Physical and Chemical Properties of RDBD

The electrical characteristics of RDBD are shown in Figure 1. The duty ratio of the applied voltage with a sinusoidal wave on-time of 20 ms and an off-time of 180 ms at 0 V are shown in Figure 1a. A large number of discharge current peaks appear during the voltage period because the discharges of each of the 200 discharge cells in the RDBD device varied, as shown in Figure 1b. The root mean square voltage and discharge current were measured to be 1.8 kV and 2 mA, respectively. The electrical energy and dissipated power based on the duty ratio were measured to be 0.2 J and 2 mW, respectively.
The optical emission spectrum (OES) of the RDBD is depicted in Figure 2. The discharge emissions uniformly occurred at the discharge cells, and the OES results show that RDBD primarily emits the nitrogen band spectra, such as the N2 s positive system (N2SPS, 300–380 nm), N2 first negative system (N2FNS, 380–500 nm), and N2 first positive system (N2FPS, 500–800 nm). Additionally, the NO-γ band (220–260 nm) and atomic oxygen (778 nm) were observed in the OES. The dominant N2-band spectrum shows that RDBD was mainly discharged by nitrogen molecules.
The rotational and vibrational temperatures were calculated via the spectrum-fitting method using the experimental spectrum of nitrogen molecules (337 nm), which was obtained from a fitted Boltzmann plot [22,23]. The rotational and vibrational temperatures were measured to be 342 K and 2860 K, respectively (see Supplementary Figure S1). The gas FTIR and 0D chemical simulation results are shown in Figure 3. In the FTIR spectroscopy results, O3, NO2, and N2O were increased for 1 min after the RDBD operation and were then kept stable. Their concentrations were 1.36 × 10 14   cm 3 , 2.15 × 10 12   cm 3 , and 8.25 × 10 11   cm 3 , respectively, as shown in Figure 3a. Figure 3a,b show the chemical simulation results with the FTIR spectroscopy results and the chemical species in the 0D chemical simulation, respectively.
The crucial NO production was generated by reaction R6 in Table 1, which originated from vibrationally excited N2 [24]. However, owing to the low vibrational temperature of 2860 K, the NO concentration was simulated to a maximum of 1.66 × 10 11   cm 3 at 3 s and immediately decreased to 1.48 × 10 10   cm 3 . The sharp decrease in NO occurred as the vibrational temperature approached its maximum at time, and the NO production in R6 was saturated. Then, reaction R7 occurred for NO2 formation from NO, which was effective at the low gas temperature. This led to a rapid decrease in NO concentration, as shown in Figure 3b. The NO, NO3, N2O3, N2O4, and N2O5 concentrations were too low to measure in the FTIR. The N2O5 concentration was calculated to be 8.0 × 10 10   cm 3 in this simulation. Moreover, N2O3 and N2O4 had very low calculated concentrations of 1.14 × 10 4   cm 3 and 1.0 × 10 5   cm 3 , respectively. These results show that O3 production was dominant, owing to the low gas temperature in reaction R2.

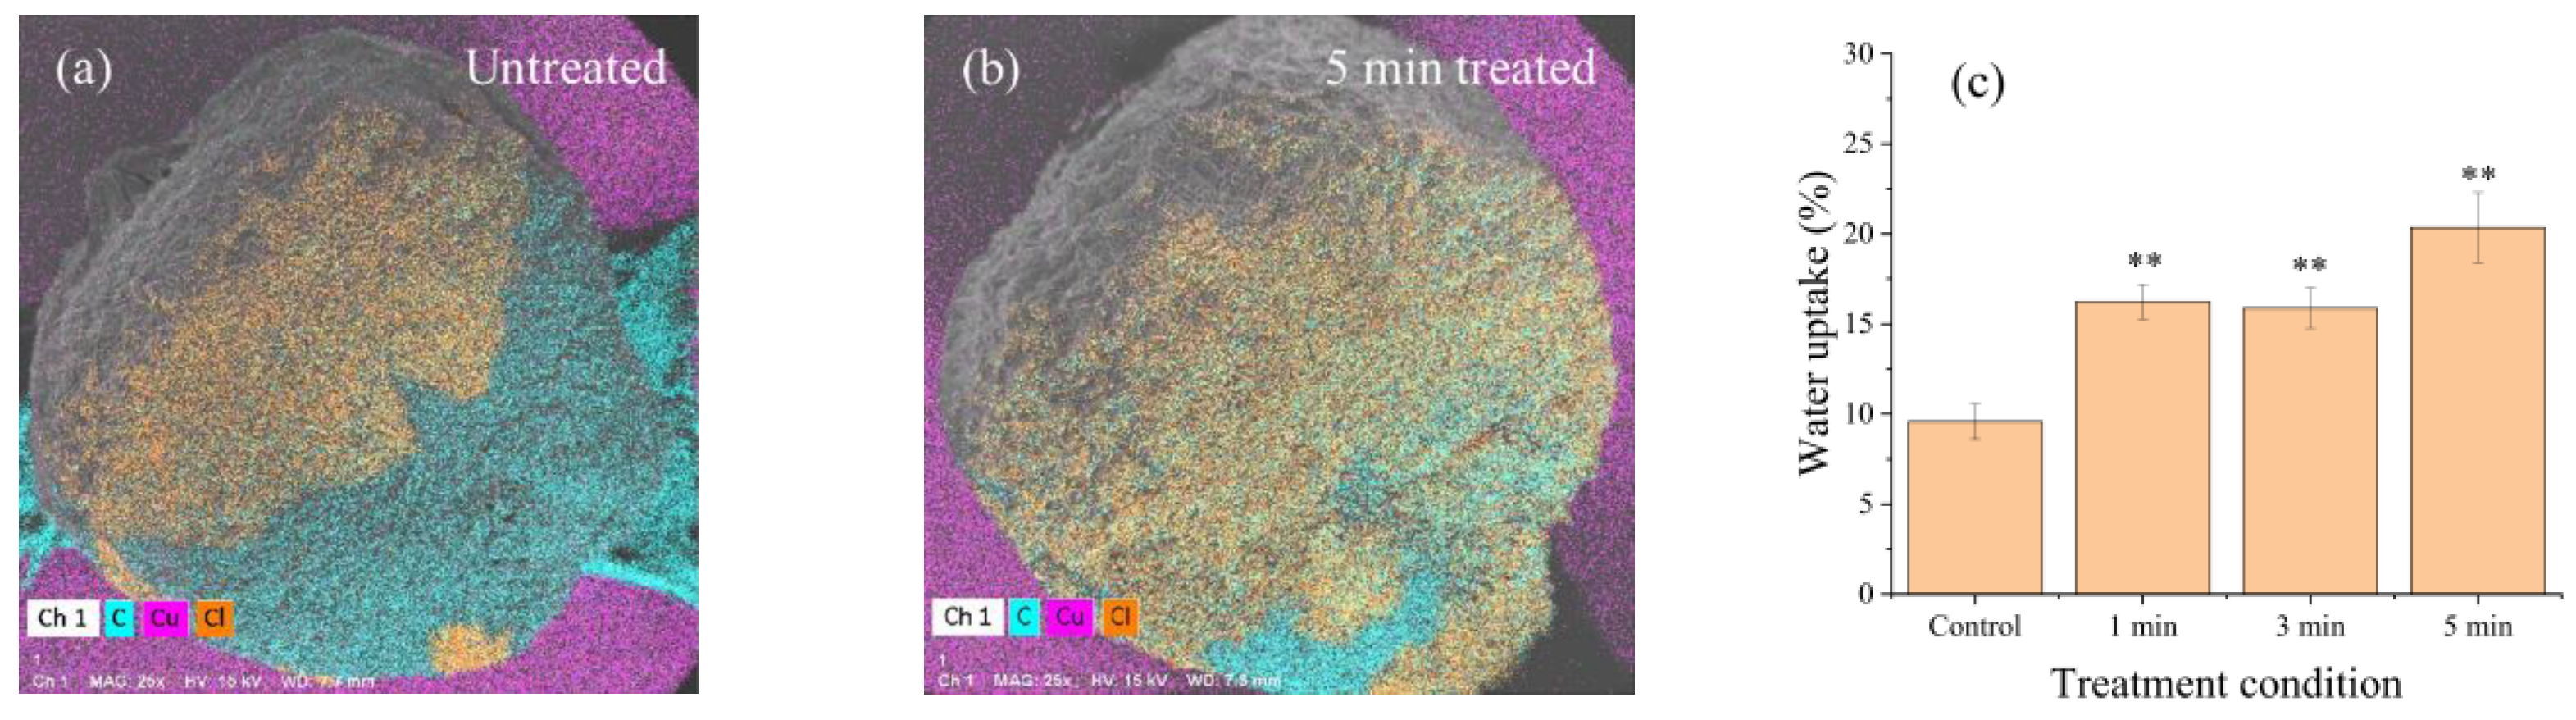
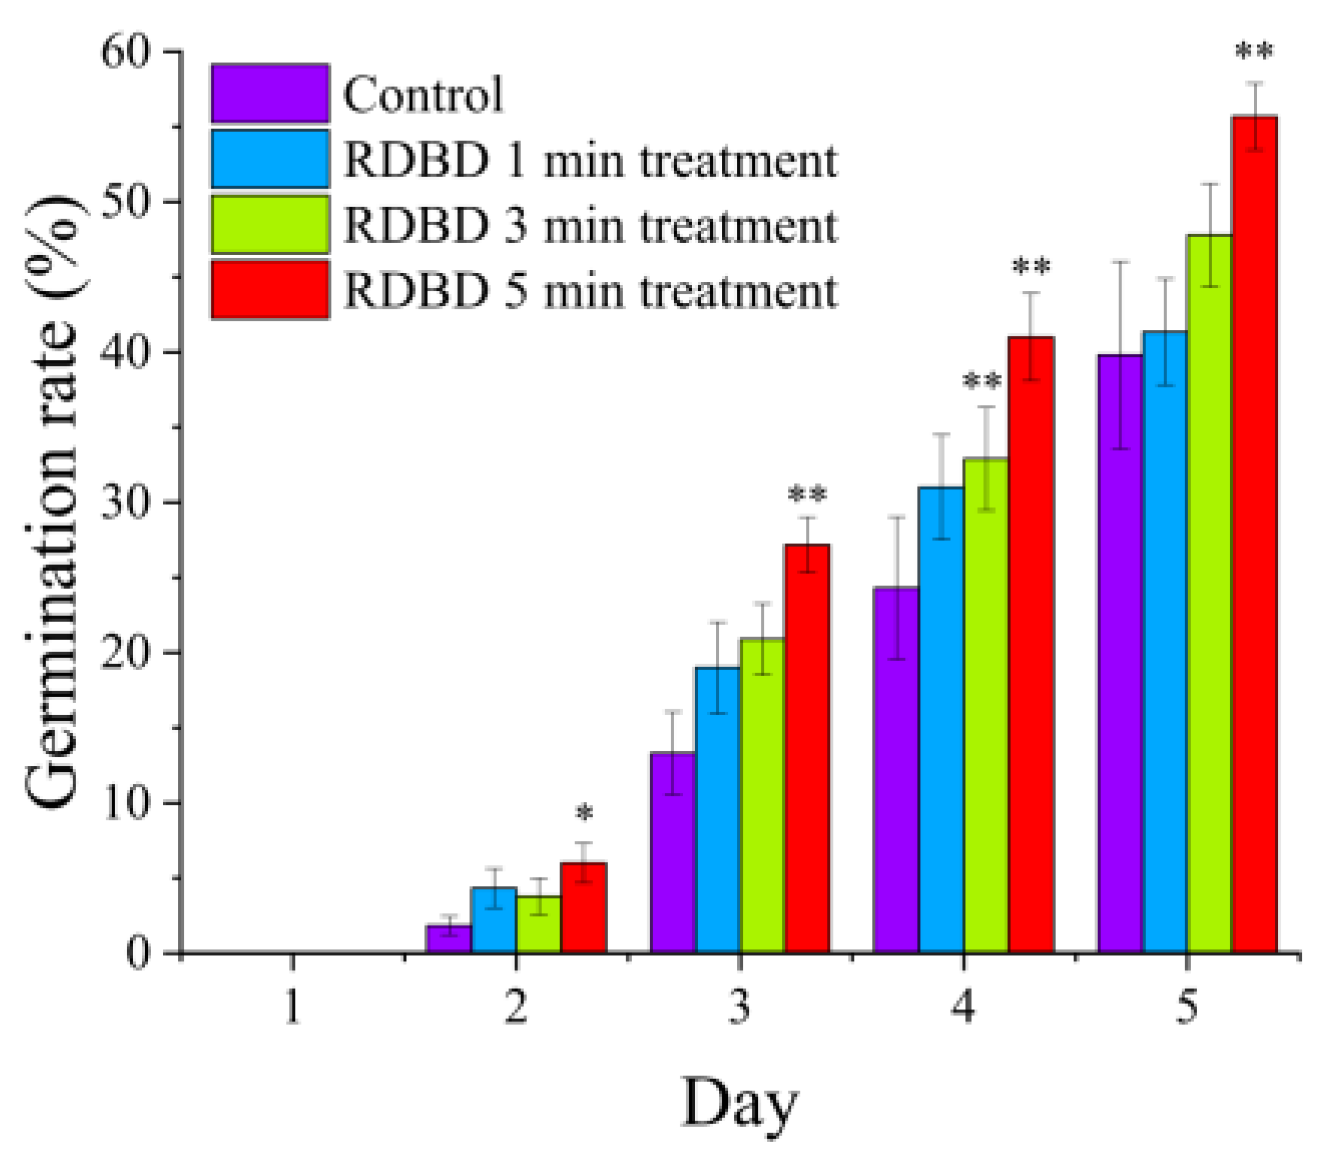
2.2. Improvement of Water Uptake and Germination Rates in Seeds Using RDBD

Figure 4 shows the energy dispersive X-ray spectroscopy (EDS) and water uptake results for spinach seeds that were untreated and treated by RDBD. To measure the range of water uptake on the seed surface, 1 μL of 10% NaCl solution was fed to the seed surface. Figure 4a,b show the EDS images of the seed surfaces, which depict the water absorption area by the 10% NaCl solution with an atomic Cl signal (orange color). The untreated seed exhibits the Cl signal over half of its area; however, the treated seed has a fully filled surface. These results show that the hydrophilicity of the spinach seed surface was enhanced by the RDBD treatment. The water uptake in the seeds is shown in Figure 4c based on seed weight. The seeds were treated for 1, 3, and 5 min by RDBD. The water uptake of the spinach seeds was enhanced by a maximum of 10% via the 5 min RDBD treatment.
Figure 5 shows the seed germination rate of untreated and treated spinach seeds. A short treatment time of 1 min exhibited a similar germination rate to that of the control in this experiment. After 1 min of the RDBD operation, O3 production was too low to affect the seed, as shown in Figure 3a, and the result led to a lower rate of seed germination. Moreover, only RDBD treatments longer than 3 min exhibited a meaningful enhancement in seed germination, as shown in Figure 5. Notably, the 5 min RDBD treatment showed a significant increase in both water uptake and germination rate. Moreover, the standard errors of the seed germination were significantly reduced from 6.2% (control) to 2.2% (5 min RDBD treatment) in this experiment. Undoubtedly, O3 play a significant role in seed germination in this experiment. Here, the additional omnidirectional production of ROS enhanced the equal treatment of each seed inside the RDBD device. Furthermore, a relatively strong flow rate of 15 lpm in air gas can shake the seeds inside the RDBD device to increase the chance of the ROS mixing with the seeds. These characteristics led to an increase in seed germination and a decrease in the standard errors of germination in this experiment.

3. Materials and Methods

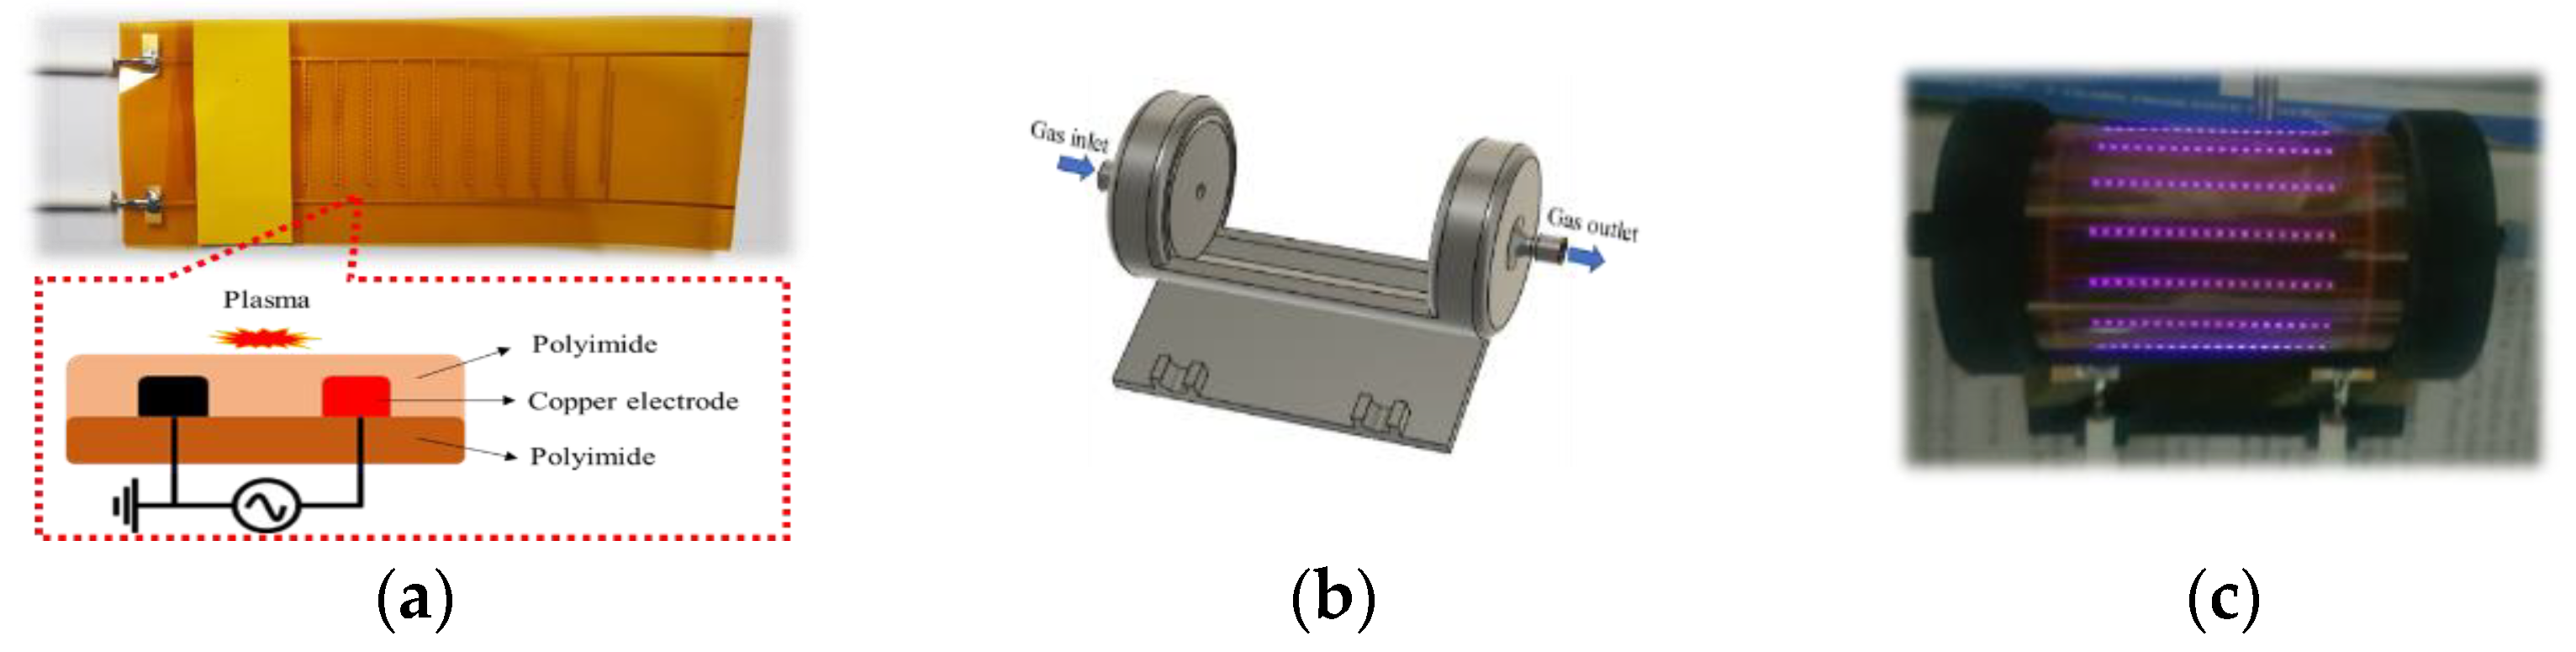
3.1. Rollable DBD Source

The RDBD device was manufactured using a 200 µm-width polyimide substrate. Copper was inkjet-printed at the electrode on the polyimide film (total area: 100 × 200 mm), as shown in Figure 6a. To prevent the oxidation of the copper electrode, it was covered by polyimide again. The mount in Figure 6b for the RDBD device was fabricated using 3D printing with polylactic acid material.
The RDBD panel structure was rolled up with a 3D-printed mount. The plasma was operated using synthetic air (dry air, 21% O2 with N2 balance) gas of 15 lpm to remove the fluctuation of chemical species density by random moisture on natural air, and using an inverter that had a peak voltage of 2.2 kV with a 40 kHz sinusoidal wave. Discharge was intended to occur on the inner surface of the RDBD device in the mount. To avoid burning the polyimide surface owing to thermal damage from plasma, the applied voltage was applied using a duty ratio of 10%, as shown in the following expression:
Duty   ratio ( % ) = on   time on   time + off   time × 100
where on-time refers to the sinusoidal voltage signal, and off-time is the rest time of the voltage corresponding to 0 V for cooling. The on-time was fixed at 20 ms, and the off-time was applied for 180 ms in this experiment.

3.2. Electrical and Optical Properties of Rollable DBD

The electrical characteristic of the device was measured using a high-voltage probe (P6015A, Tektronix, Beaverton, OR, USA) and current probe (P6021, Tektronix, Beaverton, OR, USA) that was connected to an oscilloscope (DSOX3104T, Keysight, Santa Rosa, CA, USA) for data recording as a function of time. The electrical energy I and dissipated power (P) were calculated using the following expressions:
E = 0 T v ( t ) i ( t ) dt   [ J ] ,  
P = Duty   ratio   × 1 T 0 T v ( t ) i ( t ) dt   [ W ] ,  
where v(t) and i(t) are the voltage and current versus time from the recorded data, respectively, and T is the period of voltage. The optical-emission property of RDBD was measured using a charge-coupled device (PIMAX4, Princeton instruments Inc., Trenton, NJ, USA) with a monochromator (SP2750i, Princeton instruments Inc., Trenton, NJ, USA). The gate width of the charge-coupled device was set to 1 s and five times of accumulation. The optical fiber was set to 5 mm away from the outer RDBD panel. To measure the optical emission profile of RDBD, the wavelength range of 200–800 nm was recorded with 150-groove grating. To measure the spectrum of rotational structure in N2SPS, the wavelength range of 334–337.5 nm was recorded with 1200-groove grating.

3.3. Chemical Species Measurement in FTIR Spectroscopy

The chemical species production of the RDBD device was measured using FTIR spectroscopy (Martix-MG5, Bruker, Billerica, MA, USA). A 1 m Teflon tube was connected between the gas inlet of the FTIR spectroscope and the gas outlet of the RDBD device. The time interval of the FTIR spectroscopy was set to 10 s, and the wave number ranged from 600 to 3000 cm−1 in this experiment. Concentrations of chemical species (nspecies) were calculated using the Beer–Lambert law with the following absorption cross-section ( σ ) [37]:
n species = 1 σ l ln ( I Trans I BG ) ,
σ O 3 = 6.51 × 10 19   cm 2   at   1054.65   cm 1 ,
σ NO 2 = 2.32 × 10 18   cm 2   at   1631.81   cm 1 ,
σ N 2 O = 3.34 × 10 18   cm 2   at   2239.07   cm 1 ,
where σ is the absorption cross-section area, and l is the optical path length (500 cm) in the FTIR spectroscope. ITrans is the measured transmittance in the FTIR spectroscope, which corresponded to the wave number of the absorption peak. IBG is the background signal of the FTIR spectroscope.

3.4. Zero-Dimension (0D) Chemical Species Simulation

A 0D simulation of the chemical species was used to understand the chemical reactions in the RDBD device. In this simulation, 51 reactions were used with 10 species, as shown in Table 1.
The time-dependent continuity equation is used in this simulation [24,38]:
n i t = j k j S n r , j j k j L n r , j n i τ dif
where k j S and k j L are the rate coefficients of the source and loss reactions, respectively. n r , j are the concentrations of each chemical species involved in the reaction [38]. τ dif is the time constant of the diffusion loss owing to the air flow in the RDBD device [24]. The diffusion owing to the air flow partially contributes to the concentration of the chemical species that is produced, and the time constant of the diffusion loss ( τ dif ) in this simulation was considered to be 30 s. The concentration of vibrationally excited N2 ( n n 2 ( v ) ) is determined by the following expressions [24]:
n N 2 ( v ) = n N 2 F v > 12 = n N 2 exp ( 12 Δ ε v k b T v ) ,
T v = T g + T v 0 [ 1 exp ( t / τ v ) ] ,
where k b is the Boltzmann constant. Δ ε v (=0.29 eV) is the vibrationally excited nitrogen at the level above v = 12 that contributes to NO production in R6. T v is the vibrational temperature, and T v 0 (=2860 K) is the steady state of the vibrational temperature. τ v (=0.01 s) is the time constant of the vibrational temperature increase, and T g (=342 K) is the gas temperature. In this simulation, the measured rotational temperature from the N2 spectrum was used as a gas temperature under the assumption of the rotational–translational temperature equilibrium [39,40]. The initial concentrations of all species, except for atomic oxygen, excited N2 and O2, which were set to 1.0 × 10 4   cm 3 . The excited species parameters, n O = 7.6 × 10 7   cm 3 , n O ( D ) = 8.0 × 10 7   cm 3   , n O 2 ( a ) = 1.0 × 10 7   cm 3 , and n N 2 ( A ) = 4.0 × 10 7   cm 3 , were set to constants over the simulation period. The equations with the reactions were solved using the ordinary-differential-equation solver in MATLAB (MathWorks, Natick, MA, USA).

3.5. Spinach Seed Treatment and Germination

Spinach seeds were soaked in deionized (DI) water for 24 h before treatment. Additionally, the seeds were inserted into the mount and covered by the surrounding rolled-up RDBD panel, as shown in Figure 6c (Also see Supplementary Materials Figure S3). Each treatment condition was performed with 150 seeds for 1, 3, or 5 min. Treated seeds were divided into groups of 50 seeds per 90 mm petri dish, which had three pieces of filter paper. The filter paper was supplied with 3 mL DI water on the first day of the experiment, and 1 mL DI water was additionally supplied on the third day. The seeds were covered in the petri dish and grown in an incubator at 26 °C with 60% humidity. Seed germination was considered successful if the seed grew a stem of more than 1 mm. The germination rate was calculated using the following expression:
Germination   rate   ( % ) = N G N T × 100 %
where N T is the total number of seeds in a petri dish, and N G is the total number of germinated seeds in a petri dish.

3.6. Measurement of Water Uptake of Seeds

The water uptake was measured two ways. To measure the water absorption area on the seed surface, 1 μL of 10% NaCl solution was fed to the seed surface during 10 min. Energy dispersive X-ray spectroscopy (EDS) was used to measure the absorption area by the Cl signal of absorbed NaCl solution in the seed surface.
The water absorption rate ( W a ) was measured by DI water absorption in the seed. After plasma treatment, seeds were incubated (26 °C with 60% humidity) in the petri dish with wet filter paper for 24 h. The filter paper was fed 3 mL of DI water. After 24 h, the weight Wa was measured using the following expression [41]:
W a ( % ) = W 1 W o W o × 100 % ,  
where Wo is the weight of 50 seeds before the plasma treatment, and W1 is the corresponding weight 24 h after the plasma treatment.

3.7. Statistical Analysis

The analysis of the variance of the differences among samples used standard errors in this report. Experimental results were repeated three times. The seed germination was statistically analyzed by Student’s t-test, and significant differences were indicated based on p < 0.05. (* denotes p < 0.05 and ** denotes p < 0.01).

4. Conclusions

NAP is a new technology with a wide range of applications in different fields, including agriculture. Innovative NAP devices that are designed with improved understanding and usability are desperately needed to advance NAP applications in agriculture. In this study, we developed and investigated the properties of an RDBD device that is operated using synthetic air gas. The rotational and vibrational temperatures were measured as 342 K and 2860 K, respectively. The rotational temperature results show that the RDBD device is safe and efficient for use in agricultural fields. The N2, O, and NO-γ spectra were observed using optical emission spectroscopy. The O3, NO2, and N2O productions of the RDBD device were measured to be 1.36 × 10 14   cm 3 , 2.15 × 10 12   cm 3 , and 8.25 × 10 11   cm 3 , respectively, based on FTIR absorption spectroscopy. The 0D chemical simulation and experimental FTIR spectroscopy results were shown to be dominant for O3, whereas the nitrogen species were recessive, owing to their low temperatures in RDBD. The proposed RDBD device was also used to assess seed germination and seed water uptake. When 150 spinach seeds were simultaneously treated with RDBD, the water uptake and germination increased by 10% and 15%, respectively, after a 5 min RDBD treatment. The RDBD device exhibited an enhancement in the germination rate, as well as a reduction in the standard errors of the germination rate owing to omnidirectional seed treatment. These findings represent a significant advancement in NAP devices, which may help in advancing the potential applications of plasma in agriculture.

Supplementary Materials

The following supporting information can be downloaded at: https://www.mdpi.com/article/10.3390/ijms24054638/s1.

Author Contributions

Conceptualization, J.S.L.; methodology, J.S.L.; validation, S.M., S.K. and Y.J.H.; formal analysis, J.S.L., D.K. and A.M.S.; investigation, J.S.L. and D.K.; data curation, J.S.L., A.M.S., Y.J.H., I.H. and G.P.; writing—original draft preparation, J.S.L.; writing—review and editing, S.M., G.P. and E.H.C.; visualization, J.S.L. and D.K.; supervision, E.H.C.; project administration, E.H.C.; funding acquisition, E.H.C. All authors have read and agreed to the published version of the manuscript.

Funding

This research was supported by the Basic Science Research Program through the National Research Foundation of Korea (NRF), funded by 2022R1I1A1A01054752 from the Ministry of Education, in part funded by NRF-2021R1A6A1A03038785, and partially by Kwangwoon University, Seoul, Republic of Korea, 2023.

Institutional Review Board Statement

Not applicable.

Informed Consent Statement

Not applicable.

Data Availability Statement

Please contact the corresponding author to discuss the availability of the data presented in this study.

Acknowledgments

We would like to thank the Plasma Bioscience Research Center (PBRC) and the Departments of Electrical and Biological Physics, Kwangwoon University.

Conflicts of Interest

The authors declare no conflict of interest.

References

  1. Choi, E.H.; Kaushik, N.K.; Hong, Y.J.; Lim, J.S.; Choi, J.S.; Han, I. Plasma Bioscience for Medicine, Agriculture and Hygiene Applications. J. Korean Phys. Soc. 2022, 80, 817–851. [Google Scholar] [CrossRef]
  2. Keidar, M. Plasma for Cancer Treatment. Plasma Sources Sci. Technol. 2015, 24, 33001. [Google Scholar] [CrossRef]
  3. Sarangapani, C.; Patange, A.; Bourke, P.; Keener, K.; Cullen, P.J. Recent Advances in the Application of Cold Plasma Technology in Foods. Annu. Rev. Food Sci. Technol. 2018, 9, 609–629. [Google Scholar] [CrossRef] [PubMed]
  4. Ganesan, A.R.; Tiwari, U.; Ezhilarasi, P.N.; Rajauria, G. Application of Cold Plasma on Food Matrices: A Review on Current and Future Prospects. J. Food Process. Preserv. 2021, 45, e15070. [Google Scholar] [CrossRef]
  5. Laroque, D.A.; Seó, S.T.; Valencia, G.A.; Laurindo, J.B.; Carciofi, B.A.M. Cold Plasma in Food Processing: Design, Mechanisms, and Application. J. Food Eng. 2022, 312, 110748. [Google Scholar] [CrossRef]
  6. Zhang, B.; Tan, C.; Zou, F.; Sun, Y.; Shang, N.; Wu, W. Impacts of Cold Plasma Technology on Sensory, Nutritional and Safety Quality of Food: A Review. Foods 2022, 11, 2818. [Google Scholar] [CrossRef]
  7. Vandamme, M.; Robert, E.; Lerondel, S.; Sarron, V.; Ries, D.; Dozias, S.; Sobilo, J.; Gosset, D.; Kieda, C.; Legrain, B.; et al. ROS Implication in a New Antitumor Strategy Based on Non-Thermal Plasma. Int. J. Cancer 2012, 130, 2185–2194. [Google Scholar] [CrossRef]
  8. Mumtaz, S.; Rana, J.N.; Choi, E.H.; Han, I. Microwave Radiation and the Brain: Mechanisms, Current Status, and Future Prospects. Int. J. Mol. Sci. 2022, 23, 9288. [Google Scholar] [CrossRef]
  9. Chen, Z.; Chen, G.; Obenchain, R.; Zhang, R.; Bai, F.; Fang, T.; Wang, H.; Lu, Y.; Wirz, R.E.; Gu, Z. Cold Atmospheric Plasma Delivery for Biomedical Applications. Mater. Today 2022, 54, 153–188. [Google Scholar] [CrossRef]
  10. Laroussi, M. Cold Plasma in Medicine and Healthcare: The New Frontier in Low Temperature Plasma Applications. Front. Phys. 2020, 8, 74. [Google Scholar] [CrossRef]
  11. Dubey, S.K.; Parab, S.; Alexander, A.; Agrawal, M.; Achalla, V.P.K.; Pal, U.N.; Pandey, M.M.; Kesharwani, P. Cold Atmospheric Plasma Therapy in Wound Healing. Process Biochem. 2022, 112, 112–123. [Google Scholar] [CrossRef]
  12. Pankaj, S.K.; Keener, K.M. Cold Plasma: Background, Applications and Current Trends. Curr. Opin. Food Sci. 2017, 16, 49–52. [Google Scholar] [CrossRef]
  13. Lim, J.S.; Hong, Y.J.; Ghimire, B.; Choi, J.; Mumtaz, S.; Choi, E.H. Measurement of Electron Density in Transient Spark Discharge by Simple Interferometry. Results Phys. 2021, 20, 103693. [Google Scholar] [CrossRef]
  14. Lim, J.S.; Kim, R.H.; Hong, Y.J.; Lamichhane, P.; Adhikari, B.C.; Choi, J.; Choi, E.H. Interactions between Atmospheric Pressure Plasma Jet and Deionized Water Surface. Results Phys. 2020, 19, 103569. [Google Scholar] [CrossRef]
  15. Pavlovich, M.J.; Chang, H.W.; Sakiyama, Y.; Clark, D.S.; Graves, D.B. Ozone Correlates with Antibacterial Effects from Indirect Air Dielectric Barrier Discharge Treatment of Water. J. Phys. D Appl. Phys. 2013, 46, 145001. [Google Scholar] [CrossRef]
  16. Kaushik, N.K.; Kaushik, N.; Bhartiya, P.; Nguyen, L.N.; Choi, E.H. Glycolytic Inhibitor Induces Metabolic Crisis in Solid Cancer Cells to Enhance Cold Plasma-Induced Cell Death. Plasma Process. Polym. 2021, 18, 2000187. [Google Scholar] [CrossRef]
  17. Lin, A.; Truong, B.; Patel, S.; Kaushik, N.; Choi, E.H.; Fridman, G.; Fridman, A.; Miller, V. Nanosecond-Pulsed Dbd Plasma-Generated Reactive Oxygen Species Trigger Immunogenic Cell Death in A549 Lung Carcinoma Cells through Intracellular Oxidative Stress. Int. J. Mol. Sci. 2017, 18, 966. [Google Scholar] [CrossRef] [Green Version]
  18. Kim, J.; Park, S.; Choe, W. Surface Plasma with an Inkjet-Printed Patterned Electrode for Low-Temperature Applications. Sci. Rep. 2021, 11, 12206. [Google Scholar] [CrossRef]
  19. Guo, Y.; Fang, M.; Zhang, L.; Sun, J.; Wang, X.; Tie, J.; Zhou, Q.; Zhang, L.; Luo, H. Study on Flexible Surface Dielectric Barrier Discharge Plasma Film for in Situ Inactivation of Bacteria and Viruses. Appl. Phys. Lett. 2022, 121, 074101. [Google Scholar] [CrossRef]
  20. Gershman, S.; Harreguy, M.B.; Yatom, S.; Raitses, Y.; Efthimion, P.; Haspel, G. A Low Power Flexible Dielectric Barrier Discharge Disinfects Surfaces and Improves the Action of Hydrogen Peroxide. Sci. Rep. 2021, 11, 4626. [Google Scholar] [CrossRef]
  21. Sehrawat, R.; Thakur, A.K.; Vikram, A.; Vaid, A.; Rane, R. Effect of Cold Plasma Treatment on Physiological Quality of Okra Seed. J. Hill Agric. 2017, 8, 66–71. [Google Scholar] [CrossRef]
  22. Bazavan, M.; Iova, I. Temperature Determination of a Cold N2 Discharge Plasma by the Fit of the Experimental Spectra with the Simulated Emission Spectra. Rom. Rep. Phys. 2008, 60, 671–678. [Google Scholar]
  23. Herzberg, G.; Mrozowski, S. Molecular Spectra and Molecular Structure. I. Spectra of Diatomic Molecules; D. Van Nostrand Company. Inc.: New York, NY, USA, 1951; Volume 19. [Google Scholar]
  24. Shimizu, T.; Sakiyama, Y.; Graves, D.B.; Zimmermann, J.L.; Morfill, G.E. The Dynamics of Ozone Generation and Mode Transition in Air Surface Micro-Discharge Plasma at Atmospheric Pressure. New J. Phys. 2012, 14, 103028. [Google Scholar] [CrossRef] [Green Version]
  25. Herron, J.T.; Green, D.S. Chemical Kinetics Database and Predictive Schemes for Nonthermal Humid Air Plasma Chemistry. Part II. Neutral Species Reactions. Plasma Chem. Plasma Process. 2001, 21, 459–481. [Google Scholar] [CrossRef]
  26. Capitelli, M.; Ferreira, C.M.; Gordiets, B.F.; Osipov, A.I. Plasma Kinetics in Atmospheric Gases; Springer Science\& Business Media: Berlin/Heidelberg, Germany, 2013; Volume 31. [Google Scholar]
  27. Atkinson, R.; Baulch, D.L.; Cox, R.A.; Hampson, R.F.; Kerr, J.A.; Rossi, M.J.; Troe, J. Evaluated Kinetic and Photochemical Data for Atmospheric Chemistry: Supplement VI: IUPAC Subcommittee on Gas Kinetic Data Evaluation for Atmospheric Chemistry. J. Phys. Chem. Ref. Data 1997, 26, 1329–1499. [Google Scholar] [CrossRef] [Green Version]
  28. Atkinson, R.; Baulch, D.L.; Cox, R.A.; Crowley, J.N.; Hampson, R.F.; Hynes, R.G.; Jenkin, M.E.; Rossi, M.J.; Troe, J. Evaluated Kinetic and Photochemical Data for Atmospheric Chemistry: Volume I-Gas Phase Reactions of Ox, HOx, NOx and SOx Species. Atmos. Chem. Phys. 2004, 4, 1461–1738. [Google Scholar] [CrossRef] [Green Version]
  29. Murakami, T.; Niemi, K.; Gans, T.; O’Connell, D.; Graham, W.G. Chemical Kinetics and Reactive Species in Atmospheric Pressure Helium--Oxygen Plasmas with Humid-Air Impurities. Plasma Sources Sci. Technol. 2012, 22, 15003. [Google Scholar] [CrossRef]
  30. Atkinson, R.; Baulch, D.L.; Cox, R.A.; Hampson, R.F., Jr.; Kerr, J.A.; Troe, J. Evaluated Kinetic and Photochemical Data for Atmospheric Chemistry: Supplement IV. IUPAC Subcommittee on Gas Kinetic Data Evaluation for Atmospheric Chemistry. J. Phys. Chem. Ref. Data 1992, 21, 1125–1568. [Google Scholar] [CrossRef]
  31. Jeong, J.Y.; Park, J.; Henins, I.; Babayan, S.E.; Tu, V.J.; Selwyn, G.S.; Ding, G.; Hicks, R.F. Reaction Chemistry in the Afterglow of an Oxygen- Helium, Atmospheric-Pressure Plasma. J. Phys. Chem. A 2000, 104, 8027–8032. [Google Scholar] [CrossRef] [Green Version]
  32. Baulch, D.L.; Cobos, C.J.; Cox, R.A.; Frank, P.; Hayman, G.; Just, T.; Kerr, J.A.; Murrells, T.; Pilling, M.J.; Troe, J.; et al. Evaluated Kinetic Data for Combustion Modeling. Supplement I. J. Phys. Chem. Ref. Data 1994, 23, 847–848. [Google Scholar] [CrossRef] [Green Version]
  33. Sander, S.P.; Kircher, C.C. Temperature Dependence of the Reaction NO+ NO3→ 2NO2. Chem. Phys. Lett. 1986, 126, 149–152. [Google Scholar] [CrossRef]
  34. Eichwald, O.; Yousfi, M.; Hennad, A.; Benabdessadok, M.D. Coupling of Chemical Kinetics, Gas Dynamics, and Charged Particle Kinetics Models for the Analysis of NO Reduction from Flue Gases. J. Appl. Phys. 1997, 82, 4781–4794. [Google Scholar] [CrossRef]
  35. Johnston, H.S.; Cantrell, C.A.; Calvert, J.G. Unimolecular Decomposition of NO3 to Form NO and O2 and a Review of N2O5/NO3 Kinetics. J. Geophys. Res. Atmos. 1986, 91, 5159–5172. [Google Scholar] [CrossRef]
  36. Matzing, H. Chemical Kinetics of Flue Gas Cleaning by Irradiation with Electrons. Adv. Chem. Phys. 1991, 80, 315–402. [Google Scholar]
  37. Gordon, I.E.; Rothman, L.S.; Hargreaves, R.J.; Hashemi, R.; Karlovets, E.V.; Skinner, F.M.; Conway, E.K.; Hill, C.; Kochanov, R.V.; Tan, Y.; et al. The HITRAN2020 Molecular Spectroscopic Database. J. Quant. Spectrosc. Radiat. Transf. 2022, 277, 107949. [Google Scholar] [CrossRef]
  38. Park, S.; Choe, W.; Jo, C. Interplay among Ozone and Nitrogen Oxides in Air Plasmas: Rapid Change in Plasma Chemistry. Chem. Eng. J. 2018, 352, 1014–1021. [Google Scholar] [CrossRef]
  39. Bruggeman, P.J.; Sadeghi, N.; Schram, D.C.; Linss, V. Gas Temperature Determination from Rotational Lines in Non-Equilibrium Plasmas: A Review. Plasma Sources Sci. Technol. 2020, 23, 023001. [Google Scholar] [CrossRef] [Green Version]
  40. Zhang, Q.Y.; Shi, D.Q.; Xu, W.; Miao, C.Y.; Ma, C.Y.; Ren, C.S.; Zhang, C.; Yi, Z. Determination of Vibrational and Rotational Temperatures in Highly Constricted Nitrogen Plasmas by Fitting the Second Positive System of N2 Molecules. AIP Adv. 2020, 5, 57158. [Google Scholar] [CrossRef] [Green Version]
  41. Fan, L.; Liu, X.; Ma, Y.; Xiang, Q. Effects of Plasma-Activated Water Treatment on Seed Germination and Growth of Mung Bean Sprouts. J. Taibah Univ. Sci. 2020, 14, 823–830. [Google Scholar] [CrossRef]
Figure 1. (a) Duty ratio of applied voltage, (b) voltage (black line) and discharge current (blue line) versus time.
Ijms 24 04638 g001
Figure 2. Optical emission spectrum of plasma on the RDBD surface.
Ijms 24 04638 g002
Figure 3. (a) Experimental and simulated results of O3, NO, and N2O versus time and (b) chemical species in 0D chemical simulation.
Ijms 24 04638 g003
Figure 4. (a) EDS image of untreated spinach seed, (b) EDS image of spinach seed treated for 5 min, and (c) water uptake with RDBD treatment condition. The experiment was repeated three times with 150 seeds. (** denotes p < 0.01).
Ijms 24 04638 g004
Figure 5. Spinach seed germination rate for each treatment day and treatment time. The experiment was repeated three times with 150 seeds. (* denotes p < 0.05 and ** denotes p < 0.01).
Ijms 24 04638 g005
Figure 6. (a) Schematic of RDBD panel, (b) mount for RDBD, and (c) discharge in RDBD device.
Ijms 24 04638 g006
Table 1. Chemical reaction list used in simulation.
No.ReactionRate Coefficient (cm3/s or cm6/s)Ref
R1 O + O + M O 2 + M 4.5 × 10 34 exp ( 630 / T g ) [25]
R2 O + O 2 + M O 3 + M 5.6 × 10 34 ( T g / 300 ) 2.8 [25]
R3 O + O 3 O 2 + O 2 8.0 × 10 12 exp ( 2060 / T g ) 1.6 [25]
R4 O + N 2 + M N 2 O + M 3.9 × 10 35 exp ( 10 , 400 / T g )   [26]
R5 O + N 2 ( A 3 Σ ) NO + N ( 2 D )   7.0 × 10 12 [27]
R6 O + N 2 ( ν ) NO + N 1.0 × 10 11 [27]
R7 O + NO + M NO 2 + M 1.0 × 10 31 ( T g / 300 ) 1.6 [25]
R8 O + NO NO 2 4.2 × 10 18 [26]
R9 O + NO 2 NO + O 2 5.5 × 10 12 exp ( 188 / T g ) [28]
R10 O + NO 2 + M NO 3 + M 1.31 × 10 31 ( 298 / T g ) 1.5 [28]
R11 O + NO 2 NO 3 2.3 × 10 11 ( T g / 300 ) 0.24 [28]
R12 O + NO 3 O 2 + NO 2 1.7 × 10 11 [25]
R13 O + N 2 O NO + NO 1.5 × 10 16 exp ( 14 , 090 / T g ) [26]
R14 O + N 2 O 5 products 3 × 10 16 [26]
R15 O 2 + O 2 O + O 3 2.0 × 10 11 exp ( 49 , 800 / T g ) [26]
R16 O ( 1 D ) + N 2 + N 2 N 2 O + N 2 9.0 × 10 37 [29]
R17 O 3 + NO NO 2 + O 2 1.8 × 10 12 exp ( 1370 / T g ) [25]
R18 O 3 + NO 2 NO 3 + O 2 1.2 × 10 13 exp ( 2450 / T g ) [30]
R19 O 3 + M O + O 2 + M 7.26 × 10 10 exp ( 11 , 400 / T g ) [31]
R20 O 3 + O 2 ( a 1 Δ ) O + O 2 + O 2 5.2 × 10 11 exp ( 2840 / T g ) [25]
R21 N + O + M NO + M 6.3 × 10 33 exp ( 140 / T g ) [25]
R22 N + O 2 NO + O 1.5 × 10 14 T g exp ( 3270 / T g ) [32]
R23 N + O 3 NO + O 2 5.0 × 10 22 [33]
R24 N + N + M N 2 + M 8.3 × 10 34 exp ( 500 / T g ) [26]
R25 N + NO N 2 + O 2.1 × 10 11 × exp ( 100 / T g ) [25]
R26 N + NO 2 N 2 O + O 5.8 × 10 12 exp ( 220 / T g ) [25]
R27 N + NO 2 N 2 + O + O 9.1 × 10 13 [34]
R28 N + NO 2 NO + NO 6.0 × 10 13 [34]
R29 N + NO 2 N 2 + O 2 7.0 × 10 13 [34]
R30 N 2 + O 2 O + N 2 O 2.5 × 10 10 exp ( 50 , 390 / T g ) [26]
R31 N 2 + M N + N + M 5.4 × 10 8 [ 1 exp ( 3354 / T g ) ] exp ( 113 , 200 / T g ) [26]
R32 NO + NO 2 + M N 2 O 3 + M 3.1 × 10 34 ( T g / 300 ) 7.7 [28]
R33 NO + NO 3 NO 2 + NO 2 1.59 × 10 11 exp ( 122 / T g ) [33]
R34 NO + NO N + NO 2 3.3 × 10 16 ( 300 / T g ) exp ( 39 , 200 / T g ) [26]
R35 NO + O 2 O + NO 2 2.8 × 10 12 exp ( 23 , 400 / T g ) [26]
R36 NO 2 + NO 2 + M N 2 O 4 + M 1.44 × 10 32 exp ( 110 / T g ) 3.8 [28]
R37 NO 2 + NO 3 + M N 2 O 5 + M 3.7 × 10 30 ( 300 / T g ) 4.1 [28]
R38 NO 2 + NO 3 NO 2 + NO + O 2.3 × 10 13 exp ( 1600 / T g ) [26]
R39 NO 2 + NO 2 NO + NO + O 2 3.3 × 10 12 exp ( 13 , 500 / T g ) [26]
R40 NO 2 + O 2 NO + O 3 2.8 × 10 12 exp ( 25 , 400 / T g ) [26]
R41 NO 2 + M NO + O + M 6.8 × 10 6 ( 300 / T g ) 2 exp ( 36 , 180 / T g ) [26]
R42 NO 2 + N 2 ( A 3 Σ ) N 2 + NO + O 1.3 × 10 11 [25]
R43 NO 3 + O 2 NO 2 + O 3 1.5 × 10 12 exp ( 15 , 020 / T g ) [26]
R44 NO 3 + M NO 2 + O + M 3.1 × 10 5 ( 300 / T g ) 2 exp ( 25 , 000 / T g ) [26]
R45 NO 3 + M NO + O 2 + M 6.2 × 10 5 ( 300 / T g ) 2 exp ( 25 , 000 / T g ) [26]
R46 NO 3 + NO 3 NO 2 + NO 2 + O 2 4.3 × 10 12 exp ( 3850 / T g ) [35]
R47 N 2 O 3 + M NO + NO 2 + M 1.9 × 10 7 ( T g / 300 ) 8.7 exp ( 4880 / T g ) [28]
R48 N 2 O 4 + M NO 2 + NO 2 + M 1.3 × 10 5 ( T g / 300 ) 3.8 exp ( 6400 / T g ) [28]
R49 N 2 O 5 + M NO 2 + NO 3 + M 1.3 × 10 3 ( T g / 300 ) 3.5 exp ( 11 , 000 / T g ) [28]
R50 N 2 O + N 2 ( A 3 Σ ) O + N 2 + N 2 8.0 × 10 11 [36]
R51 N 2 O + N 2 ( A 3 Σ ) NO + N + N 2 8.0 × 10 11 [36]
M is N2 or O2. Tg is the gas temperature (K).
Disclaimer/Publisher’s Note: The statements, opinions and data contained in all publications are solely those of the individual author(s) and contributor(s) and not of MDPI and/or the editor(s). MDPI and/or the editor(s) disclaim responsibility for any injury to people or property resulting from any ideas, methods, instructions or products referred to in the content.

