Article

Whole-Genome Comparison Reveals Structural Variations behind Heading Leaf Trait in Brassica oleracea

1
Key Laboratory of Biology and Genetic Improvement of Oil Crops, Ministry of Agriculture and Rural Affairs, Oil Crops Research Institute of the Chinese Academy of Agricultural Sciences, Wuhan 430062, China
2
School of Life and Health Sciences, Hunan University of Science and Technology, Xiangtan 411201, China
3
National Key Laboratory of Crop Genetic Improvement, Huazhong Agricultural University, Wuhan 430072, China
*
Author to whom correspondence should be addressed.
These authors contributed equally to this work.
Int. J. Mol. Sci. 2023, 24(4), 4063; https://doi.org/10.3390/ijms24044063
Submission received: 4 January 2023 / Revised: 7 February 2023 / Accepted: 15 February 2023 / Published: 17 February 2023
(This article belongs to the Special Issue The Gene, Genomics, and Molecular Breeding in Cruciferae Plants)

Abstract

:
Brassica oleracea displays remarkable morphological variations. It intrigued researchers to study the underlying cause of the enormous diversification of this organism. However, genomic variations in complex heading traits are less known in B. oleracea. Herein, we performed a comparative population genomics analysis to explore structural variations (SVs) responsible for heading trait formation in B. oleracea. Synteny analysis showed that chromosomes C1 and C2 of B. oleracea (CC) shared strong collinearity with A01 and A02 of B. rapa (AA), respectively. Two historical events, whole genome triplication (WGT) of Brassica species and differentiation time between AA and CC genomes, were observed clearly by phylogenetic and Ks analysis. By comparing heading and non-heading populations of B. oleracea genomes, we found extensive SVs during the diversification of the B. oleracea genome. We identified 1205 SVs that have an impact on 545 genes and might be associated with the heading trait of cabbage. Overlapping the genes affected by SVs and the differentially expressed genes identified by RNA-seq analysis, we identified six vital candidate genes that may be related to heading trait formation in cabbage. Further, qRT-PCR experiments also verified that six genes were differentially expressed between heading leaves and non-heading leaves, respectively. Collectively, we used available genomes to conduct a comparison population genome analysis and identify candidate genes for the heading trait of cabbage, which provides insight into the underlying reason for heading trait formation in B. oleracea.

1. Introduction

Brassica oleracea (CC, 2n = 2x = 18) is one of the most important vegetable species for human diets, which includes cabbage (var. capitata), cauliflower (var. botrytis), broccoli (var. italica), Brussels sprout (var. gemmifera), kohlrabi (var. gongylodes), kale (var. acephala), and Chinese kale (var. alboglabra). They are rich in carotenoids and glucosinolates (GSLs), functioning as a plant defense against pathogens, and have anticancer properties for human health [1]. In 2019 and 2020, the global market production of B. oleracea vegetables was approximately 70.2 and 70.8 million tons, with values of 18.96 and 18.18 billion dollars, respectively (data from FAO: http://faostat.fao.org/, accessed on 7 July 2022).
Cabbage is one of the most widely grown crops of B. oleracea and provides edible leaf organs for human consumption [2]. The heading trait of cabbage is an important agronomic trait that affects the yield and quality of cabbage [3]. It is also a typical domesticated trait that can be used for identifying signals of the artificial selection of cabbage [4]. Recently, some quantitative trait loci (QTLs) [3,5] and three candidate genes, BoKAN2.2, BoBRX.2, and BoATHB15.2 [4], associated with this complex heading trait have been identified. However, there are no studies of heading trait morphology using structural variations (SVs) in cabbage.
Within the last two decades, the advent of high-throughput sequencing technologies has offered an excellent opportunity for exploring genomics and population genomics in many important crops, such as rice [6,7,8], maize [9], cotton [10,11], and rapeseed [12,13,14]. For Brassica oleracea plants, a draft genome of B. oleracea named line02-12 (a cabbage type) was first released in 2014 [1]. The genome of To1000, belonging to the Chinese kale type, was decoded in the same year [15]. A chromosome-scale broccoli genome named HDEM was encoded using Oxford Nanopore Technology (ONT) in 2018 [16]. Then, a high-quality reference genome for cabbage line D134 was obtained with the single-molecule real-time (SMRT) sequencing technique in 2020 [17]. An improved version of line02-12 was declared in the same year on the basis of the SMART sequencing technique [18]. Two B. oleracea genomes, cabbage type OX-heart and cauliflower type Korso, were reported using the SMART technique in recent research [19]. Based on these reference genomes, population genomics research was performed to study the origin, domestication, and morphotype diversification of B. oleracea [4,20,21]. Although six genomes of B. oleracea are available, comprehensive comparative genome analysis has rarely been reported.
Here, we used six high-contiguity B. oleracea genomes to conduct a comparative genome analysis. Through synteny analysis, we found that chromosomes C1 and C2 in B. oleracea share stronger collinearity with A01 and A02 in B. rapa than other chromosomes. Based on 10,950 single-copy ortholog genes, we constructed a phylogenetic tree. Two historical events were observed clearly through synonymous substitution rate (Ks) analysis. In addition, we identified extensive sequence variations containing single nucleotide polymorphisms (SNPs) and small insertions and deletions (InDels) and structural variations (SVs) among these six B. oleracea genomes. In particular, we identified six candidate genes affected by SVs that may be involved in heading trait formation in cabbage. In conclusion, we carried out an overall comparative population genomic analysis of six available high-quality B. oleracea genomes and 280 B. oleracea genome datasets. The results revealed the genetic variations and phylogenetic relationships within the B. oleracea genome. Moreover, this study provides useful information for further accelerating the molecular breeding of B. oleracea crops.

2. Results

2.1. Comparison of Genome Features among Six B. oleracea Genomes

The estimated genome size of B. oleracea ranges from 567 to 660 Mb. The assembled genome size represented more than 75% of the estimated size of the six genomes (Table S1). The contig N50 of HDEM, OX-heart, Korso, line02-12_v2, and D134, which were assembled by the ONT and/or SMART technologies, is longer than that in To1000 and line02-12_v1 assembled by short reads (Figure 1a). In addition, we found the largest assembly genome size and the greatest number of protein-coding genes annotated in the OX-heart genome (Figure 1a; Table S1). To further assess the quality of the six genomes, we calculated their long terminal repeat (LTR) assembly index (LAI) scores. As a result, the HDEM genome has the highest LAI of 17.05. line02-12_v2, D134, OX-heart, and Korso have LAI values of 10.55, 10.47, 10.40, and 10.35, respectively. These five genomes are categorized at the reference genome level (10 ≤ LAI < 20). However, line02-12_v1 and To1000 are categorized at the draft genome level (0 ≤ LAI < 10) (Figure 1b). These two genomes were assembled mainly by short reads. Therefore, we selected HDEM as the reference genome for further study.

2.2. Gene Synteny and Phylogenetic Analysis of B. oleracea

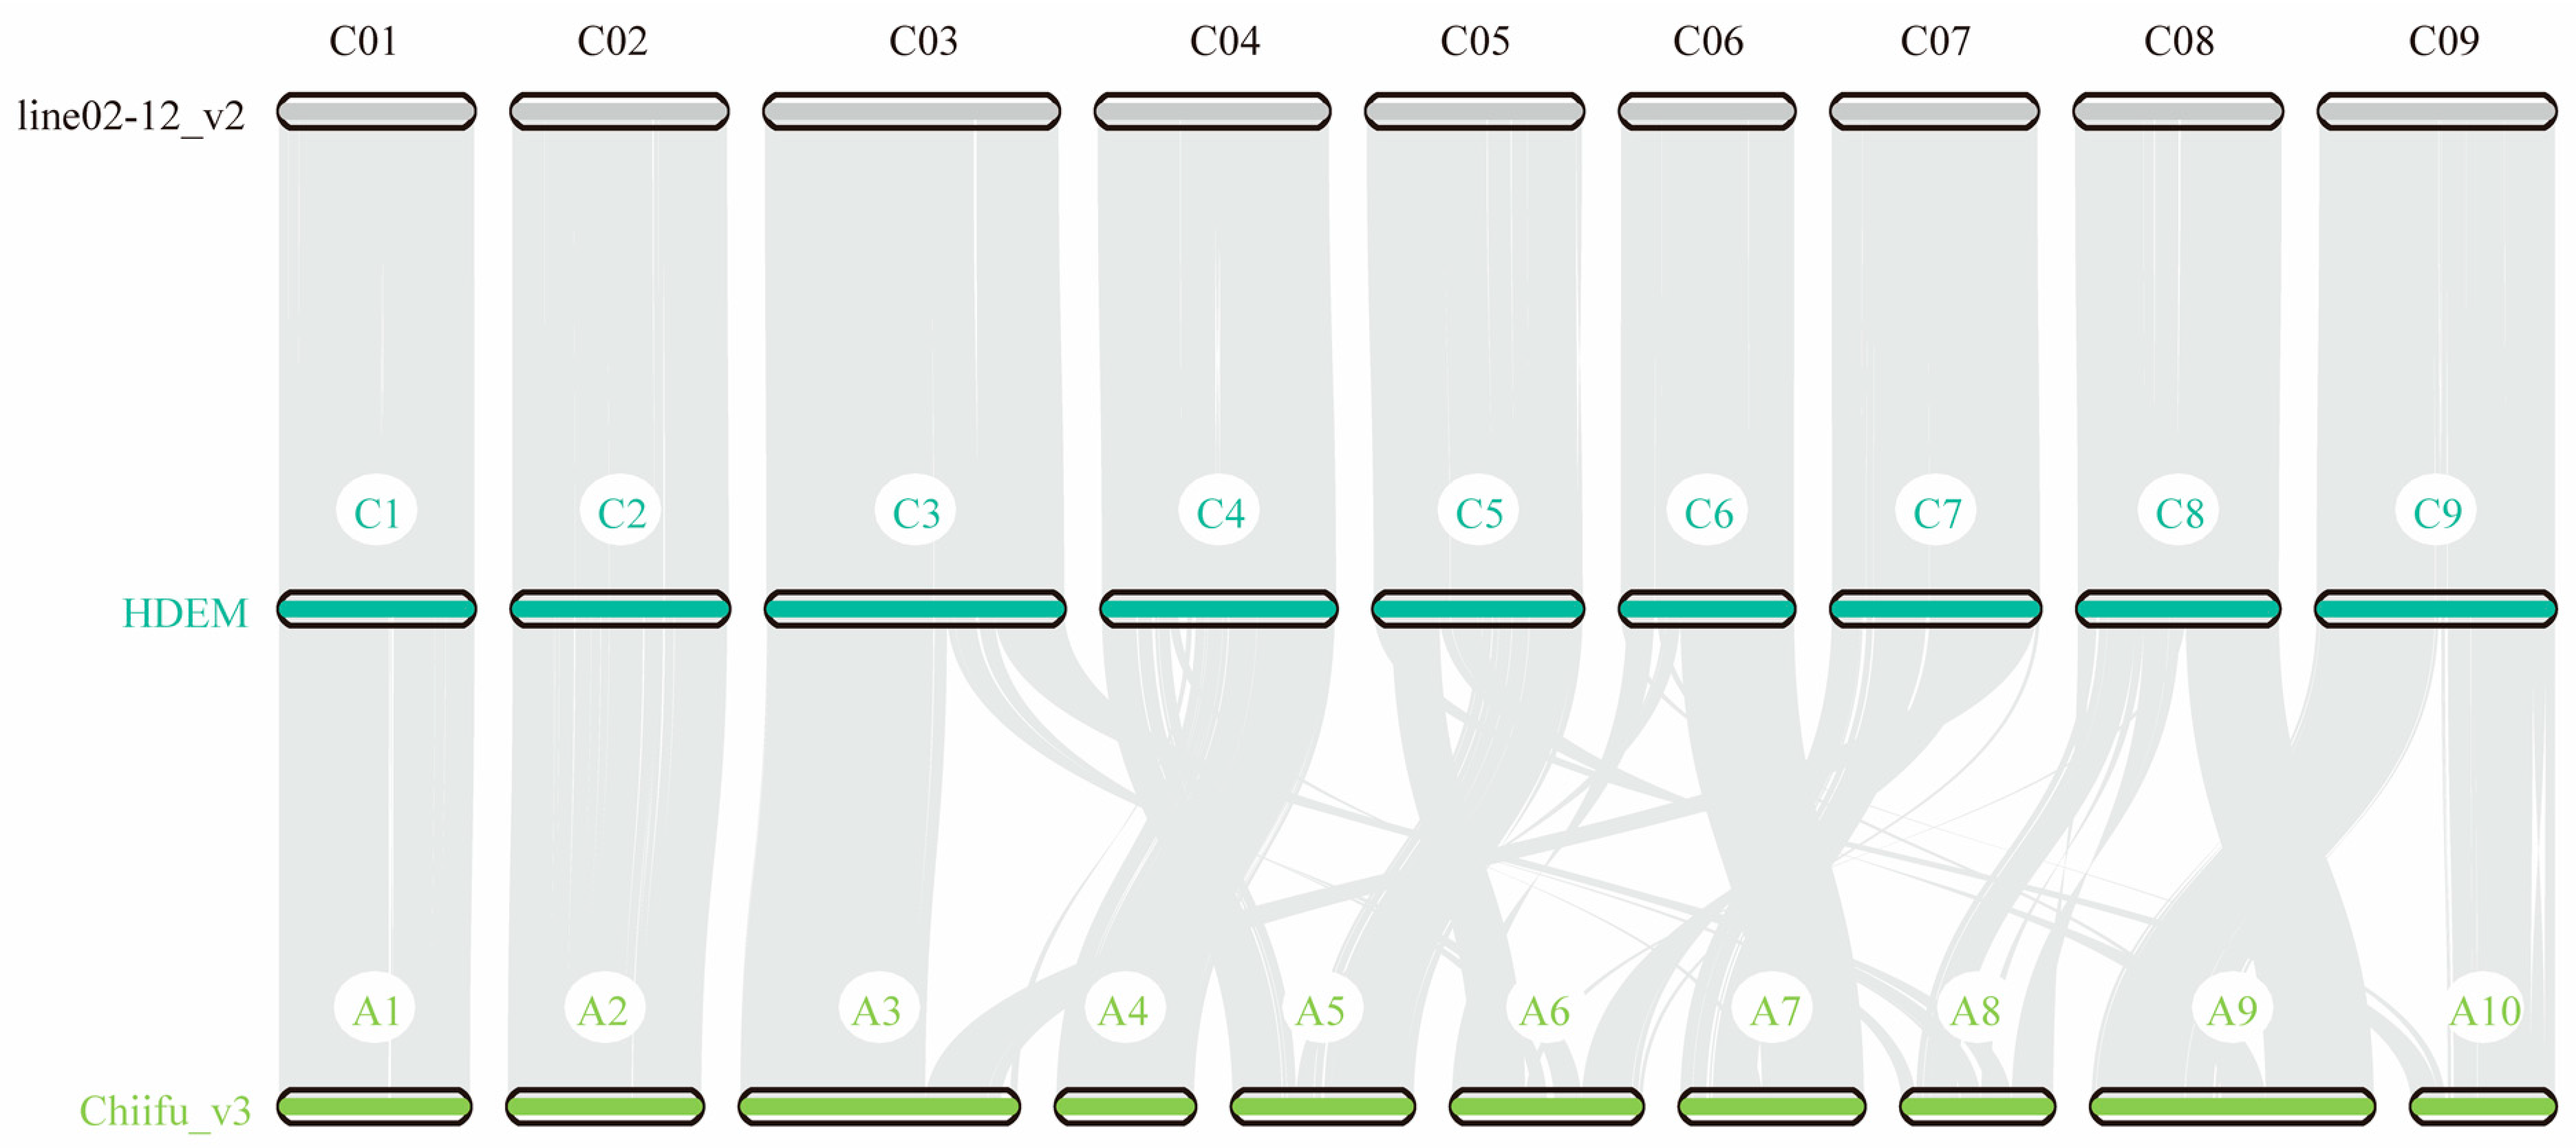
We collected six available B. oleracea accessions containing HDEM, OX-heart, Korso, line02-12_v2, D134, and To1000 (Table S1) and one B. rapa accession, Chiifu_v3, to detect syntenic blocks among seven genomes. As a consequence, there were 32,074–38,418 collinear gene pairs among the six B. oleracea genomes (CC) (Figure S1a–e). Meanwhile, we identified 29,066 collinear gene pairs in B. rapa Chiifu_v3 (AA) compared with B. oleracea HDEM (CC) (Figure S1f). These results suggest that there are more collinear gene pairs in intraspecies than in interspecies. Interestingly, we found that chromosomes C1 and C2 in B. oleracea (CC) share stronger collinearity with A01 and A02 in B. rapa (AA), respectively, than other chromosomes (Figure 2). It was also found between the AA and CC subgenomes in the allotetraploid B. napus (AACC) species [22].
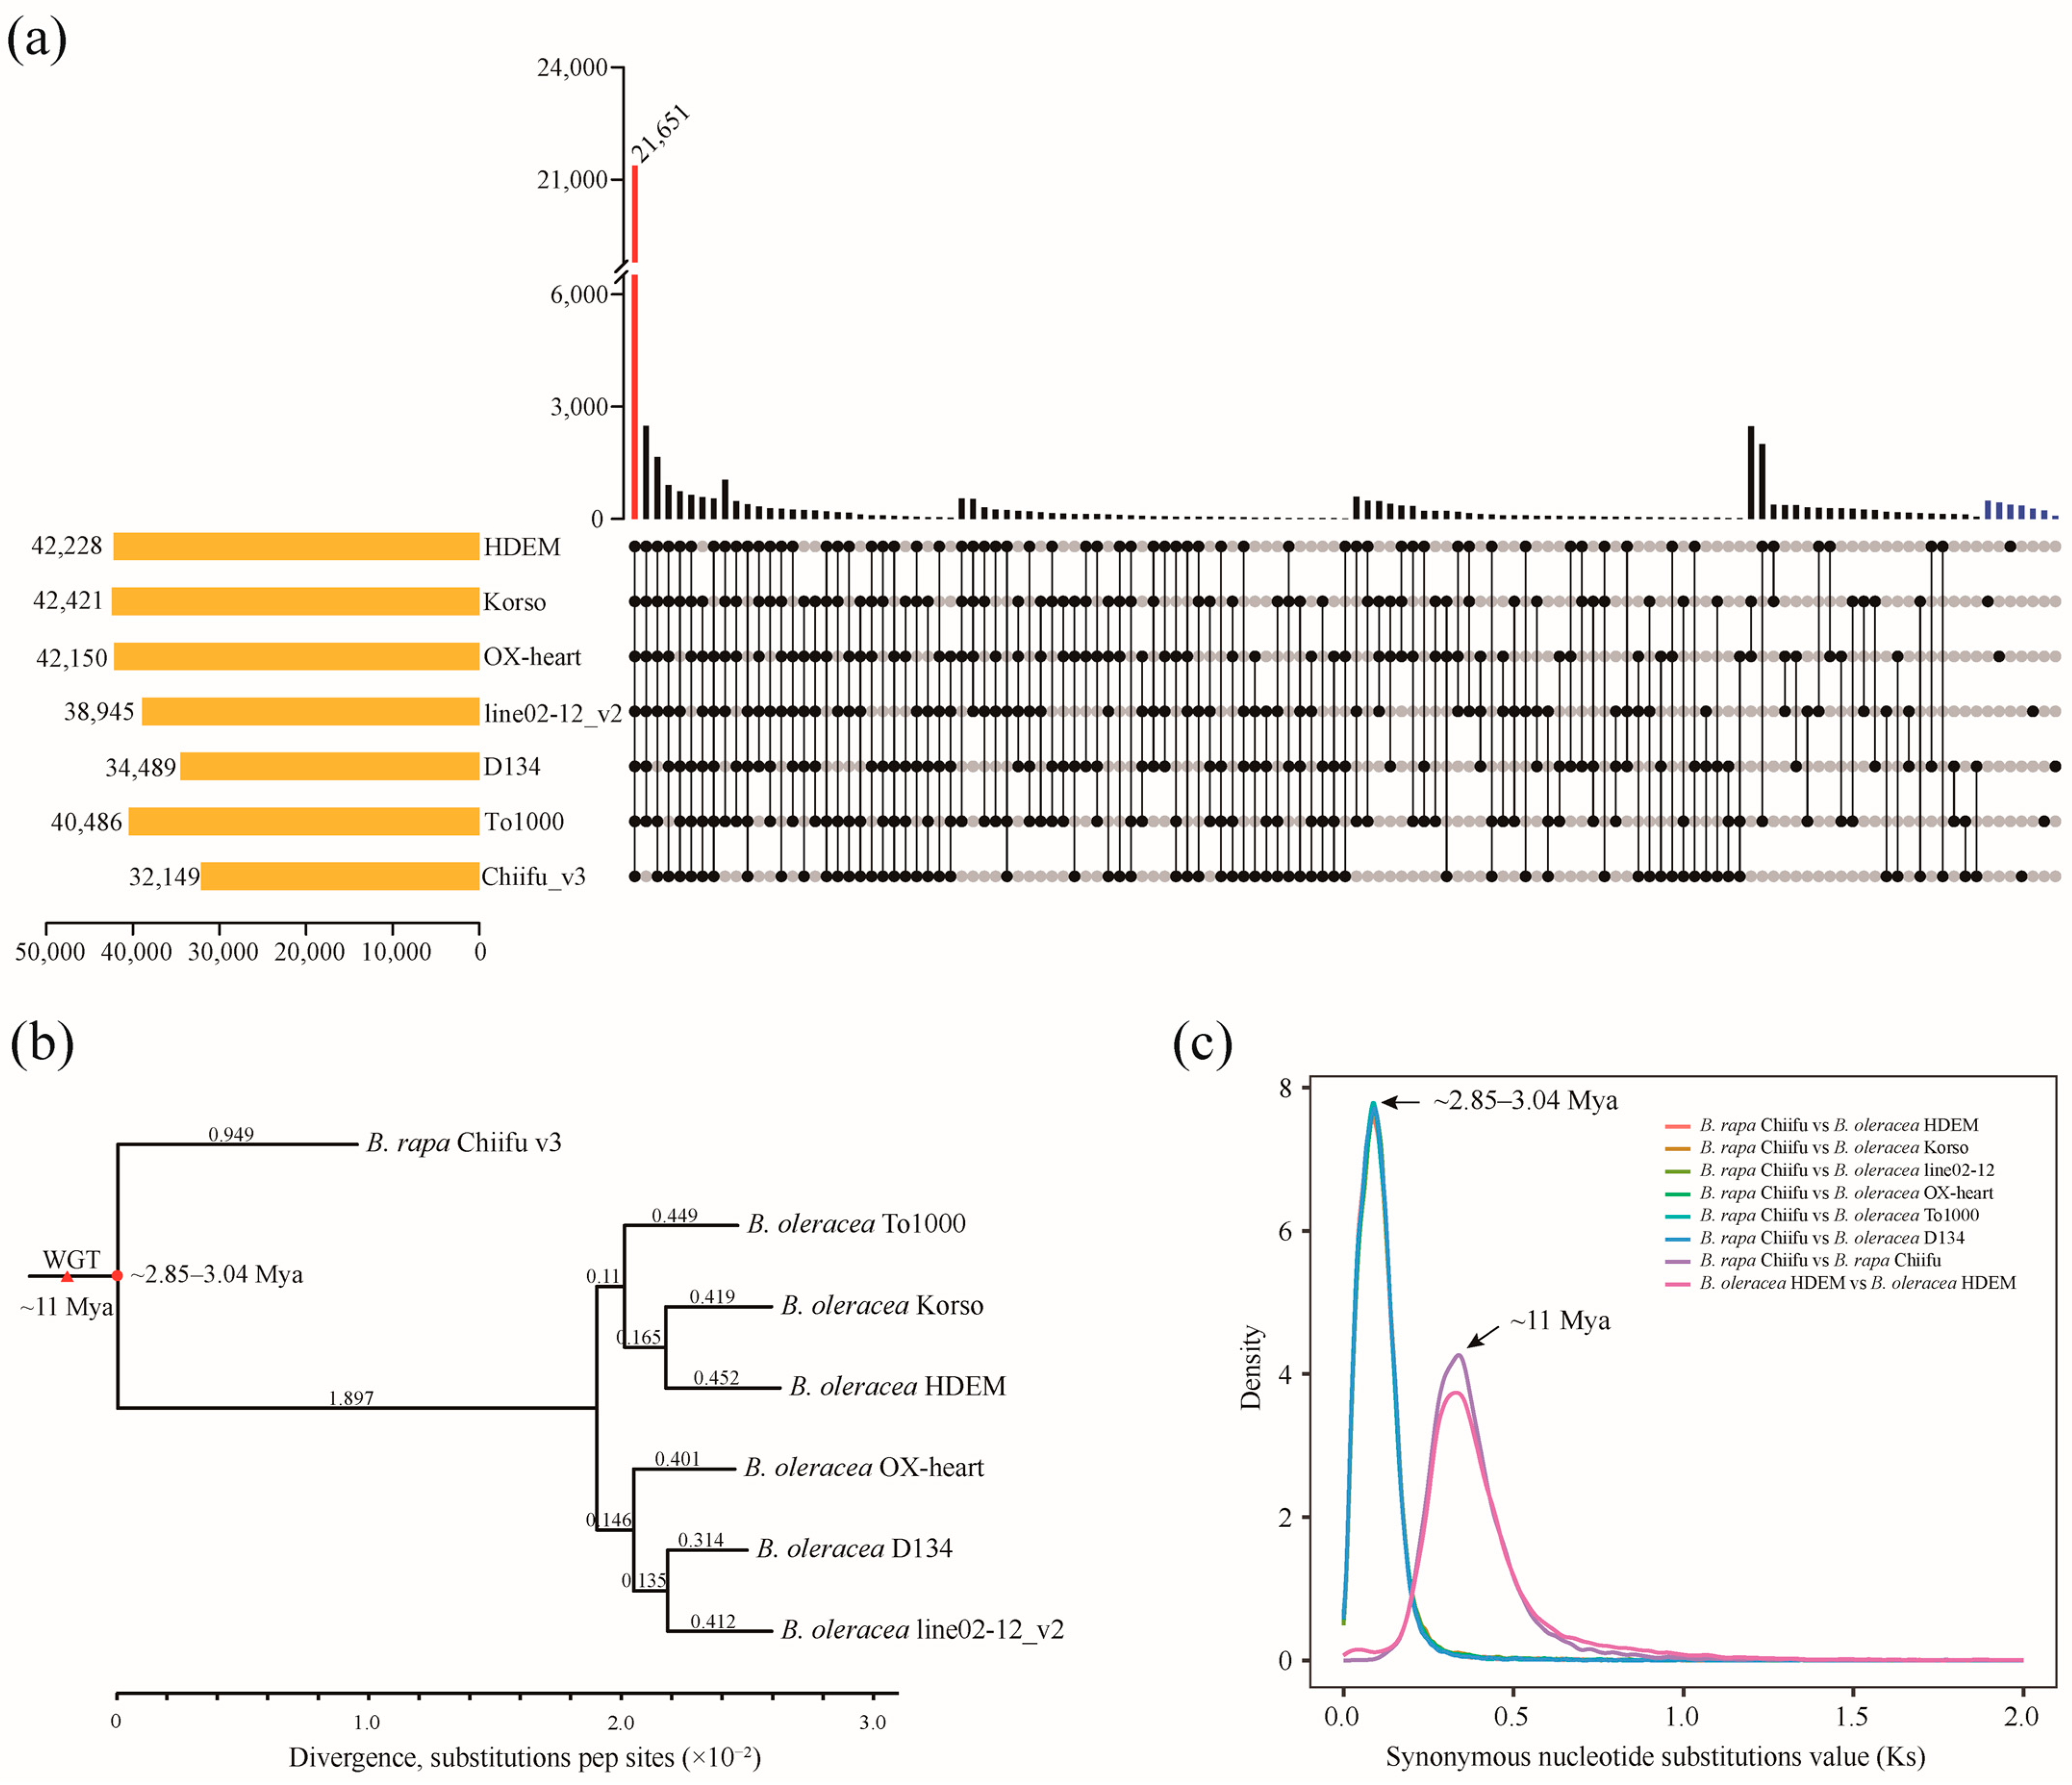
To evaluate the phylogenetic relationship of B. oleracea, we utilized the protein sequences of six B. oleracea genomes, including HDEM, OX-heart, Korso, line02-12_v2, D13, and To1000, as well as the B. rapa Chiifu_v3 genome (Figure 3a) to identify orthologous gene groups by OrthoFinder [23] (see Methods for details). A total of 388,559 (~95.1%) genes were clustered into 544,415 orthogroups in seven various plants (Table S2). Among these orthogroups, we identified 21,651 common orthogroups, including 70,412 genes, which was the greatest number in clustered orthogroups (Figure 3a; Tables S2 and S3). Furthermore, a phylogenetic tree was constructed for the seven Brassicaceae genomes using 10,950 single-copy orthologs genes, with B. rapa as an outgroup. As expected, Korso and HDEM, with a common curd trait, were clustered into one clade. OX-heart, D134, and line02-12, with a heading leaf trait, were clustered into another clade (Figure 3b). Two historical events can be observed clearly through synonymous substitution rate (Ks) analysis: a whole genome triplication (WGT) of Brassica species is estimated to have occurred approximately 11 million years ago (Mya) (Figure 3b,c; Table S4); the differentiation time between B. rapa and B. oleracea is ~2.85 to 3.04 Mya (Figure 3b,c; Table S4), displaying a divergence time between the AA and CC genomes of diploid Brassica plants.

2.3. Genomic Variation of Six B. oleracea Genomes

The genetic variation, including sequence and structural variations, among six B. oleracea genomes using HDEM as a reference genome were detected. Approximately 302.9–418.3 Mb (22,627–35,459) syntenic blocks (Figures S2 and S3a) of other accessions were anchored in the HDEM genome (Figure 4a; Table S5). In this block, we identified 20.5–31.7 Mb (5,119,342–6,524,666) sequence differences (Figure S3b), which included 4.04–4.99 × 10⁶ SNPs and 3.79–5.49 × 10⁶ InDels in each of the genomes (Figure 4b; Table S5). The InDels were most abundantly less than 500 bp (Figure S4). Then, we annotated the SNPs and InDels based on the annotation file of HDEM (Table S6). The SNP and InDels causing start loss, stop gain, stop loss, and frameshift of genes were regarded as large-effect variations. Notably, large-effect variations in Korso were less than in others using HDEM as a reference genome (Figure S5). This suggested that the cauliflower morphotype Korso is similar to the broccoli morphotype HDEM at the molecular level.
We also determined 132.3–152.5 Mb (95,167–177,059) SV regions among HDEM and other lines (Figure 4a and Figure S3; Table S5). Remarkably, we found that the accession of Korso belonging to cauliflower had the most syntenic regions and the least structural regions compared with the others. This implied that there is a low degree of differentiation between cauliflower and broccoli. In the SV regions, chromosome rearrangement events containing 12.3–36.6 Mb (175–229) inversions, 26.7–32.4 Mb (7354–15,382) translocations, and 21.1–62.7 Mb (19,470–24,326) duplications were recognized within each of the individual genomes (Figure 4a; Table S5). The lengths of inversions, translocations, and duplications ranged from 1 to 100 k (Figure S6). For instance, we detected a 58 kb inversion between Korso and OX-heart (Figure S7), which may be associated with complex domestication traits. These results highlighted the extensive SVs during the intraspecific diversification of the B. oleracea genome.

2.4. Structural Variations within Genes Associated with the Heading Trait of Cabbage

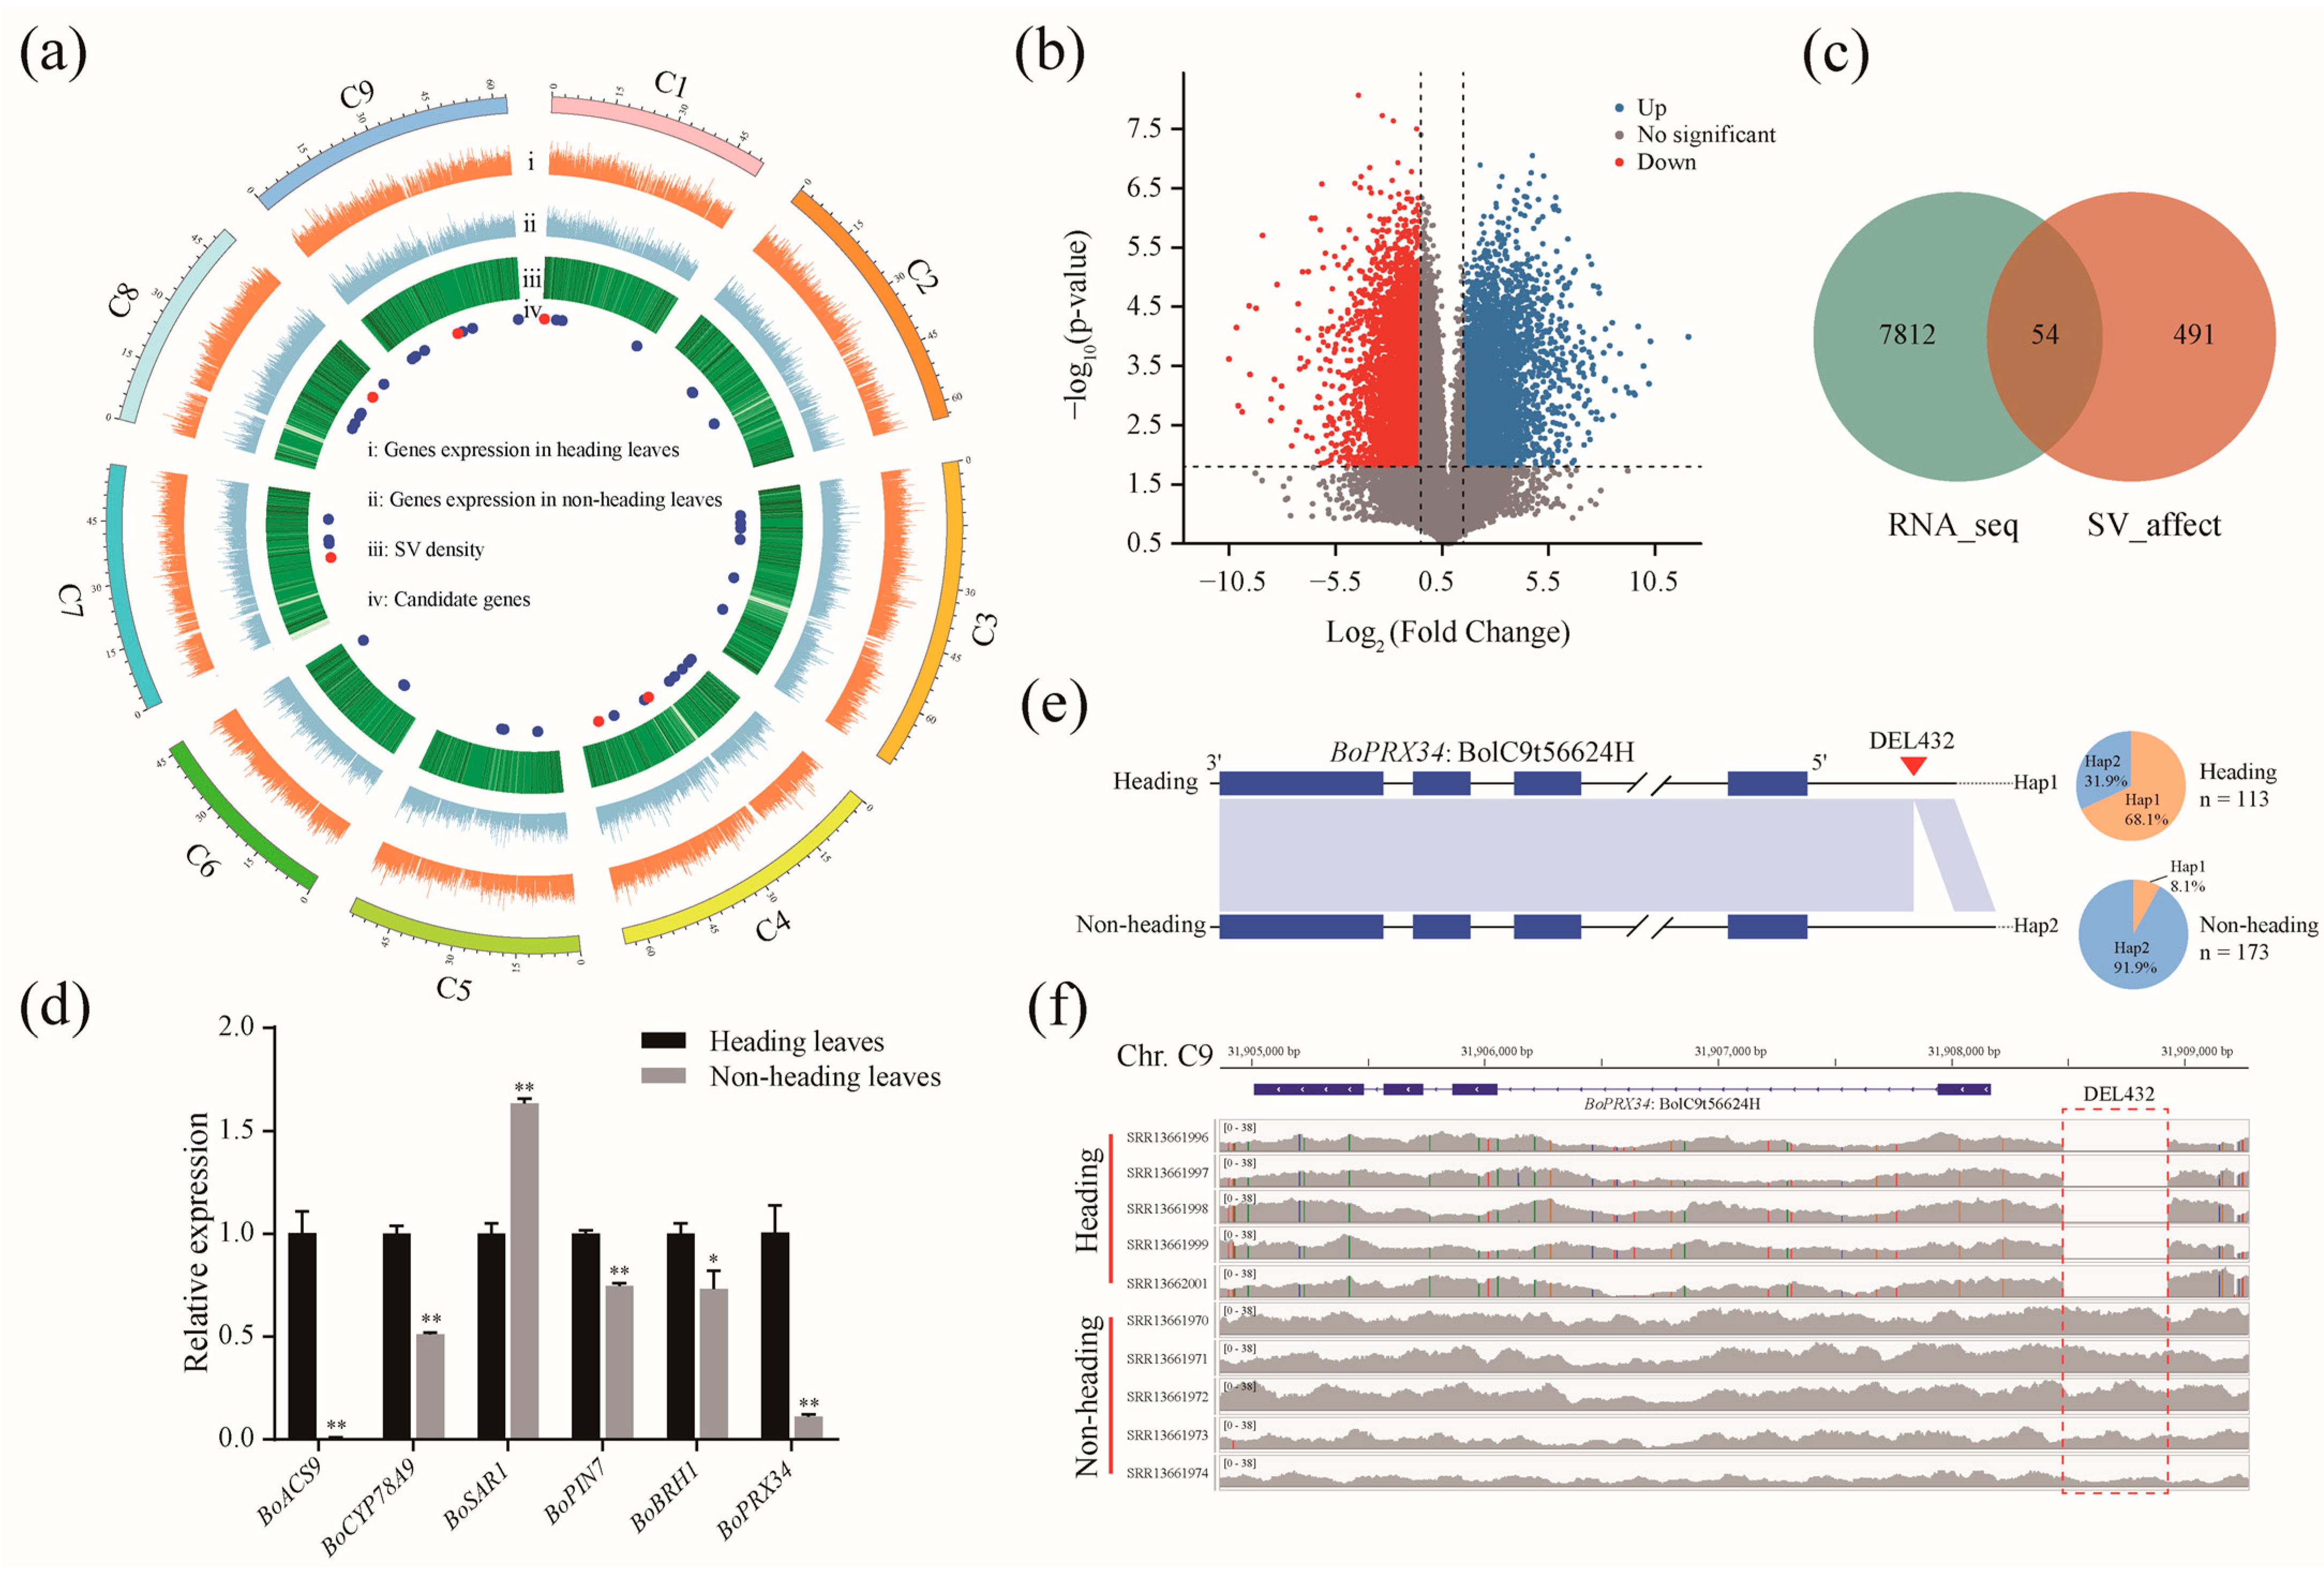
To identify the SVs responsible for the heading trait of cabbage, we downloaded short read data of 288 B. oleracea accessions, including 113 cabbage accessions with the heading trait and 173 other morphotype accessions with the non-heading trait (Table S7). Then, we carried out SV calling among 288 B. oleracea accessions using HDEM as the reference genome. We found 1205 SVs that might be related to the heading trait (Figure 5a) because the allele of these SVs was enriched in the cabbage morphotype. A total of 545 potential candidate genes near SVs were identified. In addition, we analyzed RNA-seq data from three biological replicates of heading and non-heading leaves of a cabbage accession named OX-heart (Figure 5b). A total of 7965 differentially expressed genes were identified between heading leaves and non-heading leaves (Figure 5b,c). By overlapping two gene sets of SV-affected and RNA-seq, we obtained 54 candidate genes that may be involved in heading trait formation (Figure 5c; Table S8). Fifty orthologous genes were detected in the Arabidopsis thaliana genome (Table S8). With the aid of gene function annotations of the A. thaliana genome and the tair website (TAIR—Home Page (arabidopsis.org)), we found that the BoPRX34, BoACS9, BoCYP78A9, BoSAR1, BoPIN7, and BoBRH1 genes are involved in cell elongation and phytohormones, which may play a crucial role in heading formation of B. oleracea (Table S9). Given the fact that the heading morphotype is a domestication trait, we performed selection analyses between cabbage (n = 113) and other morphology (n = 173) groups using pairwise fixation statistics (FST) values for six genes. We found that six genes were subjected to selection (Figure S8). Additionally, the result of qRT-PCR experiments shows the relative expression level of six genes was significantly different between heading leaves and non-heading leaves (Figure 5d). For the BoPRX34 gene, with homology to the PRX gene located in the cell wall and implicated in cell elongation in Arabidopsis [24], there is a 432 bp deletion downstream of BoPRX34 (Figure 5e,f). This haplotype accounted for 68.1% of the heading accessions but only 8.1% of the non-heading accessions (Figure 5e), suggesting that the 432 bp deletion was associated with the heading trait. In parallel, we identified a 945 bp duplication, 974 bp deletion, 742 kb insertion, 1941 bp deletion, and 1101 bp insertion in the BoACS9, BoCYP78A9, BoSAR1, BoPIN7, and BoBRH1 genes, respectively (Figure S9). The allele frequencies of these five variations varied significantly between the heading and non-heading populations (Figure S8). These results mean that the six candidate genes accompanied by SVs may be responsible for the heading trait of cabbage.

3. Discussion

With the assistance of new sequencing technology, several high-quality B. oleracea reference genomes have been released [1,15,16,18,19,25]. The reference genomes facilitated the study of the genome and pangenome of B. oleracea plants. For example, on the basis of the line02-12 genome, Cheng et al. [4] investigated the evolutionary relationships of B. oleracea by resequencing 119 different morphotypes of B. oleracea and identified important candidate genes involved in the leaf heading trait of cabbage and stem tuberous of kohlrabi. Similarly, using the To1000 genome, researchers performed RNA-seq sequencing of 224 various types of B. oleracea to explore the domestication and evolutionary history of B. oleracea [21]. In addition, with To1000 as a reference genome, Golicz et al. [26] constructed the first B. oleracea pangenome and elucidated that genes affected by presence/absence and copy number variation contributed to phenotypic diversity. Despite the proliferation of population genomics studies based on these genomes, a comprehensive comparative genomics analysis is lacking. Hence, we used chromosome-scale broccoli named HDEM as a reference genome, and other B. oleracea genomes were aligned to it to obtain genomic variation, including sequencing and structural variations. A total of 132.3–152.5 Mb (95,167–177,059) SVs were identified between six B. oleracea genomes, more than those in seven A. thaliana genomes, with only 12.6–17.0 Mb [27]. Considering the abundant diversity of B. oleracea, the vast SVs between B. oleracea genomes may be associated with morphotype domestication, similar to the SVs tracking B. rapa morphotype domestication [28]. Interestingly, we found 132.3 Mb (95,167) SVs between the HDEM and Korso genomes, which were less than those between HDEM and other morphotype genomes, and 418.3 Mb syntenic regions between the HDEM and Korso genomes, which were more than those in the other genomes. This implied that broccoli resembles cauliflower not in morphotype but at the molecular level. A phylogenetic relationship tree showed that cauliflower and broccoli were clustered into the same clade, meaning that they were less differentiated from each other, which supported the viewpoint that broccoli and cauliflower probably originated from the same place [2].
SVs have been reported to be responsible for many important agronomic traits, such as grain size in rice [29], flowering time in wheat [30], fruit shape in tomato [31], and plant architecture in cotton [32]. The heading leaf of cabbage is a typical trait for understanding the power of artificial selection in B. oleracea. Three candidate genes, BoKAN2.2, BoBRX.2, and BoATHB15.2, involved in heading leaf formation of B. oleracea, have been reported by exploring SNPs [4]. However, there are few studies of heading traits using SVs in B. oleracea. In this study, we identified six candidate genes by integrating SV calling in 288 B. oleracea accessions and transcriptome analysis between heading and non-heading leaves. By paring the genetic basis of these six genes, we found that they were all affected by SV, which caused changes in gene expression. Among them, we found that the BoPRX34 gene is orthologous to PRX34 in Arabidopsis. The PRX34 gene is a dominant-negative regulator of plant growth and development. It is located in the cell wall and involved in cell elongation [33,34]. Additionally, the PRX34 mutation causes larger leaves than wild-type leaves and a delayed senescence phenotype in Arabidopsis [24]. In addition, we discovered that the other five candidate genes affected by SVs were involved in hormone signaling. For example, ACS9 is an essential gene that acts within the ethylene biosynthetic process [35]. Its mutant increased mature plant height, reduced branching, reduced the number of rosette leaves, and decreased ethylene production in Arabidopsis [36]. The CYP78A9 gene encoding a cytochrome P450 monooxygenase is a dominant suppressor of brassinosteroid-responsive gene expression. It is involved in Arabidopsis reproductive development [37]. Overexpression of the CYP78A9 gene induces large and seedless fruit in Arabidopsis [38]. The suppressor of auxin resistance1 (SAR1) is a suppressor of the auxin resistance gene. Additionally, the loss of SAR1 protein results in a severe growth phenotype [39]. PIN7 is a modulator of auxin transport, resulting in a decrease in auxin transport from the root to the shoot [40,41]. Additionally, the brassinosteroid-responsive RING-H2 (BRH1) is a dominant gene involved in brassinosteroid-mediated signaling pathway and altered leaf shapes in Arabidopsis [42,43]. These results provide novel insight into the B. oleracea plant development.

4. Materials and Methods

4.1. Long Terminal Repeat (LTR) Assembly Index (LAI) Calculation

To evaluate the quality of the six B. oleracea genomes, we calculated the LAI in HDEM [16], line02-12_v2 [18], OX-heart_923 [19], Korso_1401 [19], D134 [25], To1000 [15], and line02-12_v1 [1]. Briefly, the LTR retrotransposons of six genomes were identified using LTR_FINDER (v1.07) [44] with the following parameters: -D 15,000 -d 1000 -L 7000 -l 100 -p 20 -C -m 0.9 and LTRharvest (v1.6.1) [45] with the parameters setting: -similar 85 -vic 10 -seed 20 -seqids yes -minlenltr 100 -maxlenltr 7000 -mintsd 4 -maxtsd 6 -motif TGCA -motifmis 1. Subsequently, high-confidence full-length LTR retrotransposons (LTR-RTs) were extracted by LTR_retriever (v2.8) software [46] using the output file from LTR_FINDER [44] and LTRharvest [45]. Then, the final file “*.out.LAI ” provided detailed information on the LAI of the whole genome and each chromosome.

4.2. Synteny and Ks Analysis

To identify syntenic blocks, the CDSs from B. rapa Chiifu_v3 [47] and B. oleracea encompassing HDEM [16], OX-heart_923 [19], Korso_1401 [19], line02-12_v2 [18], D134 [25], and To1000 [15] were used to conduct all-against-all LAST (v1021) [48] between inter- and intraspecies. Based on the LAST [48] results, syntenic regions were discerned using JCVI (v0.9.14) [49]. The dot plots between B. oleracea and B. rapa were also drawn by JCVI [49]. The synonymous substitution rates (Ks) values with the NG86 model of homologous gene pairs within each collinear block were calculated by WGDI [50], a useful toolkit for evolutionary analyses. Then, Ks values of all pairwise genes were plotted by the ggplot2 package (v3.2.0) [51] in R software (https://www.r-project.org/, accessed on 26 June 2022, version 3.6.1). Generally, the peak of intraspecific Ks corresponds to genome duplication events, and the peak of interspecies Ks corresponds to divergence events. Brassica plants were reported to have experienced a specific whole genome triplication (WGT) event [1,12,52], and the value of synonymous replacement rate (r) is 1.5 × 10⁻⁸ mutations site/year in Brassica plants described in previous research [53]. Subsequently, the time of WGT and differentiation was estimated using the formula T = Ks peak/2r.

4.3. Gene Family Cluster and Phylogenetic Analysis of B. oleracea

We used the protein-coding genes Chiifu_v3 [47], Korso_1401 [19], OX-heart_923 [19], HDEM [16], D134 [25], line02-12_v2 [18], and To1000 [15] from the Brassica database (BRAD V3.0) [54] to construct orthogroups by OrthoFinder [23]. In detail, the longest isoform of each gene among the seven species was extracted by the Fasta Get Representative procedure of TBtools (v1.09876), which was further compared using the blast fast tool Diamond (v0.8.22.84) [55]. Then, the Markov cluster algorithm (MCL) [56] was used to cluster genes into orthogroups. From the clustering results, the protein sequences of single-copy genes were aligned using MAFFT (v7.475) [57]. Subsequently, the multiple sequence alignment was optimized by Gblocks (v0.91b) [58]. The phylogenetic tree was constructed using RAxML (v8.2.12) [59] with the following parameters “-f a -x 12345 -p 12345 -N 1000 -m PROTGAMMAAUTO -T 20”. The tree was drawn using the user-friendly tool iTOL [60] (https://itol.embl.de/, accessed on 21 June 2022).

4.4. Genomic Variations Identification

All five Brassica oleracea (CC) genomes, containing OX-heart_923 [19], Korso_1401 [19], line02-12_v2 [18], To1000 [15], and D134 [25], were aligned to the HDEM [16] genome using MUMmer (v4.0) [61] with the parameters: --mum -c 100 -b 500 -l 50 -t 10. Then, the results of the raw alignments were filtered using a “delta-filter” with the following parameters: -m -i 90 -l 100. Furthermore, the “show-coords” function with the “-THrd” setting was used to transform the filter to standard files with coordinates for the next input. Then, we used Synteny and Rearrangement Identifier (SyRI) (v1.4) [62], with default parameters, to detect genomic variations. The genomic variations from SyRI [62] comprise sequence differences and structural differences. The sequence differences included SNPs, InDels, CNVs, highly diverged, and tandem repeats, and the SNPs and InDels were used for further analysis. The structural differences contain inversions, translocations, duplications, and genome-specific differences.

4.5. Genomic Variation Annotation

First, we downloaded the annotated file and genomic sequences of HDEM [16] (https://www.genoscope.cns.fr/externe/plants/chromosomes.html, accessed on 31 October 2021), and then we fixed the annotated file using the “GXF Fix” function of TBtools (v1.09876) [63] for ANNOVAR software (latest version) [64]. Three steps were used to build a database of HDEM: (1) transforming the gff file to gtf file using gffread (v0.11.6) [65]; (2) converting the gtf file to genePred file using gtfToGenePred (http://hgdownload.cse.ucsc.edu/admin/exe/linux.x86_64/gtfToGenePred, accessed on 29 June 2022); (3) constructing the refGene using a retrieve_seq_from_fasta.pl script of ANNOVAR [64]. Finally, the VCF files generated by SyRI (v1.4) software [62] were annotated directly by two scripts of ANNOVAR [64]: convert2annovar.pl and table_annovar.pl.

4.6. Identification of SVs Involved in Heading Trait

To identify high-quality SVs, we mapped the Illumina reads of 288 different morphotype B. oleracea accessions to the reference HDEM genome using BWA (v0.7.12-r1039) [66] with the following parameters: bwa mem. Then, two software programs, smoove (v0.2.8) (https://github.com/brentp/smoove, accessed on 19 August 2022) and DELLY (v1.1.3) [67], were used to perform SV calling. To improve the accuracy, the SVs detected by both tools were retained. Finally, we merged and filtered the SVs using SURVIVOR (v1.0.7) [68] with the following parameters: SURVIVOR merge 1000 2 1 1 0 50. We characterized the SVs related to the heading trait by comparing the allele frequency in cabbage and other morphotype populations. The SVs with allele frequencies in the heading population that were 2.5 or 0.4 times that in the non-heading populations were considered putative SVs that may be related to the heading trait of cabbage. The FST values were calculated manually between cabbage and others morphotype groups.

4.7. RNA-Seq Analysis

The raw RNA-seq data of heading and non-heading leaves from a cabbage accession named OX-heart [19] were downloaded from the National Center for Biotechnology Information (NCBI) (https://www.ncbi.nlm.nih.gov/, accessed on 10 April 2022). The data were used to predict and annotate the protein-coding genes of the OX-heart genome in a previous study [19]. Three biological repetitions of non-heading leaves included 7.0 Gb of raw data, and the numbers of SRRs are SRR13759385, SRR13759402, and SRR13759403. Three biological repetitions of heading leaves included 6.2 Gb raw data, and the numbers of SRRs are SRR13759388, SRR13759387, and SRR13759386. The clean data filtered from two types of leaves were mapped to the B. oleracea HDEM reference genome with hisat2 (v2.2.1) [69] using the default parameters. Then, the mapped reads in SAM format were converted into BAM format and sorted using SAMtools (v1.4.1) [70]. The read count value was calculated by htseq-count (v0.13.5), a subfunction of HTSeq (v2.0) [71]. The gene-level relative abundances in several fragments per kilobase per million (FPKM) values were determined by a Perl script. Differentially expressed genes between the two groups were identified using DESeq [72] based on p  ≤  0.05 and |log2 Fold Change|  ≥  1.

4.8. RNA Extraction and Quantitative Real-Time (qRT)-PCR

Total RNA from heading and non-heading leaves of B. oleracea var. capitata (cabbage) were isolated using TransZol (TRAN, Beijing, China). Reverse transcription was performed using a HiScript II Q RT SuperMix for qPCR (+gDNA wiper) kit (Vazyme, Nanjing, China). qRT-PCR was performed using LightCycler 480 High-Resolution Melting Master Mix (Roche, Switzerland) following the manufacturers’ instructions on a Roche LC 480 machine. Relative gene expression levels were calculated using the 2−∆∆Ct method [73]. The primer pairs used in the qPCR experiment are shown in Supplementary Table S10.

5. Conclusions

In this study, we conducted a comprehensive comparative genetic analysis among six B. oleracea and identified extensive SVs by comparative population genomics. By analyzing these valuable SVs, we identified six important genes involved in the heading trait of cabbage. The RNA-seq and qRT-PCR experiments give further validation of six identified genes. These six genes could be used for developing molecular markers linked to heading traits for further marker-assisted selection (MAS) in Brassica crops.

Supplementary Materials

The following supporting information can be downloaded at: https://www.mdpi.com/article/10.3390/ijms24044063/s1.

Author Contributions

X.W. conceived and designed the study. G.J. performed the data analysis. Y.L. performed the experiments. G.J. wrote the manuscript. J.W., F.Z. and X.W. revised the manuscript. J.S., G.C., G.Y., L.L., H.L. and Q.H. provided suggestions and comments for genomic analyses. All authors have read and agreed to the published version of the manuscript.

Funding

This work was supported by the Agricultural Science and Technology Innovation Project (CAAS-ZDRW202105), the Key Research and Development project of Hubei Province (grant No. 2021BBA102), and the Germplasm Resources Protection Project in China (grant No. 19221888).

Institutional Review Board Statement

Not applicable.

Informed Consent Statement

Not applicable.

Data Availability Statement

Not applicable.

Conflicts of Interest

The authors declare no competing interest.

References

  1. Liu, S.; Liu, Y.; Yang, X.; Tong, C.; Edwards, D.; Parkin, I.A.P.; Zhao, M.; Ma, J.; Yu, J.; Huang, S.; et al. The Brassica oleracea genome reveals the asymmetrical evolution of polyploid genomes. Nat. Commun. 2014, 5, 3930. [Google Scholar] [CrossRef] [PubMed] [Green Version]
  2. Quiros, C.F.; Farnham, M.W. The Genetics of Brassica oleracea. In Genetics and Genomics of the Brassicaceae; Schmidt, R., Bancroft, I., Eds.; Springer: New York, NY, USA, 2011; pp. 261–289. [Google Scholar]
  3. Lv, H.; Wang, Q.; Zhang, Y.; Yang, L.; Fang, Z.; Wang, X.; Liu, Y.; Zhuang, M.; Lin, Y.; Yu, H.; et al. Linkage map construction using InDel and SSR markers and QTL analysis of heading traits in Brassica oleracea var. capitata L. Mol. Breed. 2014, 34, 87–98. [Google Scholar] [CrossRef]
  4. Cheng, F.; Sun, R.; Hou, X.; Zheng, H.; Zhang, F.; Zhang, Y.; Liu, B.; Liang, J.; Zhuang, M.; Liu, Y.; et al. Subgenome parallel selection is associated with morphotype diversification and convergent crop domestication in Brassica rapa and Brassica oleracea. Nat. Genet. 2016, 48, 1218–1224. [Google Scholar] [CrossRef] [PubMed]
  5. Lv, H.; Wang, Q.; Liu, X.; Han, F.; Fang, Z.; Yang, L.; Zhuang, M.; Liu, Y.; Li, Z.; Zhang, Y. Whole-Genome Mapping Reveals Novel QTL Clusters Associated with Main Agronomic Traits of Cabbage (Brassica oleracea var. capitata L.). Front. Plant Sci. 2016, 7, 989. [Google Scholar] [CrossRef] [PubMed] [Green Version]
  6. Huang, X.; Wei, X.; Sang, T.; Zhao, Q.; Feng, Q.; Zhao, Y.; Li, C.; Zhu, C.; Lu, T.; Zhang, Z.; et al. Genome-wide association studies of 14 agronomic traits in rice landraces. Nat. Genet. 2010, 42, 961–967. [Google Scholar] [CrossRef]
  7. Si, L.; Chen, J.; Huang, X.; Gong, H.; Luo, J.; Hou, Q.; Zhou, T.; Lu, T.; Zhu, J.; Shangguan, Y.; et al. OsSPL13 controls grain size in cultivated rice. Nat. Genet. 2016, 48, 447–456. [Google Scholar] [CrossRef]
  8. Shang, L.; Li, X.; He, H.; Yuan, Q.; Song, Y.; Wei, Z.; Lin, H.; Hu, M.; Zhao, F.; Zhang, C.; et al. A super pan-genomic landscape of rice. Cell Res. 2022, 32, 878–896. [Google Scholar] [CrossRef]
  9. Jiao, Y.; Peluso, P.; Shi, J.; Liang, T.; Stitzer, M.C.; Wang, B.; Campbell, M.S.; Stein, J.C.; Wei, X.; Chin, C.-S.; et al. Improved maize reference genome with single-molecule technologies. Nature 2017, 546, 524–527. [Google Scholar] [CrossRef]
  10. Fang, L.; Wang, Q.; Hu, Y.; Jia, Y.; Chen, J.; Liu, B.; Zhang, Z.; Guan, X.; Chen, S.; Zhou, B.; et al. Genomic analyses in cotton identify signatures of selection and loci associated with fiber quality and yield traits. Nat. Genet. 2017, 49, 1089–1098. [Google Scholar] [CrossRef]
  11. Du, X.; Huang, G.; He, S.; Yang, Z.; Sun, G.; Ma, X.; Li, N.; Zhang, X.; Sun, J.; Liu, M.; et al. Resequencing of 243 diploid cotton accessions based on an updated A genome identifies the genetic basis of key agronomic traits. Nat. Genet. 2018, 50, 796–802. [Google Scholar] [CrossRef]
  12. Chalhoub, B.; Denoeud, F.; Liu, S.; Parkin, I.A.P.; Tang, H.; Wang, X.; Chiquet, J.; Belcram, H.; Tong, C.; Samans, B.; et al. Early allopolyploid evolution in the post-Neolithic Brassica napus oilseed genome. Science 2014, 345, 950–953. [Google Scholar] [CrossRef] [Green Version]
  13. An, H.; Qi, X.; Gaynor, M.L.; Hao, Y.; Gebken, S.C.; Mabry, M.E.; McAlvay, A.C.; Teakle, G.R.; Conant, G.C.; Barker, M.S.; et al. Transcriptome and organellar sequencing highlights the complex origin and diversification of allotetraploid Brassica napus. Nat. Commun. 2019, 10, 2878. [Google Scholar] [CrossRef] [PubMed] [Green Version]
  14. Hu, J.; Chen, B.; Zhao, J.; Zhang, F.; Xie, T.; Xu, K.; Gao, G.; Yan, G.; Li, H.; Li, L.; et al. Genomic selection and genetic architecture of agronomic traits during modern rapeseed breeding. Nat. Genet. 2022, 54, 694–704. [Google Scholar] [CrossRef] [PubMed]
  15. Parkin, I.A.P.; Koh, C.; Tang, H.; Robinson, S.J.; Kagale, S.; Clarke, W.E.; Town, C.D.; Nixon, J.; Krishnakumar, V.; Bidwell, S.L.; et al. Transcriptome and methylome profiling reveals relics of genome dominance in the mesopolyploid Brassica oleracea. Genome Biol. 2014, 15, R77. [Google Scholar] [CrossRef] [Green Version]
  16. Belser, C.; Istace, B.; Denis, E.; Dubarry, M.; Baurens, F.-C.; Falentin, C.; Genete, M.; Berrabah, W.; Chèvre, A.-M.; Delourme, R.; et al. Chromosome-scale assemblies of plant genomes using nanopore long reads and optical maps. Nat. Plants 2018, 4, 879–887. [Google Scholar] [CrossRef] [PubMed]
  17. Pendleton, M.; Sebra, R.; Pang, A.W.C.; Ummat, A.; Franzen, O.; Rausch, T.; Stütz, A.M.; Stedman, W.; Anantharaman, T.; Hastie, A.; et al. Assembly and diploid architecture of an individual human genome via single-molecule technologies. Nat. Methods 2015, 12, 780–786. [Google Scholar] [CrossRef] [PubMed]
  18. Cai, X.; Wu, J.; Liang, J.; Lin, R.; Zhang, K.; Cheng, F.; Wang, X. Improved Brassica oleracea JZS assembly reveals significant changing of LTR-RT dynamics in different morphotypes. Theor. Appl. Genet. 2020, 133, 3187–3199. [Google Scholar] [CrossRef]
  19. Guo, N.; Wang, S.; Gao, L.; Liu, Y.; Wang, X.; Lai, E.; Duan, M.; Wang, G.; Li, J.; Yang, M.; et al. Genome sequencing sheds light on the contribution of structural variants to Brassica oleracea diversification. BMC Biol. 2021, 19, 93. [Google Scholar] [CrossRef]
  20. Cai, C.; Bucher, J.; Bakker, F.T.; Bonnema, G. Evidence for two domestication lineages supporting a middle-eastern origin for Brassica oleracea crops from diversified kale populations. Hortic. Res. 2022, 9, uhac033. [Google Scholar] [CrossRef]
  21. Mabry, M.E.; Turner-Hissong, S.D.; Gallagher, E.Y.; McAlvay, A.C.; An, H.; Edger, P.P.; Moore, J.D.; Pink, D.A.C.; Teakle, G.R.; Stevens, C.J.; et al. The evolutionary history of wild, domesticated, and feral Brassica oleracea (Brassicaceae). Mol. Biol. Evol. 2021, 38, 4419–4434. [Google Scholar] [CrossRef]
  22. Higgins, E.E.; Howell, E.C.; Armstrong, S.J.; Parkin, I.A.P. A major quantitative trait locus on chromosome A9, BnaPh1, controls homoeologous recombination in Brassica napus. New Phytol. 2021, 229, 3281–3293. [Google Scholar] [CrossRef]
  23. Emms, D.M.; Kelly, S. OrthoFinder: Solving fundamental biases in whole genome comparisons dramatically improves orthogroup inference accuracy. Genome Biol. 2015, 16, 157. [Google Scholar] [CrossRef] [PubMed] [Green Version]
  24. Daudi, A.; Cheng, Z.; O’Brien, J.A.; Mammarella, N.; Khan, S.; Ausubel, F.M.; Bolwell, G.P. The Apoplastic Oxidative Burst Peroxidase in Arabidopsis Is a Major Component of Pattern-Triggered Immunity. Plant Cell 2012, 24, 275–287. [Google Scholar] [CrossRef] [PubMed] [Green Version]
  25. Lv, H.; Wang, Y.; Han, F.; Ji, J.; Fang, Z.; Zhuang, M.; Li, Z.; Zhang, Y.; Yang, L. A high-quality reference genome for cabbage obtained with SMRT reveals novel genomic features and evolutionary characteristics. Sci. Rep. 2020, 10, 12394. [Google Scholar] [CrossRef] [PubMed]
  26. Golicz, A.A.; Bayer, P.E.; Barker, G.C.; Edger, P.P.; Kim, H.; Martinez, P.A.; Chan, C.K.K.; Severn-Ellis, A.; McCombie, W.R.; Parkin, I.A.P.; et al. The pangenome of an agronomically important crop plant Brassica oleracea. Nat. Commun. 2016, 7, 13390. [Google Scholar] [CrossRef] [Green Version]
  27. Jiao, W.-B.; Schneeberger, K. Chromosome-level assemblies of multiple Arabidopsis genomes reveal hotspots of rearrangements with altered evolutionary dynamics. Nat. Commun. 2020, 11, 989. [Google Scholar] [CrossRef] [Green Version]
  28. Cai, X.; Chang, L.; Zhang, T.; Chen, H.; Zhang, L.; Lin, R.; Liang, J.; Wu, J.; Freeling, M.; Wang, X. Impacts of allopolyploidization and structural variation on intraspecific diversification in Brassica rapa. Genome Biol. 2021, 22, 166. [Google Scholar] [CrossRef]
  29. Wang, Y.; Xiong, G.; Hu, J.; Jiang, L.; Yu, H.; Xu, J.; Fang, Y.; Zeng, L.; Xu, E.; Xu, J.; et al. Copy number variation at the GL7 locus contributes to grain size diversity in rice. Nat. Genet. 2015, 47, 944–948. [Google Scholar] [CrossRef]
  30. Diaz, A.; Zikhali, M.; Turner, A.S.; Isaac, P.; Laurie, D.A. Copy number variation affecting the Photoperiod-B1 and Vernalization-A1 genes is associated with altered flowering time in wheat (Triticum aestivum). PLoS ONE 2012, 7, e33234. [Google Scholar] [CrossRef] [Green Version]
  31. Xiao, H.; Jiang, N.; Schaffner, E.; Stockinger Eric, J.; van der Knaap, E. A Retrotransposon-Mediated Gene Duplication Underlies Morphological Variation of Tomato Fruit. Science 2008, 319, 1527–1530. [Google Scholar] [CrossRef]
  32. Ji, G.; Liang, C.; Cai, Y.; Pan, Z.; Meng, Z.; Li, Y.; Jia, Y.; Miao, Y.; Pei, X.; Gong, W.; et al. A copy number variant at the HPDA-D12 locus confers compact plant architecture in cotton. New Phytol. 2021, 229, 2091–2103. [Google Scholar] [CrossRef] [PubMed]
  33. Kámán-Tóth, E.; Dankó, T.; Gullner, G.; Bozsó, Z.; Palkovics, L.; Pogány, M. Contribution of cell wall peroxidase- and NADPH oxidase-derived reactive oxygen species to Alternaria brassicicola-induced oxidative burst in Arabidopsis. Mol. Plant Pathol. 2019, 20, 485–499. [Google Scholar] [CrossRef] [PubMed] [Green Version]
  34. Han, S.; Fang, L.; Ren, X.; Wang, W.; Jiang, J. MPK6 controls H2O2-induced root elongation by mediating Ca2+ influx across the plasma membrane of root cells in Arabidopsis seedlings. New Phytol. 2015, 205, 695–706. [Google Scholar] [CrossRef] [PubMed]
  35. Chae, H.S.; Faure, F.; Kieber, J.J. The eto1, eto2, and eto3 Mutations and Cytokinin Treatment Increase Ethylene Biosynthesis in Arabidopsis by Increasing the Stability of ACS Protein. Plant Cell 2003, 15, 545–559. [Google Scholar] [CrossRef] [PubMed] [Green Version]
  36. Tsuchisaka, A.; Yu, G.; Jin, H.; Alonso, J.M.; Ecker, J.R.; Zhang, X.; Gao, S.; Theologis, A. A Combinatorial Interplay Among the 1-Aminocyclopropane-1-Carboxylate Isoforms Regulates Ethylene Biosynthesis in Arabidopsis thaliana. Genetics 2009, 183, 979–1003. [Google Scholar] [CrossRef] [PubMed] [Green Version]
  37. Sotelo-Silveira, M.; Cucinotta, M.; Chauvin, A.-L.; Chávez Montes, R.A.; Colombo, L.; Marsch-Martínez, N.; de Folter, S. Cytochrome P450 CYP78A9 Is Involved in Arabidopsis Reproductive Development. Plant Physiol. 2013, 162, 779–799. [Google Scholar] [CrossRef] [Green Version]
  38. Ito, T.; Meyerowitz, E.M. Overexpression of a Gene Encoding a Cytochrome P450, CYP78A9, Induces Large and Seedless Fruit in Arabidopsis. Plant Cell 2000, 12, 1541–1550. [Google Scholar] [CrossRef] [PubMed] [Green Version]
  39. Parry, G.; Ward, S.; Cernac, A.; Dharmasiri, S.; Estelle, M. The Arabidopsis Suppressor Of Auxin Resistance Proteins Are Nucleoporins with an Important Role in Hormone Signaling and Development. Plant Cell 2006, 18, 1590–1603. [Google Scholar] [CrossRef] [PubMed] [Green Version]
  40. Lewis, D.R.; Negi, S.; Sukumar, P.; Muday, G.K. Ethylene inhibits lateral root development, increases IAA transport and expression of PIN3 and PIN7 auxin efflux carriers. Development 2011, 138, 3485–3495. [Google Scholar] [CrossRef] [Green Version]
  41. Friml, J.; Vieten, A.; Sauer, M.; Weijers, D.; Schwarz, H.; Hamann, T.; Offringa, R.; Jürgens, G. Efflux-dependent auxin gradients establish the apical–basal axis of Arabidopsis. Nature 2003, 426, 147–153. [Google Scholar] [CrossRef]
  42. Molnár, G.; Bancoş, S.; Nagy, F.; Szekeres, M. Characterisation of BRH1, a brassinosteroid-responsive RING-H2 gene from Arabidopsis thaliana. Planta 2002, 215, 127–133. [Google Scholar] [CrossRef]
  43. Wang, X.; Chen, E.; Ge, X.; Gong, Q.; Butt, H.; Zhang, C.; Yang, Z.; Li, F.; Zhang, X. Overexpressed BRH1, a RING finger gene, alters rosette leaf shape in Arabidopsis thaliana. Sci. China Life Sci. 2018, 61, 79–87. [Google Scholar] [CrossRef] [PubMed]
  44. Xu, Z.; Wang, H. LTR_FINDER: An efficient tool for the prediction of full-length LTR retrotransposons. Nucleic Acids Res. 2007, 35 (Suppl. S2), W265–W268. [Google Scholar] [CrossRef] [PubMed] [Green Version]
  45. Ellinghaus, D.; Kurtz, S.; Willhoeft, U. LTRharvest, an efficient and flexible software for de novo detection of LTR retrotransposons. BMC Bioinform. 2008, 9, 18. [Google Scholar] [CrossRef] [PubMed] [Green Version]
  46. Ou, S.; Jiang, N. LTR_retriever: A Highly Accurate and Sensitive Program for Identification of Long Terminal Repeat Retrotransposons. Plant Physiol. 2018, 176, 1410–1422. [Google Scholar] [CrossRef] [Green Version]
  47. Zhang, L.; Cai, X.; Wu, J.; Liu, M.; Grob, S.; Cheng, F.; Liang, J.; Cai, C.; Liu, Z.; Liu, B.; et al. Improved Brassica rapa reference genome by single-molecule sequencing and chromosome conformation capture technologies. Hortic. Res. 2018, 5, 50. [Google Scholar] [CrossRef] [Green Version]
  48. Kiełbasa, S.M.; Wan, R.; Sato, K.; Horton, P.; Frith, M.C. Adaptive seeds tame genomic sequence comparison. Genome Res. 2011, 21, 487–493. [Google Scholar] [CrossRef] [Green Version]
  49. Tang, H.; Bowers, J.E.; Wang, X.; Ming, R.; Alam, M.; Paterson, A.H. Synteny and collinearity in plant genomes. Science 2008, 320, 486–488. [Google Scholar] [CrossRef] [Green Version]
  50. Sun, P.; Jiao, B.; Yang, Y.; Shan, L.; Li, T.; Li, X.; Xi, Z.; Wang, X.; Liu, J. WGDI: A user-friendly toolkit for evolutionary analyses of whole-genome duplications and ancestral karyotypes. Mol. Plant 2022, 12, 1841–1851. [Google Scholar] [CrossRef]
  51. Wickham, H. ggplot2. WIREs Comput. Stat. 2011, 3, 180–185. [Google Scholar] [CrossRef]
  52. Wang, X.; Wang, H.; Wang, J.; Sun, R.; Wu, J.; Liu, S.; Bai, Y.; Mun, J.-H.; Bancroft, I.; Cheng, F.; et al. The genome of the mesopolyploid crop species Brassica rapa. Nat. Genet. 2011, 43, 1035–1039. [Google Scholar] [CrossRef] [PubMed] [Green Version]
  53. Song, J.; Guan, Z.; Hu, J.; Guo, C.; Yang, Z.; Wang, S.; Liu, D.; Wang, B.; Lu, S.; Zhou, R.; et al. Eight high-quality genomes reveal pan-genome architecture and ecotype differentiation of Brassica napus. Nat. Plants 2020, 6, 34–45. [Google Scholar] [CrossRef] [PubMed] [Green Version]
  54. Chen, H.; Wang, T.; He, X.; Cai, X.; Lin, R.; Liang, J.; Wu, J.; King, G.; Wang, X. BRAD V3.0: An upgraded Brassicaceae database. Nucleic Acids Res. 2021, 50, D1432–D1441. [Google Scholar] [CrossRef] [PubMed]
  55. Buchfink, B.; Xie, C.; Huson, D.H. Fast and sensitive protein alignment using DIAMOND. Nat. Methods 2015, 12, 59–60. [Google Scholar] [CrossRef] [PubMed]
  56. Enright, A.J.; Van Dongen, S.; Ouzounis, C.A. An efficient algorithm for large-scale detection of protein families. Nucleic Acids Res. 2002, 30, 1575–1584. [Google Scholar] [CrossRef] [PubMed]
  57. Katoh, K.; Misawa, K.; Kuma, K.I.; Miyata, T. MAFFT: A novel method for rapid multiple sequence alignment based on fast Fourier transform. Nucleic Acids Res. 2002, 30, 3059–3066. [Google Scholar] [CrossRef] [PubMed] [Green Version]
  58. Castresana, J. Selection of Conserved Blocks from Multiple Alignments for Their Use in Phylogenetic Analysis. Mol. Biol. Evol. 2000, 17, 540–552. [Google Scholar] [CrossRef] [Green Version]
  59. Stamatakis, A. RAxML version 8: A tool for phylogenetic analysis and post-analysis of large phylogenies. Bioinformatics 2014, 30, 1312–1313. [Google Scholar] [CrossRef] [Green Version]
  60. Letunic, I.; Bork, P. Interactive Tree Of Life (iTOL) v5: An online tool for phylogenetic tree display and annotation. Nucleic Acids Res. 2021, 49, W293–W296. [Google Scholar] [CrossRef]
  61. Kurtz, S.; Phillippy, A.; Delcher, A.L.; Smoot, M.; Shumway, M.; Antonescu, C.; Salzberg, S.L. Versatile and open software for comparing large genomes. Genome Biol. 2004, 5, R12. [Google Scholar] [CrossRef] [Green Version]
  62. Goel, M.; Sun, H.; Jiao, W.; Schneeberger, K. SyRI: Finding genomic rearrangements and local sequence differences from whole-genome assemblies. Genome Biol. 2019, 20, 277. [Google Scholar] [CrossRef] [PubMed] [Green Version]
  63. Chen, C.; Chen, H.; Zhang, Y.; Thomas, H.R.; Frank, M.H.; He, Y.; Xia, R. TBtools—An integrative toolkit developed for interactive analyses of big biological data. Mol. Plant 2020, 13, 1194–1202. [Google Scholar] [CrossRef] [PubMed]
  64. Wang, K.; Li, M.; Hakonarson, H. ANNOVAR: Functional annotation of genetic variants from high-throughput sequencing data. Nucleic Acids Res. 2010, 38, e164. [Google Scholar] [CrossRef] [PubMed]
  65. Pertea, G.; Pertea, M. GFF Utilities: GffRead and GffCompare [version 1; peer review: 3 approved]. F1000Research 2020, 9, 304. [Google Scholar] [CrossRef]
  66. Li, H.; Durbin, R. Fast and accurate short read alignment with Burrows-Wheeler transform. Bioinformatics 2009, 25, 1754–1760. [Google Scholar] [CrossRef] [PubMed] [Green Version]
  67. Rausch, T.; Zichner, T.; Schlattl, A.; Stütz, A.M.; Benes, V.; Korbel, J.O. DELLY: Structural variant discovery by integrated paired-end and split-read analysis. Bioinformatics 2012, 28, i333–i339. [Google Scholar] [CrossRef] [PubMed] [Green Version]
  68. Jeffares, D.C.; Jolly, C.; Hoti, M.; Speed, D.; Shaw, L.; Rallis, C.; Balloux, F.; Dessimoz, C.; Bähler, J.; Sedlazeck, F.J. Transient structural variations have strong effects on quantitative traits and reproductive isolation in fission yeast. Nat. Commun. 2017, 8, 14061. [Google Scholar] [CrossRef] [Green Version]
  69. Kim, D.; Langmead, B.; Salzberg, S.L. HISAT: A fast spliced aligner with low memory requirements. Nat. Methods 2015, 12, 357–360. [Google Scholar] [CrossRef] [Green Version]
  70. Li, H.; Handsaker, B.; Wysoker, A.; Fennell, T.; Ruan, J.; Homer, N.; Marth, G.; Abecasis, G.; Durbin, R. The sequence alignment/map format and SAMtools. Bioinformatics 2009, 25, 2078–2079. [Google Scholar] [CrossRef] [Green Version]
  71. Putri, G.H.; Anders, S.; Pyl, P.T.; Pimanda, J.E.; Zanini, F. Analysing high-throughput sequencing data in Python with HTSeq 2.0. Bioinformatics 2022, 38, 2943–2945. [Google Scholar] [CrossRef]
  72. Wang, L.; Feng, Z.; Wang, X.; Wang, X.; Zhang, X. DEGseq: An R package for identifying differentially expressed genes from RNA-seq data. Bioinformatics 2010, 26, 136–138. [Google Scholar] [CrossRef] [PubMed] [Green Version]
  73. Livak, K.J.; Schmittgen, T.D. Analysis of relative gene expression data using real-time quantitative PCR and the 2−ΔΔCT method. Methods 2001, 25, 402–408. [Google Scholar] [CrossRef] [PubMed]
Figure 1. Comparison of assembly genome sizes, contig N50 (a), and LAI (b) of six Brassica oleracea genomes.
Ijms 24 04063 g001
Figure 2. Chromosome-level genome alignment of the B. oleracea line02-12_v2 genome (top) and B. rapa Chiifu_v3 genome (bottom) against the HDEM genome (center).
Ijms 24 04063 g002
Figure 3. Evolutionary analysis of B. oleracea. (a) An upset diagram shows unique and shared gene families between six B. oleracea and B. rapa Chiifu genomes. The number, along with the histograms, show the clusters in each accession. (b) Single-copy gene-based phylogenetic relationship for 6 B. oleracea accessions with Chiifu as an outgroup. A whole-genome triplication (WGT) event of Brassica species is noted by a red triangle. The point of the differentiation time of B. rapa (AA) and B. oleracea (CC) is marked by a red solid circle (Mya, million years ago). (c) Density plots of synonymous substitutions (Ks) of Chiifu and other plant species are represented by columns of different colors. The arrows marked at the peak of Ks, from left to right, represent the differentiation time of B. rapa (AA) and B. oleracea (CC) and the time of Brassica-specific WGT event, respectively.
Ijms 24 04063 g003
Figure 4. Structural and sequence variations between seven B. oleracea genomes. The bar plots show the total span of syntenic and structural variational (a) and sequence variational (b) regions between the HDEM and each of the other accessions.
Ijms 24 04063 g004
Figure 5. SVs in genes involved in heading leaf trait of cabbage. (a) Circular diagrams of gene expression and genomic variation between heading and non-heading accessions. The outermost layer illustrates the distribution of the nine chromosomes of B. oleracea HDEM in megabases (Mb). Tracks of (ⅰ) and (ⅱ) show the distribution of expression of genes from heading and non-heading leaves with three biological replicates, respectively. Gene expression was calculated as the fragments per kilobase of transcript per million mapped reads (FPKM) and normalized by log10(FPKM + 1). (ⅲ) The density of SVs in 200 kb bins. (ⅳ) Location of candidate genes, including six identified genes highlighted by the red solid circle for heading trait. (b) Volcano plot showing the fold change (x-axis) and significance level of the differential expression (y-axis) between heading leaves and non-heading leaves of cabbage, based on normalized RNA-seq read counts. The gray dashed lines represent the threshold for determining differentially expressed genes, and those indicating differential expression are colored red and blue. (c) A Venn diagram showing the overlapping genes expressed significantly at different levels and affected by SVs. (d) Relative expression levels of BoACS9, BoCYP78A9, BoSAR1, BoPIN7, BoBRH1, and BoPRX34 between heading and non-heading leaves of the cabbage. The expression level in heading leaves was set as 1.0. Each value represents the mean ± SD (n = 3 replicates). Student’s t-test analysis was used to determine significant differences between heading and non-heading leaves. **, p ˂ 0.01 and *, p ˂ 0.05. (e) (left) Local collinearity analysis between the two haplotypes of the BoPRX34 gene. Hap, haplotype. (right) Comparison of the two haplotypes of the BoPRX34 between heading and non-heading populations. (f) Short reads of different accessions were mapped to the BoPRX34 gene at 31,905–31,909 kb of chromosome C9 of HDEM. The red dotted rectangle shows the location of DEL432.
Ijms 24 04063 g005
Disclaimer/Publisher’s Note: The statements, opinions and data contained in all publications are solely those of the individual author(s) and contributor(s) and not of MDPI and/or the editor(s). MDPI and/or the editor(s) disclaim responsibility for any injury to people or property resulting from any ideas, methods, instructions or products referred to in the content.