Abstract
Asthma heterogeneity complicates the search for targeted treatment against airway inflammation and remodeling. We sought to investigate relations between eosinophilic inflammation, a phenotypic feature frequent in severe asthma, bronchial epithelial transcriptome, and functional and structural measures of airway remodeling. We compared epithelial gene expression, spirometry, airway cross-sectional geometry (computed tomography), reticular basement membrane thickness (histology), and blood and bronchoalveolar lavage (BAL) cytokines of n = 40 moderate to severe eosinophilic (EA) and non-eosinophilic asthma (NEA) patients distinguished by BAL eosinophilia. EA patients showed a similar extent of airway remodeling as NEA but had an increased expression of genes involved in the immune response and inflammation (e.g., KIR3DS1), reactive oxygen species generation (GYS2, ATPIF1), cell activation and proliferation (ANK3), cargo transporting (RAB4B, CPLX2), and tissue remodeling (FBLN1, SOX14, GSN), and a lower expression of genes involved in epithelial integrity (e.g., GJB1) and histone acetylation (SIN3A). Genes co-expressed in EA were involved in antiviral responses (e.g., ATP1B1), cell migration (EPS8L1, STOML3), cell adhesion (RAPH1), epithelial–mesenchymal transition (ASB3), and airway hyperreactivity and remodeling (FBN3, RECK), and several were linked to asthma in genome- (e.g., MRPL14, ASB3) or epigenome-wide association studies (CLC, GPI, SSCRB4, STRN4). Signaling pathways inferred from the co-expression pattern were associated with airway remodeling (e.g., TGF-β/Smad2/3, E2F/Rb, and Wnt/β-catenin).
1. Introduction
Asthma is a heterogeneous, chronic inflammatory disease of the airways with a complex pathomechanism and varying clinical presentation. A quarter of asthma patients, particularly those with severe disease, develop progressive and irreversible airway obstruction, leading to persistent symptoms despite optimal treatment. Such a course of the disease is attributed to airway remodeling, i.e., various structural changes associated with epithelial damage, epithelial–mesenchymal transition, subepithelial fibrosis, hyperplasia of airway smooth muscle and mucous glands, and neovascularization, which lead to airway wall thickening, fixed obstruction, and airflow limitation. Current treatment options do not target airway structural changes, and since no accurate biomarker or clinical predictor of ongoing airway remodeling is known, there is no reliable method of indicating those who could benefit from experimental methods, e.g., novel biological therapies before the process becomes clinically symptomatic or apparent in imaging studies [1].
Depending on the type of granulocytes infiltrating the airway mucosa, asthma can be divided into four different inflammatory phenotypes: isolated eosinophilic, isolated neutrophilic, mixed granulocytic, and pauci-granulocytic [2]. Eosinophilic asthma (EA), characterized by the presence of eosinophilic infiltration of the bronchial mucosa and airway secretions, accounts for approximately half of the severe disease cases [3]. This phenotype is characterized by a higher rate of hospital and intensive care unit admissions, more frequent use of oral glucocorticoids, and a higher rate of persistent airflow limitation resulting from airway remodeling driven by T2-profile cytokines and effector cells, particularly eosinophils [4,5]. Finding therapeutic targets behind airway inflammation and remodeling specific to this phenotype presents a vital research goal since available biological therapies against T2 inflammatory responses do not relieve all EA cases [6].
The definition of EA varies between studies, with criteria being based on sputum or bronchoalveolar lavage fluid (BAL) eosinophilia or, more commonly, on increased blood eosinophile count as a surrogate biomarker. No consensus exists as to the cut-off points; those frequently encountered in the literature include sputum eosinophilia of ≥3% [7], BAL eosinophilia of ≥1% [8] or blood eosinophilia ≥ 150–300/mcL [9]. Some studies indicate BAL as the superior reference sample due to the established correlation with clinical asthma features (e.g., severity) or T2-driven inflammatory biomarkers (i.e., the fraction of exhaled nitric oxide (FeNO)) [8]. Furthermore, it has been shown that both blood eosinophilia and FeNO, while correlated, may have unsatisfactory predictive values for airway eosinophilia [10]. Transcriptomic studies faced a similar problem of non-consistency between blood eosinophilia and airway T2-profile gene expression and clinical presentation [11]. Such discordance suggests that transcriptomic studies conducted on the bronchial epithelium need to use EA criteria based on the eosinophilia at the site of sample retrieval, i.e., the lower airways.
Due to the advent of novel therapies, e.g., T2-targeting biologics, the recognition of treatable traits has been proposed as a new paradigm for asthma management. Eosinophilic airway inflammation is considered a distinctive “treatable trait” in severe asthma, and airway eosinophilia appears more stable than neutrophilia over yearly periods of observation [12]. Hence, EA is frequently diagnosed in opposition to less distinctive non-eosinophilic asthma (NEA), regardless of the presence of other granulocytes. As a result, such a clinically recognized EA phenotype is heterogeneous and may include patients with “pure” eosinophilic as well as mixed granulocytic inflammation. Transcriptomic studies focused on a “pure” eosinophilic phenotype [13] are thus unrepresentative of many patients clinically diagnosed with EA. Such studies that focused on a ”pure” eosinophilic phenotype showed an up-regulation of eosinophil marker genes (e.g., CLC, DNASE1L3), T2-related cytokines (e.g., IL13, IL4, IL5), and genes reflecting an epithelial response to T2-mediated inflammation (e.g., CLCA1 and POSTN) in the airways [14]. The epithelial transcriptome of more heterogenous EA patients, including the mixed granulocytic phenotype, is less known.
In our study, we sought to establish differences in bronchial epithelial transcriptomes between EA and NEA and utilize a systems biology approach in the search for novel molecular mechanisms taking part in the pathogenesis of EA. To this end, we compared mRNA transcriptomes and gene interaction networks of differentially expressed and co-expressed genes in the bronchial brushing samples from moderate to severe EA and NEA patients. Additionally, we made correlations between blood and BAL cytokines and biomarkers of airway inflammation, lung function parameters, high-resolution computed tomography proxies of airway remodeling, and gene expression profile. To distinguish EA patients we used a criterion of eosinophilia in the lower airways defined by BAL cell differential (with ≥1% of eosinophils as the cut-off value), regardless of the presence of other granulocytes. This permitted a more heterogeneous EA study group that included both pure eosinophilic and mixed granulocytic asthma, representative of the clinical occurrences of eosinophilic asthma.
2. Results
2.1. Clinical Characteristics of the Patients
EA and NEA patients did not differ regarding demographic factors and clinical features, including medication use, asthma severity, lung function, and symptom control, except for body mass index (BMI), which was higher in the NEA group (Table 1). Women comprised 65% and 80% of the EA and NEA samples, respectively, with a median age of over 50 years in both groups. More than half of the cases were diagnosed with atopy, 80% with allergic rhinitis, and nearly 50% with gastroesophageal reflux disease. The number of subjects diagnosed with severe asthma was comparable (n = 9 in the EA and n = 7 in the NEA group). Five (25%) of the EA and two (10%) of the NEA patients were being treated with oral steroids (chi-squared Pearsons’s test p = 0.24). Most of the study sample required persistent use of long-acting β2-mimetics (EA 80%, NEA 75%; p = 0.41) and/or muscarinic antagonists (EA 5%, NEA 20%; p = 0.14).

Table 1.
Demographic and clinical characteristics of the patients.
2.2. Functional and Structural Measures of Airway Remodeling Were Similar in EA and NEA
Airflow measured by spirometry, including reversibility test, and lung volumes and capacities in body plethysmography did not differ between EA and NEA patients. On high-resolution computed tomography (HRCT), the EA group had higher wall thickness (mean 1.216 vs. 1.078 mm; p = 0.03), airway diameter (mean 5.24 vs. 4.59 mm; p = 0.04), and wall area (mean 25.37 vs. 18.7 mm2; p = 0.03) as measured at RB1 bronchus. However, the wall area ratio (WAR) and the wall thickness ratio (WTR), representing more reliable proxies of airway remodeling [1], did not differ between EA and NEA. RBM thickness was also comparable between EA and NEA patients (median of 6.99 and 5.82 mm, respectively; p = 0.47) (Table 2). RBM thickness was not associated with any of the CT airway remodeling measures.
Table 2.
Sample’s spirometry and high-resolution computed tomography proxies of airway remodeling.
2.3. BAL and Blood Eosinophils Were Well Correlated
The median percentage of BAL eosinophils equaled 2.3% in the EA group, as compared to 0% in the NEA group. Instead, there were no differences in the median percentage of BAL neutrophiles (4% in EA vs. 3% in NEA, p = 0.211) and lymphocytes (8% vs. 4%, respectively; p = 0.052).
The median blood eosinophil count was significantly higher in the EA group (480/mcL) compared to the NEA group (140/mcL, p = 0.008), with blood eosinophilia of 353/mcL as an optimal cut-off point differentiating between the two in a logistic regression model. Notably, 35% of patients in the EA group had blood eosinophil counts below this threshold. In addition, BAL and blood eosinophil counts were well correlated (r = 0.58, p < 0.001).
2.4. Blood and Bronchoalveolar Cytokine Profiles Were Separately Correlated with Eosinophilia in Each Compartment
In Table 3, we present the differences between the serum and BAL immune mediators and the biomarkers of airway remodeling. As shown, both asthma groups did not differ regarding the investigated serum and BAL cytokine levels, except for serum IL-10, which was higher in the EA group. Consequently, serum IL-10 was the only cytokine differing between the cases selected by blood eosinophilia and was higher among those at or exceeding the cut-off value of 350/mL (p < 0.05). Blood eosinophilia was positively correlated with the serum concentrations of periostin (r = 0.35, p < 0.05), IL-6 (r = 0.49, p < 0.05), IL-10 (r = 0.66, p < 0.05), IL-12p70 (r = 0.39, p < 0.05), and ADAM33 (r = 0.59, p < 0.05). No associations were documented between blood eosinophilia and BAL cytokine levels. In turn, the percentage of BAL eosinophils correlated positively with serum concentrations of IL-10 (r = 0.39, p < 0.05) and IL-6 (r = 0.36, p < 0.05) and negatively with the BAL concentration of IL-6 (r = −0.32, p < 0.05). These results highlight discrepancies (lack of cross-correlation) between eosinophilia and cytokine levels measured in different compartments.
Table 3.
Immune mediators in serum and bronchoalveolar lavage fluid.
Airway remodeling proxies in HRCT were not related to blood or BAL eosinophilia. In turn, RBM correlated positively with BAL periostin (r = 0.48; p < 0.05) and, surprisingly, negatively with blood periostin (r = −0.51; p < 0.05) and blood IL-23 (r = −0.4; p < 0.05).
2.5. Differentially Expressed Genes Are Involved in Processes Associated with Asthma Pathogenesis
The expression levels of 32 genes differed significantly between EA and NEA; however, the differences were minor (Table 4). EA patients were characterized by a higher expression of 19 genes involved in various cellular processes, such as plasma membrane organization (e.g., CPLX2), cell motility, activation and proliferation (e.g., ANK3, SUN5), cargo transporting (e.g., RAB4B), ciliogenesis (e.g., GSN), inflammation (e.g., GYS2), and reactive oxygen species generation (e.g., NDUFAF8, ENTR1, ATPIF), and were associated with bronchial hyperreactivity (e.g., RTN4RL1, CNN1) as well as extracellular matrix composition and airway remodeling (e.g., FMNL1, FBLN1, GSN). Conversely, 13 genes showed higher expression in NEA, including those involved in cell apoptosis (e.g., GJB1, ENTR), the response to hypoxia (e.g., SIN3A), and cellular protein localization (e.g., DNAJ1). The relevance of the differentially expressed genes for asthma pathogenesis based on the literature review is presented in Table 4.
Table 4.
Genes differentially expressed in bronchial brush biopsy samples of eosinophilic vs. non-eosinophilic asthma patients adjusted for age, sex, BMI, and oral corticosteroid use. Gene function data obtained from UniProtKB/Swiss-Prot database [15], unless stated otherwise.
2.6. Differentially Expressed Genes Correlate with Lung Function and Proxies of Airway Remodeling but Not Reticular Basement Membrane Thickness
Expression levels of 11 differentially expressed genes correlated significantly with either FEV1 or FEV1/FVC (Table 5). For example, both FEV1 and FEV1/FVC remained in negative associations with four of the genes up-regulated in EA (GSN, NDUFAF8, KIR3DS1, and KRTAP10.1) and in positive relationships with one gene down-regulated in EA (TBC1D12).
Table 5.
Correlations between expression levels of the differentially expressed genes, lung function parameters, and high-resolution computed tomography proxies of airway remodeling.
ATPIF1 correlated positively with the proxies of airway remodeling differing between EA and NEA cases, while RAB4B, GSN, and NDUFAF8 were positively correlated with WAR.
Our study sample had no significant associations between RBM thickness and the gene expression profile.
2.7. Differential Co-Expression Analysis Reveals Genes Co-Regulated in Eosinophilic Asthma
Hierarchical cluster analysis comparing EA and NEA revealed 23 groups of differentially co-expressed genes. A single group consisting of 32 genes with the highest mean pairwise correlation differences was chosen for subsequent analyses. Table 6 shows a literature-based assessment of individual differentially co-expressed genes for their mechanistic role in EA and bronchial remodeling.
Table 6.
Differentially co-expressed genes in bronchial brush biopsy samples of eosinophilic and non-eosinophilic asthma patients. Data obtained from UniProtKB/Swiss-Prot database [15], unless stated otherwise.
The differentially co-expressed genes were involved in the airway response to viral infections (e.g., ATP1B1, EPS15), arachidonic acid metabolism (e.g., FADS6), cell migration (e.g., EPS8L1, STOML3, RHOBTB2), surface receptors endocytosis (e.g., STRN4, EPS15, ATP1B1) or surface receptor expression (e.g., CCT7), oxidative stress response (e.g., DIO3, RHOBTB2), impaired adhesion (e.g., ATP1B1, RAPH1, STOML3), epithelial–mesenchymal transition (e.g., ASB3, RADX, CCT7, MRPL14, PPP2R3B, and SLC19A1), myofibroblast differentiation (e.g., CCT7), smooth muscle proliferation (e.g., ASB3, ATP1B1), airway hyperreactivity (e.g., RECK, STOML3, ATP1B1, OR52I1), extracellular matrix remodeling (e.g., FBN, RECK), angiogenesis (e.g., GPI, RHOBTB2), and neuronal pathogenesis of asthma (e.g., OR52I1, STRN4, TTC3P1, GPI, CABP5).
Moreover, the differentially co-expressed genes, both up- and down-regulated in EA, were previously linked to asthma in the genome- (e.g., MRPL14 [31], ASB3 [23], RHOBTB2 [23]) and epigenome-wide (e.g., CLC [23], EPS15 [32], GPI [36], SRCRB4D [23], STRN4 [23]) association studies.
Additional detailed descriptions of molecular functions and biological processes associated with differentially co-expressed genes by gene ontology are listed in Supplementary Tables S1 and S2. They include phenomena significant in the pathogenesis of asthma and airway remodeling, such as T-cell receptor binding, MHC II protein complex binding, immunoglobulin secretion, myeloid cell apoptosis, regulation of cellular response to growth factors (e.g., TGF-β), and metalloendopeptidase inhibitory activity.
Lung-specific protein–protein interactions of the differentially co-expressed genes are displayed in Figure 1. The CCT7 gene, occupying a central position in the graph, takes part in fibrotic tissue remodeling, including fibrotic wound healing. In contrast, the interacting proteins with the highest connectedness in the graph were related to asthma pathogenesis and include fusogenic protein genes (ICAM1, VCAM1, ITGA4, and their regulator, ELAVL1) as well as ILK, a β1 integrin-linked kinase involved in fibroblast migration, myofibroblast differentiation, and tissue remodeling [37].
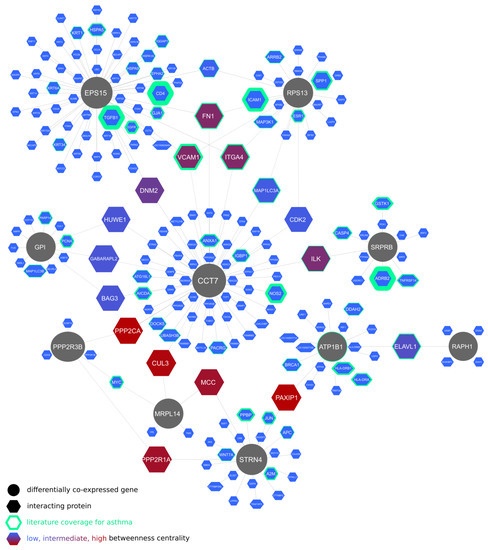
Figure 1.
Lung-specific protein–protein interactions of genes differentially co-expressed between eosinophilic and non-eosinophilic asthma patients in bronchial brush biopsy samples.
2.8. Regulatory Networks of the Differentially Co-Expressed Genes and the Inferred Signaling Pathways
Figure 2 shows a regulatory network of the differentially co-expressed genes, indicating their relation to asthma-relevant transcription factors: E2F1, SP1, YY1, MYC, FOS, EGR1, CTCF, and NFKB1 as well as microRNAs: miR-135b [38], miR-135a [39], miR-340 [30], and miR-223 [40], recently described as involved in asthma pathogenesis through, e.g., regulation of CXCL12, signaling via JAK/STAT pathway, expression of MIDI1, and subsequent mTOR signaling or release of proinflammatory CCL20 from bronchial epithelial cells.

Figure 2.
Regulatory network of miRNAs, transcription factors, and genes differentially co-expressed between eosinophilic and non-eosinophilic asthma patients in bronchial brush biopsy samples.
Additional regulatory networks of the differentially co-expressed genes are presented in Supplementary Figures S1–S3. Furthermore, the associated transcription factors were included in a single graph, and their network-disrupting potential expressed as betweenness centrality was plotted against literature coverage for asthma to identify key nodes with low literature representation and thus presenting new research opportunities (Figure 3). Enrichment analysis of the transcription factors revealed multiple associated signaling pathways listed in Supplementary Table S3, including SMAD2/3, activator protein-1, E2F/Rb, and Wnt/β-catenin pathways.
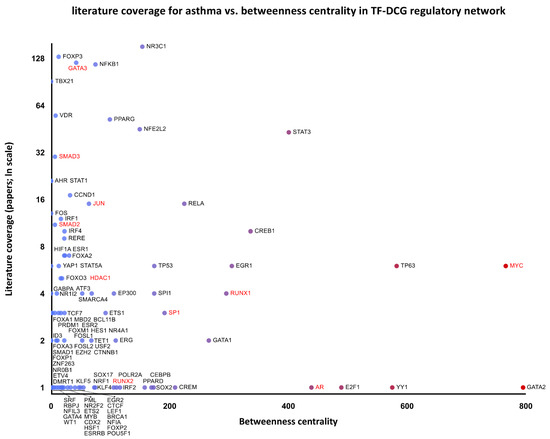
Figure 3.
Literature coverage for asthma against betweenness centrality of the transcription factors–differentially co-expressed genes (TF-DCG) regulatory network. Transcription factors combined from networks are included in Supplementary Figures S1–S3. Genes labeled in red form the SMAD2/3 signaling pathway.
2.9. Kinase Perturbation Studies
Kinase perturbation studies included in Gene Expression Omnibus (GEO) database indicate differential expression of several differentially co-expressed genes upon knockout of the following kinases (Supplementary Table S4):
- TGF-β receptor II (TGFBR2): down-regulation of CCT7, EPS15, MRPL14 [41];
- Homeodomain-interacting protein kinase 1 (HIPK1): down-regulation of GPI, MAEA, STRN4 [42];
- Inhibitor of nuclear factor kappa-B kinase subunit epsilon (IKBKE): up-regulation of DGLUCY, RAPH1, ASB3 [43].
2.10. Cell-Type-Specific Histone Modifications Related to the Expression of Differentially Co-Expressed Genes
A considerable proportion of the differentially co-expressed genes (15 out of 32, all up-regulated in the EA) matched differential expression patterns resulting from histone modifications H3K9ac and H3K27me3 characterized for human lung fibroblast hg19 [44] (Supplementary Table S5).
3. Discussion
In the present study, we showed that the two samples of consecutive moderate to severe asthma patients, comparable regarding demography, medical history, and disease severity, but diagnosed as having either EA or NEA, differed in the epithelial transcriptome despite shared serum and BAL cytokine profiles, lung function, and measures of airway remodeling. Since our comparison included EA patients with both “pure” eosinophilic as well as mixed granulocytic infiltration against NEA patients with both pauci-granulocytic and neutrophilic phenotypes, the resulting differences are more representative of heterogenous EA patients encountered in clinical practice, but simultaneously less distinctive than in a comparison between “pure eosinophilic” and “pauci-granulocytic” or ”pure neutrophilic” asthma cases.
While BAL and blood eosinophilia are correlated, which permits the use of the latter as a feasible predictor of response to eosinophil-depleting biologics, tissue eosinophils seem more resistant to therapeutic intervention, and airway eosinophilia can remain despite the resolution of blood eosinophilia. This is concordant with the observed high BAL eosinophilia despite low blood eosinophilia in over a third of our EA patients. As per previous studies, airway rather than blood eosinophilia could be a better discriminator of eosinophilic asthma, especially in patients already treated with systemic steroids.
A similar phenomenon seems to affect T2-profile cytokines in different body compartments (i.e., blood and bronchi), with the surprising negative correlation of RMB thickness with serum (but not BAL) levels of periostin and IL-23 in our study, an unexpected finding given the role of periostin as a biomarker of eosinophilic airway inflammation [45] and remodeling and the role of IL-23 as an enhancer of T2-mediated eosinophilic inflammation, crucial for the maintenance of eosinophil-recruiting Th17 cells [46]. These findings, however, are consistent with earlier studies reporting a correlation between sputum (but not serum) periostin and sputum eosinophilia [47].
While most of the measured blood and BAL biomarkers did not discriminate between EA and NEA cases, epithelial transcriptomes revealed differential expression and co-expression of multiple genes empirically or speculatively associated with asthma pathogenesis.
EA was characterized by the up-regulation of several genes involved in cell activation, proliferation, motility, cargo transporting, immune response, airway hyperresponsiveness, and remodeling. For example, the product of RAB4B is co-expressed with MHC II class genes and is thought to enhance antigen presentation [48]. FMNL1 modifies macrophage motility and is implicated as a major regulatory gene of mild/moderate persistent asthma in children and adults [49]. The GYS2 gene is up-regulated upon signaling through PPARα, an important regulator of airway inflammation. The product of SDCCAG3 is necessary for the expression [50] of tumor necrosis factor-α receptor (TNFR) on the cell surface, thus contributing to TNF-α-mediated airway hyperresponsiveness [51]. RN4RL1, found on vagal sensory neurons, likely contributes to airway hyperreactivity and neuronal hypothesis of asthma pathogenesis [52], similar to TBC1D12, the down-regulation of which may result in airway neurite sprouting [53], another feature of airway remodeling. Fibrillin-1 (FBLN1) is implicated in stabilizing ECM proteins, including periostin, through regulation of the biological availability of latent TGF-β [16]. In turn, signaling through TGF-β results in the expression of CNN1 [54], involved in ECM remodeling and airway hyperreactivity [55], as well as GSN [17] (gelsolin) and TMEFF implicated in epithelial–mesenchymal transition [56]. ATPIF1 promotes transcriptional activation of NFKB, resulting in a proliferative response and tissue remodeling [57].
Accordingly, expression levels of the genes, the function of which aids bronchial remodeling, exhibited positive correlations with proxies of airway remodeling (e.g., ATPIF1, GSN, NDUFAF8, RAB4B) and consistently negative correlation with lung function parameters (e.g., GSN, NDUFAF8, KIR3DS1), contrary to negatively correlated TBC1D12, the expression of which may prevent unfavorable innervation of airway smooth muscle cells resulting in hypercontractility.
Despite their pathogenetic relevance, the differences in expression levels of the abovementioned genes were low, likely owing to similar clinical characteristics of both asthma patient groups. This remained true of the 32 differentially co-expressed genes; however, the low fold-change ratio, in this case, may indicate a better match in differential co-expression. Furthermore, their expression levels were better correlated within the EA than the NEA group, likely showing higher functional consistency of the EA sample.
Among the differentially co-expressed genes, eight were previously linked to asthma in genome- (MRPL14, ASB3, RHOBTB2) and epigenome-wide (CLC, EPS15, GPI, SSCRB4, STRN4) association studies and five were mentioned in the literature in the context of asthma (SLC19A1, MAEA, CLC, ATP1B1, and RECK). For example, ATP1B1 was previously included in transcriptomic cluster TAC3 of patients with moderate to high sputum eosinophilia in the U-BIOPRED cohort of T2-high asthma, playing a role in the epithelial sheathing, mucus secretion, and airway hyperreactivity, whereas RECK is a negative regulator of matrix metalloproteinase-9 (MMP-9), a significant MMP involved in airway remodeling.
Multiple genes co-expressed in EA could be associated mechanistically with different processes underlying asthma and airway remodeling, but so far, have not been described in the context of this disease. For example, RHOBTB2 is needed for the expression of CXCL14, an autocrine growth chemokine for fibroblasts and a chemoattractant controlling dendritic cell activation, leukocyte migration, and angiogenesis. EPS15, CCT7, SRPRB, and STRN4 are involved in receptor endocytosis and the turnover of β2-adrenergic and M3-muscarinic receptors critical for bronchial constriction and airway hyperresponsiveness as well as signaling through TGF-β and β1-integrins linked to eosinophil recruitment [58] and airway wall structural changes. Affinity capture studies indicate interactions between the protein products of RPS13, CCT7, and EPS15 and proteins involved in cell–cell and cell-ECM adhesion molecules relevant for asthma, such as VCAM-1, α4β1 integrin, and fibronectin. The protein product of ASB3, via MAP kinase and Akt phosphorylation, regulates Erk1/2 and PI3K/Akt signal transduction pathways, being implicated in smooth muscle proliferation in asthma.
Several of the differentially co-expressed genes could be linked to Th17 differentiation. For example, STRN4, inhibiting MAP4K4 kinase, is considered the critical inhibitor of the Hippo pathway [59] and promotor of Th17 differentiation [60], resulting in IL-6 and IL-17 overproduction. Co-expression of CLC and PSG2, the two genes involved in the limitation of Th2- and induction of Th17-differentiation in EA patients, suggests both a counterweight mechanism to limit T2-response and a possible role behind the heterogeneity of T2-high asthma, recently proposed to be divided into IL-5-high/IL-17F-high asthma (with mixed granulocytic infiltration) and IL-4/IL-13-high asthma (with eosinophilic infiltration alone).
Since differential co-expression is thought to reveal a common regulation responsible for coordinated gene expression, the activity of signaling pathways, transcription factors, and histone modifications, which can be inferred through gene set enrichment analysis, was reviewed for associations with asthma pathogenesis. This systems biology approach allowed us to place 29 of the 32 differentially co-expressed genes in gene regulatory networks with transcription factors and miRNAs previously described as involved in asthma pathogenesis, indicating highly connected network disruptors of potential therapeutic applications (Figure 2, Supplementary Figures S1–S3). Topological robustness analysis of the regulatory network of the differentially co-expressed genes identifies highly connected transcription factors with network-disrupting potential, expressed as betweenness centrality. Plotted against the literature coverage for asthma (Figure 3), the analysis reveals understudied transcription factors of possible relevance. For example, AR (androgen receptor) could be regarded as an understudied, highly connected regulator, which was only recently correlated with asthma control [61].
Data from kinase perturbation studies show that several of the differentially co-expressed genes are dependent on the activation of TGFBR2, HIPK1, and IKBKE (Supplementary Table S4). The ligand of TGFBR2, TGF-β, has a well-established role in asthma and airway remodeling, and its receptor was found to be involved in T-cell differentiation. The role of HIPK1 has to date only been described in fetal angiogenesis activated by the TGF-β-TAK1 pathway [42], apoptosis induced by TNF-α, and the prevention of MAP3K5-JNK activation. Our study links HIPK1 with eosinophilic asthma through the pattern of differentially co-expressed genes, a suggestion reinforced by the association between MAP3K5 and atopy [62]. IKBKE is a known target of the NFκB, a transcription factor involved in the inflammatory response of asthma pathogenesis and airway remodeling.
Several other nuclear signaling pathways were especially highly enriched for the transcription factors associated with the genes differentially co-expressed in our data (Supplementary Table S5). Of those, SMAD2/3 corresponds to the profibrotic effects of the TGF-β/Smad2/3 pathway involved in fibroblast to myofibroblast transition [63], and the E2F/Rb and Wnt/β-catenin pathways were both implicated in airway smooth muscle hypertrophy [64]. This concordance with the current literature seems to validate our results and indicates other less studied pathways (such as Notch-mediated HES/HEY network and HIF-1-α transcription factor network) as possibly relevant for future studies.
It is worth mentioning that 15 differentially co-expressed genes in our results have been up-regulated in human lung fibroblast resulting from histone H3K9ac and H3K27me3 epigenetic modifications. While the latter histone has a pluripotency function, the H3K9ac was shown as being linked to epithelial–mesenchymal transition and extracellular matrix degradation upon treatment of the cell culture with TNF-α and TGF-β [65]. Therefore, up-regulation of the associated genes in our study might suggest the same epigenetic modification leading to ongoing epithelial–mesenchymal transition in EA, consistent with the abundance of eosinophil-derived TGF-β in this disease phenotype.
Since the designations of eosinophilic and neutrophilic asthma are not mutually exclusive, our sets of differentially expressed and co-expressed genes likely indicate distinctions between broadly defined EA (including mixed granulocytic phenotype) and NEA (including neutrophilic and pauci-granulocytic phenotypes). EA patients showed higher pathogenetic consistency with up-regulation of the genes directly or indirectly involved in T2-dependent inflammation, Th17 polarization, and airway remodeling.
4. Materials and Methods
4.1. Characteristics of the Patients and Study Design
The study group consisted of 40 asthma patients aged 20–70 years with at least 10-year history of the disease. The diagnosis of asthma was assessed according to the Global Initiative for Asthma (GINA) guidelines [66]. All patients were current non-smokers for at least 5 years prior to enrollment. Except for biological treatment, all asthma medications were permitted, with oral corticosteroids at a daily dose ≤10 mg of prednisolone or equivalent if the dose was unchanged during the preceding 3 months.
Spirometry with bronchial reversibility test using 400 µg of albuterol and body plethysmography after bronchodilator with an assessment of the residual volume (RV) and total lung capacity (TLC) were carried out in all patients using a Jaeger MasterLab spirometer (Jaeger-Toennies GmbH; Hochberg, Germany). Fasting blood samples were collected for routine laboratory tests and further cytokine measurements.
Bronchoscopy with bronchial brushings and bronchoalveolar lavage (BAL) fluid sampling was performed in all study participants. Half of the subjects (n = 20) were diagnosed with EA defined as having at least 1% of eosinophils in BAL based on cell differential count. The remaining individuals were assigned as NEA (n = 20). BAL eosinophilia was chosen as the discriminatory feature due to: (1) the use of airway eosinophilia rather than peripheral blood eosinophilia as the criterion in the U-BIOPRED severe asthma cohort study [67], and (2) the finding that markers associated with T2-inflammation, such as FeNO, blood eosinophilia, and serum periostin, predicted 1% BAL eosinophilia better than 3% sputum eosinophilia [8].
The study was approved by the Ethics Committee of the Jagiellonian University under approval number KBET/151/B/2013 and conducted in accordance with the Declaration of Helsinki. All participants gave written informed consent to participate in the study.
4.2. Airway Cross-Sectional Geometry in Lung Computed Tomography
Lung CT indices of bronchial remodeling were measured in CT scans performed 1 h after administration of 400 µg albuterol using 64-raw multidetector computed tomography (Aquilion TSX-101A, Toshiba Medical Systems Corporation, Otawara, Japan) in a helical scanning mode. The automated program AW Server (General Electric Healthcare, Wauwatosa, WI, USA) was used to quantify the airway cross-sectional geometry at the right upper lobe apical segmental bronchus (RB1). We measured lumen and wall area, average wall thickness, wall area ratio (WAR, i.e., average difference between the outer and inner areas divided by the outer area), and wall thickness ratio (WTR, i.e., wall thickness divided by the outer diameter). The low-attenuation lung area (LAA%) was employed to quantify the presence of emphysema and/or lung hyperinflation and was calculated automatically using the Volume Viewer 11.3 software (General Electric Healthcare) with 1 mm soft tissue reconstruction algorithm. More details on the measures used were provided in our previous publication [1].
4.3. Bronchofiberoscopy and Airway Sampling
Bronchofiberoscopy was performed according to the guidelines of the American Thoracic Society [68] using the bronchofiberoscope BF 1T180 (Olympus, Japan) with local anesthesia (2% lidocaine spray) and in mild sedation (0.05–0.1 mg fentanyl and 2.5–5 mg midazolam, both intravenous).
Endobronchial forceps biopsies were taken from the right lower lobe (the carina between B9 and B10) together with the bronchial brush biopsies (Boston Scientific, Marlborough, MA). The endobronchial specimens were immediately fixed in 10% neutral buffered formalin solution (Sigma-Aldrich, Saint Luis, MO, USA) and sent to the Pathology Department for further analysis. Brushes were immediately immersed in TRIzol lysis reagent to minimize RNA degradation and kept for further analysis (Thermo Fisher Scientific, Carlsbad, CA, USA).
BAL samples were centrifuged at 2000× g for 20 min. The supernatant was frozen in aliquots and stored at −70 °C until analysis.
4.4. Bronchial Biopsy Histology and Reticular Basement Membrane Measurement
Endobronchial biopsy tissue specimens were processed routinely, as described in our previous publications [69]. The 2 µm paraffin-embedded sections were cut and stained with hematoxylin and eosin. The slides were photographed by a Nikon D5300 camera attached to the Zeiss Axioscope microscope with a 100× oil immersion lens. The images were analyzed by the AnalySIS 3.2 software (Soft Imaging System GmbH, Muenster, Germany). The RBM thickness was measured along the biopsy’s epithelial surface according to the orthogonal intercept method suggested by Ferrando et al. [70] using arbitrary distance units. For each patient, at least 30 individual RBM measurements were evaluated at intervals of 9.5 µm. The results were expressed as harmonic mean, defined in our previous publication.
4.5. Measurements of Immune Mediators in Serum Samples and BAL Supernatant
Immunoenzymatic assay (ELISA) was used to measure serum and BAL concentrations of interleukin (IL)-4, IL-5, IL-6, IL-10, IL-12p70, IL-17A, IL-23, and interferon gamma (IFN-γ) (eBiosciencea, Vienna, Austria), periostin (Phoenix Pharmaceuticals, Burlingame, CA, USA), and serum disintegrin and metalloproteinase domain-containing protein 33 (ADAM 33) (Cloud-Clone Corp., Katy, TX, USA).
4.6. RNA Isolation and Microarray Processing
Total RNA was extracted from bronchial brush biopsies with mRNA isolation kits (DNAGdańsk, Gdańsk, Poland), fractioned in gravity gradient, isolated in chromatographic columns, and stored at −80 °C. The quality of each sample was assessed using Qiagen® QIAxel, and RNA integrity was verified by agarose gel electrophoresis. The resulting RNA was reverse transcribed into cDNA library using Syngen® UniversalScript Reverse Transcriptase. The product was purified by Syngen ® PCR ME Mini Kit and fluorescently labeled and purified using Kreatech ® ULS Platinum Bright Red/Orange Kit. Hybridization to microarrays occurred on the Human Genomic 49K Mi ReadyArray (a Human Exonic Evidence-Based Oligonucleotide array (HEEBO); Microarray Inc., Huntsville, AL, USA) at 37 °C for 24 h.
4.7. Retrieval of Microarray Data
Microarrays were scanned with a InnoScan 900 Microarray Scanner, and hybridization signals were detected using Mapix software (v.6.0.1; Innopsys, Carbonne, France). The software did not perform microarray gridding correctly in some cases. Custom gridding algorithm was developed to avoid grid displacement as previously suggested [71]. The coordinates of positioning markers to establish sub-grids were found using a maximally stable extremal regions (MSER)-based method. Computed results were verified manually and corrected if needed, with overall gridding performance exceeding that of the commercial software, ultimately resulting in expression profiles of 33,519 gene products. Microarray data preprocessing (background correction and normalization) was performed by limma R software using the established methods. After background correction, quantile normalization and filtration for coefficients of gene expression variation between 0.3 and 10, 14,823 annotated gene products were included in subsequent analyses.
4.8. Basic Statistical Analysis
Basic statistical analysis was performed using Statistica TIBCO 13.3 and R (version 3.6.1) software. Genomic data were analyzed with Bioconductor v.3.7. software of the R environment [72]. Data distribution normality was verified using the Shapiro–Wilk test. Continuous variables, mostly non-normally distributed, were reported as a median with interquartile range or as a mean with standard deviation, if appropriate, and compared using Mann–Whitney U-test or unpaired t-test, respectively. Categorical variables were given as percentages and compared using χ2 test.
4.9. Statistical Analysis of Differential Gene Expression and Co-Expression
Two groups of n = 20 patients were calculated as sufficient to analyze the total of 14,823 gene products at desired fold differences of 2, desired power of 0.8, a standard deviation of 0.7, and the acceptable number of false positives of 4 using FDR-based sample size calculator [73]. Since differential expression can confound differential co-expression analysis [74], a list of differentially expressed genes was established using ANCOVA to adjust for age, sex, BMI, and oral corticosteroid use. Adjustment for false discovery rate (FDR) was made using Benjamini–Hochberg procedure.
A list of differentially co-expressed genes was established using CoXpress [75] R package. In this method, groups of genes, the expression levels of which are highly correlated in one set of experiments (i.e., EA) but not significantly correlated in the second set of experiments (i.e., NEA), were found. Identified groups of co-expressed genes are thought to be indicative of the underlying coordinated regulation, e.g., signaling pathways or histone modifications specific to the studied condition. A group of genes, the distribution of the pairwise correlations of which was found to be random in NEA (p ≥ 0.05) and non-random in EA (p < 0.05), was recognized as differentially co-expressed.
4.10. Gene Set Enrichment, Interaction Networks, and Their Topological Robustness Analysis
We utilized the systems biology approach to (1) identify genes with coordinated expression in the airways of EA and (NEA) patients (differentially co-expressed genes), (2) establish networks of their binary molecular interactions and regulation using curated resources, and (3) conduct a systematic review of the relevant literature to infer their possible role in the disease pathogenesis in search for novel regulators, biomarkers, and mechanisms of airway inflammation and remodeling.
Associations between differentially co-expressed genes, airway inflammation, and remodeling were investigated using the following workflow:
- Gene set enrichment analysis (GSEA) to establish histone modifications and cell types matching differentially co-expressed genes’ expression pattern and associated biological processes, molecular functions, and signaling pathways, using Enrichr tool [76] and curated datasets (Supplement Table S6);
- Analysis of the networks of associated molecular entity interactions, i.e., (1) lung-specific binary protein–protein interactions of the proteins coded by the differentially co-expressed genes, (2) interactions between differentially co-expressed genes’ and their upstream regulators, and (3) interactions between differentially co-expressed genes, microRNAs, and associated transcription factors; the networks were constructed and analyzed using Cytoscape 3.7.1 [77] and NetworkAnalyst 3.0 [78];
- The topological robustness analysis of the above networks (graphs) by the principle of topological attack on biological network; betweenness centrality identified nodes with the highest network-disrupting potential as possible targets for pharmacological interventions.
5. Conclusions
In our pilot study, we document that the airway epithelial transcriptome of eosinophilic vs. non-eosinophilic asthma patients, distinguished by BAL eosinophilia alone, differs regardless of an admixture of other inflammatory cells (e.g., neutrophils). The broad spectrum of analyses, specifically the extensive gene co-expression data, was intended to indicate a functional group of genes that might be mechanistically related to EA pathology and reveal common underlying regulatory processes, including receptor signaling, and the interference of miRNAs. Our study of the varied, real-life group of patients deviating from the pure EA phenotype did not reveal canonical markers of the T2 response (such as CST1 or CLCA1). This suggests that such a heterogenous EA phenotype identified based on BAL eosinophilia and allowing for mixed granulocytic infiltration may only partially overlap with the pure T2 immunological signature. For that reason, we also included an extended literature search to describe important biological roles of the identified genes, including the inferred signaling pathways possibly involved in asthma and airway remodeling pathology.
Among the 32 differentially expressed genes, the expression of 11 correlated significantly with the measures of lung function and HRCT measures of airway remodeling, following their mechanistic roles. The protein products of these genes (in particular, of GSN, NDUFAF8, KIR3DS1, KRTAP10.1, TBC1D12, RAB4B, and ATPIF1) could be investigated as potential novel biomarkers and therapeutic targets against airway remodeling in EA.
Of the 32 differentially co-expressed genes, the products of CCT7, EPS15, STRN4, SRPRB, GPI, and RAPH1 could be considered additional candidates for therapeutic interventions due to their mechanistic relevance for asthma and airway remodeling and their high connectivity in the related protein–protein interaction networks.
Inferences from the differential gene co-expression networks suggest that in EA, there is a preferential engagement of regulatory processes indicating the activation of the SMAD2/3, activator protein-1, E2F/Rb, Wnt/β-catenin, and androgen receptor signaling pathways, selected protein kinases TGFBR2, HIPK1, and IKBKE, and interference from microRNAs miR-135b110, miR-135a, miR-340, and miR-223. Furthermore, a considerable proportion of the differentially co-expressed genes matched patterns resulting from histone H3K9ac and H3K27me3 modifications, suggesting such epigenetic changes as being specific to EA.
However, future multimodal investigations are required to confirm the diagnostic and therapeutic utility of the presented findings.
Supplementary Materials
The following supporting information can be downloaded at: https://www.mdpi.com/article/10.3390/ijms24043789/s1.
Author Contributions
Conceptualization: S.B.-S., J.G.B. and P.K.-S.; methodology, S.B.-S., S.D., A.M., S.B.-C., I.Z., J.Z., K.O. and P.K.-S.; software, S.D., A.M., S.B.-C., I.Z., J.Z., L.Z. and J.G.B.; validation, S.B.-S.; formal analysis, P.K.-S., S.D., A.M., S.B.-C., I.Z., K.O., M.K. and L.Z., M.K.; investigation, P.K.-S., S.D., A.M., S.B.-C., I.Z., J.Z., J.S., J.Z., J.Z.-K. and K.O.; resources, S.B.-S., P.K.-S. and S.B.-C.; data curation, S.D., A.M. and S.B.-C.; writing—original draft preparation, P.K.-S.; writing—review and editing, S.B.-S., B.J. and A.S.-K.; visualization, P.K.-S. and A.S.-K.; supervision, S.B.-S. and J.G.B.; project administration, S.B.-S.; funding acquisition, S.B.-S. All authors have read and agreed to the published version of the manuscript.
Funding
This study was funded by the National Science Centre of the Polish Ministry of Science and Higher Education, based on decision No. DEC-2013/09/B/NZ5/00758.
Institutional Review Board Statement
The study was approved by the Ethics Committee of the Jagiellonian University under approval number KBET/151/B/2013 and conducted in accordance with the Declaration of Helsinki. All participants gave written informed consent to participate in the study.
Informed Consent Statement
Informed consent was obtained from all subjects involved in the study.
Data Availability Statement
The data presented in this study are available on request from the corresponding author.
Conflicts of Interest
The authors declare no conflict of interest.
References
- Kozlik, P.; Zuk, J.; Bartyzel, S.; Zarychta, J.; Okon, K.; Zareba, L.; Bazan, J.G.; Kosalka, J.; Soja, J.; Musial, J.; et al. The relationship of airway structural changes to blood and bronchoalveolar lavage biomarkers, and lung function abnormalities in asthma. Clin. Exp. Allergy 2020, 50, 15–28. [Google Scholar] [CrossRef] [PubMed]
- Svenningsen, S.; Nair, P. Asthma Endotypes and an Overview of Targeted Therapy for Asthma. Front. Med. 2017, 4, 158. [Google Scholar] [CrossRef] [PubMed]
- Gibson, P.G. Inflammatory phenotypes in adult asthma: Clinical applications. Clin. Respir. J. 2009, 3, 198–206. [Google Scholar] [CrossRef]
- Bazan-Socha, S.; Bukiej, A.; Marcinkiewicz, C.; Musial, J. Integrins in Pulmonary Inflammatory Diseases. Curr. Pharm. Des. 2005, 11, 893–901. [Google Scholar] [CrossRef]
- Pascual, R.M.; Peters, S.P. Airway remodeling contributes to the progressive loss of lung function in asthma: An overview. J. Allergy Clin. Immunol. 2005, 116, 477–486. [Google Scholar] [CrossRef] [PubMed]
- Ando, K.; Fukuda, Y.; Tanaka, A.; Sagara, H. Comparative Efficacy and Safety of Tezepelumab and Other Biologics in Patients with Inadequately Controlled Asthma According to Thresholds of Type 2 Inflammatory Biomarkers: A Systematic Review and Network Meta-Analysis. Cells 2022, 11, 819. [Google Scholar] [CrossRef] [PubMed]
- Flood-Page, P.; Swenson, C.; Faiferman, I.; Matthews, J.; Williams, M.; Brannick, L.; Robinson, D.; Wenzel, S.; Busse, W.; Hansel, T.T.; et al. A Study to Evaluate Safety and Efficacy of Mepolizumab in Patients with Moderate Persistent Asthma. Am. J. Respir. Crit. Care Med. 2007, 176, 1062–1071. [Google Scholar] [CrossRef] [PubMed]
- Jones, T.; Brown, T.; Elliott, S.; Barber, C.; Gove, K.; Lau, L.; Rupani, H.; Chauhan, A.; Howarth, P.; Ono, J.; et al. Predictors of sputum and BAL eosinophilia in the Wessex Severe Asthma Cohort. Eur. Res. J. 2017, 50, PA4765. [Google Scholar] [CrossRef]
- Yancey, S.W.; Bradford, E.S.; Keene, O.N. Disease burden and efficacy of mepolizumab in patients with severe asthma and blood eosinophil counts of ≥150–300 cells/μL. Respir. Med. 2019, 151, 139–141. [Google Scholar] [CrossRef] [PubMed]
- Schmid, J.; Hviid-Vyff, B.; Skjold, T.; Hoffmann, H.J. The usefulness of blood eosinophil count and FeNO to predict sputum eosinophilia in the diagnosis of severe eosinophilic asthma. Eur. Res. J. 2019, 54, OA2150. [Google Scholar] [CrossRef]
- Kuruvilla, M.E.; Lee, F.E.-H.; Lee, G.B. Understanding Asthma Phenotypes, Endotypes, and Mechanisms of Disease. Clin. Rev. Allergy Immunol. 2019, 56, 219–233. [Google Scholar] [CrossRef] [PubMed]
- van Veen, I.H.; Brinke, A.T.; Gauw, S.A.; Sterk, P.J.; Rabe, K.F.; Bel, E.H. Consistency of sputum eosinophilia in difficult-to-treat asthma: A 5-year follow-up study. J. Allergy Clin. Immunol. 2009, 124, 615–617.e2. [Google Scholar] [CrossRef] [PubMed]
- Sánchez-Ovando, S.; Simpson, J.L.; Barker, D.; Baines, K.J.; Wark, P.A.B. Transcriptomics of biopsies identifies novel genes and pathways linked to neutrophilic inflammation in severe asthma. Clin. Exp. Allergy 2021, 51, 1279–1294. [Google Scholar] [CrossRef]
- Baines, K.J.; Simpson, J.L.; Wood, L.G.; Scott, R.J.; Fibbens, N.L.; Powell, H.; Cowan, D.C.; Taylor, D.R.; Cowan, J.O.; Gibson, P.G. Sputum gene expression signature of 6 biomarkers discriminates asthma inflammatory phenotypes. J. Allergy Clin. Immunol. 2014, 133, 997–1007. [Google Scholar] [CrossRef] [PubMed]
- Bateman, A.; Martin, M.-J.; Orchard, S.; Magrane, M.; Agivetova, R.; Ahmad, S.; Alpi, E.; Bowler-Barnett, E.H.; Britto, R.; Bursteinas, B.; et al. UniProt: The Universal Protein Knowledgebase in 2021. Nucleic Acids Res. 2021, 49, D480–D489. [Google Scholar] [CrossRef]
- Manabe, Y.; Shiga, M.; Kometani-Gunjigake, K.; Nakao-Kuroishi, K.; Mizuhara, M.; Toyono, T.; Seta, Y.; Kawamoto, T. Fibrillin-1 regulates periostin expression during maintenance of periodontal homeostasis. J. Dent. Sci. 2022, 17, 1714–1721. [Google Scholar] [CrossRef] [PubMed]
- Wittmann, J.; Dieckow, J.; Schröder, H.; Hampel, U.; Garreis, F.; Jacobi, C.; Milczarek, A.; Hsieh, K.L.; Pulli, B.; Chen, J.W.; et al. Plasma gelsolin promotes re-epithelialization. Sci. Rep. 2018, 8, 13140. [Google Scholar] [CrossRef]
- Suojalehto, H.; Ndika, J.; Lindström, I.; Airaksinen, L.; Karisola, P.; Alenius, H. Endotyping asthma related to 3 different work exposures. J. Allergy Clin. Immunol. 2021, 148, 1072–1080. [Google Scholar] [CrossRef] [PubMed]
- Kalbe, B.; Knobloch, J.; Schulz, V.M.; Wecker, C.; Schlimm, M.; Scholz, P.; Jansen, F.; Stoelben, E.; Philippou, S.; Hecker, E.; et al. Olfactory Receptors Modulate Physiological Processes in Human Airway Smooth Muscle Cells. Front. Physiol. 2016, 7, 339. [Google Scholar] [CrossRef] [PubMed]
- Lin, Y.-T.; Wu, K.-J. Epigenetic regulation of epithelial-mesenchymal transition: Focusing on hypoxia and TGF-β signaling. J. Biomed. Sci. 2020, 27, 39. [Google Scholar] [CrossRef] [PubMed]
- Rastogi, D.; Nico, J.; Johnston, A.D.; Tobias, T.A.M.; Jorge, Y.; Macian, F.; Greally, J.M. CDC42-related genes are upregulated in helper T cells from obese asthmatic children. J. Allergy Clin. Immunol. 2018, 141, 539–548.e7. [Google Scholar] [CrossRef]
- Mahn, K.; Hirst, S.J.; Ying, S.; Holt, M.R.; Lavender, P.; Ojo, O.O.; Siew, L.; Simcock, D.E.; McVicker, C.G.; Kanabar, V.; et al. Diminished sarco/endoplasmic reticulum Ca 2+ ATPase (SERCA) expression contributes to airway remodelling in bronchial asthma. Proc. Natl. Acad. Sci. USA 2009, 106, 10775–10780. [Google Scholar] [CrossRef]
- Hoang, T.T.; Sikdar, S.; Xu, C.-J.; Lee, M.K.; Cardwell, J.; Forno, E.; Imboden, M.; Jeong, A.; Madore, A.-M.; Qi, C.; et al. Epigenome-wide association study of DNA methylation and adult asthma in the Agricultural Lung Health Study. Eur. Respir. J. 2020, 56, 2000217. [Google Scholar] [CrossRef]
- Ingram, J.L.; Kraft, M. Metalloproteinases as modulators of allergic asthma: Therapeutic perspectives. Met. Med. 2015, 2, 61–74. [Google Scholar] [CrossRef]
- Katula, K.S.; Heinloth, A.N.; Paules, R.S. Folate deficiency in normal human fibroblasts leads to altered expression of genes primarily linked to cell signaling, the cytoskeleton and extracellular matrix. J. Nutr. Biochem. 2007, 18, 541–552. [Google Scholar] [CrossRef]
- Mercer, B.; Lemaitre, V.; Powell, C.; D’Armiento, J. The Epithelial Cell in Lung Health and Emphysema Pathogenesis. Curr. Respir. Med. Rev. 2006, 2, 101–142. [Google Scholar] [CrossRef]
- Dijk, F.N.; Xu, C.; Melén, E.; Carsin, A.-E.; Kumar, A.; Nolte, I.M.; Gruzieva, O.; Pershagen, G.; Grotenboer, N.S.; Savenije, O.E.; et al. Genetic regulation of IL1RL1 methylation and IL1RL1-a protein levels in asthma. Eur. Respir. J. 2018, 51, 1701377. [Google Scholar] [CrossRef]
- Hansmann, L.; Schmidl, C.; Kett, J.; Steger, L.; Andreesen, R.; Hoffmann, P.; Rehli, M.; Edinger, M. Dominant Th2 Differentiation of Human Regulatory T Cells upon Loss of FOXP3 Expression. J. Immunol. 2012, 188, 1275–1282. [Google Scholar] [CrossRef]
- McHugh, B.J.; Murdoch, A.; Haslett, C.; Sethi, T. Loss of the Integrin-Activating Transmembrane Protein Fam38A (Piezo1) Promotes a Switch to a Reduced Integrin-Dependent Mode of Cell Migration. PLoS ONE 2012, 7, e40346. [Google Scholar] [CrossRef]
- Kho, A.T.; Sharma, S.; Davis, J.S.; Spina, J.; Howard, D.; McEnroy, K.; Moore, K.; Sylvia, J.; Qiu, W.; Weiss, S.T.; et al. Circulating MicroRNAs: Association with Lung Function in Asthma. PLoS ONE 2016, 11, e0157998. [Google Scholar] [CrossRef]
- Li, M.J.; Wang, P.; Liu, X.; Lim, E.L.; Wang, Z.; Yeager, M.; Wong, M.P.; Sham, P.C.; Chanock, S.J.; Wang, J. GWASdb: A database for human genetic variants identified by genome-wide association studies. Nucleic Acids Res. 2012, 40, D1047–D1054. [Google Scholar] [CrossRef]
- Chen, Y.-G. Endocytic regulation of TGF-β signaling. Cell Res. 2009, 19, 58–70. [Google Scholar] [CrossRef]
- Satish, L.; O’Gorman, D.B.; Johnson, S.; Raykha, C.; Gan, B.S.; Wang, J.H.-C.; Kathju, S. Increased CCT-eta expression is a marker of latent and active disease and a modulator of fibroblast contractility in Dupuytren’s contracture. Cell Stress Chaperones 2013, 18, 397–404. [Google Scholar] [CrossRef]
- Génier, S.; Degrandmaison, J.; Moreau, P.; Labrecque, P.; Hébert, T.E.; Parent, J.-L. Regulation of GPCR expression through an interaction with CCT7, a subunit of the CCT/TRiC complex. Mol. Biol. Cell 2016, 27, 3800–3812. [Google Scholar] [CrossRef]
- Pascual, M.; Roa, S.; García-Sánchez, A.; Sanz, C.; Hernandez-Hernandez, L.; Greally, J.M.; Lorente, F.; Dávila, I.; Isidoro-García, M. Genome-wide expression profiling of B lymphocytes reveals IL4R increase in allergic asthma. J. Allergy Clin. Immunol. 2014, 134, 972–975. [Google Scholar] [CrossRef]
- Zong, M.; Lu, T.; Fan, S.; Zhang, H.; Gong, R.; Sun, L.; Fu, Z.; Fan, L. Glucose-6-phosphate isomerase promotes the proliferation and inhibits the apoptosis in fibroblast-like synoviocytes in rheumatoid arthritis. Arthritis Res. Ther. 2015, 17, 100. [Google Scholar] [CrossRef]
- Mousavizadeh, R.; Hojabrpour, P.; Eltit, F.; McDonald, P.C.; Dedhar, S.; McCormack, R.G.; Duronio, V.; Jafarnejad, S.M.; Scott, A. β1 integrin, ILK and mTOR regulate collagen synthesis in mechanically loaded tendon cells. Sci. Rep. 2020, 10, 12644. [Google Scholar] [CrossRef]
- Liu, Y.; Huo, S.-G.; Xu, L.; Che, Y.-Y.; Jiang, S.-Y.; Zhu, L.; Zhao, M.; Teng, Y.-C. MiR-135b Alleviates Airway Inflammation in Asthmatic Children and Experimental Mice with Asthma via Regulating CXCL12. Immunol. Investig. 2022, 51, 496–510. [Google Scholar] [CrossRef]
- Huang, X.-P.; Qin, C.-Y.; Gao, Y.-M. miR-135a inhibits airway inflammatory response in asthmatic mice via regulating JAK/STAT signaling pathway. Braz. J. Med. Biol. Res. 2021, 54, e10023. [Google Scholar] [CrossRef]
- Roffel, M.; Boudewijn, I.; Guryev, V.; Brandsma, C.-A.; van den Berge, M.; Bracke, K.; Maes, T.; Heijink, I. Unraveling the role of miR-223-3p in the regulation of airway inflammation in asthma. Eur. Res. J. 2018, 52, PA4998. [Google Scholar] [CrossRef]
- Iwata, J.-I.; Tung, L.; Urata, M.; Hacia, J.G.; Pelikan, R.; Suzuki, A.; Ramenzoni, L.; Chaudhry, O.; Parada, C.; Sanchez-Lara, P.A.; et al. Fibroblast Growth Factor 9 (FGF9)-Pituitary Homeobox 2 (PITX2) Pathway Mediates Transforming Growth Factor β (TGFβ) Signaling to Regulate Cell Proliferation in Palatal Mesenchyme during Mouse Palatogenesis. J. Biol. Chem. 2012, 287, 2353–2363. [Google Scholar] [CrossRef]
- Shang, Y.; Doan, C.N.; Arnold, T.D.; Lee, S.; Tang, A.A.; Reichardt, L.F.; Huang, E.J. Transcriptional Corepressors HIPK1 and HIPK2 Control Angiogenesis Via TGF-β–TAK1–Dependent Mechanism. PLoS Biol. 2013, 11, e1001527. [Google Scholar] [CrossRef] [PubMed]
- Hurley, D.G.; Araki, H.; Tamada, Y.; Dunmore, B.; Sanders, D.; Humphreys, S.; Affara, M.; Imoto, S.; Yasuda, K.; Tomiyasu, Y.; et al. Gene network inference and visualization tools for biologists: Application to new human transcriptome datasets. Nucleic Acids Res. 2012, 40, 2377–2398. [Google Scholar] [CrossRef]
- Zhang, Y.; Lv, J.; Liu, H.; Zhu, J.; Su, J.; Wu, Q.; Qi, Y.; Wang, F.; Li, X. HHMD: The human histone modification database. Nucleic Acids Res. 2010, 38, D149–D154. [Google Scholar] [CrossRef]
- Matsumoto, H. Roles of Periostin in Asthma. Adv. Exp. Med. Biol. 2019, 1132, 145–159. [Google Scholar] [CrossRef]
- Langrish, C.L.; Chen, Y.; Blumenschein, W.M.; Mattson, J.; Basham, B.; Sedgwick, J.D.; McClanahan, T.; Kastelein, R.A.; Cua, D.J. IL-23 drives a pathogenic T cell population that induces autoimmune inflammation. J. Exp. Med. 2005, 201, 233–240. [Google Scholar] [CrossRef]
- Pavlidis, S.; Takahashi, K.; Ng Kee Kwong, F.; Xie, J.; Hoda, U.; Sun, K.; Elyasigomari, V.; Agapow, P.; Loza, M.; Baribaud, F.; et al. “T2-high” in severe asthma related to blood eosinophil, exhaled nitric oxide and serum periostin. Eur. Respir. J. 2019, 53, 1800938. [Google Scholar] [CrossRef] [PubMed]
- Krawczyk, M.; Leimgruber, E.; Seguín-Estévez, Q.; Dunand-Sauthier, I.; Barras, E.; Reith, W. Expression of RAB4B, a protein governing endocytic recycling, is co-regulated with MHC class II genes. Nucleic Acids Res. 2006, 35, 595–605. [Google Scholar] [CrossRef]
- Do, A.N.; Chun, Y.; Grishina, G.; Grishin, A.; Rogers, A.J.; Raby, B.A.; Weiss, S.T.; Vicencio, A.; Schadt, E.E.; Bunyavanich, S. Network study of nasal transcriptome profiles reveals master regulator genes of asthma. J. Allergy Clin. Immunol. 2021, 147, 879–893. [Google Scholar] [CrossRef] [PubMed]
- Neznanov, N.; Neznanova, L.; Angres, B.; Gudkov, A.V. Serologically Defined Colon Cancer Antigen 3 Is Necessary for the Presentation of TNF Receptor 1 on Cell Surface. DNA Cell Biol. 2005, 24, 777–785. [Google Scholar] [CrossRef] [PubMed]
- Howarth, P.H.; Babu, K.S.; Arshad, H.S.; Lau, L.; Buckley, M.; McConnell, W.; Beckett, P.; Al Ali, M.; Chauhan, A.; Wilson, S.J.; et al. Tumour necrosis factor (TNF) as a novel therapeutic target in symptomatic corticosteroid dependent asthma. Thorax 2005, 60, 1012–1018. [Google Scholar] [CrossRef]
- Tränkner, D.; Hahne, N.; Sugino, K.; Hoon, M.A.; Zuker, C. Population of sensory neurons essential for asthmatic hyperreactivity of inflamed airways. Proc. Natl. Acad. Sci. USA 2014, 111, 11515–11520. [Google Scholar] [CrossRef]
- Oguchi, M.E.; Noguchi, K.; Fukuda, M. TBC1D12 is a novel Rab11-binding protein that modulates neurite outgrowth of PC12 cells. PLoS ONE 2017, 12, e0174883. [Google Scholar] [CrossRef] [PubMed]
- Kurundkar, A.R.; Kurundkar, D.; Rangarajan, S.; Locy, M.L.; Zhou, Y.; Liu, R.; Zmijewski, J.; Thannickal, V.J. The matricellular protein CCN1 enhances TGF-β1/SMAD3-dependent profibrotic signaling in fibroblasts and contributes to fibrogenic responses to lung injury. FASEB J. 2016, 30, 2135–2150. [Google Scholar] [CrossRef] [PubMed]
- Zuyderduyn, S.; Sukkar, M.; Fust, A.; Dhaliwal, S.; Burgess, J. Treating asthma means treating airway smooth muscle cells. Eur. Respir. J. 2008, 32, 265–274. [Google Scholar] [CrossRef]
- Oshimori, N.; Fuchs, E. Paracrine TGF-β Signaling Counterbalances BMP-Mediated Repression in Hair Follicle Stem Cell Activation. Cell Stem Cell 2012, 10, 63–75. [Google Scholar] [CrossRef]
- Formentini, L.; Sánchez-Aragó, M.; Sánchez-Cenizo, L.; Cuezva, J.M. The Mitochondrial ATPase Inhibitory Factor 1 Triggers a ROS-Mediated Retrograde Prosurvival and Proliferative Response. Mol. Cell 2012, 45, 731–742. [Google Scholar] [CrossRef] [PubMed]
- Bazan-Socha, S.; Zuk, J.; Plutecka, H.; Marcinkiewicz, C.; Zareba, L.; Musial, J. Collagen Receptors α(1)β(1) and α(2)β(1) Integrins Are Involved in Transmigration of Peripheral Blood Eosinophils, but Not Mononuclear Cells through Human Microvascular Endothelial Cells Monolayer. J. Physiol. Pharmacol. 2012, 63, 373–379. [Google Scholar]
- Seo, G.; Han, H.; Vargas, R.E.; Yang, B.; Li, X.; Wang, W. MAP4K Interactome Reveals STRN4 as a Key STRIPAK Complex Component in Hippo Pathway Regulation. Cell Rep. 2020, 32, 107860. [Google Scholar] [CrossRef]
- Chuang, H.-C.; Sheu, W.H.-H.; Lin, Y.-T.; Tsai, C.-Y.; Yang, C.-Y.; Cheng, Y.-J.; Huang, P.-Y.; Li, J.-P.; Chiu, L.-L.; Wang, X.; et al. HGK/MAP4K4 deficiency induces TRAF2 stabilization and Th17 differentiation leading to insulin resistance. Nat. Commun. 2014, 5, 4602. [Google Scholar] [CrossRef] [PubMed]
- Zein, J.G.; McManus, J.M.; Sharifi, N.; Erzurum, S.C.; Marozkina, N.; Lahm, T.; Giddings, O.; Davis, M.D.; DeBoer, M.D.; Comhair, S.A.; et al. Benefits of Airway Androgen Receptor Expression in Human Asthma. Am. J. Respir. Crit. Care Med. 2021, 204, 285–293. [Google Scholar] [CrossRef]
- Castro-Giner, F.; Bustamante, M.; González, J.R.; Kogevinas, M.; Jarvis, D.; Heinrich, J.; Antó, J.-M.; Wjst, M.; Estivill, X.; de Cid, R. A pooling-based genome-wide analysis identifies new potential candidate genes for atopy in the European Community Respiratory Health Survey (ECRHS). BMC Med. Genet. 2009, 10, 128. [Google Scholar] [CrossRef]
- Wnuk, D.; Paw, M.; Ryczek, K.; Bochenek, G.; Sładek, K.; Madeja, Z.; Michalik, M. Enhanced asthma-related fibroblast to myofibroblast transition is the result of profibrotic TGF-β/Smad2/3 pathway intensification and antifibrotic TGF-β/Smad1/5/(8)9 pathway impairment. Sci. Rep. 2020, 10, 16492. [Google Scholar] [CrossRef]
- Jia, X.-X.; Zhu, T.-T.; Huang, Y.; Zeng, X.-X.; Zhang, H.; Zhang, W.-X. Wnt/β-catenin signaling pathway regulates asthma airway remodeling by influencing the expression of c-Myc and cyclin D1 via the p38 MAPK-dependent pathway. Exp. Ther. Med. 2019, 18, 3431–3438. [Google Scholar] [CrossRef] [PubMed]
- Peixoto, P.; Etcheverry, A.; Aubry, M.; Missey, A.; Lachat, C.; Perrard, J.; Hendrick, E.; Delage-Mourroux, R.; Mosser, J.; Borg, C.; et al. EMT is associated with an epigenetic signature of ECM remodeling genes. Cell Death Dis. 2019, 10, 205. [Google Scholar] [CrossRef] [PubMed]
- Reddel, H.K.; Bacharier, L.B.; Bateman, E.D.; Brightling, C.E.; Brusselle, G.G.; Buhl, R.; Cruz, A.A.; Duijts, L.; Drazen, J.M.; FitzGerald, J.M.; et al. Global Initiative for Asthma Strategy 2021: Executive summary and rationale for key changes. Eur. Respir. J. 2022, 59, 2102730. [Google Scholar] [CrossRef]
- Kuo, C.-H.S.; Pavlidis, S.; Loza, M.; Baribaud, F.; Rowe, A.; Pandis, I.; Sousa, A.; Corfield, J.; Djukanovic, R.; Lutter, R.; et al. T-helper cell type 2 (Th2) and non-Th2 molecular phenotypes of asthma using sputum transcriptomics in U-BIOPRED. Eur. Respir. J. 2017, 49, 1602135. [Google Scholar] [CrossRef]
- Sokolowski, J.W.; Burgher, L.W.; Jones, F.L.; Patterson, J.R.; Selecky, P.A. Position Paper on Guidelines for Fiberoptic Bronchoscopy in Adults. Am. Rev. Respir. Dis. 1987, 136, 1066. [Google Scholar] [CrossRef]
- Bazan-Socha, S.; Jakiela, B.; Zuk, J.; Zarychta, J.; Soja, J.; Okon, K.; Dziedzina, S.; Zareba, L.; Dropinski, J.; Wojcik, K.; et al. Interactions via α2β1 Cell Integrin May Protect against the Progression of Airway Structural Changes in Asthma. Int. J. Mol. Sci. 2021, 22, 6315. [Google Scholar] [CrossRef]
- Ferrando, R.E.; Nyengaard, J.R.; Hays, S.R.; Fahy, J.V.; Woodruff, P.G. Applying stereology to measure thickness of the basement membrane zone in bronchial biopsy specimens. J. Allergy Clin. Immunol. 2003, 112, 1243–1245. [Google Scholar] [CrossRef]
- Rueda, L. Microarray Image and Data Analysis; Rueda, L., Ed.; CRC Press: Boca Raton, FL, USA, 2018; ISBN 9781466586871. [Google Scholar]
- R Core Team. R: A Language and Environment for Statistical Computing; R Foundation for Statistical Computing: Vienna, Austria, 2020. [Google Scholar]
- Hu, J.; Zou, F.; Wright, F.A. Practical FDR-based sample size calculations in microarray experiments. Bioinformatics 2005, 21, 3264–3272. [Google Scholar] [CrossRef]
- Farahbod, M.; Pavlidis, P. Differential coexpression in human tissues and the confounding effect of mean expression levels. Bioinformatics 2019, 35, 55–61. [Google Scholar] [CrossRef]
- Watson, M. CoXpress: Differential co-expression in gene expression data. BMC Bioinform. 2006, 7, 509. [Google Scholar] [CrossRef]
- Chen, E.Y.; Tan, C.M.; Kou, Y.; Duan, Q.; Wang, Z.; Meirelles, G.V.; Clark, N.R.; Ma’Ayan, A. Enrichr: Interactive and collaborative HTML5 gene list enrichment analysis tool. BMC Bioinform. 2013, 14, 128. [Google Scholar] [CrossRef]
- Shannon, P.; Markiel, A.; Ozier, O.; Baliga, N.S.; Wang, J.T.; Ramage, D.; Amin, N.; Schwikowski, B.; Ideker, T. Cytoscape: A software environment for integrated models of Biomolecular Interaction Networks. Genome Res. 2003, 13, 2498–2504. [Google Scholar] [CrossRef]
- Zhou, G.; Soufan, O.; Ewald, J.; Hancock, R.E.W.; Basu, N.; Xia, J. NetworkAnalyst 3.0: A visual analytics platform for comprehensive gene expression profiling and meta-analysis. Nucleic Acids Res. 2019, 47, W234–W241. [Google Scholar] [CrossRef]
Disclaimer/Publisher’s Note: The statements, opinions and data contained in all publications are solely those of the individual author(s) and contributor(s) and not of MDPI and/or the editor(s). MDPI and/or the editor(s) disclaim responsibility for any injury to people or property resulting from any ideas, methods, instructions or products referred to in the content. |
© 2023 by the authors. Licensee MDPI, Basel, Switzerland. This article is an open access article distributed under the terms and conditions of the Creative Commons Attribution (CC BY) license (https://creativecommons.org/licenses/by/4.0/).