Abstract
Recent studies have demonstrated that somatic MED12 mutations in exon 2 occur at a frequency of up to 80% and have a functional role in leiomyoma pathogenesis. The objective of this study was to elucidate the expression profile of coding RNA transcripts in leiomyomas, with and without these mutations, and their paired myometrium. Next-generation RNA sequencing (NGS) was used to systematically profile the differentially expressed RNA transcripts from paired leiomyomas (n = 19). The differential analysis indicated there are 394 genes differentially and aberrantly expressed only in the mutated tumors. These genes were predominantly involved in the regulation of extracellular constituents. Of the differentially expressed genes that overlapped in the two comparison groups, the magnitude of change in gene expression was greater for many genes in tumors bearing MED12 mutations. Although the myometrium did not express MED12 mutations, there were marked differences in the transcriptome landscape of the myometrium from mutated and non-mutated specimens, with genes regulating the response to oxygen-containing compounds being most altered. In conclusion, MED12 mutations have profound effects on the expression of genes pivotal to leiomyoma pathogenesis in the tumor and the myometrium which could alter tumor characteristics and growth potential.
1. Introduction
Leiomyomas, also known as uterine fibroids, are benign uterine tumors, characterized by excess accumulation of extracellular matrix (ECM), increased cell proliferation, and inflammation [1,2,3]. Ovarian steroids are known to promote the growth and progression of leiomyomas [4] which affect about 70% women in their reproductive years. There are higher prevalence and symptom severity in African Americans [5] compared with Caucasian women. The mechanisms underlying the pathogenesis of leiomyomas have been under intense investigation and recent evidence using microarrays and next-generation RNA sequencing has indicated aberrant expression of a host of protein-coding genes and non-coding RNA (ncRNA) in leiomyomas, including long and small non-coding RNA (lncRNA and sncRNA), which play crucial roles in regulation of protein-coding genes through post-transcriptional, transcriptional, and epigenetic mechanisms [6,7,8,9,10,11]. These tumors are also characterized by genetic heterogeneity with chromosomal re-arrangements, and mutations in a number of driver genes such as MED12 (mediator complex subunit 12), FH (fumarate hydratase), HMGA2 (high mobility group AT-hook 2), and COL4A5/6 (collagen type IV alpha 5 and alpha 6). These driver mutations have been associated with development and growth progression of leiomyomas [12,13,14,15]. Of the driver mutations, MED12 gene mutations have gained the most attention in the pathophysiology of leiomyomas [16,17,18,19]. MED12 is one component of the mediator complex, which in humans is composed of 30 subunits and functions as a transcription coactivator of RNA polymerase II [20]. It interacts with over 3000 transcription factors controlling the transcription of a wide array of genes [21]. MED12 along with MED13, cyclin C, and either CDK8 or CDK19 are components of the kinase module of this mediator. MED12 stimulates the kinase activity of CDK8 by bridging the interaction between MED13 and cyclin C–CDK8 [21]. Dysregulation of MED12 is found in many human cancers [21]. In leiomyoma, somatic MED12 mutations in exon 2 occur at a frequency of up to 80% regardless of race/ethnicity [16,17,18,19]. The MED12-mutant leiomyomas are smaller in size and more often subserous in location [22]. Mutations in exon 2 of MED12 are gain-of-function mutations, as evidenced by transgenic mice which developed leiomyoma-like tumors in the uterus when a conditional mutation in MED12 was introduced [23]. Mutations in the MED12 gene have been shown to disrupt its ability to activate cyclin C-dependent CDK8 [24], and its CDK19 stimulatory activity [25]. Moreover, these mutations were reported to be associated with abnormal activation of many genes regulating important pathways in leiomyoma pathogenesis, including the Wnt/β-catenin signaling, hedgehog signaling, sex steroid receptor signaling, and transforming growth factor (TGF)-β receptor signaling pathways [17,18,19,26,27].
The impact of the high occurrence of MED12 mutations in leiomyomas on the expression of genes critical to leiomyoma pathogenesis remains unknown. Therefore, the objective of the present study was to determine and compare the expression profile of differentially expressed coding RNA transcripts using high-throughput sequencing and in-depth data analysis based on the MED12 mutation status of the leiomyoma. This next-generation sequencing (NGS) profiling was followed by validation studies of 31 differentially expressed genes in 73 specimens using quantitative reverse-transcription polymerase chain reaction (qRT-PCR).
2. Results
2.1. High-Throughput Sequencing of Coding RNA Transcripts in Leiomyoma and Matched Myometrium
We initiated our investigation with high-throughput next-generation RNA sequencing (NGS) with RNA isolated from nineteen paired leiomyomas, including eight MED12-mutation-negative and eleven MED12-mutation-positive leiomyomas. We first analyzed the differential expression of genes in all the specimens regardless of MED12 mutation analysis. Following normalization of 29,354 RNA transcripts, hierarchical clustering and TreeView analysis, comparing leiomyomas with the matched myometrium group, resulted in identification of 9699 RNA transcripts whose expression was altered significantly, with overexpression of 5665 RNA transcripts and downregulation of 4034 RNA transcripts by 1.5-fold or greater in leiomyoma (Figure 1A). Volcano plot filtering indicated that 2344 RNA transcripts were upregulated, and 1711 RNA transcripts were downregulated in leiomyomas compared with their matched myometrium (fold change > 1.5 and p < 0.05; Figure 1B). Principal component analysis (PCA), which examines the similarity in the pattern of RNA transcripts among two groups, was performed, followed by k-mean analysis to cluster the samples, indicating the high reliability of the data (Figure 1C). Subsequently, by using the STRING database and Cytoscape software a functional analysis of the protein–protein interaction (PPI) network was constructed demonstrating the highlighted associations between target genes involved in leiomyoma pathogenesis (Figure 1D). The involvement of many proteins such as FN1, COL1A1, BMP7, CCND1, EZH2, HMGA2, AhR, and E2F1 shown in the protein–protein interaction networks are well known in leiomyoma pathogenesis [8,28,29,30,31,32]; others, such as SOX2, REN, PPARG, ABCB1, and NR3C1 are novel and require further investigation.
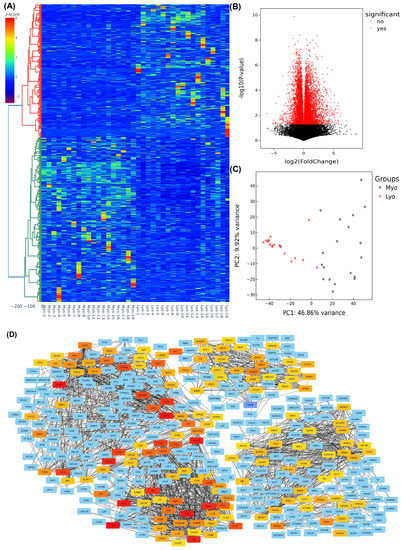
Figure 1.
Heterogeneity and transcriptomic changes in leiomyomas compared to the myometrium. (A) Hierarchically clustered heatmap analysis of the differentially expressed transcripts (fold change ≥ 1.5, p < 0.05) in 19 paired leiomyomas and matched myometrium. Color gradient represents gene expression as z-scores. (B) Volcano plot showing up- (n = 2344) and downregulated genes (n = 1711) with a false discovery rate (FDR), p-value < 0.05, depicted as red dots. (C) Principal component analysis (PCA) plot of RNA-seq results from paired leiomyomas and matched myometrium (n = 19). Each dot represents one sample. Myometrial samples (Myo) are shown in black and leiomyoma samples (Lyo) are shown in red. (D) The protein–protein interaction networks were constructed with the Search Tool for the Retrieval of Interacting Genes (STRING) database and Cytoscape software version 3.9.1 using the 150 hub genes identified by the CytoHubba plugin of the Cytoscape software platform. The color of nodes denotes interaction degree (from high to low degree: red, orange, yellow, and blue).
2.2. Differential Expression of MED12-Associated Coding RNA Transcripts in Leiomyoma and Matched Myometrium
We then examined the differential expression of genes in MED12-mutated and non-mutated specimens. We observed a significant overlap of differentially expressed genes between the two groups although in mutated specimens the degree of change was greater for most genes. The analysis was performed as fold change (leiomyoma/paired myometrium) comparing mutated and non-mutated group. This analysis, based on differential expression, resulted in identification of 2757 RNA transcripts with altered expression, of which the expression of 1406 RNA transcripts was increased, while the expression of 1351 RNA transcripts was decreased by 1.5-fold or greater in MED12-mutated specimens compared with non-mutated specimens. Hierarchical clustering and TreeView analysis separated these transcripts into their respective groups (Figure 2A). We identified 394 transcripts that showed more than 1.5-fold change (up or down) in the mutated specimens but not in the non-mutated specimens. The heat map (Figure 2B) shows 109 out of the 394 transcripts that were uniquely altered in the MED12-mutated specimens. The gene ontology (GO) and KEGG (Kyoto Encyclopedia of Genes and Genomes) pathway enrichment analyses for these 109 transcripts revealed that the genes that were uniquely expressed in the mutated group were predominantly involved in the regulation of extracellular matrix constituents (Figure 2C).
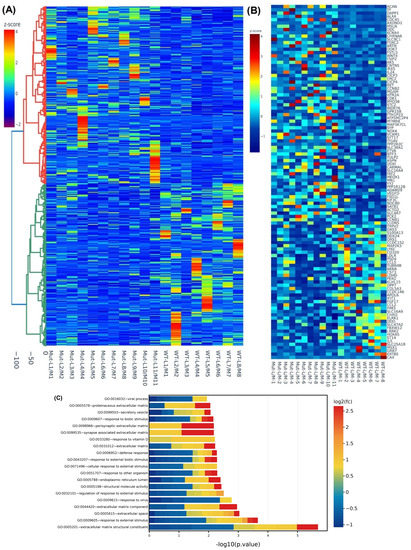
Figure 2.
Differential levels of transcriptomic heterogeneity of genes in paired specimens analyzed based on MED12-mutation status. (A) Hierarchically clustered heatmap analysis was performed as fold change (leiomyoma/paired myometrium) comparing the MED12-mutated (n = 11) with the non-mutated (n = 8) group (fold change ≥ 1.5, p < 0.05). Color gradient represents gene expression as z-scores. (B) Heatmap of the 109 enriched genes (leiomyoma/paired myometrium) in the MED12-mutated (n = 11) but not in the non-mutated (n = 8) group (fold change ≥ 1.5, p < 0.05). Color gradient represents gene expression levels as z-scores. (C) Gene ontology (GO) analysis of 394 differentially expressed genes (leiomyoma/paired myometrium) in the MED12-mutated (n = 11) but not in the non-mutated (n = 8) group (fold change ≥ 1.5, p < 0.05). Color gradient represents levels of log2 fold change presented as z-scores.
2.3. Differential Expression of MED12-Associated Coding RNA Transcripts in Myometrium
We next sought to examine if there were any differences in the expression of genes in the myometrium of specimens with the MED12 mutation compared with non-mutated specimens. Although we did not detect mutations in the MED12 gene in any myometrial tissues, we observed marked differences in the expression profile in the myometrium adjacent to MED12-mutated leiomyomas compared with the myometrium adjacent to MED12 wild-type tumors. The analysis of RNA sequencing data in myometrium based on MED12 mutation status of their paired adjacent leiomyomas indicated that the expression of 6259 RNA transcripts were altered, of which 2219 RNA transcripts were up-regulated, while 4040 RNA transcripts were downregulated by 1.5-fold or greater in myometrium adjacent to MED12-mutated leiomyomas compared to myometrium adjacent to MED12 wild-type leiomyomas. Hierarchical clustering and TreeView analysis separated these transcripts into their respective group (Figure 3A). A volcano plot, a PCA and a PPI network were constructed to highlight MED12-associated RNA transcripts in their paired adjacent leiomyomas (Figure 3B–D). Many proteins such as F3, WNT2, CDH1, and LIF [33,34,35,36] shown in the protein–protein interaction networks are well known in leiomyoma pathogenesis, and others, such as ICAM1, CXCL8, CCL2, and NANOG are novel and require further investigation. The gene ontology (GO) and KEGG pathway enrichment analyses of genes with altered expression in the myometrium indicated that these genes were mainly involved in the response to oxygen-containing compounds and the extracellular space (Figure 3E). Selected genes in each of the pathways shown in Figure 3E are presented in Supplementary Table S1. We selected five of the differentially expressed novel RNA transcripts in the myometrium (WNT16, CACNA1D, DCX, MTMR8, and WIF1) for confirmation using qRT-PCR in seventy-three paired specimens (Figure 4). This analysis indicated that the expression of WNT16, CACNA1D, DCX, and WIF1 was significantly higher, while the expression of MTMR8 was significantly lower in myometrium adjacent to MED12-mutated leiomyomas compared to myometrium adjacent to MED12 wild-type leiomyomas (Figure 4).
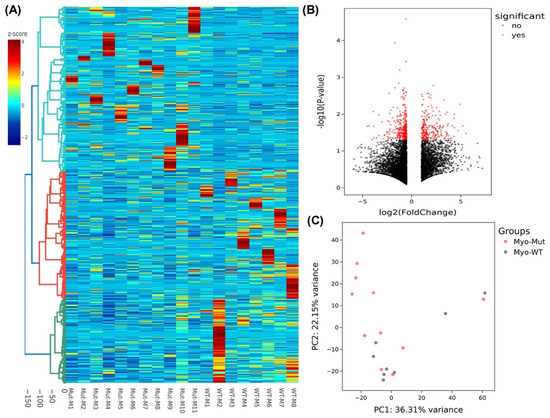
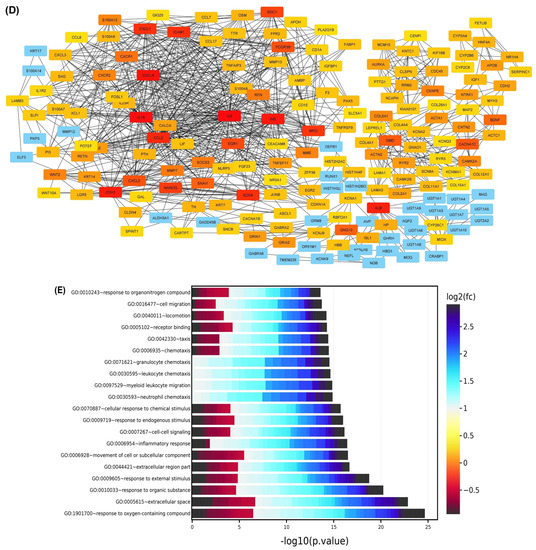
Figure 3.
Heterogeneity and transcriptomic changes in myometrium specimens based on MED12-mutation status of their paired adjacent leiomyomas. (A) Hierarchically clustered heatmap analysis was performed in the myometrium comparing the MED12-mutated (n = 11) with the non-mutated (n = 8) group of their paired adjacent leiomyomas (fold change ≥ 1.5, p < 0.05). Color gradient represents gene expression as z-scores. (B) Volcano plot showing up- (n = 2219) and downregulated genes (n = 4040) with a false discovery rate (FDR), p-value < 0.05, depicted as red dots. (C) Principal component analysis (PCA) plot of RNA-seq results in the myometrium comparing the MED12-mutated (n = 11) with non-mutated (n = 8) group of their paired adjacent leiomyomas. Each dot represents one sample. Myometrial samples from MED12 mutation-negative adjacent leiomyomas (Myo-WT) are shown in black and myometrial samples from MED12-mutated adjacent leiomyomas (Myo-Mut) are shown in red. (D) The protein–protein interaction networks were constructed with the Search Tool for the Retrieval of Interacting Genes (STRING) database and Cytoscape software version 3.9.1 using the 150 hub genes identified by the CytoHubba plugin of the Cytoscape software platform. The color of the nodes denotes interaction degree (from high to low degree: red, orange, yellow, and blue). (E) Gene ontology (GO) analysis of the identified differentially expressed 150 hub genes in the myometrium comparing the MED12-mutated (n = 11) with the non-mutated (n = 8) group of their paired adjacent leiomyomas (fold change ≥ 1.5, p < 0.05). Color gradient represents level of log2 fold change presented as z-scores.
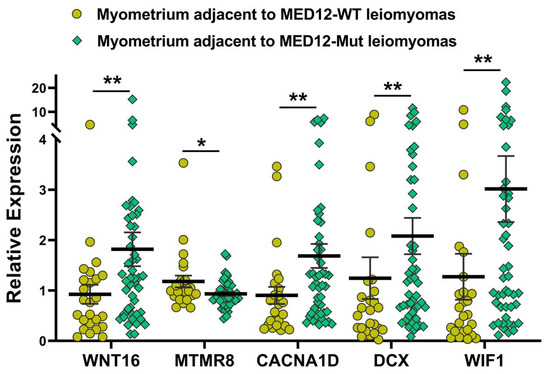
Figure 4.
The expression of selected genes from the analysis of the myometrium (n = 73) based on MED12-mutation status of their paired adjacent leiomyomas by qRT-PCR. The results are presented as mean ± SEM with p values (* p < 0.05; ** p < 0.01) as indicated by the corresponding lines.
2.4. Validation of MED12-Associated Coding RNA Transcripts in Leiomyoma and Matched Myometrium
To provide support and validate the NGS data we selected 31 differentially expressed coding RNA transcripts for confirmation studies using qRT-PCR (n = 73) including the same tissues used for RNA sequencing (Figure 5). Of the 73 paired specimens, 48 leiomyomas had MED12 mutations (65.8%). The prevalence of MED12 mutations in our patient population was in agreement with previously published reports [16,17,18,19]. The gene ontology (GO) and KEGG pathway enrichment analyses of the selected differentially expressed RNA transcripts revealed that these genes were involved in multiple signaling pathways such as ECM–receptor interaction (Figure 5A; COL11A1, MUC12, FRMD5, FCGBP, EGFL6, FN1, KLK5, ITGA9, and DCX), cell signaling pathways including the Wnt signaling pathway (Figure 5B; WNT4, WNT2, WNT16, and WIF1), chemokine signaling pathways (Figure 5B; CXCL13), PI3K/AKT signaling (Figure 5B; CBX8), TLR signaling (Figure 5B; S100A1), signaling by Rho GTPases (Figure 5B,C; NDC80 and NTM), the VEGFA–VEGFR2 signaling pathway (Figure 5C; RAB37), signal-transducing phosphatase (Figure 5C; PPP1R14C), the Jak/STAT signaling pathway (Figure 5C; JAK3), the TGF-β signaling pathway (Figure 5C; BMP7), transcription regulation (Figure 5C; S100A4 and HMX1), ion homeostasis (Figure 5C; CACNA1D and RGS4), and metabolic pathways (Figure 5D; EZH2, IGFBPL1, MTMR8, ATP5MC1P1, and CYP19A1). Among the 31 RNA transcripts validated, the expression of COL11A1, MUC12, FRMD5, FCGBP, EGFL6, FN1, KLK5, ITGA9, DCX, WNT4, WNT2, WNT16, WIF1, CXCL13, CBX8, NDC80, NTM, PPP1R14C, BMP7, EZH2, IGFBPL1, MTMR8, ATP5MC1P1, CYP19A1, HMX1, CACNA1D, and RGS4 was significantly higher, while the expression of S100A1, RAB37, and S100A4 was significantly lower in leiomyomas compared to matched myometrium (Figure 5A–D). Further comparisons were made comparing mutated leiomyomas to non-mutated leiomyomas and mutated myometrium to non-mutated ones (Figure 6A–D). The differentially expressed genes (leiomyoma/paired myometrium) in the two comparison groups are shown in Figure 7. As shown in Figure 6, the magnitude of differences in expression between the mutated and non-mutated groups was most pronounced for KLK5, WNT 4, WNT16, PPP1R14C, NTM, IGFBPL1, EGFL6, FCGBP, COL11A1, FRMD5, DCX, CBX8, and RAB37. A summary of the analyses from Figure 6 and Figure 7 is shown in Table 1. The expression pattern of these 31 genes when divided into mutated and non-mutated groups, was similar to the analysis when all samples were combined regardless of mutation status (Figure 5), with the exception of JAK3, which showed no significant difference in expression in the combined group analysis but was significantly different when analyzed based on the mutation status (Figure 5C). The expression of the 31 RNA transcripts was also similar when the data were analyzed as differentially expressed versus when the comparison was performed based on expression levels in the leiomyomas alone, except for S100A1, MTMR8, CACNA1D, DCX, BMP7, RGS4, and CYP19A1 (Table 1).
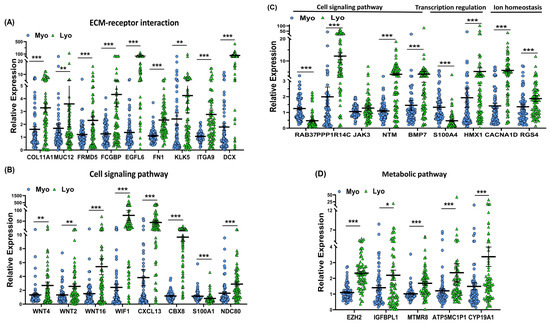
Figure 5.
The expression of selected genes from the analysis between myometrium and paired leiomyomas (n = 73) measured using qRT-PCR. (A) COL11A1, MUC12, FRMD5, FCGBP, EGFL6, FN1, KLK5, ITGA9, and DCX; (B) WNT4, WNT2, WNT16, WIF1, CXCL13, CBX8, S100A1, and NDC80; (C) RAB37, PPP1R14C, JAK3, NTM, BMP7, S100A4, HMX1, CACNA1D, and RGS4; (D) EZH2, IGFBPL1, MTMR8, ATP5MC1P1, and CYP19A1. The results are presented as mean ± SEM with p values (* p < 0.05; ** p < 0.01; *** p < 0.001) indicated by corresponding lines.
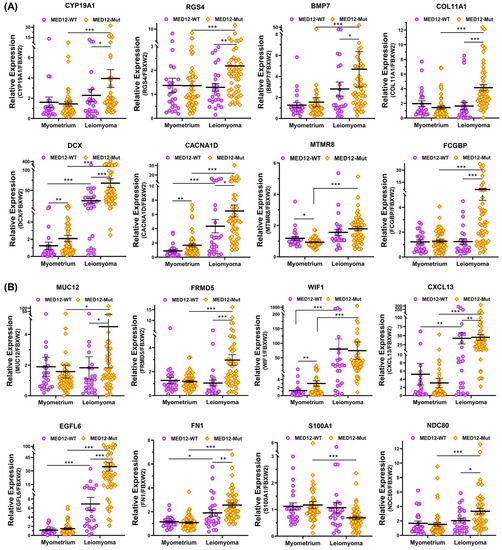
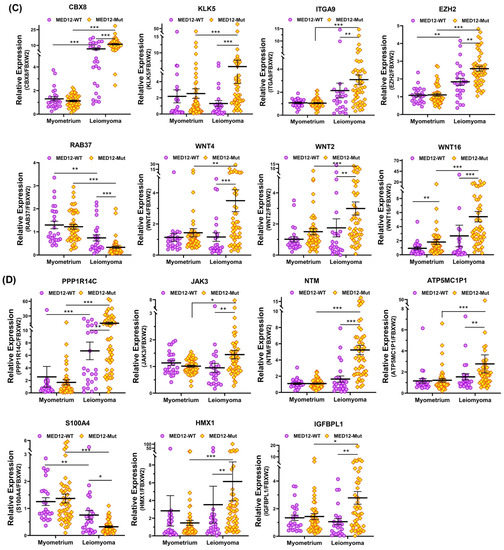
Figure 6.
The expression of mRNA for (A) CYP19A1, RGS4, BMP7, COL11A1, DCX, CACNA1D, MTMR8, and FCGBP; (B) MUC12, FRMD5, WIF1, CXCL13, EGFL6, FN1, S100A1, and NDC80; (C) CBX8, KLK5, ITGA9, EZH2, RAB37, WNT4, WNT2, and WNT16; (D) PPP1R14C, JAK3, NTM, ATP5MC1P1, S100A4, HMX1, and IGFBPL1 in MED12-mutated leiomyomas (n = 48) and non-mutated leiomyomas (n = 25) and myometrium adjacent to MED12-mutated (n = 48) or non-mutated leiomyomas (n = 25) measured using qRT-PCR. The results are presented as mean ± SEM with p values (* p < 0.05; ** p < 0.01; *** p < 0.001) as indicated by the corresponding lines.
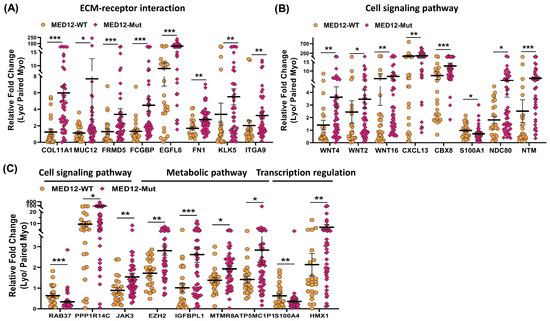
Figure 7.
The expression of mRNA for (A) COL11A1, MUC12, FRMD5, FCGBP, EGFL6, FN1, KLK5, and ITGA9; (B) WNT4, WNT2, WNT16, CXCL13, CBX8, S100A1, NDC80, and NTM; (C) RAB37, PPP1R14C, JAK3, EZH2, IGFBPL1, MTMR8, ATP5MC1P1, S100A4, and HMX1 expressed as fold change (Lyo/paired Myo) in MED12-mutated (n = 48) and non-mutated (n = 25) specimens measured using qRT-PCR. The results are presented as mean ± SEM with p values (* p < 0.05; ** p < 0.01; *** p < 0.001) as indicated by the corresponding lines.

Table 1.
Genes selected based on the RNAseq analysis according to the MED12 mutation status.
3. Discussion
The results of this study provide a comprehensive profile of protein-coding genes whose expression is altered by the presence or absence of MED12 mutations in the tumor. Although there was a significant overlap of differentially expressed genes in mutated and non-mutated specimens, there were 394 transcripts that were uniquely aberrantly expressed in the mutated specimens compared with non-mutated ones. Using the DAVID gene functional classification tool [73,74] for gene ontology (GO) and KEGG pathway enrichment analyses for these transcripts indicated that these genes were predominantly involved in the regulation of extracellular matrix constituents, response to external stimulus, and extracellular space. Although the myometrium of mutated specimens did not express MED12 mutations, the expression of WNT16, CACNA1D, DCX, WIF1, and MTMR8 genes were significantly altered in the myometrium of MED12-mutated specimens compared with non-mutated specimens, with WNT16, CACNA1D, DCX, and WIF1 genes upregulated and the MTMR8 gene downregulated. Pathway enrichment analysis for these myometrial genes showed predominant involvement in response to oxygen-containing compounds, extracellular space, and response to organic substances and external stimuli. Validation studies using PCR, performed in 73 specimens, confirmed the RNA-seq results indicating the differential expression of COL11A1, MUC12, FRMD5, FCGBP, EGFL6, FN1, KLK5, ITGA9, WNT4, WNT2, WNT16, CXCL13, CBX8, NDC80, NTM, PPP1R14C, JAK3, EZH2, IGFBPL1, MTMR8, ATP5MC1P1, HMX1, CYP19A1, RGS4, BMP7, DCX, and CACNA1D mRNA was significantly higher, while the expression of S100A1, RAB37, and S100A4 mRNA was significantly lower in MED12-mutated leiomyomas compared with non-mutated specimens.
The mediator complex is composed of the head, middle, tail, and kinase modules and gene-specific transcription factors bind through the tail and kinase domains and then transduce the regulatory information through the middle and head modules to RNA polymerase 11, thereby regulating the expression of a wide array of genes [21]. It remains to be determined how, despite the loss of mediator-associated CDK activity [24], the transcription of so many genes as shown here are altered by the MED12 mutations. One possibility for the widespread effects of these mutations on gene expression is that the mediator is known to interact with super enhancers which regulate gene families [75], and in a recent publication [11] we reported that the expression of multiple super enhancers is altered in leiomyomas, many of which were dependent on the MED12-mutation status of the tumors. Our data indicate that the presence of a MED12 mutation does not only affect the expression of genes in the leiomyoma but also in the myometrium which does not express the MED12 mutation. Potential mechanisms that could account for this crosstalk between the leiomyomas and the adjacent myometrium is through exosomes containing regulatory RNAs, the expression of which are altered in the mutated leiomyomas [6,76]. These regulatory RNAs such as miRNAs within the exosome could, through the systemic circulation or in a paracrine manner, influence the expression of genes in the myometrium. The myometrial genes whose expressions were altered by the presence of MED12 mutations were predominantly involved in processes related to response to oxygen-containing compounds, extracellular space, and response to external stimuli. The importance of the myometrium in the pathophysiology of leiomyomas was highlighted in recent reports showing myometrial oxidative stress can drive MED12 mutations in leiomyomas [77], and another report demonstrating differences in the transcriptome of myometrium from patients with leiomyomas compared with myometrium from non-diseased uteri [78]. In addition, uterine contractions induce uterine hypoxia in reproductive-aged women [79], and this insult can cause activation of NF-κB-mediated inflammation as has been demonstrated for human stromal cells [80].
WNT/β-catenin plays a pivotal role in leiomyoma pathogenesis. In an early study, constitutive activation of β-catenin led to development of mesenchymal tumors similar to leiomyomas in mice [81]. Another study demonstrated that WNT4 was significantly overexpressed in leiomyoma intermediate cells, inducing cell proliferation through Akt-dependent β-catenin activation, and resulting in the induction of pro-proliferative genes such as cyclin D1 and c-Myc [82]. Moreover, the expression of WNT16 in leiomyoma stem cells was increased in response to estrogen and progesterone and led to growth of leiomyoma cells in a paracrine manner through activation of canonical WNT signaling [83]. WNT2, WNT4, and WNT16 are subunits of the WNT gene family and have been reported to be involved in several developmental processes and in tumorigenesis [50]. Here we showed that WNT2, WNT4, and WNT16 are overexpressed in leiomyomas, and that this upregulation was more pronounced in MED12-mutated leiomyomas compared to MED12 mutation-negative specimens, which is in line with previous reports [17,19,84]. In addition, the myometrial expression of WNT16 in MED12-mutated specimens was greater compared to myometrium of mutation-negative leiomyomas. These findings raise the intriguing possibility that MED12 mutations in the leiomyomas also induce changes in the expression of WNT16 in the adjacent myometrium, which further fuels tumorigenesis in mutated specimens; this possibility could account for the observation of multiplicity of tumors in MED12-mutated specimens compared to non-mutated tumors which are generally solitary [22]. An unexpected finding was the overexpression of the WNT inhibitory factor (WIF1) in leiomyomas. WIF1, is a lipid-binding protein that binds to WNT proteins and prevents them from signaling [85]. The presence of mutations did not affect the degree of overexpression of WIF1; however, the myometrium of mutated specimens also overexpressed WIF1 mRNA compared to myometrium of non-mutated specimens. Others have also reported overexpression of WIF1 and other WNT-protein inhibitors such as SFRP1, FBXW11, NKD1, and SFPR4 in leiomyomas [84]. Moreover, the expression of DKK1 and SFRP1 was higher in MED12-mutated tumors compared with non-mutated ones [84]. A potential possibility is that overexpression of these WNT-inhibitory proteins could be a mechanism to prevent leiomyomas from becoming malignant and invasive.
One of the hallmarks of leiomyomas is the accumulation of ECM [2]. Our profiling indicates that the genes that were uniquely dysregulated in MED12-mutated specimens predominantly fell in the category of ECM structural constituents, among them were KRT80, COL5A3, NDC80, WNT4, MTMR8, and FGF17 (Figure 2B). Several other genes, although upregulated in non-mutated samples, showed a greater magnitude of increase in expression in the mutated leiomyoma group, including FN1, DCX, and COL11A1. FN1 is a major component of the extracellular matrix and exists as a dimeric or multimeric form linked by disulfide bonds to other extracellular matrix proteins such as integrins, collagen, fibrin, and heparan sulfate proteoglycans [44,45]. FN1 plays a major role in cell adhesion, growth, differentiation, and migration processes including wound healing and embryonic development, host defense, blood coagulation, and metastasis [44,45]. Several groups have reported that leiomyomas express higher levels of FN1 compared to myometrium [8,86]. The greater expression of FN1 in mutated leiomyomas suggests a much greater accumulation of ECM in mutated tumors, as FN1 is one of the major components of ECM. A recent report showed increased ECM activity in MED12-mutated tumors and although no specific ECM genes were specified, histologic evidence for increased collagen levels in mutated tumors was provided. The authors of this study also provided evidence for differences in the DNA methylome of mutated tumors, although no validation studies were provided for any specific genes [87]. Another component of the ECM is COL11A1 which is one alpha chain of type XI collagen and is involved in fibrillogenesis through regulation of the lateral growth of collagen II fibrils [37]. Recent evidence has shown that COL11A1 is frequently overexpressed in various tumors and its expression is highly correlated with tumor aggressiveness. Our results indicate greater overexpression of COL11A1 in mutated tumors compared with non-muted ones. DCX is another component of the ECM. It is a microtubule-associated protein belonging to the doublecortin family. DCX is expressed in immature neurons and neuronal precursor cells and binds to the microtubule cytoskeleton to direct neuronal migration through modulation and stabilization of microtubules [49]. Several studies suggested that DCX is correlated to cancer cells invasion and metastasis and is overexpressed in leiomyomas as well [49,88,89]. Our data indicate that in addition to marked overexpression of DCX in leiomyomas, in both mutated and non-mutated tumors with greater increase in the mutated leiomyomas, the myometrium of MED12-mutated specimens also overexpressed DCX. This finding points to a probable significance of DCX in ECM remodeling and crosstalk between leiomyoma and myometrium in this process. Another noteworthy ECM-regulating gene is KLK5 which was differentially overexpressed in mutated leiomyomas but not in the non-mutated specimens. KLK5 is a serine protease and a member of the kallikrein subfamily with involvement in collagen formation and MSP-RON signaling [46,47]. Growing evidence suggests that KLK5 is upregulated in numerous types of cancers such as colorectal cancer, gastric cancer, and oral cancer and is implicated in carcinogenesis [90,91,92,93]. KLK5 is upregulated by estrogens and progestins [46]. One substrate of KLK5 is PAR2, which triggers pro-inflammatory mediators and induces the expression of NF-κB target genes in both immune cells and tumor cells [91]. Our group and others have previously reported on the significance of inflammation and the NF-κB pathway in leiomyoma pathogenesis [94,95]. Overall, the differential expression of genes regulating the constituents of ECM in mutated and non-mutated specimens suggests potential differences in tumor stiffness in mutated leiomyomas compared with non-mutated leiomyomas and merits further investigation.
Our data indicate that the expression of a number of genes regulating calcium homeostasis is dysregulated in leiomyomas in a MED12-dependent manner. Among these genes are the calcium-binding proteins S100A4 and S100A1, and CACNA1D (calcium voltage-channel subunit alpha-1D) which regulates calcium entry into cells [53,54,69,71]. S100A1, upon binding to calcium, undergoes conformational change and interacts with numerous protein targets such as those involved in calcium signaling, filament-associated proteins, transcription factors, and others [96,97]. S100A4 plays a vital role in fibrotic diseases [98]. It is released at inflammatory sites and is implicated in ECM remodeling, cell motility, invasion, and angiogenesis [98] and in epithelial–mesenchymal transition [99] all of which are critical in leiomyoma pathogenesis. In the realm of cancer, S100A4 is a transcriptional target of β-catenin and promotes tumor migration, invasion, and metastasis [100]. Our data, demonstrating decreased expression of S100A4 and S100A1 particularly in mutated tumors and the increase in CACNA1D expression, suggest potential reduced binding of calcium and greater calcium entry into leiomyoma cells which could contribute to tumor calcification. Currently there are no data indicative of a difference in calcium content of mutated compared with non-mutated tumors.
The growth of leiomyomas is dependent on estrogen [4] and early studies demonstrated that the expression level of CYP19A1, or aromatase, which is a member of the cytochrome P450 superfamily and converts androgens to estrogens [68], is higher in leiomyomas [101] and this increase is more pronounced in African American women compared with Japanese women [102]. Here we confirmed that leiomyomas overexpress aromatase, but, more importantly, we showed that this increase is of greater magnitude in MED12-mutated tumors compared with non-mutated tumors. Leiomyomas are also characterized by a number of epigenetic modifications [103]. Among the epigenetic enzymes involved in these modifications is EZH2 which is a catalytic core protein in PRC2 and catalyzes the methylation of H3K27, thereby silencing the transcription of target genes [64]. Several studies demonstrated overexpression of EZH2 in leiomyomas [104,105]. Here we confirmed higher expression of EZH2 in leiomyomas and showed that the magnitude of overexpression is higher in MED12-mutated tumors compared with non-mutated tumors. Collectively, these results indicate potential greater local exposure to estrogen in mutated tumors along with greater degree of epigenetic modifications.
In summary, we demonstrate that although there is a significant overlap in the differential expression of genes in MED12-mutated and non-mutated leiomyomas, the degree of change in expression is heightened for many genes in the MED12-mutated specimens. One limitation of our study is that a myomatous uterus has multiple tumors which might express different types of MED12 mutations [32], and these mutations may not induce the same changes in the transcriptome. Furthermore, a whole host of genes are uniquely over- or under-expressed in mutated tumors. These unique genes primarily regulate ECM structural constituents and components, and response to external stimuli. Our study also points to the significance of the myometrial compartment as a site of gene dysregulation as evidenced by differences in the expression of a unique set of genes in the myometrium of MED12-mutated specimens compared with non-muted myometrium. This result suggests a potential communication between the tumor and the adjacent myometrium which could contribute to tumor progression and growth.
4. Materials and Methods
4.1. Myometrium and Leiomyoma Tissue Collection
Portions of uterine leiomyomas (intramural, 3–5 cm in diameter) and paired myometrium (n = 73) were obtained from patients at Harbor-UCLA Medical Center. Prior approval from the Institutional Review Board (18CR-31752-01R) at the Lundquist Institute was obtained. Informed consent was obtained from all patients participating in the study who were not taking any hormonal medications for at least 3 months prior to surgery. The paired tissues were from Caucasian (n = 9), African American (n = 23), Hispanic (n = 37), and Asian (n = 4) women aged 30–54 years (mean 45 ± 5.2 years). The tissues were snap-frozen and stored in liquid nitrogen for further analysis as previously described [33,35].
4.2. MED12-Mutation Analysis
Genomic DNA from leiomyomas and paired myometrial specimens was extracted from 100 mg of freshly frozen tissue using MagaZorb DNA Mini-Prep Kits (Promega, Madison, WI, USA) according to the manufacturer’s protocol. PCR amplification and Sanger sequencing (Laragen Inc., Culver City, CA, USA) were performed to investigate MED12 exon 2 mutations using the following primer sequences in the 5′–3′ direction: sense, GCCCTTTCACCTTGTTCCTT and antisense, TGTCCCTATAAGTCTTCCCAACC. PCR products were sequenced using Big Dye Terminator v.3.1 sequencing chemistry and the sequences were analyzed with the Software ChromasPro 2.1.8 and compared with the MED12 reference sequence (NG_012808 and NM_005120). The 19 pairs of tissues used for next-generation RNA sequencing were from 11 MED12-mutation positive and 8 MED12-mutation negative leiomyomas. The mutation analysis of the specimens (n = 73) indicated that 48 leiomyomas had MED12 mutations (48/73 pairs; 65.8%) with no mutations in the myometrium. Missense mutations in MED12 exon 2 were the most frequent alteration (39/48 pairs), followed by in-frame insertion–deletion type mutations (9/48 pairs). The missense mutations in exon 2 included c.130G > C (p.Gly44Arg) (5/39 pairs), c.130G > A (p.Gly44Ser) (7/39 pairs), c.130G > T (p.Gly44Cys) (2/39 pairs), c.131G > C (p.Gly44Ala) (2/39 pairs), c.131G > A (p.Gly44Asp) (17/39 pairs), c.131G > T (p.Gly44Val) (5/39 pairs), and c.128A > C (p.Gln43Pro) (1/39 pairs).
4.3. RNA Sequencing and Bioinformatic Analysis
Total RNA was extracted from leiomyomas and matched myometrium using TRIzol (Thermo Fisher Scientific Inc., Waltham, MA, USA). RNA concentration and integrity was determined using a Nanodrop 2000c spectrophotometer (Thermo Scientific, Wilmington, DE, USA) and Agilent 2100 Bioanalyzer (Agilent Technologies, Santa Clara, CA, USA) as previously described [9,29,30,106]. Samples with RNA integrity numbers (RIN) greater than or equal to 9 were used for library preparation. One microgram of total RNA from each tissue was used to produce strand-specific cDNA libraries using Truseq (Illumina, San Diego, CA, USA) according to manufacturer’s instructions. The RNA sequencing was carried out at Novogene Corporation Inc. The computational analysis was started by establishment of pairs of Fastq files for all samples. The workflow consisted of QC check (FastQC) -> alignment (Hisat2) -> feature counts (subread) -> differential gene expression analysis (DESeq2). For quality control FastQC was used to check the quality of raw fastq data from sequencing core and after adaptor cut and quality trimming [107]. FastQC reports consisted of multiple parameters such as the number of reads, duplicates, adapter contents, and sequence quality score. HISAT2 was applied to perform alignment [108]. The reads of raw fastq data with either end were distributed from 17.1 M to 34.8 M and the alignment rates were higher than 95%. Assigned reads for feature count were distributed from 17.7 M to 36.7 M in correspondence to the rate of assigned reads from 80.1% to 96.5%. Each sample produced a bam file after alignment to the genome. Features from each bam file that mapped to the genome in the provided annotation file were counted using the subread function [109]. MultiQC was used to analyze and integrate the QC reports, with input data from reports of fastqc, alignment reads, and feature assigned [110]. An R package, DESeq2, was used to analyze differential gene expression [111]. Markers/genes with sum-of-read counts across all cases and controls that were 10 or greater were kept for the downstream analysis. During DGE analysis, a boxplot of the Cook’s distances was prepared to determine if any sample raw reads departed from others. All our samples’ raw reads in the boxplot were relatively even and all samples were included into the downstream analysis for differential gene expression (DGE). To visualize the strength of differential gene expression, the hierarchical clustering and TreeView graphs, volcano plots, PCA plots, and pathway enrichment analysis plots were prepared using Flaski [112], and the protein–protein interaction networks were prepared using the Search Tool for the Retrieval of Interacting Genes (STRING) database [113]. Overall, all differential gene expressions were acceptable for subsequent statistical analysis. The RNA sequencing data were deposited in Gene Expression Omnibus (GEO) database with accession number (GSE224991).
4.4. Quantitative RT-PCR
Briefly, 2 μg of RNA was reverse transcribed using random primers for selected genes according to the manufacturer’s guidelines (Applied Biosystems, Carlsbad, CA, USA). Quantitative RT-PCR was carried out using SYBR gene expression master mix (Applied Biosystems). Reactions were incubated for 10 min at 95 °C followed by 40 cycles for 15 s at 95 °C and 1 min at 60 °C. The expression levels of selected genes were quantified using the Invitrogen StepOne System with FBXW2 (F-box and WD repeat domain containing 2) used for normalization [114]. All reactions were run in triplicate and relative mRNA expression was determined using the comparative cycle threshold method (2-ΔΔCq), as recommended by the supplier (Applied Biosystems). Values were expressed as fold change compared to the control group. The primer sequences in the 5′–3′ direction used are listed in Supplementary Table S2.
4.5. Statistical Analysis
Throughout the text, results are presented as mean ± SEM and were analyzed using PRISM software (Graph-Pad, San Diego, CA, USA). Dataset normality was determined using the Kolmogorov–Smirnoff test. The data presented in this study were not normally distributed and therefore non-parametric tests were used for data analysis. Comparisons involving two groups were analyzed using the Wilcoxon matched pairs signed rank test (Figure 5) or the Mann–Whitney test (Figure 4, Figure 6 and Figure 7) as appropriate. Statistical significance was established at p < 0.05.
Supplementary Materials
The following supporting information can be downloaded at: https://www.mdpi.com/article/10.3390/ijms24043742/s1.
Author Contributions
O.K. and T.-D.C. designed the research studies; T.-D.C., D.Q., H.M. and D.B. conducted the experiments; T.-D.C., J.G. and H.M. acquired the data; T.-D.C. and J.G. analyzed the data; T.-D.C. and O.K. interpreted the data; T.-D.C. and O.K. wrote and edited the manuscript; W.Y. reviewed the manuscript. No honorarium or other form of payment was given to anyone to produce the manuscript. All authors have read and agreed to the published version of the manuscript.
Funding
This research was funded by NIH/NICHD HD100529, HD100529-02S1 (O.K.) and HD101852 (O.K.).
Institutional Review Board Statement
The study was approved by The Lundquist Institute Institutional Review Board (18CR-31752-01R).
Informed Consent Statement
Written informed consent has been obtained from all participants in the study to publish this paper.
Data Availability Statement
Raw data were generated at The Lundquist Institute. Derived data supporting the findings of this study are available from the corresponding author O.K. on request.
Conflicts of Interest
The authors have nothing to declare and no competing financial interest.
References
- Stewart, E.A.; Cookson, C.L.; Gandolfo, R.A.; Schulze-Rath, R. Epidemiology of uterine fibroids: A systematic review. Bjog 2017, 124, 1501–1512. [Google Scholar] [CrossRef]
- Islam, M.S.; Ciavattini, A.; Petraglia, F.; Castellucci, M.; Ciarmela, P. Extracellular matrix in uterine leiomyoma pathogenesis: A potential target for future therapeutics. Hum. Reprod. Update 2018, 24, 59–85. [Google Scholar] [CrossRef] [PubMed]
- Chegini, N. Proinflammatory and profibrotic mediators: Principal effectors of leiomyoma development as a fibrotic disorder. Semin. Reprod. Med. 2010, 28, 180–203. [Google Scholar] [CrossRef] [PubMed]
- Segars, J.H.; Parrott, E.C.; Nagel, J.D.; Guo, X.C.; Gao, X.; Birnbaum, L.S.; Pinn, V.W.; Dixon, D. Proceedings from the Third National Institutes of Health International Congress on Advances in Uterine Leiomyoma Research: Comprehensive review, conference summary and future recommendations. Hum. Reprod. Update 2014, 20, 309–333. [Google Scholar] [CrossRef] [PubMed]
- Taylor, D.K.; Holthouser, K.; Segars, J.H.; Leppert, P.C. Recent scientific advances in leiomyoma (uterine fibroids) research facilitates better understanding and management. F1000Res 2015, 4, 183. [Google Scholar] [CrossRef]
- Chuang, T.D.; Khorram, O. Expression Profiling of lncRNAs, miRNAs, and mRNAs and Their Differential Expression in Leiomyoma Using Next-Generation RNA Sequencing. Reprod. Sci. 2018, 25, 246–255. [Google Scholar] [CrossRef] [PubMed]
- Guo, H.; Zhang, X.; Dong, R.; Liu, X.; Li, Y.; Lu, S.; Xu, L.; Wang, Y.; Wang, X.; Hou, D.; et al. Integrated analysis of long noncoding RNAs and mRNAs reveals their potential roles in the pathogenesis of uterine leiomyomas. Oncotarget 2014, 5, 8625–8636. [Google Scholar] [CrossRef] [PubMed]
- Chuang, T.D.; Rehan, A.; Khorram, O. Functional role of the long noncoding RNA X-inactive specific transcript in leiomyoma pathogenesis. Fertil. Steril. 2021, 115, 238–247. [Google Scholar] [CrossRef]
- Chuang, T.D.; Quintanilla, D.; Boos, D.; Khorram, O. Long Noncoding RNA MIAT Modulates the Extracellular Matrix Deposition in Leiomyomas by Sponging MiR-29 Family. Endocrinology 2021, 162, bqab186. [Google Scholar] [CrossRef]
- Falahati, Z.; Mohseni-Dargah, M.; Mirfakhraie, R. Emerging Roles of Long Non-coding RNAs in Uterine Leiomyoma Pathogenesis: A Review. Reprod. Sci. 2022, 29, 1086–1101. [Google Scholar] [CrossRef] [PubMed]
- Chuang, T.D.; Quintanilla, D.; Boos, D.; Khorram, O. Differential Expression of Super-Enhancer-Associated Long Non-coding RNAs in Uterine Leiomyomas. Reprod. Sci. 2022, 29, 2960–2976. [Google Scholar] [CrossRef] [PubMed]
- Lagana, A.S.; Vergara, D.; Favilli, A.; La Rosa, V.L.; Tinelli, A.; Gerli, S.; Noventa, M.; Vitagliano, A.; Triolo, O.; Rapisarda, A.M.C.; et al. Epigenetic and genetic landscape of uterine leiomyomas: A current view over a common gynecological disease. Arch. Gynecol. Obstet. 2017, 296, 855–867. [Google Scholar] [CrossRef]
- Mehine, M.; Makinen, N.; Heinonen, H.R.; Aaltonen, L.A.; Vahteristo, P. Genomics of uterine leiomyomas: Insights from high-throughput sequencing. Fertil. Steril. 2014, 102, 621–629. [Google Scholar] [CrossRef] [PubMed]
- Hodge, J.C.; Kim, T.M.; Dreyfuss, J.M.; Somasundaram, P.; Christacos, N.C.; Rousselle, M.; Quade, B.J.; Park, P.J.; Stewart, E.A.; Morton, C.C. Expression profiling of uterine leiomyomata cytogenetic subgroups reveals distinct signatures in matched myometrium: Transcriptional profilingof the t(12;14) and evidence in support of predisposing genetic heterogeneity. Hum. Mol. Genet. 2012, 21, 2312–2329. [Google Scholar] [CrossRef] [PubMed]
- Liegl-Atzwanger, B.; Heitzer, E.; Flicker, K.; Muller, S.; Ulz, P.; Saglam, O.; Tavassoli, F.; Devouassoux-Shisheboran, M.; Geigl, J.; Moinfar, F. Exploring chromosomal abnormalities and genetic changes in uterine smooth muscle tumors. Mod. Pathol. 2016, 29, 1262–1277. [Google Scholar] [CrossRef] [PubMed]
- Makinen, N.; Mehine, M.; Tolvanen, J.; Kaasinen, E.; Li, Y.; Lehtonen, H.J.; Gentile, M.; Yan, J.; Enge, M.; Taipale, M.; et al. MED12, the mediator complex subunit 12 gene, is mutated at high frequency in uterine leiomyomas. Science 2011, 334, 252–255. [Google Scholar] [CrossRef] [PubMed]
- Markowski, D.N.; Bartnitzke, S.; Löning, T.; Drieschner, N.; Helmke, B.M.; Bullerdiek, J. MED12 mutations in uterine fibroids--their relationship to cytogenetic subgroups. Int. J. Cancer 2012, 131, 1528–1536. [Google Scholar] [CrossRef] [PubMed]
- Al-Hendy, A.; Laknaur, A.; Diamond, M.P.; Ismail, N.; Boyer, T.G.; Halder, S.K. Silencing Med12 Gene Reduces Proliferation of Human Leiomyoma Cells Mediated via Wnt/beta-Catenin Signaling Pathway. Endocrinology 2017, 158, 592–603. [Google Scholar]
- El Andaloussi, A.; Al-Hendy, A.; Ismail, N.; Boyer, T.G.; Halder, S.K. Introduction of Somatic Mutation in MED12 Induces Wnt4/β-Catenin and Disrupts Autophagy in Human Uterine Myometrial Cell. Reprod. Sci. 2020, 27, 823–832. [Google Scholar] [CrossRef]
- Verger, A.; Monté, D.; Villeret, V. Twenty years of Mediator complex structural studies. Biochem. Soc. Trans. 2019, 47, 399–410. [Google Scholar] [CrossRef]
- Zhang, S.; O’Regan, R.; Xu, W. The emerging role of mediator complex subunit 12 in tumorigenesis and response to chemotherapeutics. Cancer 2020, 126, 939–948. [Google Scholar] [CrossRef] [PubMed]
- Heinonen, H.R.; Pasanen, A.; Heikinheimo, O.; Tanskanen, T.; Palin, K.; Tolvanen, J.; Vahteristo, P.; Sjoberg, J.; Pitkanen, E.; Butzow, R.; et al. Multiple clinical characteristics separate MED12-mutation-positive and -negative uterine leiomyomas. Sci. Rep. 2017, 7, 1015. [Google Scholar] [CrossRef] [PubMed]
- Mittal, P.; Shin, Y.H.; Yatsenko, S.A.; Castro, C.A.; Surti, U.; Rajkovic, A. Med12 gain-of-function mutation causes leiomyomas and genomic instability. J. Clin. Investig. 2015, 125, 3280–3284. [Google Scholar] [CrossRef] [PubMed]
- Turunen, M.; Spaeth, J.M.; Keskitalo, S.; Park, M.J.; Kivioja, T.; Clark, A.D.; Makinen, N.; Gao, F.; Palin, K.; Nurkkala, H.; et al. Uterine leiomyoma-linked MED12 mutations disrupt mediator-associated CDK activity. Cell Rep. 2014, 7, 654–660. [Google Scholar] [CrossRef]
- Park, M.J.; Shen, H.; Spaeth, J.M.; Tolvanen, J.H.; Failor, C.; Knudtson, J.F.; McLaughlin, J.; Halder, S.K.; Yang, Q.; Bulun, S.E.; et al. Oncogenic exon 2 mutations in Mediator subunit MED12 disrupt allosteric activation of cyclin C-CDK8/19. J. Biol. Chem. 2018, 293, 4870–4882. [Google Scholar] [CrossRef] [PubMed]
- Zhou, H.; Kim, S.; Ishii, S.; Boyer, T.G. Mediator modulates Gli3-dependent Sonic hedgehog signaling. Mol. Cell. Biol. 2006, 26, 8667–8682. [Google Scholar] [CrossRef]
- Huang, S.; Holzel, M.; Knijnenburg, T.; Schlicker, A.; Roepman, P.; McDermott, U.; Garnett, M.; Grernrum, W.; Sun, C.; Prahallad, A.; et al. MED12 controls the response to multiple cancer drugs through regulation of TGF-beta receptor signaling. Cell 2012, 151, 937–950. [Google Scholar] [CrossRef]
- Chuang, T.D.; Khorram, O. Regulation of Cell Cycle Regulatory Proteins by MicroRNAs in Uterine Leiomyoma. Reprod. Sci. 2019, 26, 250–258. [Google Scholar] [CrossRef]
- Chuang, T.-D.; Khorram, O. Cross-talk between miR-29c and transforming growth factor-β3 is mediated by an epigenetic mechanism in leiomyoma. Fertil. Steril. 2019, 112, 1180–1189. [Google Scholar] [CrossRef]
- Chuang, T.D.; Quintanilla, D.; Boos, D.; Khorram, O. Tryptophan catabolism is dysregulated in leiomyomas. Fertil. Steril. 2021, 116, 1160–1171. [Google Scholar] [CrossRef]
- Mas, A.; Cervello, I.; Fernandez-Alvarez, A.; Faus, A.; Diaz, A.; Burgues, O.; Casado, M.; Simon, C. Overexpression of the truncated form of High Mobility Group A proteins (HMGA2) in human myometrial cells induces leiomyoma-like tissue formation. Mol. Hum. Reprod. 2015, 21, 330–338. [Google Scholar] [CrossRef]
- Yang, Q.; Ciebiera, M.; Victoria Bariani, M.; Ali, M.; Elkafas, H.; Boyer, T.G.; Al-Hendy, A. Comprehensive Review of Uterine Fibroids: Developmental Origin, Pathogenesis, and Treatment. Endocr. Rev. 2022, 43, 678–719. [Google Scholar] [CrossRef] [PubMed]
- Chuang, T.D.; Luo, X.; Panda, H.; Chegini, N. miR-93/106b and their host gene, MCM7, are differentially expressed in leiomyomas and functionally target F3 and IL-8. Mol. Endocrinol. 2012, 26, 1028–1042. [Google Scholar] [CrossRef] [PubMed]
- Navarro, A.; Bariani, M.V.; Yang, Q.; Al-Hendy, A. Understanding the Impact of Uterine Fibroids on Human Endometrium Function. Front. Cell Dev. Biol. 2021, 9, 633180. [Google Scholar] [CrossRef] [PubMed]
- Chuang, T.D.; Panda, H.; Luo, X.; Chegini, N. miR-200c is aberrantly expressed in leiomyomas in an ethnic-dependent manner and targets ZEBs, VEGFA, TIMP2, and FBLN5. Endocr. Relat. Cancer 2012, 19, 541–556. [Google Scholar] [CrossRef]
- George, J.W.; Fan, H.; Johnson, B.; Carpenter, T.J.; Foy, K.K.; Chatterjee, A.; Patterson, A.L.; Koeman, J.; Adams, M.; Madaj, Z.B.; et al. Integrated Epigenome, Exome, and Transcriptome Analyses Reveal Molecular Subtypes and Homeotic Transformation in Uterine Fibroids. Cell Rep. 2019, 29, 4069–4085.e6. [Google Scholar] [CrossRef] [PubMed]
- Sun, M.; Luo, E.Y.; Adams, S.M.; Adams, T.; Ye, Y.; Shetye, S.S.; Soslowsky, L.J.; Birk, D.E. Collagen XI regulates the acquisition of collagen fibril structure, organization and functional properties in tendon. Matrix Biol. 2020, 94, 77–94. [Google Scholar] [CrossRef]
- Kufe, D.W. Mucins in cancer: Function, prognosis and therapy. Nat. Rev. Cancer 2009, 9, 874–885. [Google Scholar] [CrossRef] [PubMed]
- Gaweł, A.M.; Ratajczak, M.; Gajda, E.; Grzanka, M.; Paziewska, A.; Cieślicka, M.; Kulecka, M.; Oczko-Wojciechowska, M.; Godlewska, M. Analysis of the Role of FRMD5 in the Biology of Papillary Thyroid Carcinoma. Int. J. Mol. Sci. 2021, 22, 6726. [Google Scholar] [CrossRef]
- Hu, J.; Niu, M.; Li, X.; Lu, D.; Cui, J.; Xu, W.; Li, G.; Zhan, J.; Zhang, H. FERM domain-containing protein FRMD5 regulates cell motility via binding to integrin β5 subunit and ROCK1. FEBS Lett. 2014, 588, 4348–4356. [Google Scholar] [CrossRef]
- Yan, T.; Tian, D.; Chen, J.; Tan, Y.; Cheng, Y.; Ye, L.; Deng, G.; Liu, B.; Yuan, F.; Zhang, S.; et al. FCGBP Is a Prognostic Biomarker and Associated With Immune Infiltration in Glioma. Front. Oncol. 2021, 11, 769033. [Google Scholar] [CrossRef] [PubMed]
- Liu, Q.; Niu, X.; Li, Y.; Zhang, J.R.; Zhu, S.J.; Yang, Q.Y.; Zhang, W.; Gong, L. Role of the mucin-like glycoprotein FCGBP in mucosal immunity and cancer. Front. Immunol. 2022, 13, 863317. [Google Scholar] [CrossRef]
- Kang, J.; Wang, J.; Tian, J.; Shi, R.; Jia, H.; Wang, Y. The emerging role of EGFL6 in angiogenesis and tumor progression. Int. J. Med. Sci. 2020, 17, 1320. [Google Scholar] [CrossRef] [PubMed]
- Pankov, R.; Yamada, K.M. Fibronectin at a glance. J. Cell Sci. 2002, 115 Pt 20, 3861–3863. [Google Scholar] [CrossRef] [PubMed]
- Yue, B. Biology of the extracellular matrix: An overview. J. Glaucoma 2014, 23 (Suppl. S1), S20–S23. [Google Scholar] [CrossRef]
- Lawrence, M.G.; Lai, J.; Clements, J.A. Kallikreins on steroids: Structure, function, and hormonal regulation of prostate-specific antigen and the extended kallikrein locus. Endocr. Rev. 2010, 31, 407–446. [Google Scholar] [CrossRef]
- Kawaguchi, M.; Orikawa, H.; Baba, T.; Fukushima, T.; Kataoka, H. Hepatocyte growth factor activator is a serum activator of single-chain precursor macrophage-stimulating protein. FEBS J. 2009, 276, 3481–3490. [Google Scholar] [CrossRef]
- Wu, Y.; Chen, J.; Tan, F.; Wang, B.; Xu, W.; Yuan, C. ITGA9: Potential Biomarkers and Therapeutic Targets in Different Tumors. Curr. Pharm. Des. 2022, 28, 1412–1418. [Google Scholar] [CrossRef]
- Ayanlaja, A.A.; Xiong, Y.; Gao, Y.; Ji, G.; Tang, C.; Abdikani Abdullah, Z.; Gao, D. Distinct Features of Doublecortin as a Marker of Neuronal Migration and Its Implications in Cancer Cell Mobility. Front. Mol. Neurosci. 2017, 10, 199. [Google Scholar] [CrossRef]
- Wang, Z.; Zhao, T.; Zhang, S.; Wang, J.; Chen, Y.; Zhao, H.; Yang, Y.; Shi, S.; Chen, Q.; Liu, K. The Wnt signaling pathway in tumorigenesis, pharmacological targets, and drug development for cancer therapy. Biomark. Res. 2021, 9, 68. [Google Scholar] [CrossRef]
- Kitaya, K.; Yasuo, T. Aberrant expression of selectin E, CXCL1, and CXCL13 in chronic endometritis. Mod. Pathol. 2010, 23, 1136–1146. [Google Scholar] [CrossRef]
- Aranda, S.; Mas, G.; Di Croce, L. Regulation of gene transcription by Polycomb proteins. Sci. Adv. 2015, 1, e1500737. [Google Scholar] [CrossRef]
- Völkers, M.; Rohde, D.; Goodman, C.; Most, P. S100A1: A regulator of striated muscle sarcoplasmic reticulum Ca2+ handling, sarcomeric, and mitochondrial function. J. Biomed. Biotechnol. 2010, 2010, 178614. [Google Scholar] [CrossRef]
- Sun, B.; Kekenes-Huskey, P.M. Molecular Basis of S100A1 Activation and Target Regulation Within Physiological Cytosolic Ca(2+) Levels. Front. Mol. Biosci. 2020, 7, 77. [Google Scholar] [CrossRef]
- Tooley, J.; Stukenberg, P.T. The Ndc80 complex: Integrating the kinetochore’s many movements. Chromosome Res. 2011, 19, 377–391. [Google Scholar] [CrossRef]
- Gil, O.D.; Zhang, L.; Chen, S.; Ren, Y.Q.; Pimenta, A.; Zanazzi, G.; Hillman, D.; Levitt, P.; Salzer, J.L. Complementary expression and heterophilic interactions between IgLON family members neurotrimin and LAMP. J. Neurobiol. 2002, 51, 190–204. [Google Scholar] [CrossRef] [PubMed]
- Tsai, C.H.; Cheng, H.C.; Wang, Y.S.; Lin, P.; Jen, J.; Kuo, I.Y.; Chang, Y.H.; Liao, P.C.; Chen, R.H.; Yuan, W.C.; et al. Small GTPase Rab37 targets tissue inhibitor of metalloproteinase 1 for exocytosis and thus suppresses tumour metastasis. Nat. Commun. 2014, 5, 4804. [Google Scholar] [CrossRef] [PubMed]
- Drgonova, J.; Zimonjic, D.B.; Hall, F.S.; Uhl, G.R. Effect of KEPI (Ppp1r14c) deletion on morphine analgesia and tolerance in mice of different genetic backgrounds: When a knockout is near a relevant quantitative trait locus. Neuroscience 2010, 165, 882–895. [Google Scholar] [CrossRef]
- Xiong, L.; Xia, W.F.; Tang, F.L.; Pan, J.X.; Mei, L.; Xiong, W.C. Retromer in Osteoblasts Interacts With Protein Phosphatase 1 Regulator Subunit 14C, Terminates Parathyroid Hormone’s Signaling, and Promotes Its Catabolic Response. EBioMedicine 2016, 9, 45–60. [Google Scholar] [CrossRef] [PubMed]
- Mengie Ayele, T.; Tilahun Muche, Z.; Behaile Teklemariam, A.; Bogale Kassie, A.; Chekol Abebe, E. Role of JAK2/STAT3 Signaling Pathway in the Tumorigenesis, Chemotherapy Resistance, and Treatment of Solid Tumors: A Systemic Review. J. Inflamm. Res. 2022, 15, 1349–1364. [Google Scholar] [CrossRef]
- Wissmann, C.; Wild, P.J.; Kaiser, S.; Roepcke, S.; Stoehr, R.; Woenckhaus, M.; Kristiansen, G.; Hsieh, J.C.; Hofstaedter, F.; Hartmann, A.; et al. WIF1, a component of the Wnt pathway, is down-regulated in prostate, breast, lung, and bladder cancer. J. Pathol. 2003, 201, 204–212. [Google Scholar] [CrossRef] [PubMed]
- Ai, L.; Tao, Q.; Zhong, S.; Fields, C.R.; Kim, W.J.; Lee, M.W.; Cui, Y.; Brown, K.D.; Robertson, K.D. Inactivation of Wnt inhibitory factor-1 (WIF1) expression by epigenetic silencing is a common event in breast cancer. Carcinogenesis 2006, 27, 1341–1348. [Google Scholar] [CrossRef]
- Dituri, F.; Cossu, C.; Mancarella, S.; Giannelli, G. The Interactivity between TGFβ and BMP Signaling in Organogenesis, Fibrosis, and Cancer. Cells 2019, 8, 1130. [Google Scholar] [CrossRef]
- Duan, R.; Du, W.; Guo, W. EZH2: A novel target for cancer treatment. J. Hematol. Oncol. 2020, 13, 104. [Google Scholar] [CrossRef]
- Li, Y.; Zhao, E.; Chen, D.F. Emerging roles for insulin-like growth factor binding protein like protein 1. Neural Regen. Res. 2019, 14, 258–259. [Google Scholar]
- Yoo, K.Y.; Son, J.Y.; Lee, J.U.; Shin, W.; Im, D.W.; Kim, S.J.; Ryu, S.E.; Heo, Y.S. Structure of the catalytic phosphatase domain of MTMR8: Implications for dimerization, membrane association and reversible oxidation. Acta Crystallogr. D Biol. Crystallogr. 2015, 71 Pt 7, 1528–1539. [Google Scholar] [CrossRef]
- Vives-Bauza, C.; Magrané, J.; Andreu, A.L.; Manfredi, G. Novel role of ATPase subunit C targeting peptides beyond mitochondrial protein import. Mol. Biol. Cell 2010, 21, 131–139. [Google Scholar] [CrossRef] [PubMed]
- Liu, T.; Huang, Y.; Lin, H. Estrogen disorders: Interpreting the abnormal regulation of aromatase in granulosa cells (Review). Int. J. Mol. Med. 2021, 47, 73. [Google Scholar] [CrossRef] [PubMed]
- Ambartsumian, N.; Klingelhöfer, J.; Grigorian, M. The Multifaceted S100A4 Protein in Cancer and Inflammation. Methods Mol. Biol. 2019, 1929, 339–365. [Google Scholar]
- Boulling, A.; Wicht, L.; Schorderet, D.F. Identification of HMX1 target genes: A predictive promoter model approach. Mol. Vis. 2013, 19, 1779–1794. [Google Scholar] [PubMed]
- Banciu, A.; Banciu, D.D.; Mustaciosu, C.C.; Radu, M.; Cretoiu, D.; Xiao, J.; Cretoiu, S.M.; Suciu, N.; Radu, B.M. Beta-Estradiol Regulates Voltage-Gated Calcium Channels and Estrogen Receptors in Telocytes from Human Myometrium. Int. J. Mol. Sci. 2018, 19, 1413. [Google Scholar] [CrossRef]
- Georgoussi, Z.; Leontiadis, L.; Mazarakou, G.; Merkouris, M.; Hyde, K.; Hamm, H. Selective interactions between G protein subunits and RGS4 with the C-terminal domains of the mu- and delta-opioid receptors regulate opioid receptor signaling. Cell. Signal. 2006, 18, 771–782. [Google Scholar] [CrossRef] [PubMed]
- Sherman, B.T.; Hao, M.; Qiu, J.; Jiao, X.; Baseler, M.W.; Lane, H.C.; Imamichi, T.; Chang, W. DAVID: A web server for functional enrichment analysis and functional annotation of gene lists (2021 update). Nucleic Acids Res. 2022, 50, W216–W221. [Google Scholar] [CrossRef] [PubMed]
- Huang, D.W.; Sherman, B.T.; Tan, Q.; Collins, J.R.; Alvord, W.G.; Roayaei, J.; Stephens, R.; Baseler, M.W.; Lane, H.C.; Lempicki, R.A. The DAVID Gene Functional Classification Tool: A novel biological module-centric algorithm to functionally analyze large gene lists. Genome Biol. 2007, 8, R183. [Google Scholar] [CrossRef] [PubMed]
- Moyo, M.B.; Parker, J.B.; Chakravarti, D. Altered chromatin landscape and enhancer engagement underlie transcriptional dysregulation in MED12 mutant uterine leiomyomas. Nat. Commun. 2020, 11, 1019. [Google Scholar] [CrossRef] [PubMed]
- Chuang, T.D.; Xie, Y.; Yan, W.; Khorram, O. Next-generation sequencing reveals differentially expressed small noncoding RNAs in uterine leiomyoma. Fertil. Steril. 2018, 109, 919–929. [Google Scholar] [CrossRef]
- Li, Y.; Xu, X.; Asif, H.; Feng, Y.; Kohrn, B.F.; Kennedy, S.R.; Kim, J.J.; Wei, J.J. Myometrial oxidative stress drives MED12 mutations in leiomyoma. Cell Biosci. 2022, 12, 111. [Google Scholar] [CrossRef]
- Paul, E.N.; Burns, G.W.; Carpenter, T.J.; Grey, J.A.; Fazleabas, A.T.; Teixeira, J.M. Transcriptome Analyses of Myometrium from Fibroid Patients Reveals Phenotypic Differences Compared to Non-Diseased Myometrium. Int. J. Mol. Sci. 2021, 22, 3618. [Google Scholar] [CrossRef]
- Mayer, A.; Höckel, M.; Wree, A.; Leo, C.; Horn, L.C.; Vaupel, P. Lack of hypoxic response in uterine leiomyomas despite severe tissue hypoxia. Cancer Res. 2008, 68, 4719–4726. [Google Scholar] [CrossRef] [PubMed]
- Wu, B.; Chen, X.; He, B.; Liu, S.; Li, Y.; Wang, Q.; Gao, H.; Wang, S.; Liu, J.; Zhang, S.; et al. ROS are critical for endometrial breakdown via NF-κB-COX-2 signaling in a female mouse menstrual-like model. Endocrinology 2014, 155, 3638–3648. [Google Scholar] [CrossRef]
- Tanwar, P.S.; Lee, H.J.; Zhang, L.; Zukerberg, L.R.; Taketo, M.M.; Rueda, B.R.; Teixeira, J.M. Constitutive activation of Beta-catenin in uterine stroma and smooth muscle leads to the development of mesenchymal tumors in mice. Biol. Reprod. 2009, 81, 545–552. [Google Scholar] [CrossRef] [PubMed]
- Liu, S.; Yin, P.; Dotts, A.J.; Kujawa, S.A.; Coon, V.J.; Wei, J.J.; Chakravarti, D.; Bulun, S.E. Activation of protein kinase B by WNT4 as a regulator of uterine leiomyoma stem cell function. Fertil. Steril. 2020, 114, 1339–1349. [Google Scholar] [CrossRef]
- Ono, M.; Yin, P.; Navarro, A.; Moravek, M.B.; Coon, J.S.t.; Druschitz, S.A.; Serna, V.A.; Qiang, W.; Brooks, D.C.; Malpani, S.S.; et al. Paracrine activation of WNT/beta-catenin pathway in uterine leiomyoma stem cells promotes tumor growth. Proc. Natl. Acad. Sci. USA 2013, 110, 17053–17058. [Google Scholar] [CrossRef] [PubMed]
- Ko, Y.A.; Jamaluddin, M.F.B.; Adebayo, M.; Bajwa, P.; Scott, R.J.; Dharmarajan, A.M.; Nahar, P.; Tanwar, P.S. Extracellular matrix (ECM) activates beta-catenin signaling in uterine fibroids. Reproduction 2018, 155, 61–71. [Google Scholar] [PubMed]
- Malinauskas, T.; Aricescu, A.R.; Lu, W.; Siebold, C.; Jones, E.Y. Modular mechanism of Wnt signaling inhibition by Wnt inhibitory factor 1. Nat. Struct. Mol. Biol. 2011, 18, 886–893. [Google Scholar] [CrossRef] [PubMed]
- Litovkin, K.V.; Ivanova, O.V.; Bauer, A.; Hoheisel, J.D.; Bubnov, V.V.; Zaporozhan, V.N. Microarray study of gene expression in uterine leiomyoma. Exp. Oncol. 2008, 30, 106–111. [Google Scholar]
- Maekawa, R.; Sato, S.; Tamehisa, T.; Sakai, T.; Kajimura, T.; Sueoka, K.; Sugino, N. Different DNA methylome, transcriptome and histological features in uterine fibroids with and without MED12 mutations. Sci. Rep. 2022, 12, 8912. [Google Scholar] [CrossRef]
- Arslan, A.A.; Gold, L.I.; Mittal, K.; Suen, T.C.; Belitskaya-Levy, I.; Tang, M.S.; Toniolo, P. Gene expression studies provide clues to the pathogenesis of uterine leiomyoma: New evidence and a systematic review. Hum. Reprod. 2005, 20, 852–863. [Google Scholar] [CrossRef]
- Bae, S.M.; Kim, Y.W.; Lee, J.M.; Namkoong, S.E.; Kim, C.K.; Ahn, W.S. Expression profiling of the cellular processes in uterine leiomyomas: Omic approaches and IGF-2 association with leiomyosarcomas. Cancer Res. Treat. 2004, 36, 31–42. [Google Scholar] [CrossRef]
- Wu, Y.; Chen, Y.; Li, Q.; Gong, Y.; Liu, X.; Bi, L.; Hu, C. Upregulation of kallikrein-related peptidase 5 is associated with the malignant behavior of colorectal cancer. Mol. Med. Rep. 2016, 14, 2164–2170. [Google Scholar] [CrossRef]
- Johnson, J.J.; Miller, D.L.; Jiang, R.; Liu, Y.; Shi, Z.; Tarwater, L.; Williams, R.; Balsara, R.; Sauter, E.R.; Stack, M.S. Protease-activated Receptor-2 (PAR-2)-mediated Nf-κB Activation Suppresses Inflammation-associated Tumor Suppressor MicroRNAs in Oral Squamous Cell Carcinoma. J. Biol. Chem. 2016, 291, 6936–6945. [Google Scholar] [CrossRef]
- Abuduhadeer, X.; Xu, X.; Aihesan, K.; Yilihamu, M.; Zhao, Y.; Zhang, W. Clinical significance of kallikrein 5 as a novel prognostic biomarker in gastric adenocarcinoma. J. Clin. Lab. Anal. 2021, 35, e23958. [Google Scholar] [CrossRef]
- Kryza, T.; Silva, M.L.; Loessner, D.; Heuzé-Vourc’h, N.; Clements, J.A. The kallikrein-related peptidase family: Dysregulation and functions during cancer progression. Biochimie 2016, 122, 283–299. [Google Scholar] [CrossRef] [PubMed]
- Chuang, T.D.; Khorram, O. miR-200c Regulates IL8 Expression by Targeting IKBKB: A Potential Mediator of Inflammation in Leiomyoma Pathogenesis. PLoS ONE 2014, 9, e95370. [Google Scholar] [CrossRef] [PubMed]
- Chuang, T.D.; Khorram, O. Mechanisms underlying aberrant expression of miR-29c in uterine leiomyoma. Fertil. Steril. 2016, 105, 236–245.e1. [Google Scholar] [CrossRef] [PubMed]
- Wright, N.T.; Cannon, B.R.; Zimmer, D.B.; Weber, D.J. S100A1: Structure, Function, and Therapeutic Potential. Curr. Chem. Biol. 2009, 3, 138–145. [Google Scholar]
- Diaz-Romero, J.; Nesic, D. S100A1 and S100B: Calcium Sensors at the Cross-Roads of Multiple Chondrogenic Pathways. J. Cell. Physiol. 2017, 232, 1979–1987. [Google Scholar] [CrossRef]
- Li, Z.; Li, Y.; Liu, S.; Qin, Z. Extracellular S100A4 as a key player in fibrotic diseases. J. Cell Mol. Med. 2020, 24, 5973–5983. [Google Scholar] [CrossRef]
- Schneider, M.; Hansen, J.L.; Sheikh, S.P. S100A4: A common mediator of epithelial-mesenchymal transition, fibrosis and regeneration in diseases? J. Mol. Med. 2008, 86, 507–522. [Google Scholar] [CrossRef]
- Dahlmann, M.; Kobelt, D.; Walther, W.; Mudduluru, G.; Stein, U. S100A4 in Cancer Metastasis: Wnt Signaling-Driven Interventions for Metastasis Restriction. Cancers 2016, 8, 59. [Google Scholar] [CrossRef]
- Bulun, S.E.; Imir, G.; Utsunomiya, H.; Thung, S.; Gurates, B.; Tamura, M.; Lin, Z. Aromatase in endometriosis and uterine leiomyomata. J. Steroid Biochem. Mol. Biol. 2005, 95, 57–62. [Google Scholar] [CrossRef] [PubMed]
- Ishikawa, H.; Reierstad, S.; Demura, M.; Rademaker, A.W.; Kasai, T.; Inoue, M.; Usui, H.; Shozu, M.; Bulun, S.E. High aromatase expression in uterine leiomyoma tissues of African-American women. J. Clin. Endocrinol. Metab. 2009, 94, 1752–1756. [Google Scholar] [CrossRef]
- Mlodawska, O.W.; Saini, P.; Parker, J.B.; Wei, J.J.; Bulun, S.E.; Simon, M.A.; Chakravarti, D. Epigenomic and enhancer dysregulation in uterine leiomyomas. Hum. Reprod. Update 2022, 28, 518–547. [Google Scholar] [CrossRef] [PubMed]
- Yang, Q.; Nair, S.; Laknaur, A.; Ismail, N.; Diamond, M.P.; Al-Hendy, A. The Polycomb Group Protein EZH2 Impairs DNA Damage Repair Gene Expression in Human Uterine Fibroids. Biol. Reprod. 2016, 94, 69. [Google Scholar] [CrossRef] [PubMed]
- Chuang, T.D.; Khorram, O. Tranilast Inhibits Genes Functionally Involved in Cell Proliferation, Fibrosis, and Epigenetic Regulation and Epigenetically Induces miR-29c Expression in Leiomyoma Cells. Reprod. Sci. 2017, 24, 1253–1263. [Google Scholar] [CrossRef]
- Chuang, T.D.; Quintanilla, D.; Boos, D.; Khorram, O. Further characterization of tryptophan metabolism and its dysregulation in fibroids. F&S Sci. 2022, 3, 392–400. [Google Scholar]
- de Sena Brandine, G.; Smith, A.D. Falco: High-speed FastQC emulation for quality control of sequencing data. F1000Res 2019, 8, 1874. [Google Scholar] [CrossRef]
- Kim, D.; Langmead, B.; Salzberg, S.L. HISAT: A fast spliced aligner with low memory requirements. Nat. Methods 2015, 12, 357–360. [Google Scholar] [CrossRef]
- Liao, Y.; Smyth, G.K.; Shi, W. The Subread aligner: Fast, accurate and scalable read mapping by seed-and-vote. Nucleic Acids Res. 2013, 41, e108. [Google Scholar] [CrossRef]
- Ewels, P.; Magnusson, M.; Lundin, S.; Käller, M. MultiQC: Summarize analysis results for multiple tools and samples in a single report. Bioinformatics 2016, 32, 3047–3048. [Google Scholar] [CrossRef]
- Delhomme, N.; Padioleau, I.; Furlong, E.E.; Steinmetz, L.M. easyRNASeq: A bioconductor package for processing RNA-Seq data. Bioinformatics 2012, 28, 2532–2533. [Google Scholar] [CrossRef] [PubMed]
- Iqbal, A.; Duitama, C.; Metge, F.; Rosskopp, D.; Boucas, J. Flaski (2.0.3). Zenodo. 2021. Available online: https://zenodo.org/record/4890981#.Y-bRDXbMK3A (accessed on 28 December 2022).
- Szklarczyk, D.; Franceschini, A.; Wyder, S.; Forslund, K.; Heller, D.; Huerta-Cepas, J.; Simonovic, M.; Roth, A.; Santos, A.; Tsafou, K.P.; et al. STRING v10: Protein-protein interaction networks, integrated over the tree of life. Nucleic Acids Res. 2015, 43, D447–D452. [Google Scholar] [CrossRef] [PubMed]
- Almeida, T.A.; Quispe-Ricalde, A.; Montes de Oca, F.; Foronda, P.; Hernandez, M.M. A high-throughput open-array qPCR gene panel to identify housekeeping genes suitable for myometrium and leiomyoma expression analysis. Gynecol. Oncol. 2014, 134, 138–143. [Google Scholar] [CrossRef] [PubMed]
Disclaimer/Publisher’s Note: The statements, opinions and data contained in all publications are solely those of the individual author(s) and contributor(s) and not of MDPI and/or the editor(s). MDPI and/or the editor(s) disclaim responsibility for any injury to people or property resulting from any ideas, methods, instructions or products referred to in the content. |
© 2023 by the authors. Licensee MDPI, Basel, Switzerland. This article is an open access article distributed under the terms and conditions of the Creative Commons Attribution (CC BY) license (https://creativecommons.org/licenses/by/4.0/).