
Proteomic Analysis Reveals a Critical Role of the Glycosyl Hydrolase 17 Protein in Panax ginseng Leaves under Salt Stress

 ,
,  ,
,  , , and
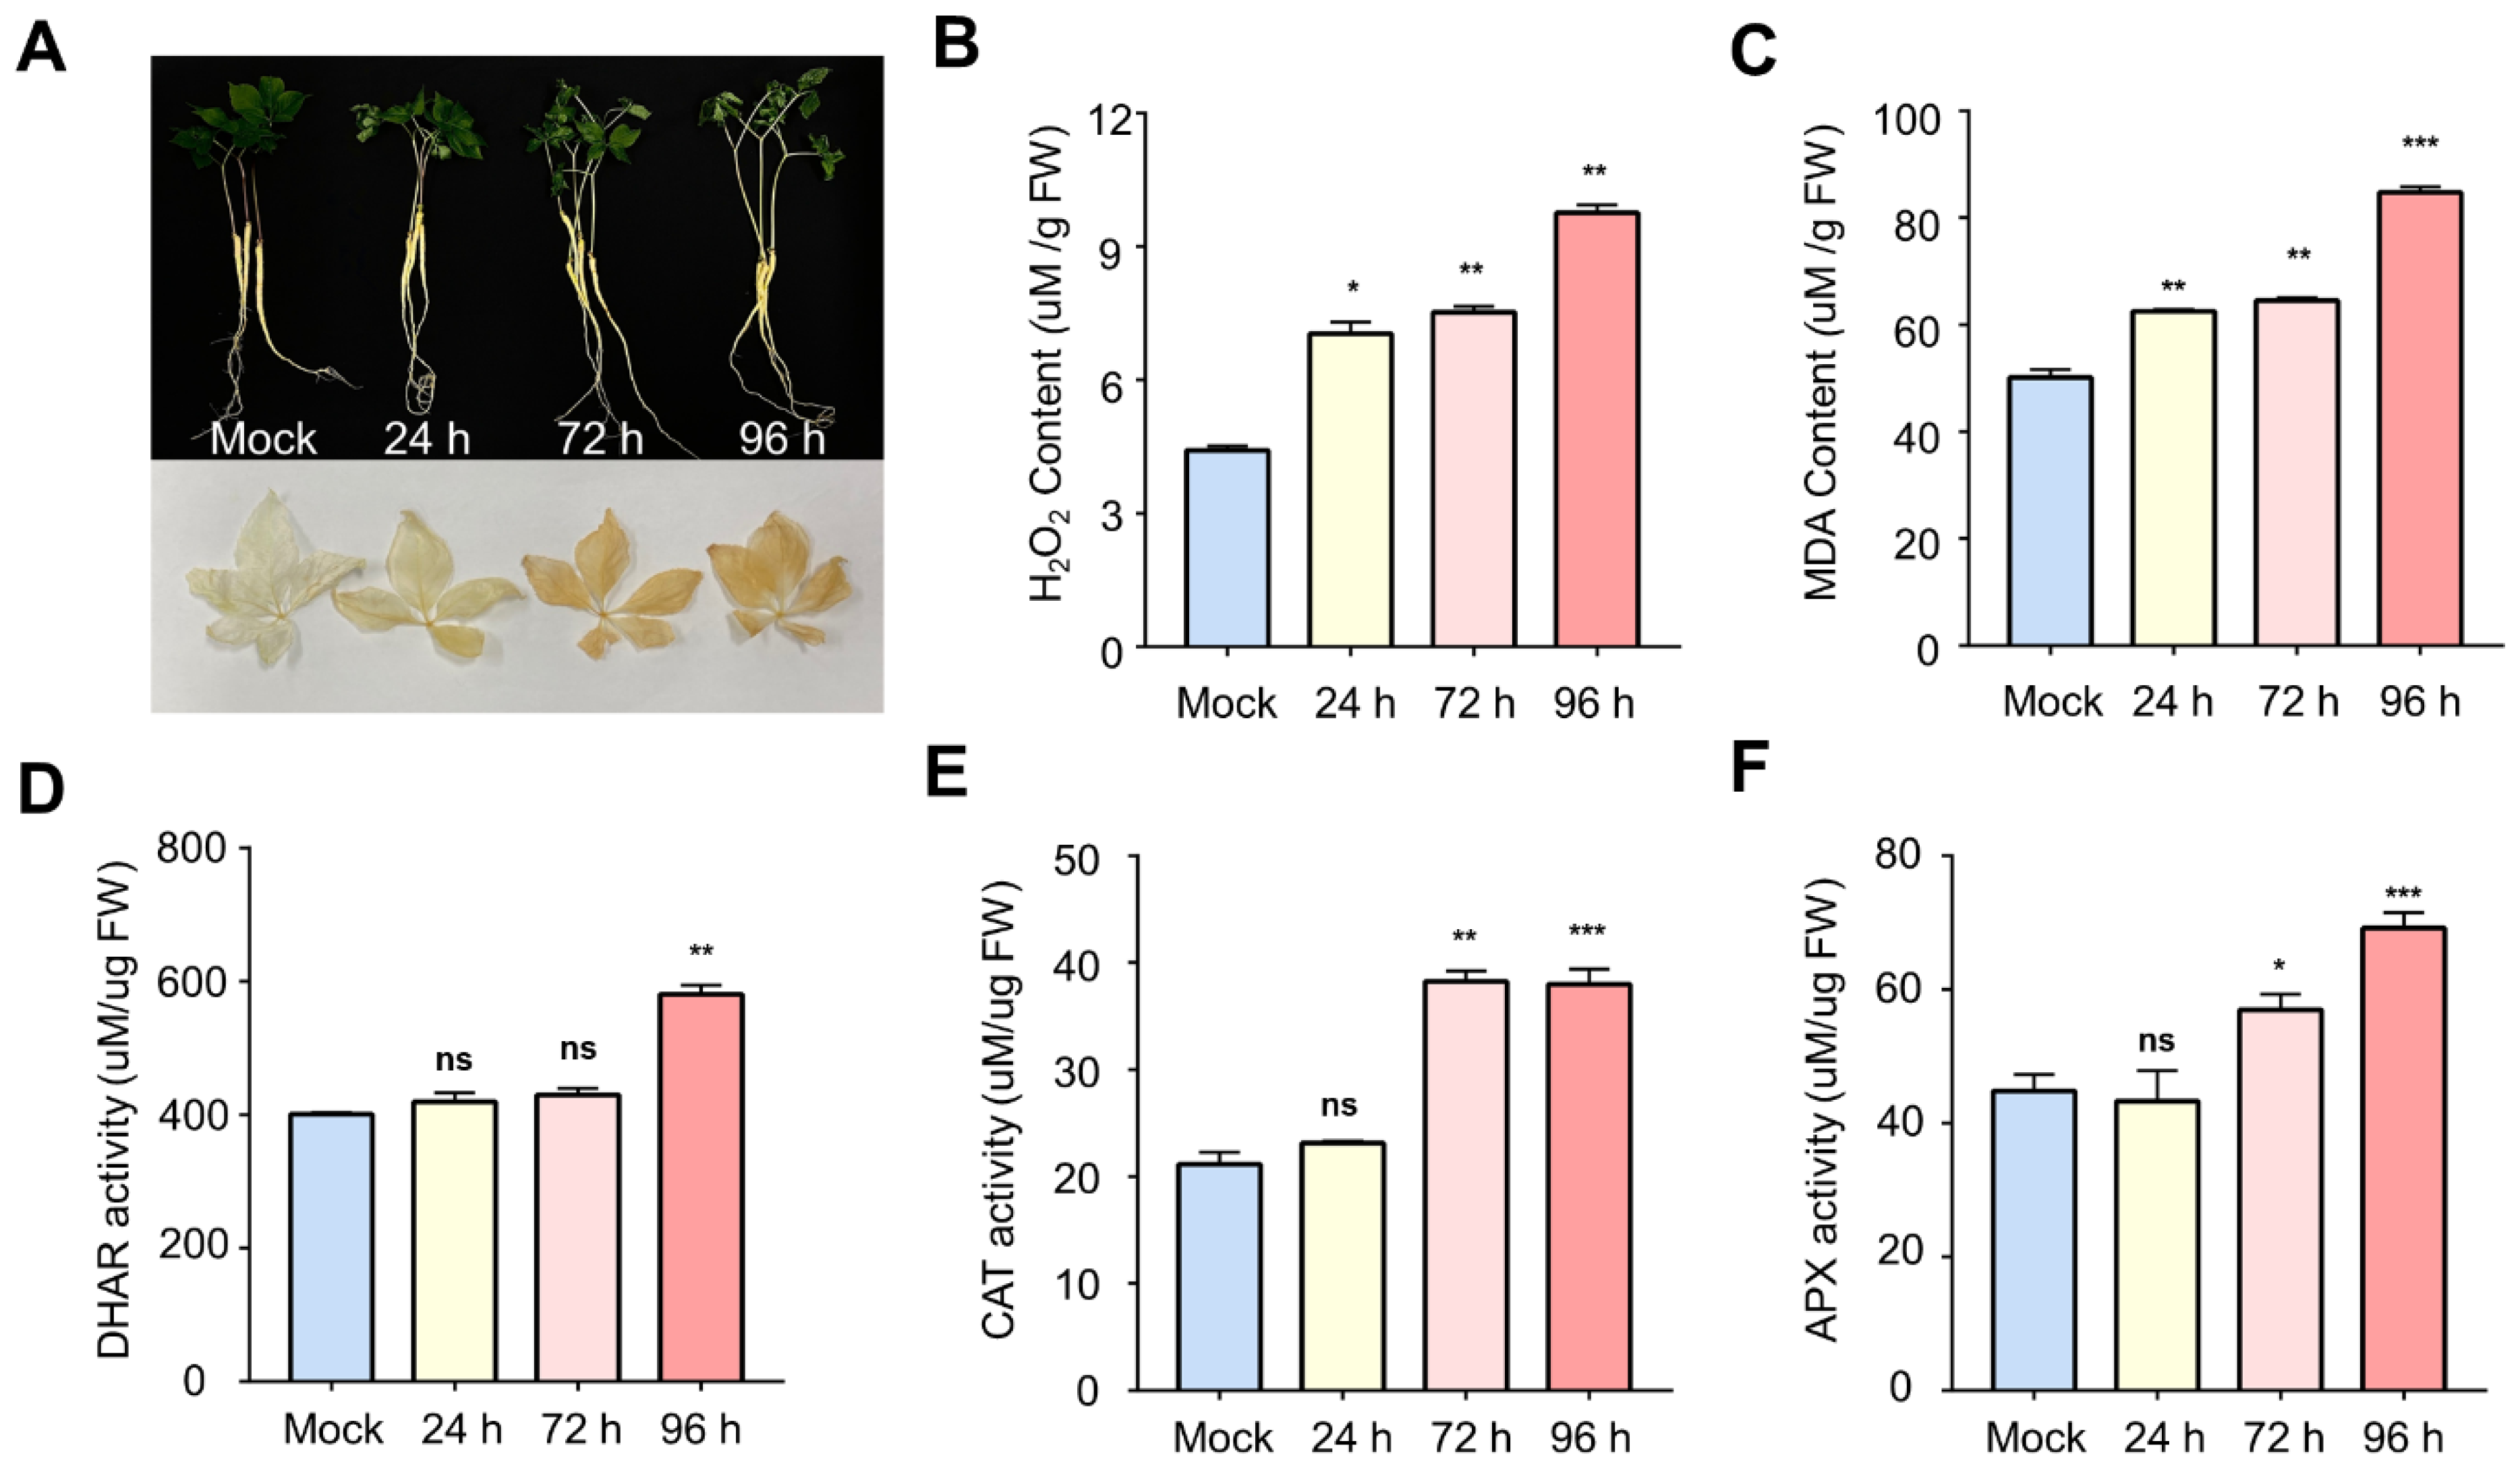
Abstract
:1. Introduction
2. Results
2.1. Physiological and Enzymatic Changes in Ginseng Leaves during Salt Stress
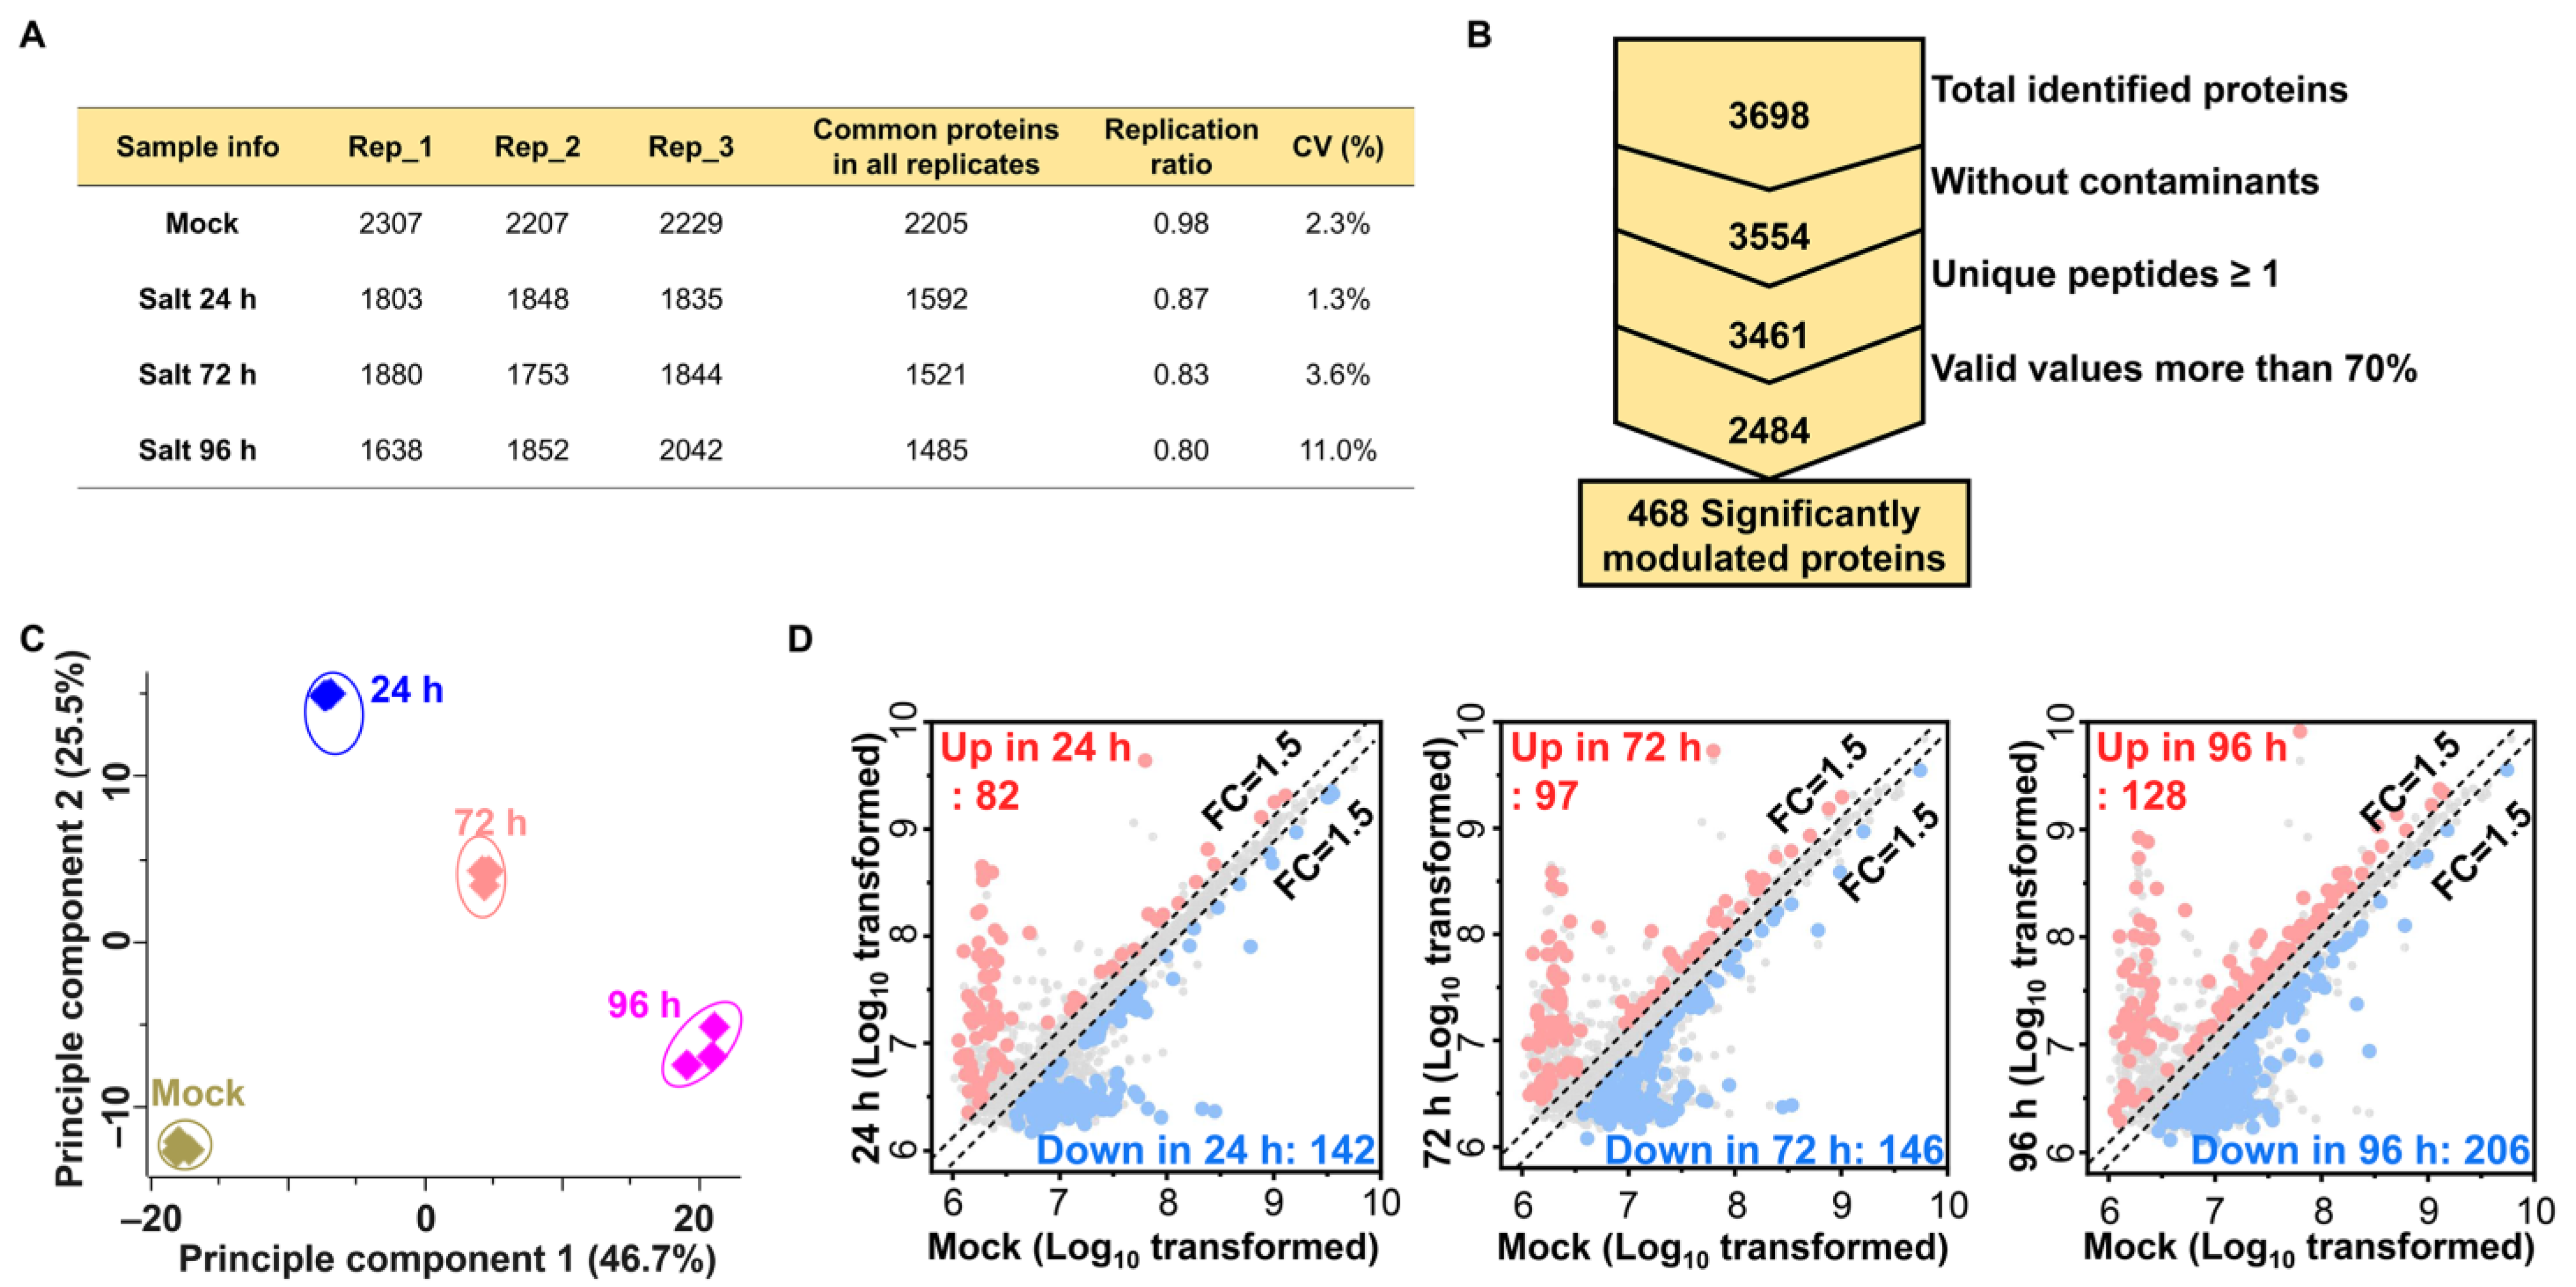
2.2. Label-Free Proteomic Analysis of Salt Treated Ginseng Leaves
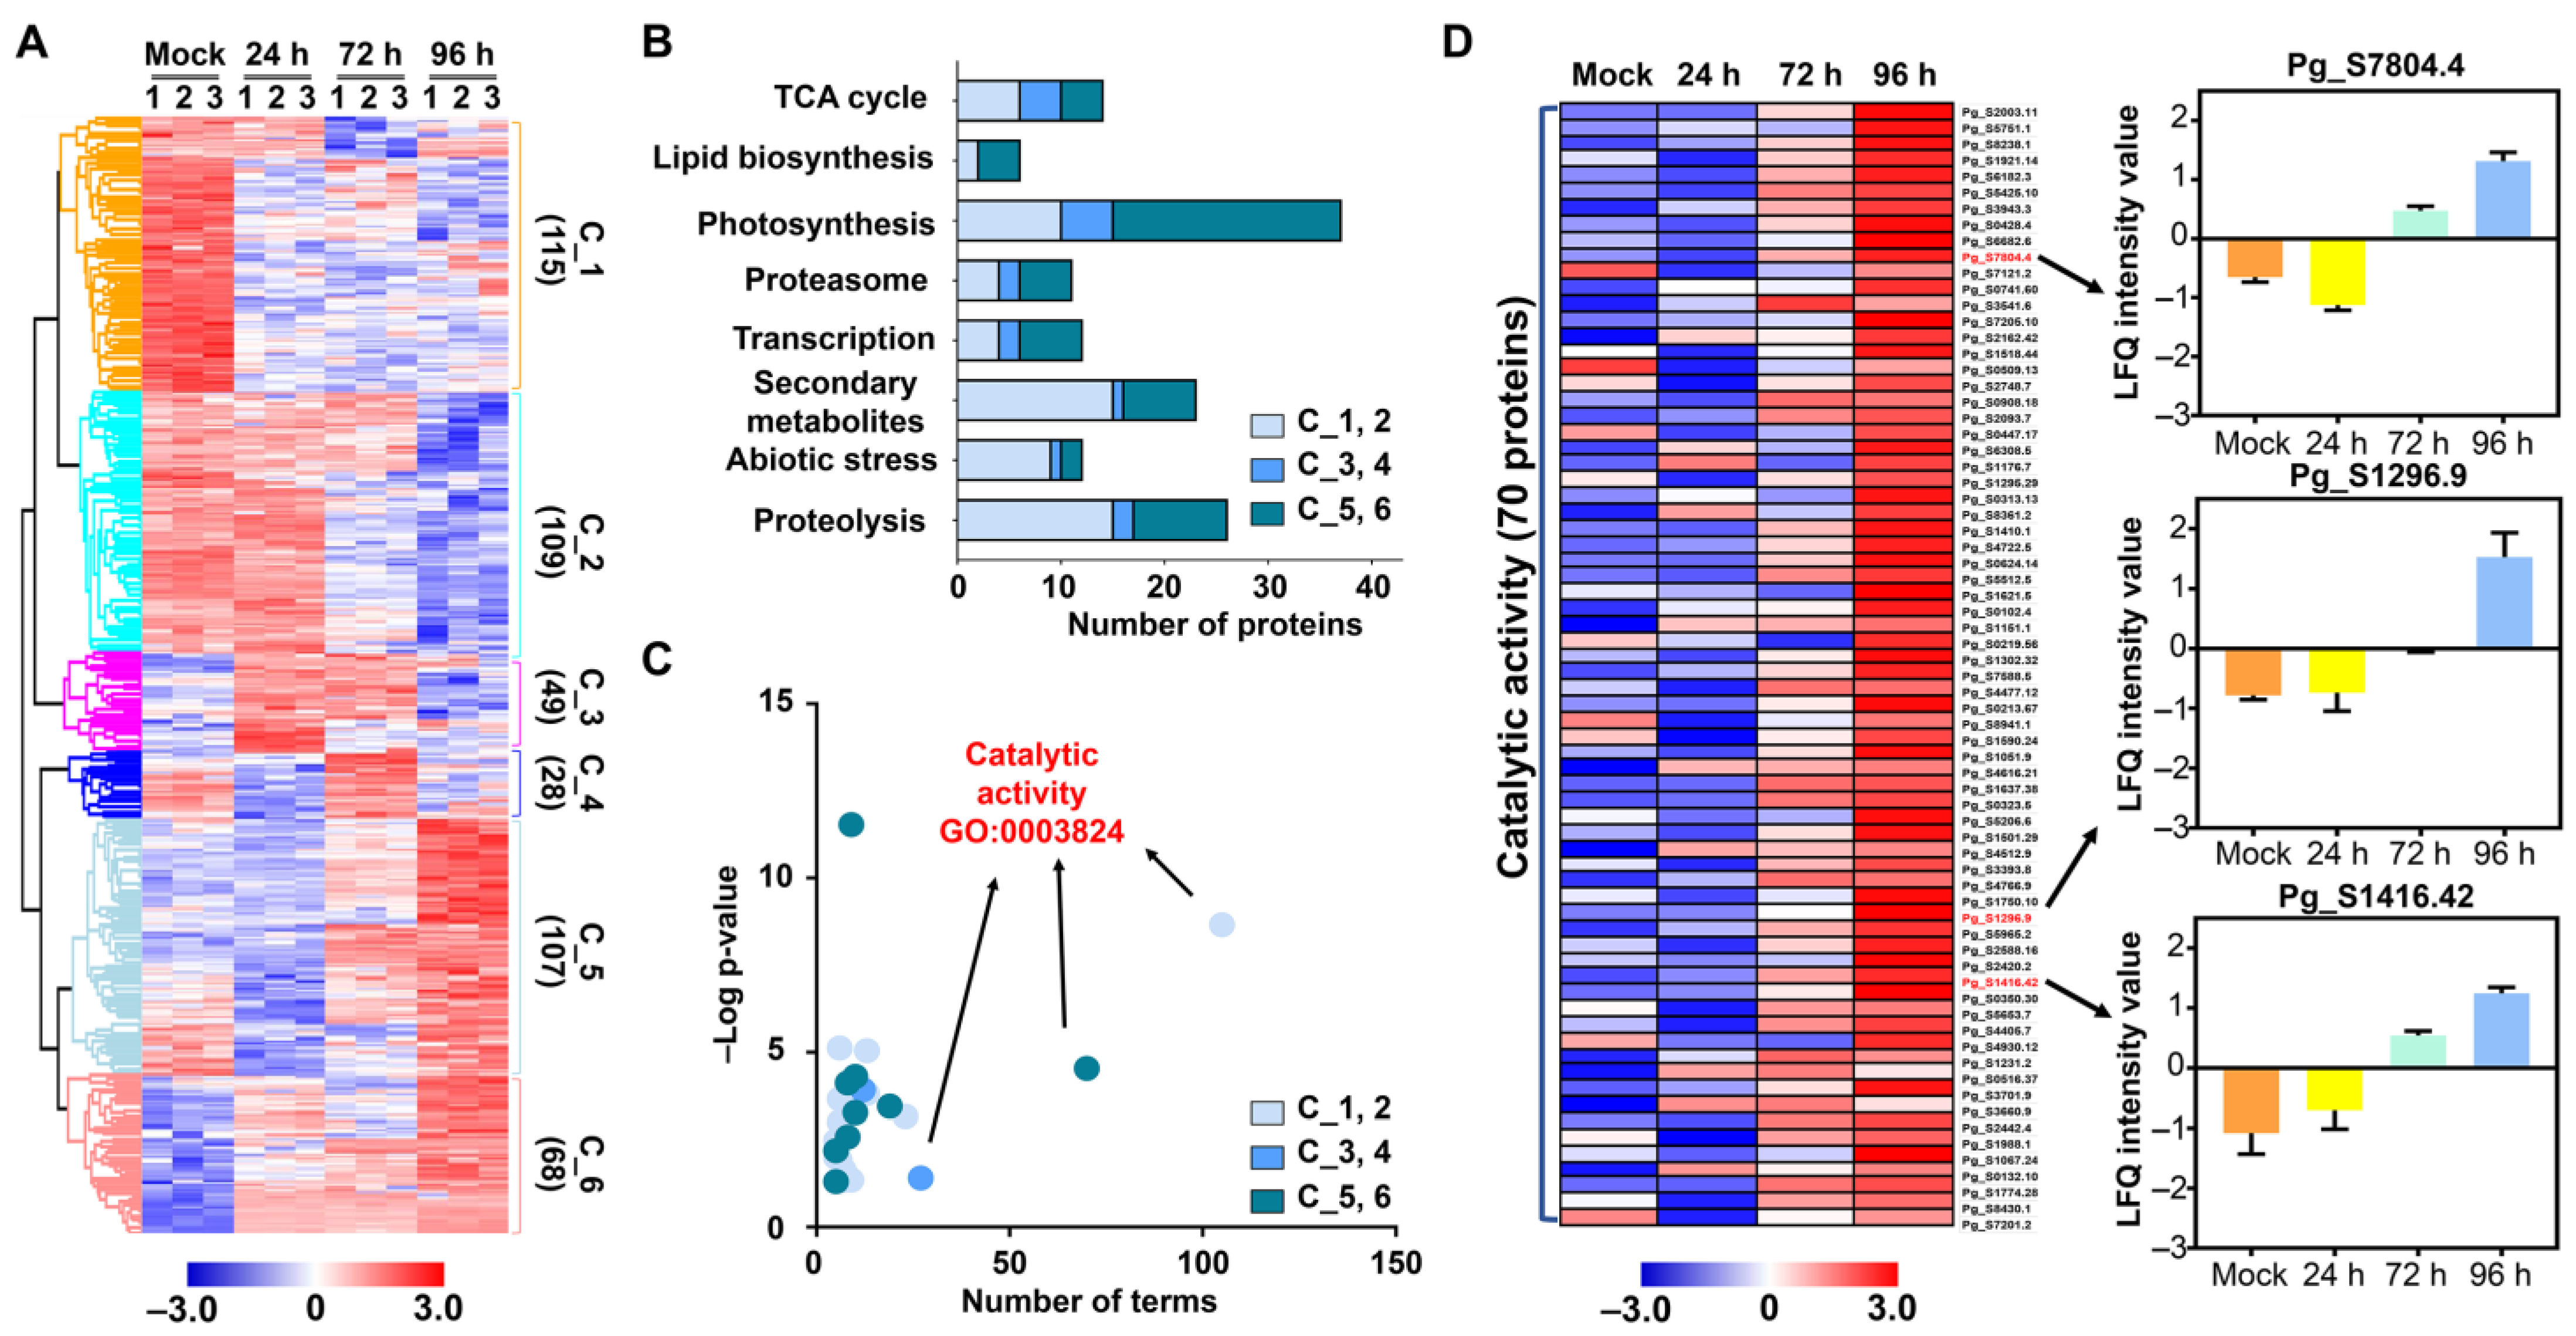
2.3. Functional Classification of Identified DMPs
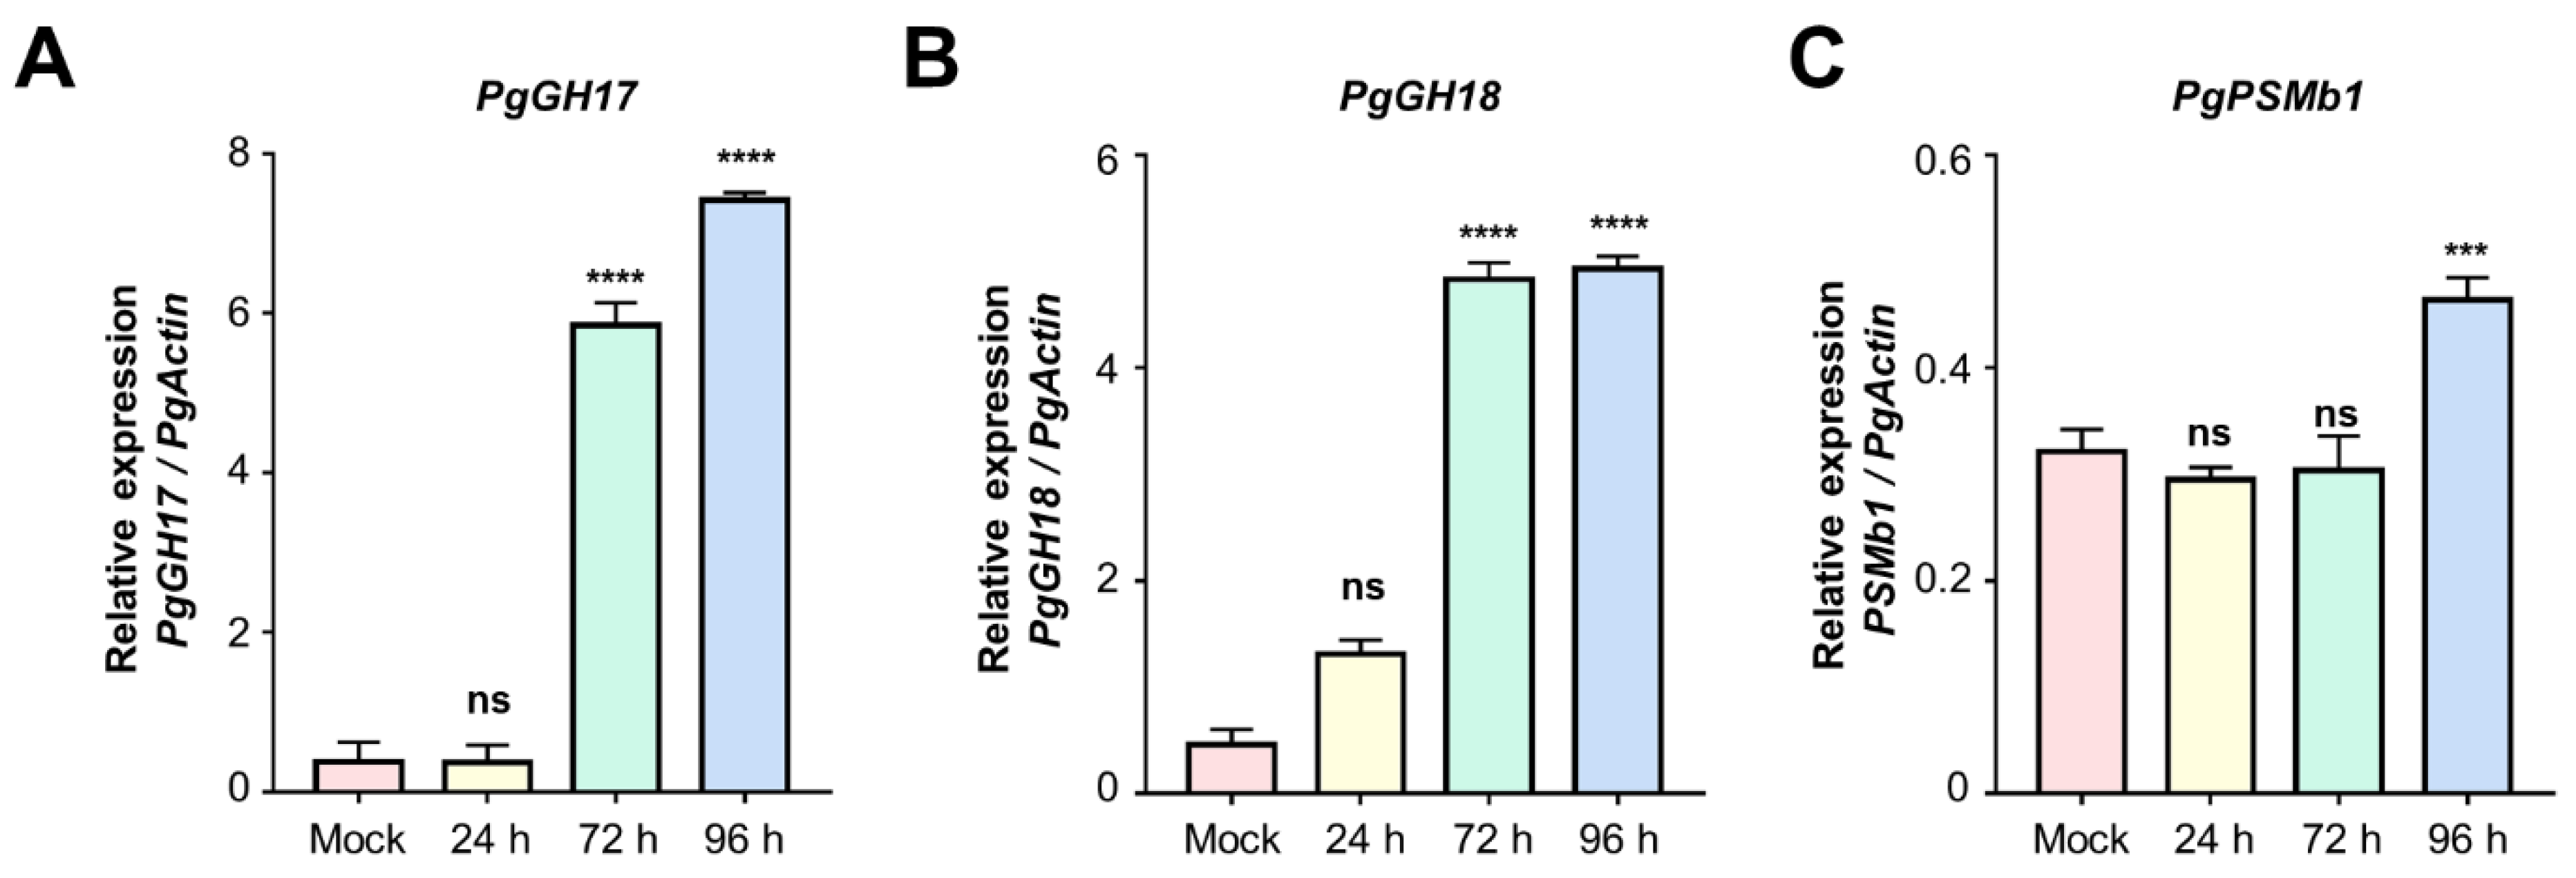
2.4. Validation of Candidate Proteins Using qRT-PCR
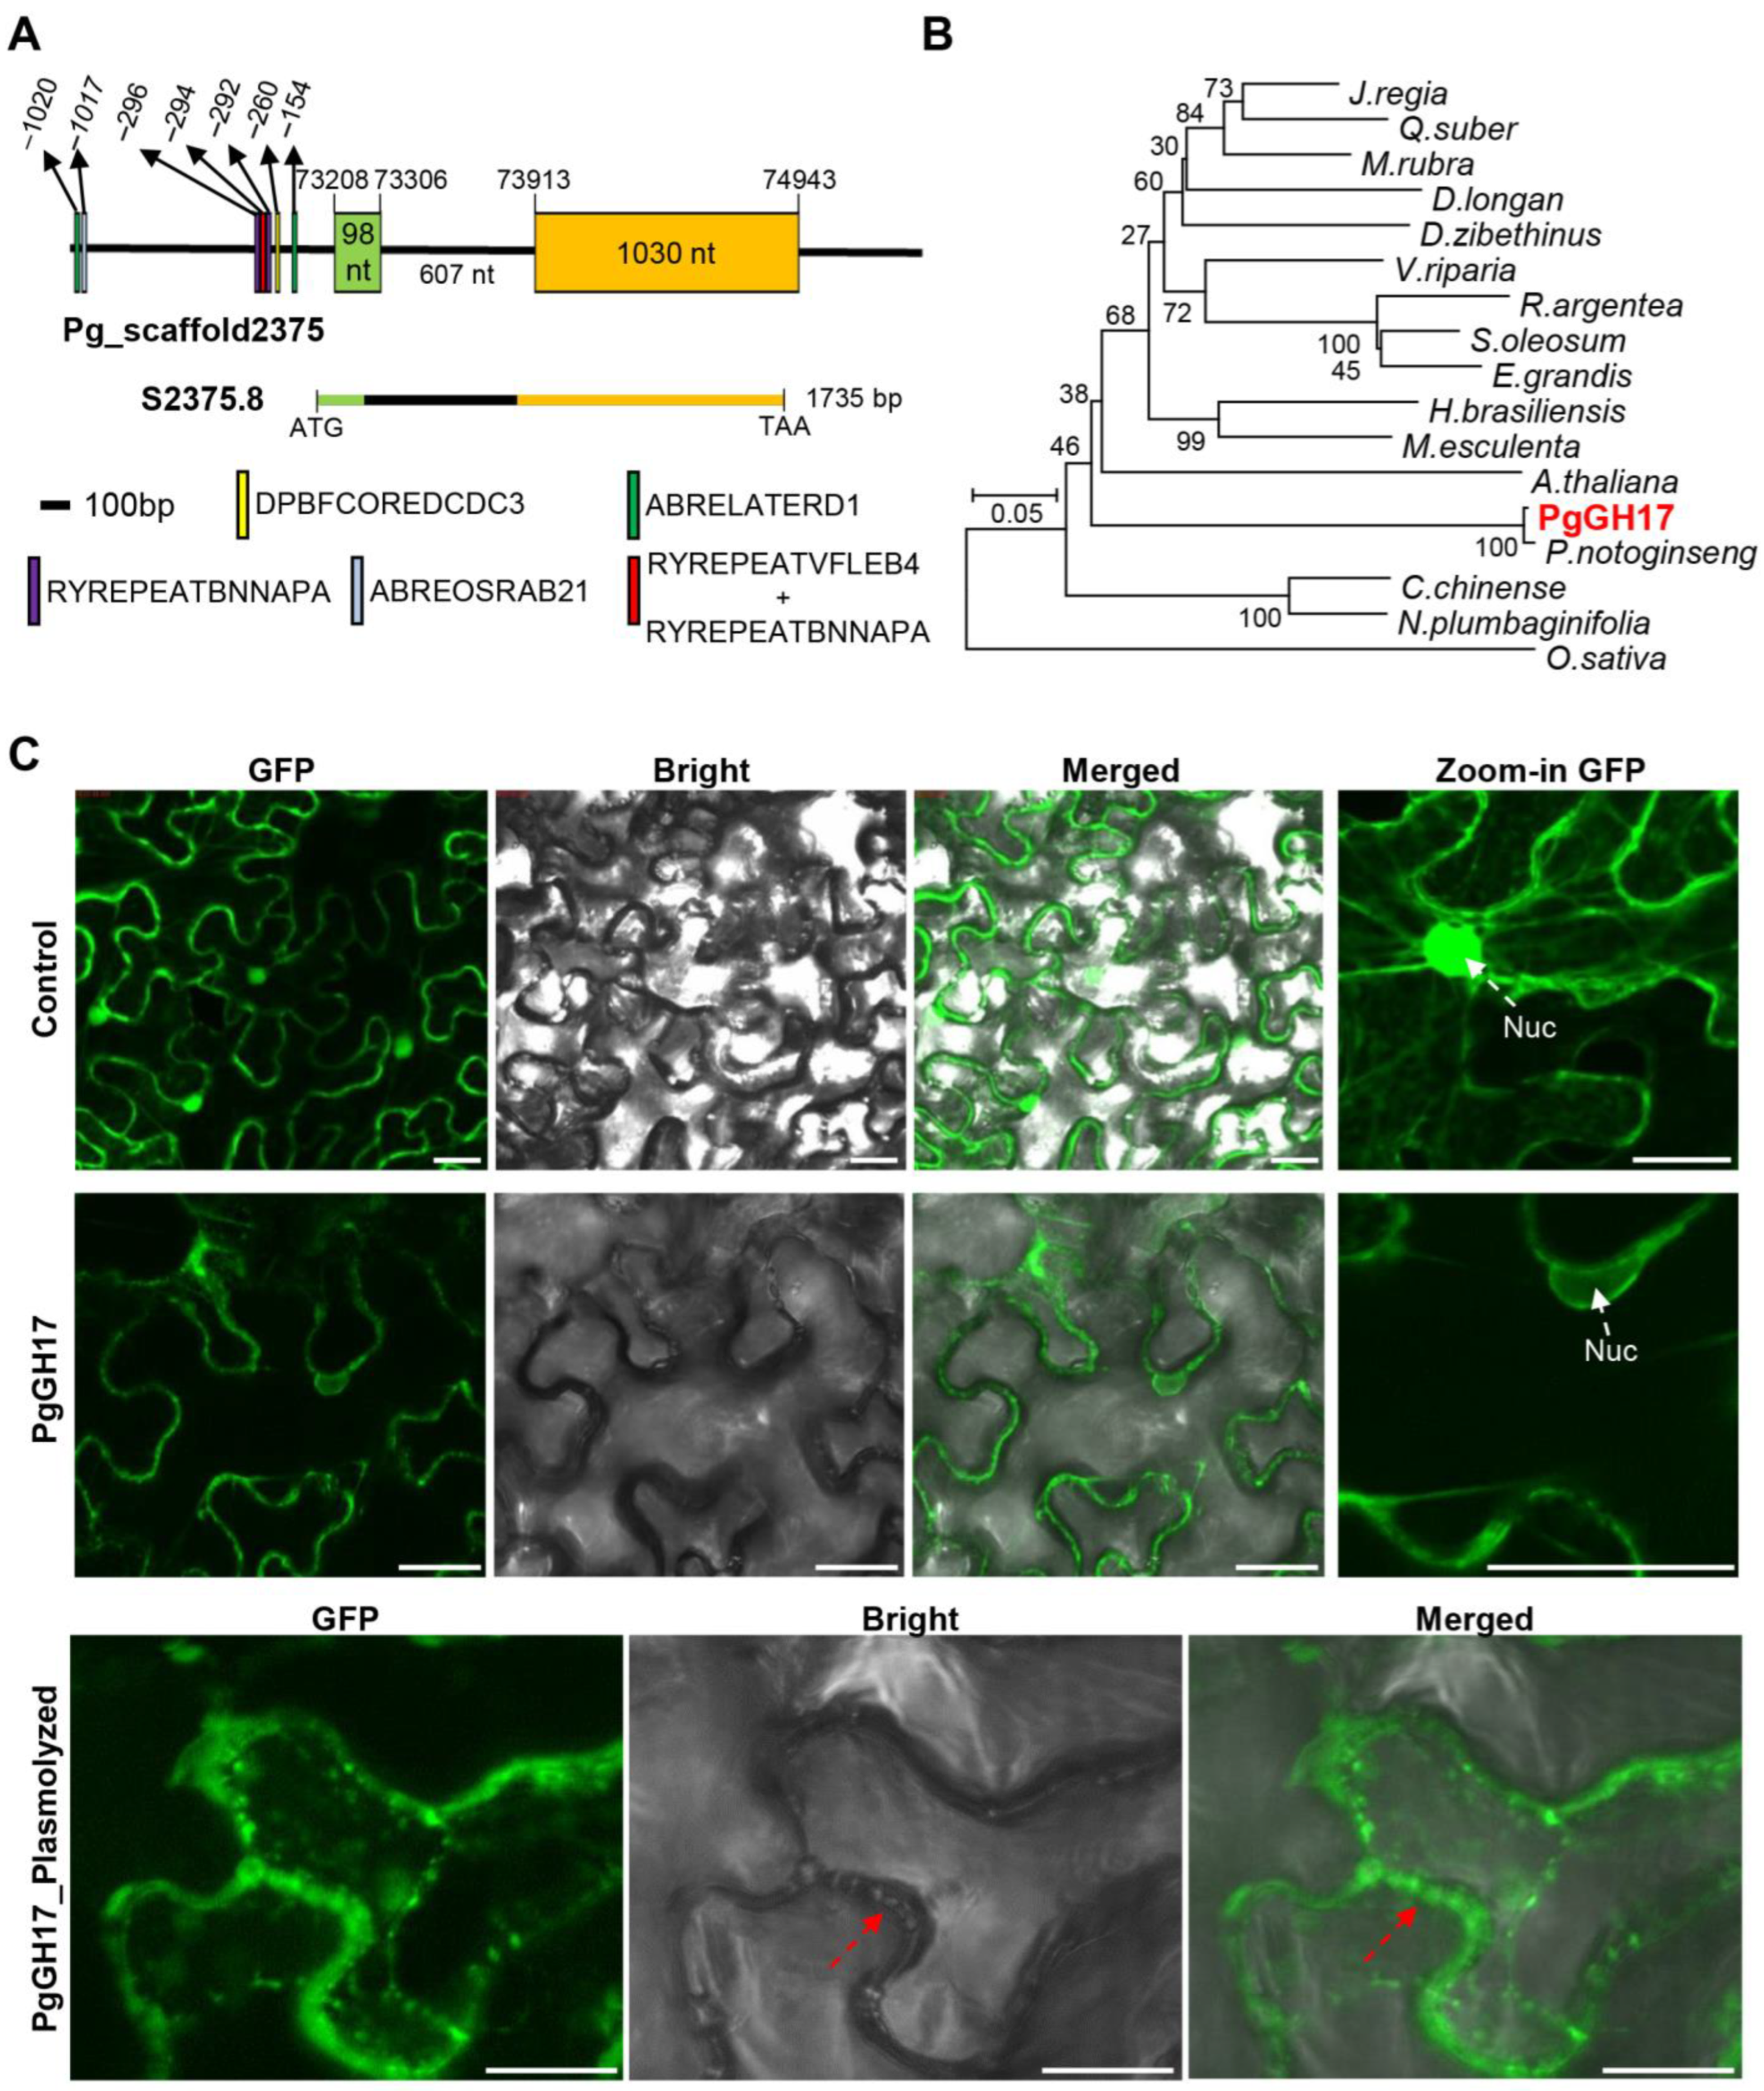
2.5. Sequence Analysis and Cloning of PgGH17
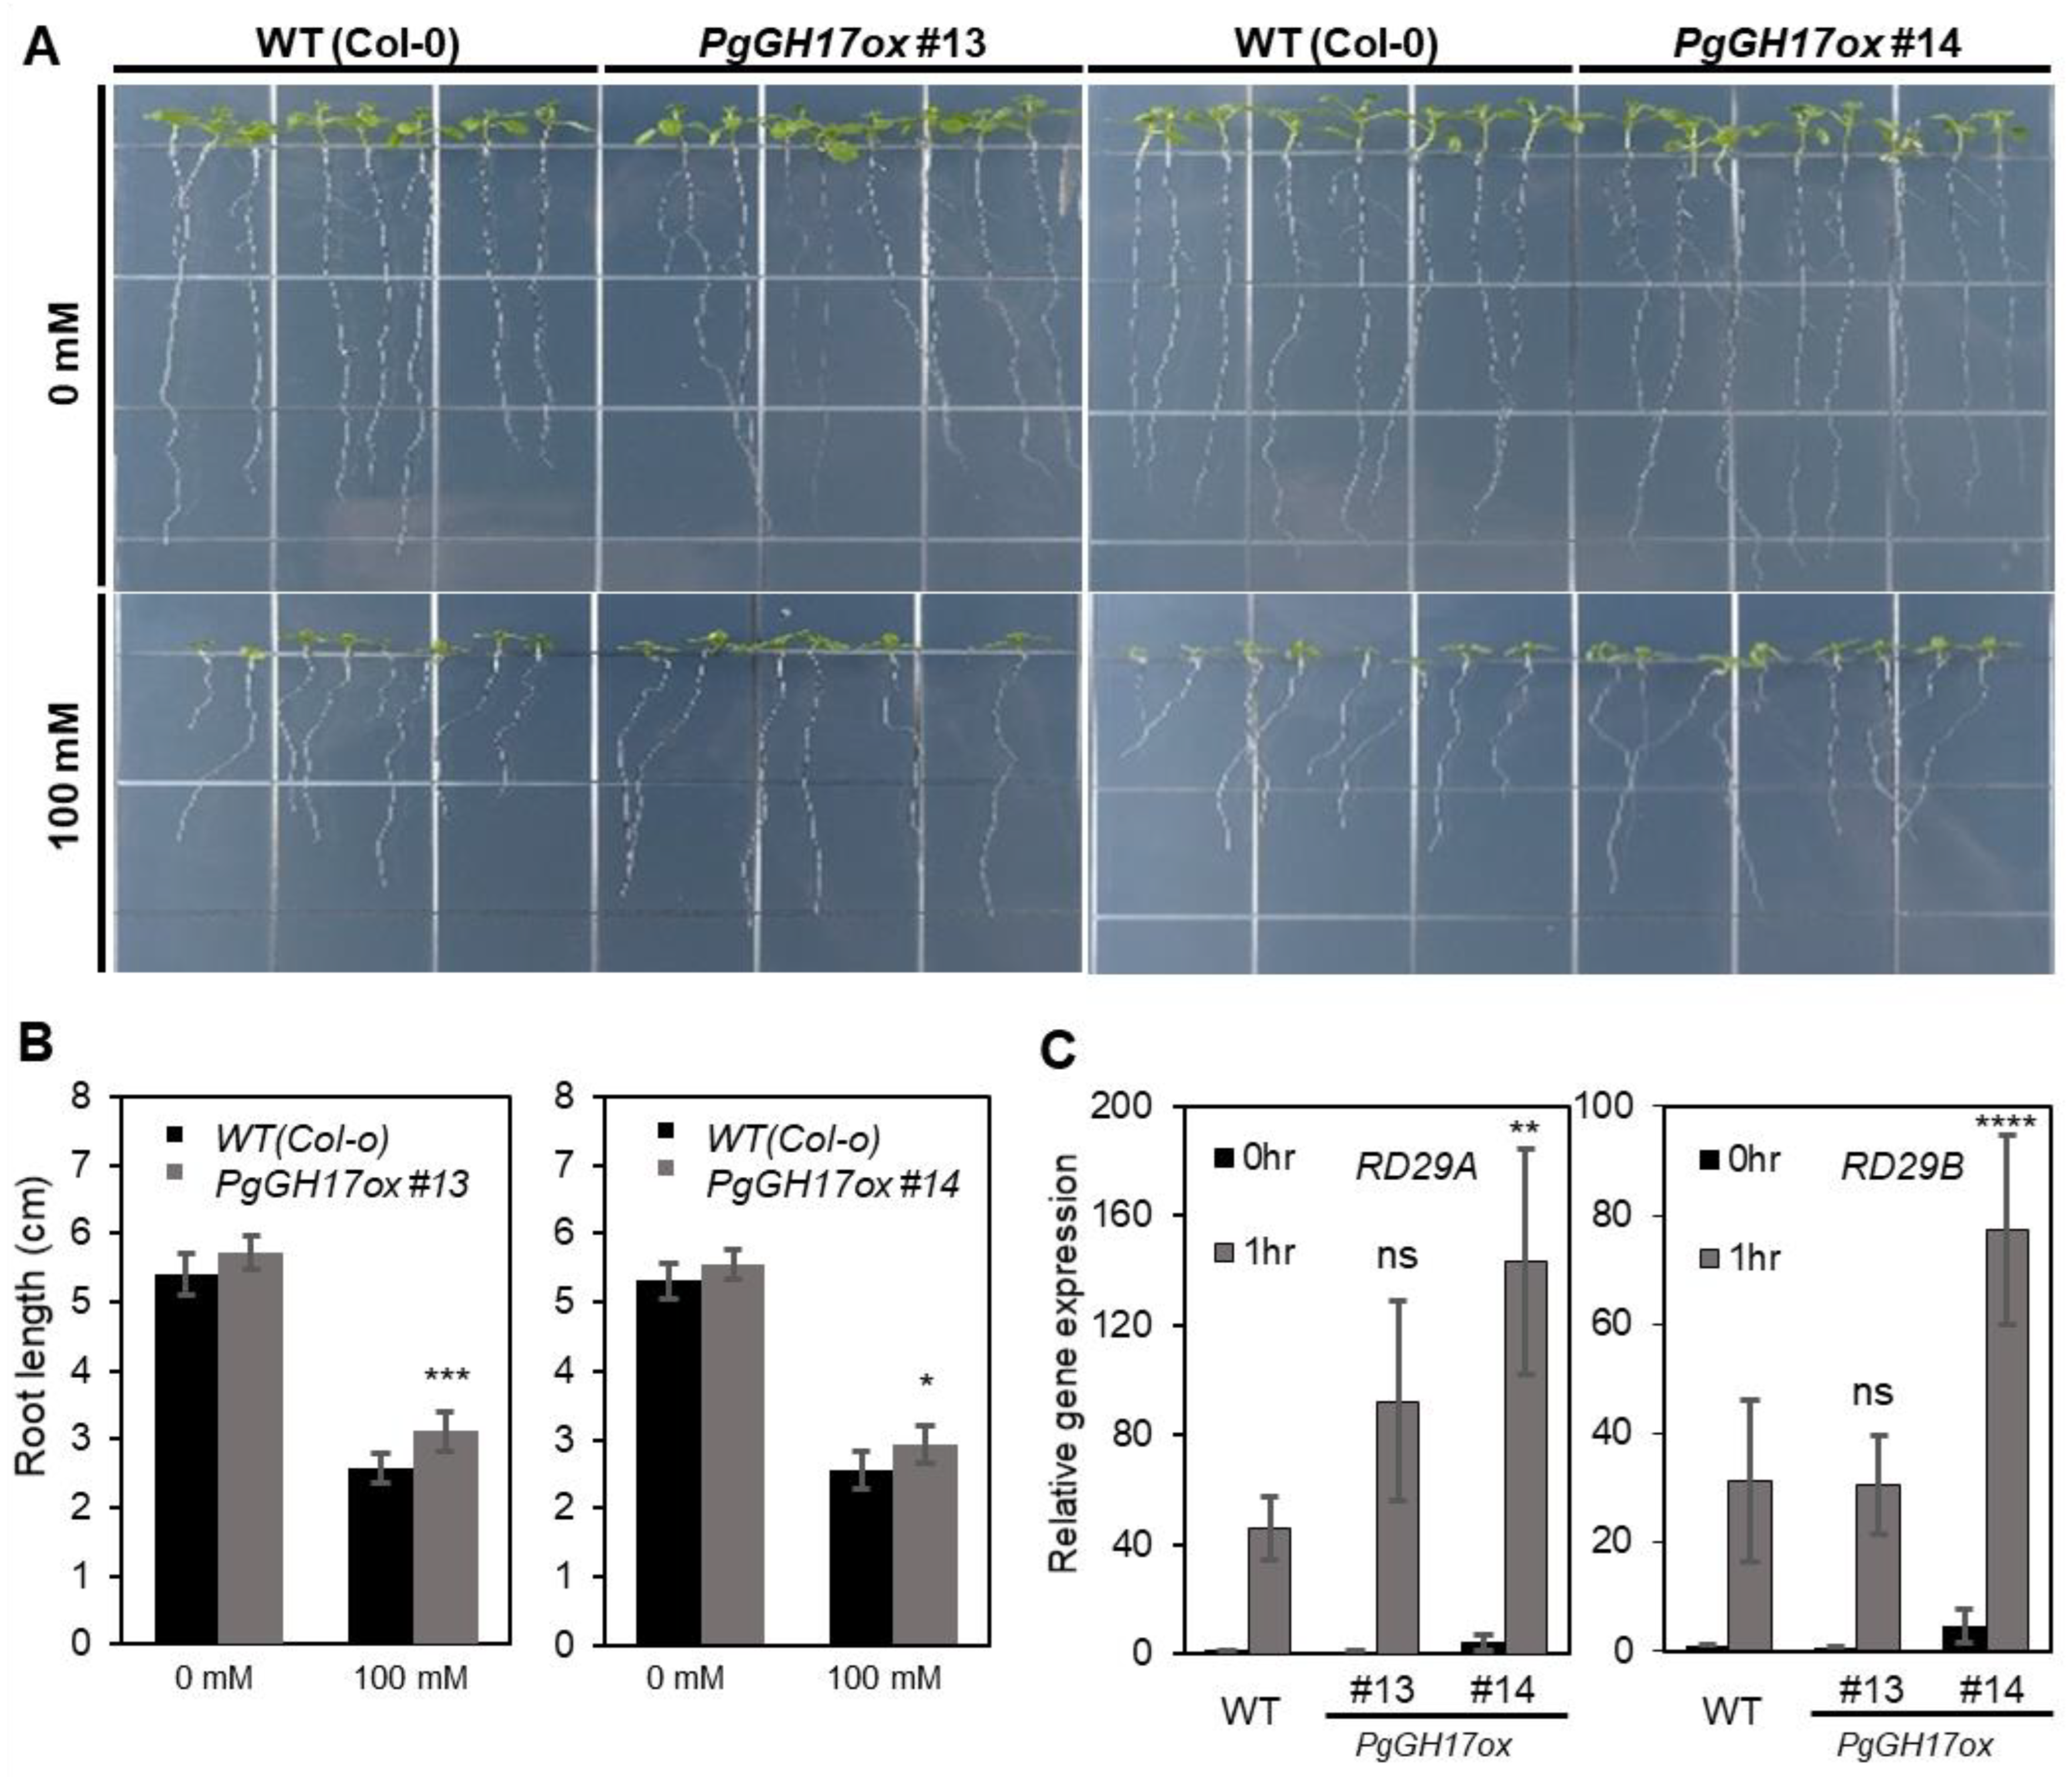
2.6. Salt Response in PgGH17-Overexpressing Arabidopsis Plants
3. Discussion
3.1. Activation of ROS Scavenging by Oxidative Stress
3.2. Protein Metabolism in Response to Salt Stress
3.3. Physiological Response of Ginseng to Salinity Exposure
3.4. Role of PgGH17 in Salt Stress Tolerance in Ginseng
4. Materials and Methods
4.1. Plant Materials and qRT-PCR
4.2. Lipid Peroxidation and Hydrogen Peroxide Assays
4.3. Determination of Antioxidant Enzyme Activities
4.4. Total Protein Extraction Using Ginseng Leaves
4.5. In-Solution Trypsin Digestion, Peptide Desalting, and BPRP Fractionation
4.6. LC-MS/MS Analysis
4.7. LFQ Data Analysis
4.8. Construction of the Plant Expression Vector and Transformation
4.9. Arabidopsis Material and Growth Condition
4.10. Arabidopsis Expression Examination
4.11. Salt Tolerance Test of PgGH17-Expressed Arabidopsis
4.12. Statistical analysis
5. Conclusions
Supplementary Materials
Author Contributions
Funding
Institutional Review Board Statement
Informed Consent Statement
Data Availability Statement
Conflicts of Interest
References
- Ma, R.; Sun, L.; Chen, X.; Jiang, R.; Sun, H.; Zhao, D. Proteomic changes in different growth periods of ginseng roots. Plant Physiol. Biochem. 2013, 67, 20–32. [Google Scholar] [CrossRef] [PubMed]
- Gong, Z. Plant abiotic stress: New insights into the factors that activate and modulate plant responses. J. Integr. Plant Biol. 2021, 63, 429–430. [Google Scholar] [CrossRef]
- Zhao, S.; Zhang, Q.; Liu, M.; Zhou, H.; Ma, C.; Wang, P. Regulation of plant responses to salt stress. Int. J. Mol. Sci. 2021, 22, 4609. [Google Scholar] [CrossRef] [PubMed]
- Ingram, J.; Bartels, D. The molecular basis of dehydration tolerance in plants. Annu. Rev. Plant Physiol. Plant Mol. Biol. 1996, 47, 377–403. [Google Scholar] [CrossRef] [PubMed]
- Zhou, L.; Xu, J.; Peng, Y. Medicinal Crops. In Encyclopedia of Agriculture and Food Systems; Neal, K.V.A., Ed.; Academic Press: Cambridge, MA, USA, 2014; pp. 223–230. [Google Scholar] [CrossRef]
- Chopra, P.; Chhillar, H.; Kim, Y.-J.; Jo, I.H.; Kim, S.T.; Gupta, R. Phytochemistry of ginsenosides: Recent advancements and emerging roles. Crit. Rev. Food Sci. Nutr. 2021, 19, 1–28. [Google Scholar] [CrossRef] [PubMed]
- Kim, S.W.; Lee, S.H.; Min, C.W.; Jo, I.H.; Bang, K.H.; Hyun, D.-Y.; Agrawal, G.K.; Rakwal, R.; Zargar, S.M.; Gupta, R.; et al. Ginseng (panax sp.) proteomics: An update. Appl. Biol. Chem. 2017, 60, 311–320. [Google Scholar] [CrossRef]
- Kim, J.-U.; Kim, Y.-C.; Kim, D.-H.; Lee, J.-W.; Bang, K.-H.; Hyun, D.-Y.; Jang, M.-H.; Seong, B.-J.; Park, G.-H.; Yoon, Y.; et al. New korean ginseng cultivar ‘cheonmyeong’ with high yield and rusty root tolerance. Hortic. Sci. Technol. 2021, 39, 132–140. [Google Scholar] [CrossRef]
- Otlewska, A.; Migliore, M.; Dybka-Stępień, K.; Manfredini, A.; Struszczyk-Świta, K.; Napoli, R.; Białkowska, A.; Canfora, L.; Pinzari, F. When salt meddles between plant, soil, and microorganisms. Front. Plant Sci. 2020, 11, 553087. [Google Scholar] [CrossRef]
- Jo, I.-H.; Bang, K.-H.; Hong, C.E.; Kim, J.-U.; Lee, J.-W.; Kim, D.-H.; Hyun, D.-Y.; Ryu, H.; Kim, Y.-C. Analysis of the chloroplast genome and SNP detection in a salt tolerant breeding line in korean ginseng. J. Plant Biotechnol. 2016, 43, 417–421. [Google Scholar] [CrossRef]
- Jorrin-Novo, J.V. Plant Proteomics Methods and Protocols, 2nd ed.; Jorrin-Novo, J.V., Komatsu, S., Weckwerth, W., Wienkoop, S., Eds.; Human Press: Totowa, NJ, USA, 2014; Volume 1072, pp. 3–13. [Google Scholar] [CrossRef]
- Howard, R.J.; Mendelssohn, I. a salinity as a constraint on growth of oligohaline marsh macrophytes. i. species variation in stress tolerance. Am. J. Bot. 1999, 86, 785–794. [Google Scholar] [CrossRef]
- Shin, J.-H.; Fu, T.; Park, K.H.; Kim, K.S. The effect of fungicides on mycelial growth and conidial germination of the finseng root rot fungus, cylindrocarpon destructans. Mycobiology 2017, 45, 220–225. [Google Scholar] [CrossRef] [PubMed]
- Cho, J.-W.; Kim, C.-S. Photosynthetic response of korean ginseng under saline condition. Korean J. Crop Sci. 2004, 49, 100–104. [Google Scholar]
- Liu, Y.; Lu, S.; Liu, K.; Wang, S.; Huang, L.; Guo, L. Proteomics: A powerful tool to study plant responses to biotic stress. Plant Methods 2019, 15, 135. [Google Scholar] [CrossRef] [PubMed]
- Kim, S.W.; Min, C.W.; Gupta, R.; Jo, I.H.; Bang, K.H.; Kim, Y.-C.; Kim, K.-H.; Kim, S.T. Proteomics analysis of early salt-responsive proteins in ginseng (Panax ginseng C. A. Meyer) leaves. Korean J. Med. Crop Sci. 2014, 22, 398–404. [Google Scholar] [CrossRef]
- Jung, J.; Min, C.W.; Kim, S.W.; Gupta, R.; Jang, W.; Bang, K.; Kim, Y.; Jo, I.; Kim, S.T. Proteomic analysis of ginseng (Panax ginseng C. A. Meyer) fluid proteins under salt stress. Agronomy 2022, 12, 2048. [Google Scholar] [CrossRef]
- Kim, S.Y.; Chung, H.J.; Thomas, T.L. Isolation of a novel class of BZIP transcription factors that interact with ABA-responsive and embryo-specification elements in the Dc3 promoter using a modified yeast one-hybrid system. Plant J. 1997, 11, 1237–1251. [Google Scholar] [CrossRef] [PubMed]
- Simpson, S.D.; Nakashima, K.; Narusaka, Y.; Seki, M.; Shinozaki, K.; Yamaguchi-Shinozaki, K. Two different novel cis-acting elements of Erd1, a ClpA homologous arabidopsis gene function in induction by dehydration stress and dark-induced senescence. Plant J. 2003, 33, 259–270. [Google Scholar] [CrossRef] [PubMed]
- Marcotte, W.R.J.; Russell, S.H.; Quatrano, R.S. Abscisic acid-responsive sequences from the em gene of wheat. Plant Cell 1989, 1, 969–976. [Google Scholar] [CrossRef] [PubMed]
- Ezcurra, I.; Wycliffe, P.; Nehlin, L.; Ellerström, M.; Rask, L. Transactivation of the brassica napus napin promoter by ABI3 requires interaction of the conserved B2 and B3 domains of ABI3 with different cis-elements: B2 Mediates Activation through an ABRE, Whereas B3 Interacts with an RY/G-Box. Plant J. 2000, 24, 57–66. [Google Scholar] [CrossRef]
- Li, S.; Wang, Z.; Tang, B.; Zheng, L.; Chen, H.; Cui, X.; Ge, F.; Liu, D. A Pathogenesis-related protein-like gene is involved in the Panax notoginseng defense response to the root rot pathogen. Front. Plant Sci. 2020, 11, 610176. [Google Scholar] [CrossRef]
- Bihmidine, S.; Lin, J.; Stone, J.M.; Awada, T.; Specht, J.E.; Clemente, T.E. Activity of the arabidopsis RD29A and RD29B promoter elements in soybean under water stress. Planta 2013, 237, 55–64. [Google Scholar] [CrossRef] [PubMed]
- Hua, Z.-M.; Yang, X.; Fromm, M.E. Activation of the NaCl- and drought-induced RD29A and RD29B promoters by constitutively active arabidopsis MAPKK or MAPK proteins. Plant. Cell Environ. 2006, 29, 1761–1770. [Google Scholar] [CrossRef] [PubMed]
- Hasanuzzaman, M.; Raihan, M.R.; Masud, A.A.; Rahman, K.; Nowroz, F.; Rahman, M.; Nahar, K.; Fujita, M. Regulation of reactive oxygen species and antioxidant defense in plants under salinity. Int. J. Mol. Sci. 2021, 22, 9326. [Google Scholar] [CrossRef] [PubMed]
- Zentgraf, U.; Andrade-Galan, A.G.; Bieker, S. Specificity of H2O2 signaling in leaf senescence: Is the ratio of H2O2 contents in different cellular compartments sensed in arabidopsis plants? Cell. Mol. Biol. Lett. 2022, 27, 4. [Google Scholar] [CrossRef]
- Dhindsa, R.S.; Plumb-Dhindsa, P.; Thorpe, T.A. Leaf senescence: Correlated with increased levels of membrane permeability and lipid peroxidation, and decreased levels of superoxide dismutase and catalase. J. Exp. Bot. 1981, 32, 93–101. [Google Scholar] [CrossRef]
- Das, K.; Roychoudhury, A. Reactive oxygen species (ROS) and response of antioxidants as ROS-scavengers during environmental stress in plants. Front. Environ. Sci. 2014, 2, 53. [Google Scholar] [CrossRef]
- Eastmond, P.J. Monodehyroascorbate reductase4 is required for seed storage oil hydrolysis and postgerminative growth in arabidopsis. Plant Cell 2007, 19, 1376–1387. [Google Scholar] [CrossRef]
- Dietz, K.-J.; Turkan, I.; Krieger-Liszkay, A. Redox- and reactive oxygen species-dependent signaling into and out of the photosynthesizing chloroplast. Plant Physiol. 2016, 171, 1541–1550. [Google Scholar] [CrossRef]
- Sofo, A.; Scopa, A.; Nuzzaci, M.; Vitti, A. Ascorbate peroxidase and catalase activities and their genetic regulation in plants subjected to drought and salinity stresses. Int. J. Mol. Sci. 2015, 16, 13561–13578. [Google Scholar] [CrossRef]
- Omidbakhshfard, M.A.; Omranian, N.; Ahmadi, F.S.; Nikoloski, Z.; Mueller-Roeber, B. Effect of salt stress on genes encoding translation-associated proteins in Arabidopsis thaliana. Plant Signal. Behav. 2012, 7, 1095–1102. [Google Scholar] [CrossRef]
- Jiang, C.; Bi, Y.; Zhang, R.; Feng, S. Expression of RcHSP70, heat shock protein 70 gene from chinese rose, enhances host resistance to abiotic stresses. Sci. Rep. 2020, 10, 2445. [Google Scholar] [CrossRef]
- Hershko, A.; Ciechanover, A. The ubiquitin system. Annu. Rev. Biochem. 1998, 67, 425–479. [Google Scholar] [CrossRef]
- Coux, O.; Tanaka, K.; Goldberg, A.L. Structure and functions of the 20S and 26 S proteasomes. Annu. Rev. Biochem. 1996, 65, 801–847. [Google Scholar] [CrossRef]
- Bonea, D.; Noureddine, J.; Gazzarrini, S.; Zhao, R. Oxidative and salt stresses alter the 26S proteasome holoenzyme and associated protein profiles in Arabidopsis thaliana. BMC Plant Biol. 2021, 21, 486. [Google Scholar] [CrossRef]
- Jung, T.; Grune, T. The proteasome and the degradation of oxidized proteins: Part I structure of proteasomes. Redox Biol. 2013, 1, 178–182. [Google Scholar] [CrossRef]
- Hniličková, H.; Hnilička, F.; Martinková, J.; Kraus, K. Effects of salt stress on water status, photosynthesis and chlorophyll fluorescence of rocket. Plant Soil Environ. 2017, 63, 362–367. [Google Scholar] [CrossRef]
- Caruso, G.; Cavaliere, C.; Guarino, C.; Gubbiotti, R.; Foglia, P.; Laganà, A. Identification of changes in Triticum durum L. leaf proteome in response to salt stress by two-dimensional electrophoresis and MALDI-TOF mass spectrometry. Anal. Bioanal. Chem. 2008, 391, 381–390. [Google Scholar] [CrossRef]
- Razavizadeh, R.; Ehsanpour, A.A.; Ahsan, N.; Komatsu, S. Proteome analysis of tobacco leaves under salt stress. Peptides 2009, 30, 1651–1659. [Google Scholar] [CrossRef] [PubMed]
- Parker, R.; Flowers, T.J.; Moore, A.L.; Harpham, N.V.J. An accurate and reproducible method for proteome profiling of the effects of salt stress in the rice leaf lamina. J. Exp. Bot. 2006, 57, 1109–1118. [Google Scholar] [CrossRef] [PubMed]
- Mazarei, M.; Lennon, K.A.; Puthoff, D.P.; Rodermel, S.R.; Baum, T.J. Expression of an arabidopsis phosphoglycerate mutase homologue is localized to apical meristems, regulated by hormones, and induced by sedentary plant-parasitic nematodes. Plant Mol. Biol. 2003, 53, 513–530. [Google Scholar] [CrossRef] [PubMed]
- Amini, F.; Ehsanpour, A.A.; Hoang, Q.T.; Shin, J.S. Protein pattern changes in tomato under in vitro salt stress. Russ. J. Plant Physiol. 2007, 54, 464–471. [Google Scholar] [CrossRef]
- Guo, Q.; Liu, L.; Rupasinghe, T.W.T.; Roessner, U.; Barkla, B.J. Salt stress alters membrane lipid content and lipid biosynthesis pathways in the plasma membrane and tonoplast. Plant Physiol. 2022, 189, 805–826. [Google Scholar] [CrossRef] [PubMed]
- Tsydendambaev, V.D.; Ivanova, T.V.; Khalilova, L.A.; Kurkova, E.B.; Myasoedov, N.A.; Balnokin, Y.V. Fatty acid composition of lipids in vegetative organs of the halophyte Suaeda altissima under different levels of salinity. Russ. J. Plant Physiol. 2013, 60, 661–671. [Google Scholar] [CrossRef]
- Sui, N.; Han, G. Salt-induced photoinhibition of PSII is alleviated in halophyte Thellungiella halophila by increases of unsaturated fatty acids in membrane lipids. Acta Physiol. Plant. 2014, 36, 983–992. [Google Scholar] [CrossRef]
- Volkov, V. salinity tolerance in plants. quantitative approach to ion transport starting from halophytes and stepping to genetic and protein engineering for manipulating ion fluxes. Front. Plant Sci. 2015, 6, 873. [Google Scholar] [CrossRef]
- Ahmad, I.; Mian, A.; Maathuis, F.J.M. Overexpression of the rice AKT1 potassium channel affects potassium nutrition and rice drought tolerance. J. Exp. Bot. 2016, 67, 2689–2698. [Google Scholar] [CrossRef]
- Wang, L.; Liu, Y.; Li, D.; Feng, S.; Yang, J.; Zhang, J.; Zhang, J.; Wang, D.; Gan, Y. Improving salt tolerance in potato through overexpression of AtHKT1 Gene. BMC Plant Biol. 2019, 19, 357. [Google Scholar] [CrossRef]
- Zhu, H.; Yang, X.; Li, Q.; Guo, J.; Ma, T.; Liu, S.; Lin, S.; Zhou, Y.; Zhao, C.; Wang, J.; et al. The sweetpotato voltage-gated K+ channel & β subunit, KIbB1, positively regulates low-K+ and high-salinity tolerance by maintaining ion homeostasis. Genes. 2022, 13, 1100. [Google Scholar] [CrossRef]
- Sanyal, S.K.; Kanwar, P.; Fernandes, J.L.; Mahiwal, S.; Yadav, A.K.; Samtani, H.; Srivastava, A.K.; Suprasanna, P.; Pandey, G.K. Arabidopsis mitochondrial voltage-dependent anion channels are involved in maintaining reactive oxygen species homeostasis, oxidative and salt stress tolerance in yeast. Front. Plant Sci. 2020, 11, 50. [Google Scholar] [CrossRef]
- Liu, J.; Zhang, W.; Long, S.; Zhao, C. Maintenance of cell wall integrity under high salinity. Int. J. Mol. Sci. 2021, 22, 3260. [Google Scholar] [CrossRef]
- Jiang, Y.; Yang, B.; Harris, N.S.; Deyholos, M.K. Comparative proteomic analysis of NaCl stress-responsive proteins in arabidopsis roots. J. Exp. Bot. 2007, 58, 3591–3607. [Google Scholar] [CrossRef] [PubMed]
- Noh, G.; Kim, J.; Cho, S.W.; Kim, Y.; Jung, j.; Hong, W.; Jung, K.; Park, G.; Son, H.; Jo, I.; et al. Overexpression of the ginseng GH18 gene confers salinity tolerance in arabidopsis. Plant Biotechnol. Rep. 2022, 16, 683–696. [Google Scholar] [CrossRef]
- Bray, E.A. Genes commonly regulated by water-deficit stress in Arabidopsis thaliana. J. Exp. Bot. 2004, 55, 2331–2341. [Google Scholar] [CrossRef] [PubMed]
- Su, Y.; Wang, Z.; Liu, F.; Li, Z.; Peng, Q.; Guo, J.; Xu, L.; Que, Y. Isolation and characterization of ScGluD2, a new sugarcane beta-1,3-glucanase D family gene induced by Sporisorium scitamineum, ABA, H2O2, NaCl, and CdCl2 stresses. Front. Plant Sci. 2016, 7, 1348. [Google Scholar] [CrossRef] [PubMed]
- Taif, S.; Zhao, Q.; Pu, L.; Li, X.; Liu, D.; Cui, X. A β-1,3-glucanase gene from Panax notoginseng confers resistance in tobacco to Fusarium solani. Ind. Crops Prod. 2020, 143, 111947. [Google Scholar] [CrossRef]
- Akiyama, T.; Pillai, M.A. Molecular cloning, characterization and in vitro expression of a novel endo-1,3-β-glucanase up-regulated by ABA and drought stress in rice (Oryza sativa L.). Plant Sci. 2001, 161, 1089–1098. [Google Scholar] [CrossRef]
- Kang, J.S.; Frank, J.; Kang, C.H.; Kajiura, H.; Vikram, M.; Ueda, A.; Kim, S.; Bahk, J.D.; Triplett, B.; Fujiyama, K.; et al. Salt tolerance of Arabidopsis thaliana requires maturation of N-glycosylated proteins in the golgi apparatus. Proc. Natl. Acad. Sci. USA 2008, 105, 5933–5938. [Google Scholar] [CrossRef]
- Vain, T.; Crowell, E.F.; Timpano, H.; Biot, E.; Desprez, T.; Mansoori, N.; Trindade, L.M.; Pagant, S.; Robert, S.; Höfte, H.; et al. The cellulase KORRIGAN is part of the cellulose synthase complex. Plant Physiol. 2014, 165, 1521–1532. [Google Scholar] [CrossRef]
- Pervaiz, T.; Liu, T.; Fang, X.; Ren, Y.; Li, X.; Liu, Z.; Fiaz, M.; Fang, J.; Shangguan, L. Identification of GH17 gene family in Vitis vinifera and expression analysis of GH17 under various adversities. Physiol. Mol. Biol. Plants 2021, 27, 1423–1436. [Google Scholar] [CrossRef]
- Min, C.W.; Lee, S.H.; Cheon, Y.E.; Han, W.Y.; Ko, J.M.; Kang, H.W.; Kim, Y.C.; Agrawal, G.K.; Rakwal, R.; Gupta, R.; et al. In-depth proteomic analysis of Glycine max seeds during controlled deterioration treatment reveals a shift in seed metabolism. J. Proteom. 2017, 169, 125–135. [Google Scholar] [CrossRef]
- Wu, W.; Zhang, Q.; Ervin, E.H.; Yang, Z.; Zhang, X. Physiological mechanism of enhancing salt stress tolerance of perennial ryegrass by 24-epibrassinolide. Front. Plant Sci. 2017, 8, 1017. [Google Scholar] [CrossRef] [PubMed]
- Osipova, S.V.; Permyakov, A.V.; Permyakova, M.D.; Pshenichnikova, T.A.; Genaev, M.A.; Börner, A. The antioxidant enzymes activity in leaves of inter-varietal substitution lines of wheat (Triticum aestivum L.) with different tolerance to soil water deficit. Acta Physiol. Plant. 2013, 35, 2455–2465. [Google Scholar] [CrossRef]
- Van Nguyen, T.; Kim, S.-W.; Min, C.-W.; Gupta, R.; Lee, G.-H.; Jang, J.-W.; Rathi, D.; Shin, H.-W.; Jung, J.-Y.; Jo, I.-H.; et al. Optimization of protein isolation and label-free quantitative proteomic analysis in four different tissues of korean ginseng. Plants 2021, 10, 1409. [Google Scholar] [CrossRef] [PubMed]
- Min, C.W.; Jang, J.W.; Lee, G.H.; Gupta, R.; Yoon, J.; Park, H.J.; Cho, H.S.; Park, S.R.; Kwon, S.-W.; Cho, L.-H.; et al. TMT-based quantitative membrane proteomics identified PRRs potentially involved in the perception of MSP1 in rice leaves. J. Proteom. 2022, 267, 104687. [Google Scholar] [CrossRef]
- Wiśniewski, J.R.; Zougman, A.; Nagaraj, N.; Mann, M. Universal sample preparation method for proteome analysis. Nat. Methods 2009, 6, 359–362. [Google Scholar] [CrossRef]
- Nguyen, T.V.; Gupta, R.; Annas, D.; Yoon, J.; Kim, Y.-J.; Lee, G.H.; Jang, J.W.; Park, K.H.; Rakwal, R.; Jung, K.-H.; et al. An integrated approach for the efficient extraction and solubilization of rice microsomal membrane proteins for high-throughput proteomics. Front. Plant Sci. 2021, 12, 723369. [Google Scholar] [CrossRef] [PubMed]
- Min, C.W.; Hyeon, H.; Gupta, R.; Park, J.; Cheon, Y.E.; Lee, G.H.; Jang, J.W.; Ryu, H.W.; Lee, B.W.; Park, S.U.; et al. Integrated proteomics and metabolomics analysis highlights correlative metabolite-protein networks in soybean seeds subjected to warm-water soaking. J. Agric. Food Chem. 2020, 68, 8057–8067. [Google Scholar] [CrossRef]
- Gupta, R.; Min, C.W.; Kim, Y.-J.; Kim, S.T. Identification of Msp1-induced signaling components in rice leaves by integrated proteomic and phosphoproteomic analysis. Int. J. Mol. Sci. 2019, 20, 4135. [Google Scholar] [CrossRef]
- Perez-Riverol, Y.; Csordas, A.; Bai, J.; Bernal-Llinares, M.; Hewapathirana, S.; Kundu, D.J.; Inuganti, A.; Griss, J.; Mayer, G.; Eisenacher, M.; et al. The PRIDE database and related tools and resources in 2019: Improving support for quantification data. Nucleic Acids Res. 2019, 47, D442–D450. [Google Scholar] [CrossRef]
- Tyanova, S.; Temu, T.; Cox, J. The MaxQuant computational platform for mass spectrometry-based shotgun proteomics. Nat. Protoc. 2016, 11, 2301–2319. [Google Scholar] [CrossRef]
- Jayakodi, M.; Choi, B.-S.; Lee, S.-C.; Kim, N.-H.; Park, J.Y.; Jang, W.; Lakshmanan, M.; Mohan, S.V.G.; Lee, D.-Y.; Yang, T.-J. Ginseng genome database: An open-access platform for genomics of Panax ginseng. BMC Plant Biol. 2018, 18, 62. [Google Scholar] [CrossRef]
- Tyanova, S.; Temu, T.; Sinitcyn, P.; Carlson, A.; Hein, M.Y.; Geiger, T.; Mann, M.; Cox, J. The Perseus computational platform for comprehensive analysis of (prote)omics data. Nat. Methods 2016, 13, 731–740. [Google Scholar] [CrossRef] [PubMed]
- Tian, T.; Liu, Y.; Yan, H.; You, Q.; Yi, X.; Du, Z.; Xu, W.; Su, Z. AgriGO v2.0: A GO analysis toolkit for the agricultural community, 2017 update. Nucleic Acids Res. 2017, 45, W122–W129. [Google Scholar] [CrossRef] [PubMed]
- Usadel, B.; Poree, F.; Nagel, A.; Lohse, M.; Czedik-Eysenberg, A.; Stitt, M. A guide to using MapMan to visualize and compare omics data in plants: A case study in the crop species, maize. Plant. Cell Environ. 2009, 32, 1211–1229. [Google Scholar] [CrossRef] [PubMed]
- Fu, Y.; Yang, Y.; Chen, S.; Ning, N.; Hu, H. Arabidopsis IAR4 modulates primary root growth under salt stress through ros-mediated modulation of auxin distribution. Front. Plant Sci. 2019, 10, 522. [Google Scholar] [CrossRef] [PubMed]
- Chávez-Avilés, M.N.; Andrade-Pérez, C.L.; Reyes de la Cruz, H. PP2A mediates lateral root development under nacl-induced osmotic stress throughout auxin redistribution in Arabidopsis thaliana. Plant Soil 2013, 368, 591–602. [Google Scholar] [CrossRef]
- Sun, Y.; Liu, X.; Fu, L.; Qin, P.; Li, T.; Ma, X.; Wang, X. Over expression of TaBATH increases salt tolerance in Arabidopsis. Can. J. Plant Sci. 2019, 99, 546–555. [Google Scholar] [CrossRef]


Disclaimer/Publisher’s Note: The statements, opinions and data contained in all publications are solely those of the individual author(s) and contributor(s) and not of MDPI and/or the editor(s). MDPI and/or the editor(s) disclaim responsibility for any injury to people or property resulting from any ideas, methods, instructions or products referred to in the content. |
© 2023 by the authors. Licensee MDPI, Basel, Switzerland. This article is an open access article distributed under the terms and conditions of the Creative Commons Attribution (CC BY) license (https://creativecommons.org/licenses/by/4.0/).
Share and Cite
Jung, J.-Y.; Min, C.W.; Jang, J.W.; Gupta, R.; Kim, J.-H.; Kim, Y.-H.; Cho, S.W.; Song, Y.H.; Jo, I.-H.; Rakwal, R.; et al. Proteomic Analysis Reveals a Critical Role of the Glycosyl Hydrolase 17 Protein in Panax ginseng Leaves under Salt Stress. Int. J. Mol. Sci. 2023, 24, 3693. https://doi.org/10.3390/ijms24043693
Jung J-Y, Min CW, Jang JW, Gupta R, Kim J-H, Kim Y-H, Cho SW, Song YH, Jo I-H, Rakwal R, et al. Proteomic Analysis Reveals a Critical Role of the Glycosyl Hydrolase 17 Protein in Panax ginseng Leaves under Salt Stress. International Journal of Molecular Sciences. 2023; 24(4):3693. https://doi.org/10.3390/ijms24043693
Chicago/Turabian StyleJung, Ju-Young, Cheol Woo Min, Jeong Woo Jang, Ravi Gupta, Ji-Hyun Kim, Young-Hun Kim, Sung Won Cho, Young Hun Song, Ick-Hyun Jo, Randeep Rakwal, and et al. 2023. "Proteomic Analysis Reveals a Critical Role of the Glycosyl Hydrolase 17 Protein in Panax ginseng Leaves under Salt Stress" International Journal of Molecular Sciences 24, no. 4: 3693. https://doi.org/10.3390/ijms24043693
APA StyleJung, J.-Y., Min, C. W., Jang, J. W., Gupta, R., Kim, J.-H., Kim, Y.-H., Cho, S. W., Song, Y. H., Jo, I.-H., Rakwal, R., Kim, Y.-J., & Kim, S. T. (2023). Proteomic Analysis Reveals a Critical Role of the Glycosyl Hydrolase 17 Protein in Panax ginseng Leaves under Salt Stress. International Journal of Molecular Sciences, 24(4), 3693. https://doi.org/10.3390/ijms24043693