

Secondary Degeneration of Oligodendrocyte Precursor Cells Occurs as Early as 24 h after Optic Nerve Injury in Rats

 , and
, and 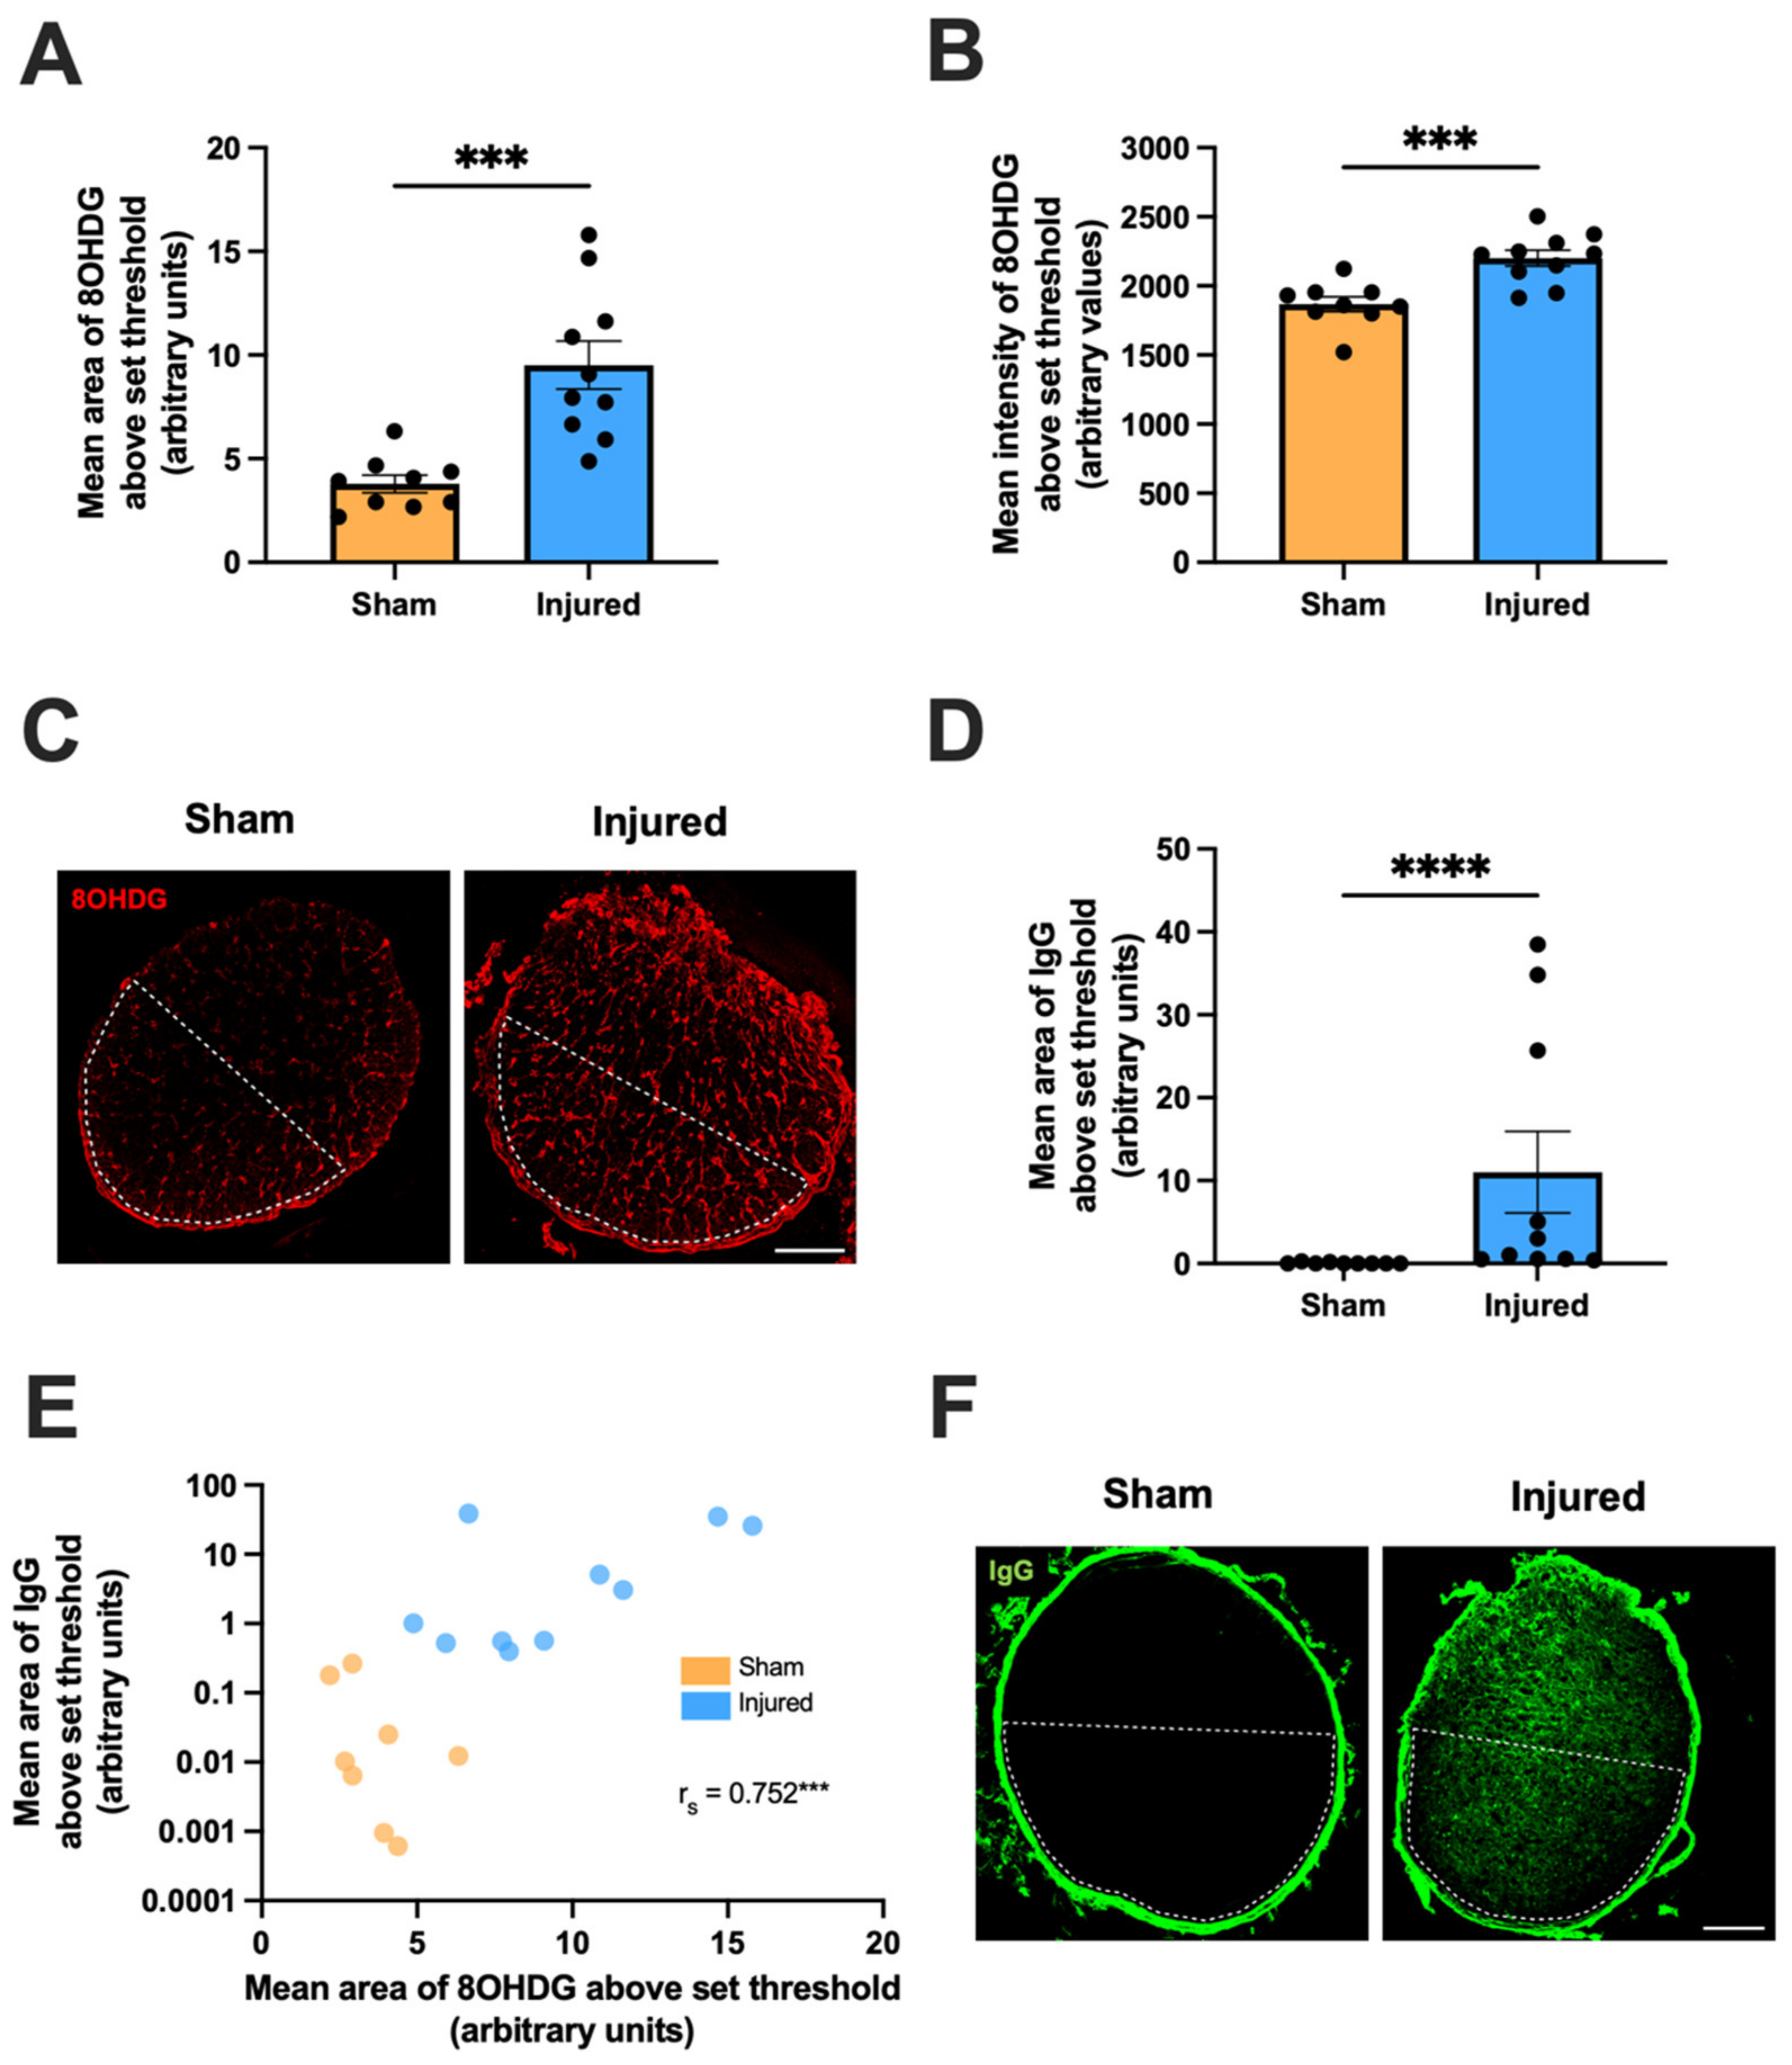
Abstract
1. Introduction
2. Results
2.1. Secondary Degeneration in the Ventral Optic Nerve following Partial Injury
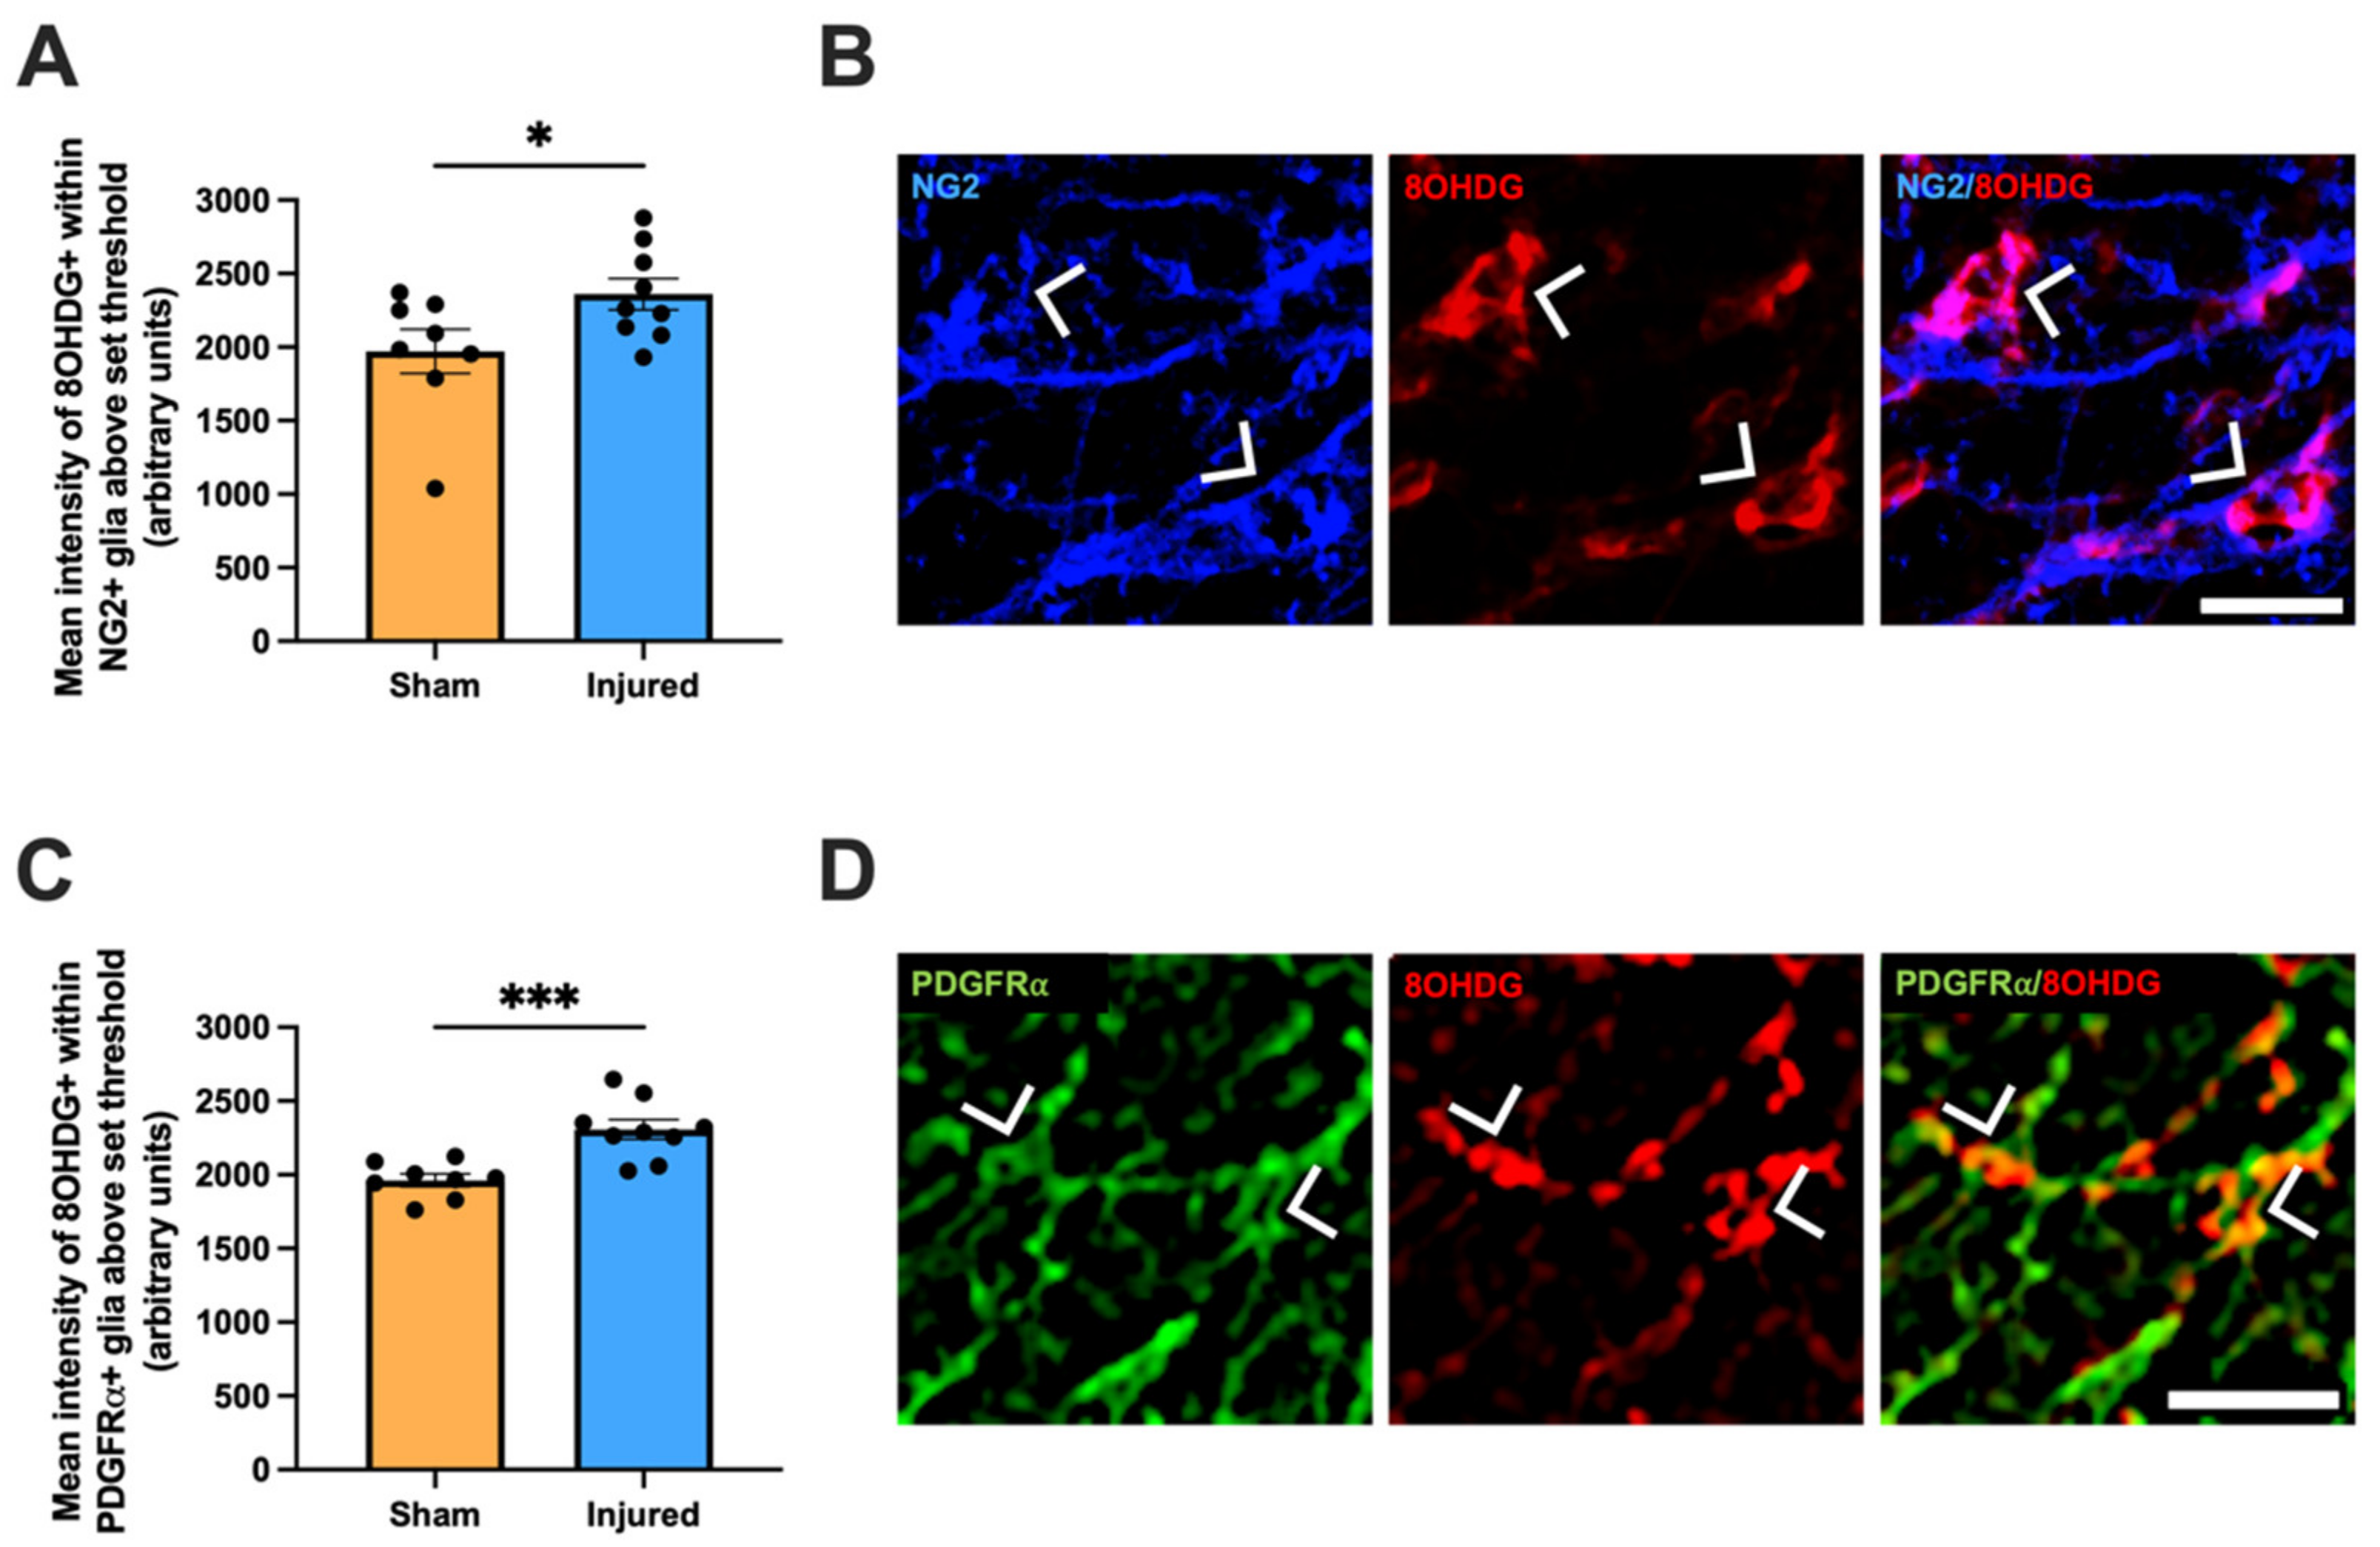
2.2. Heightened Vulnerability of OPCs to Oxidative DNA Damage
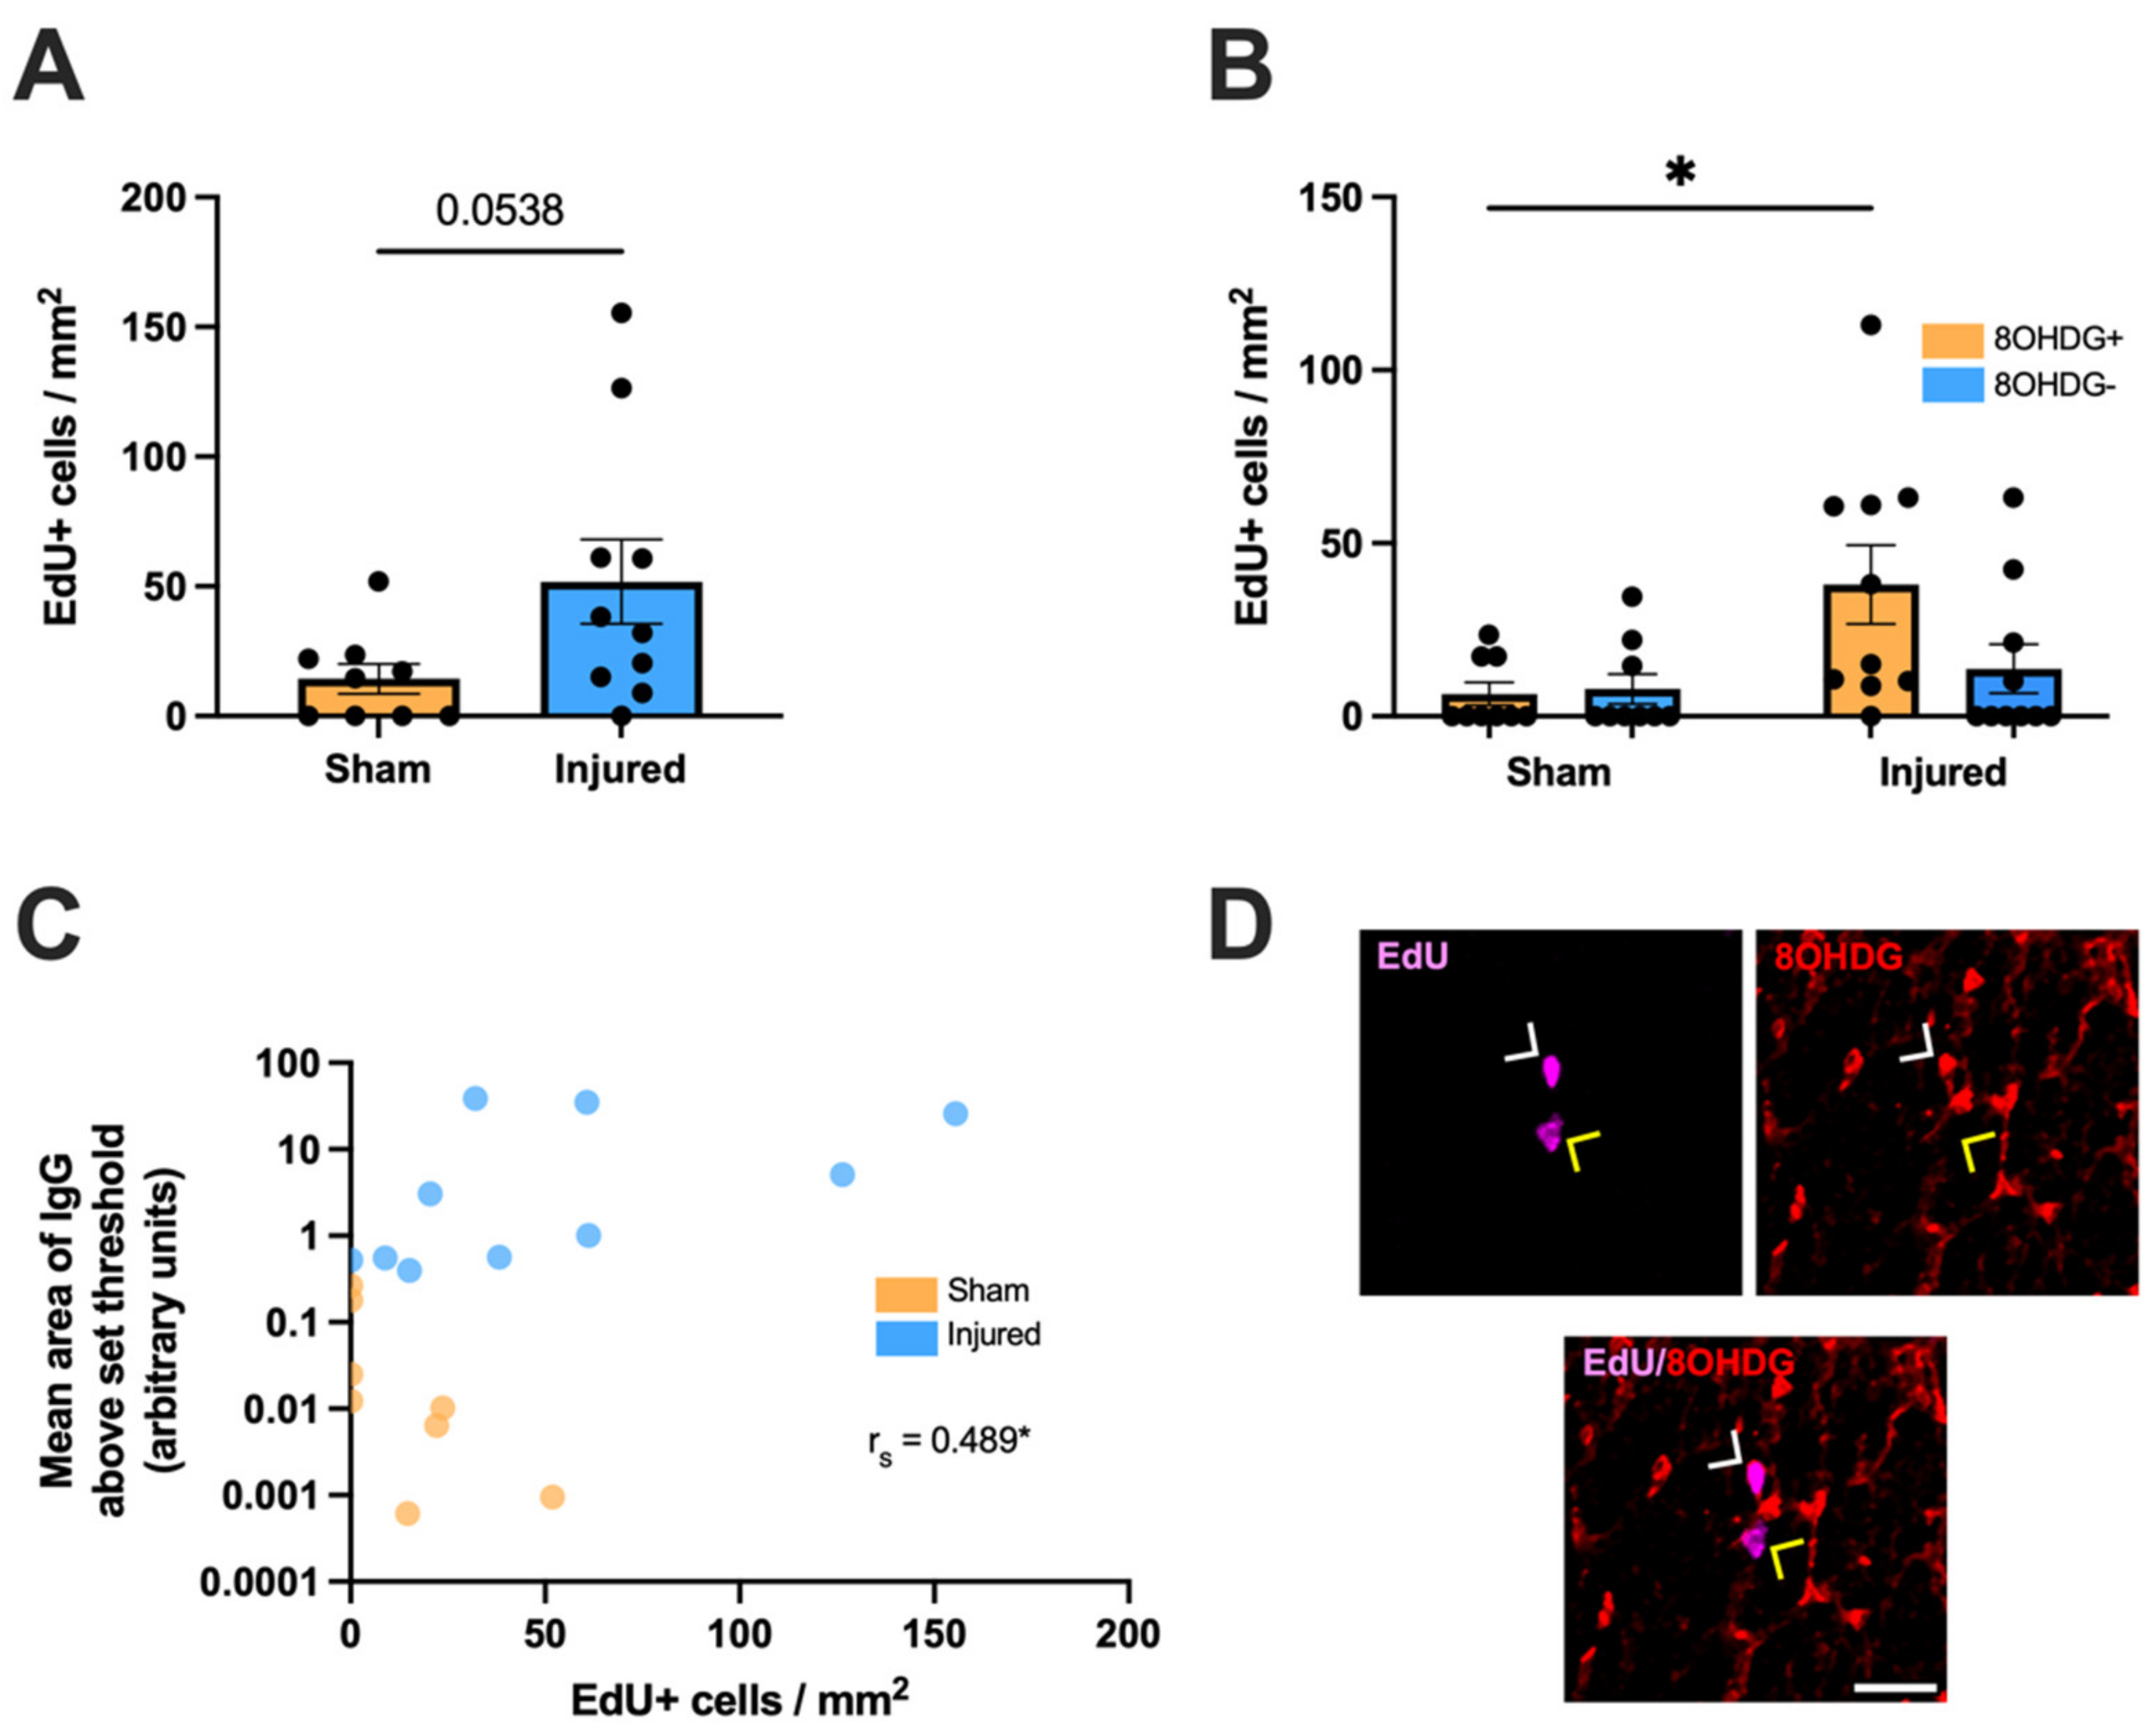
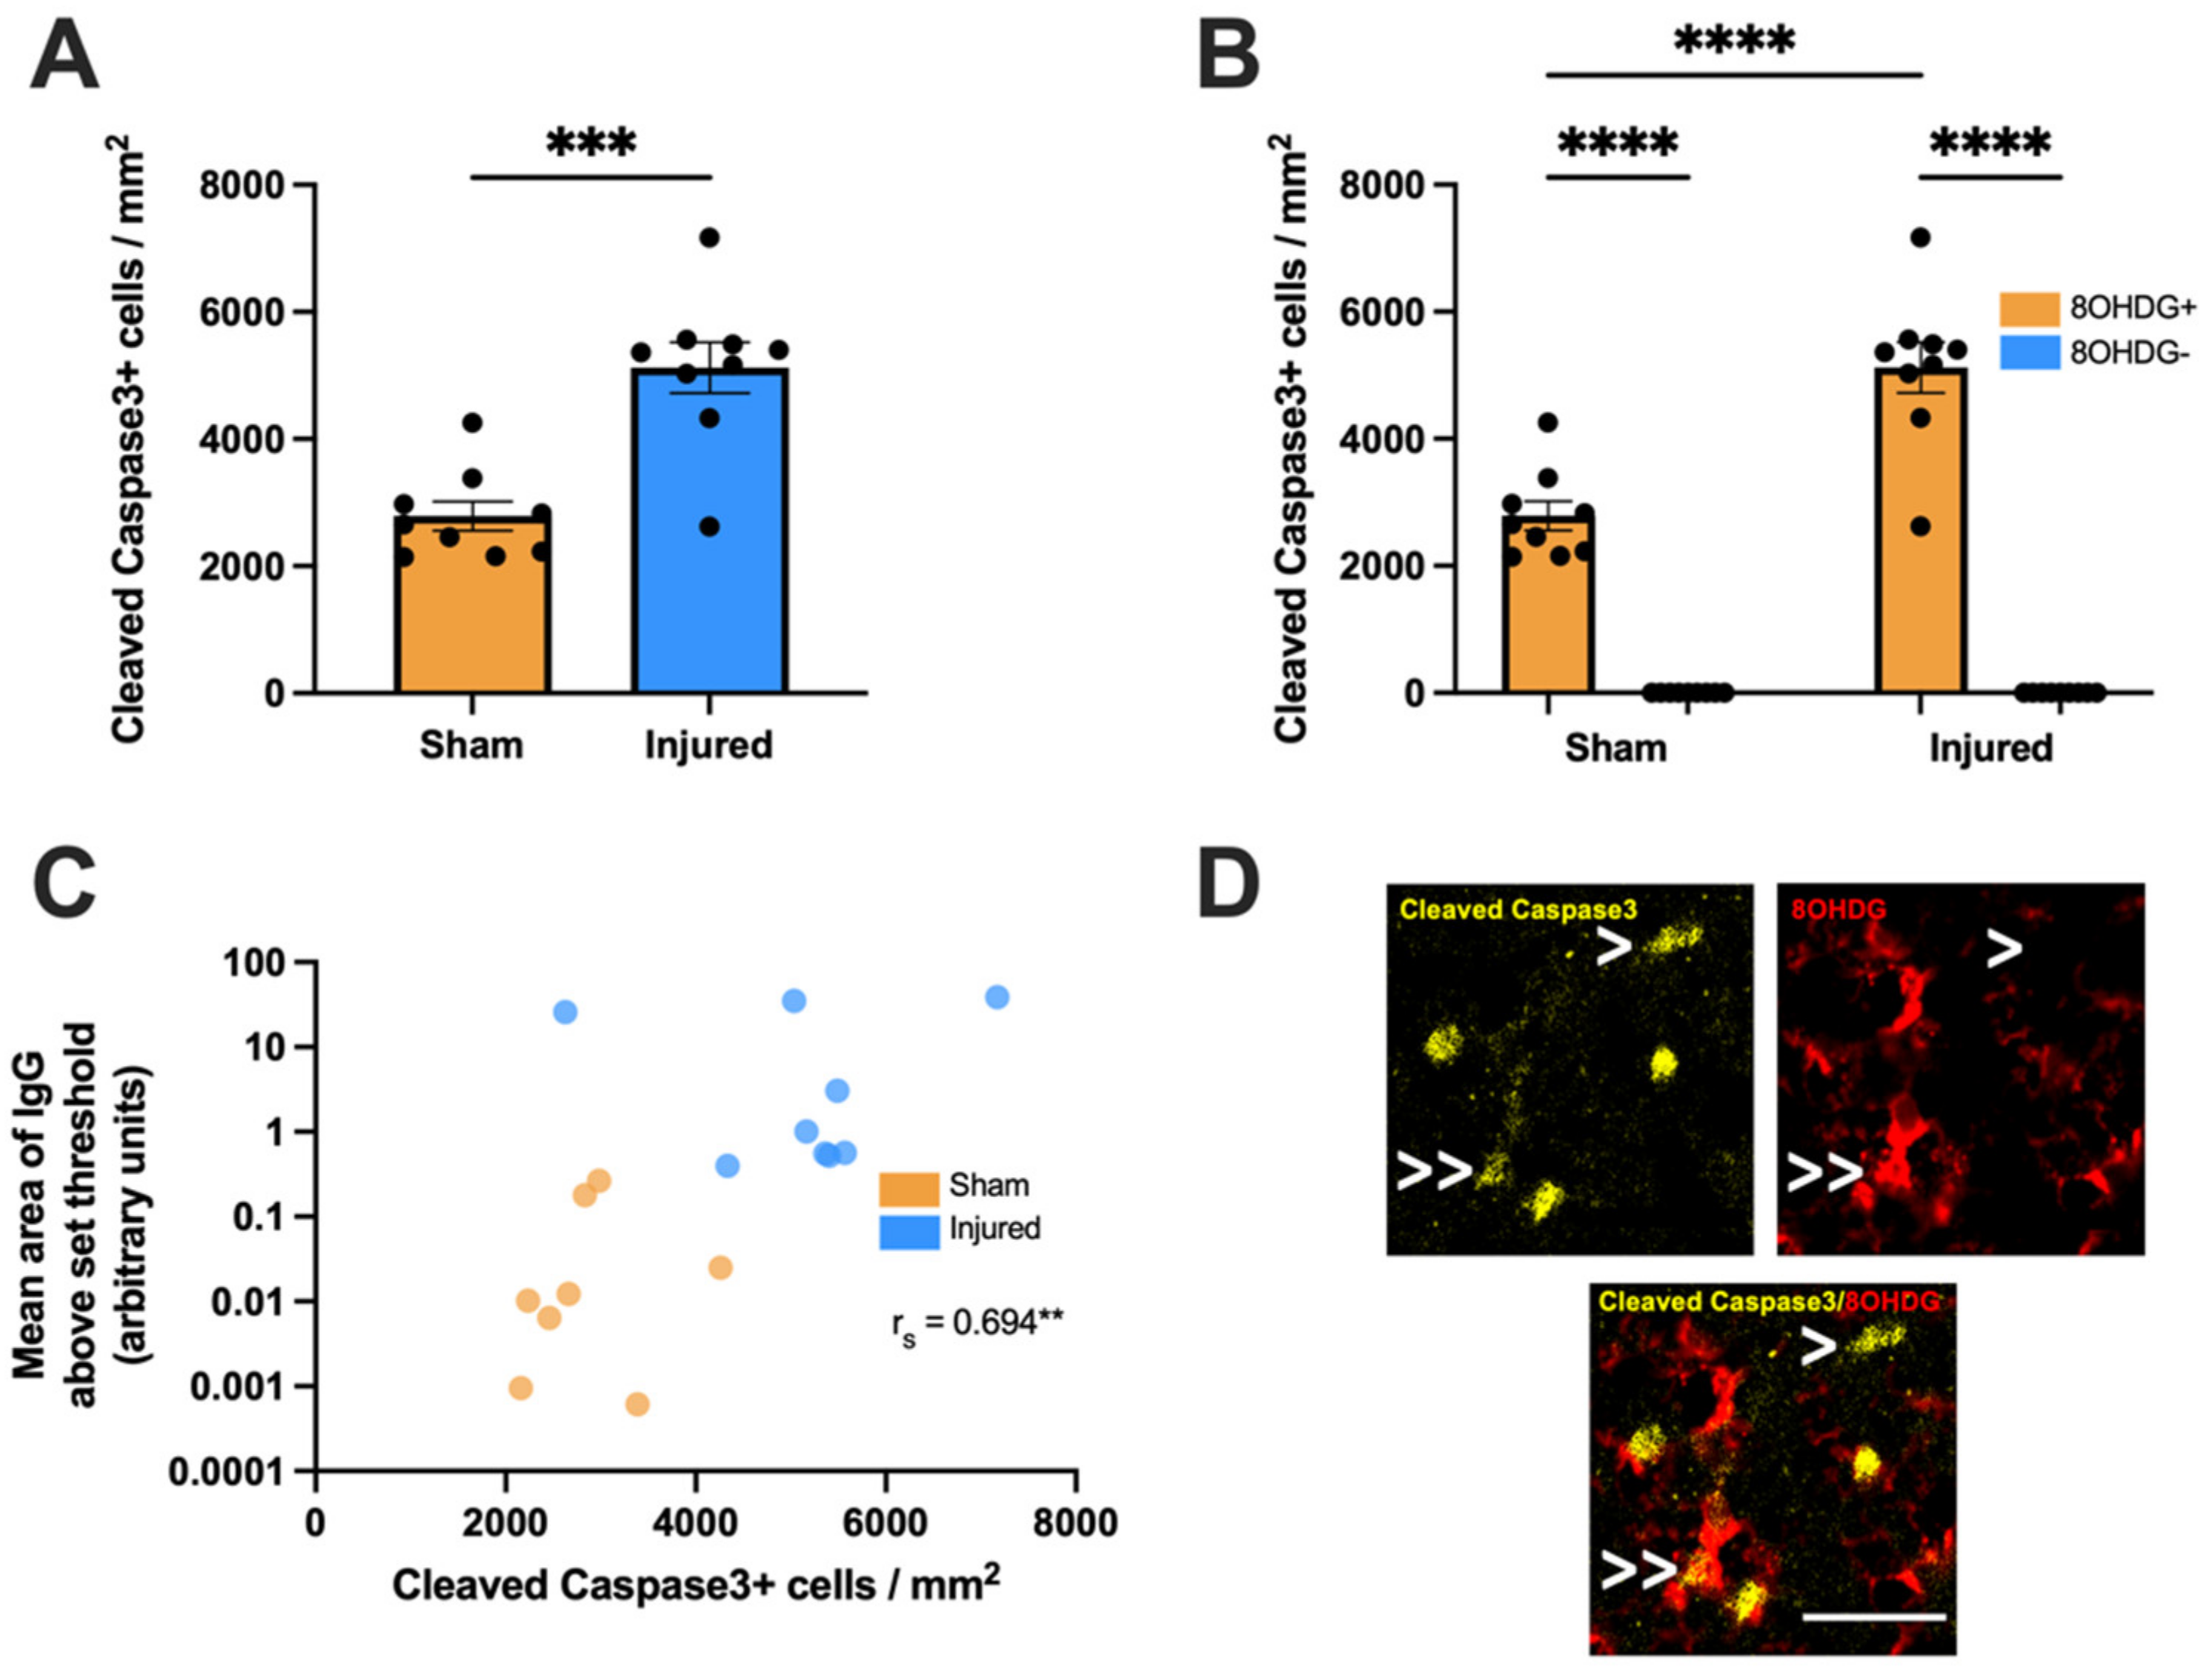
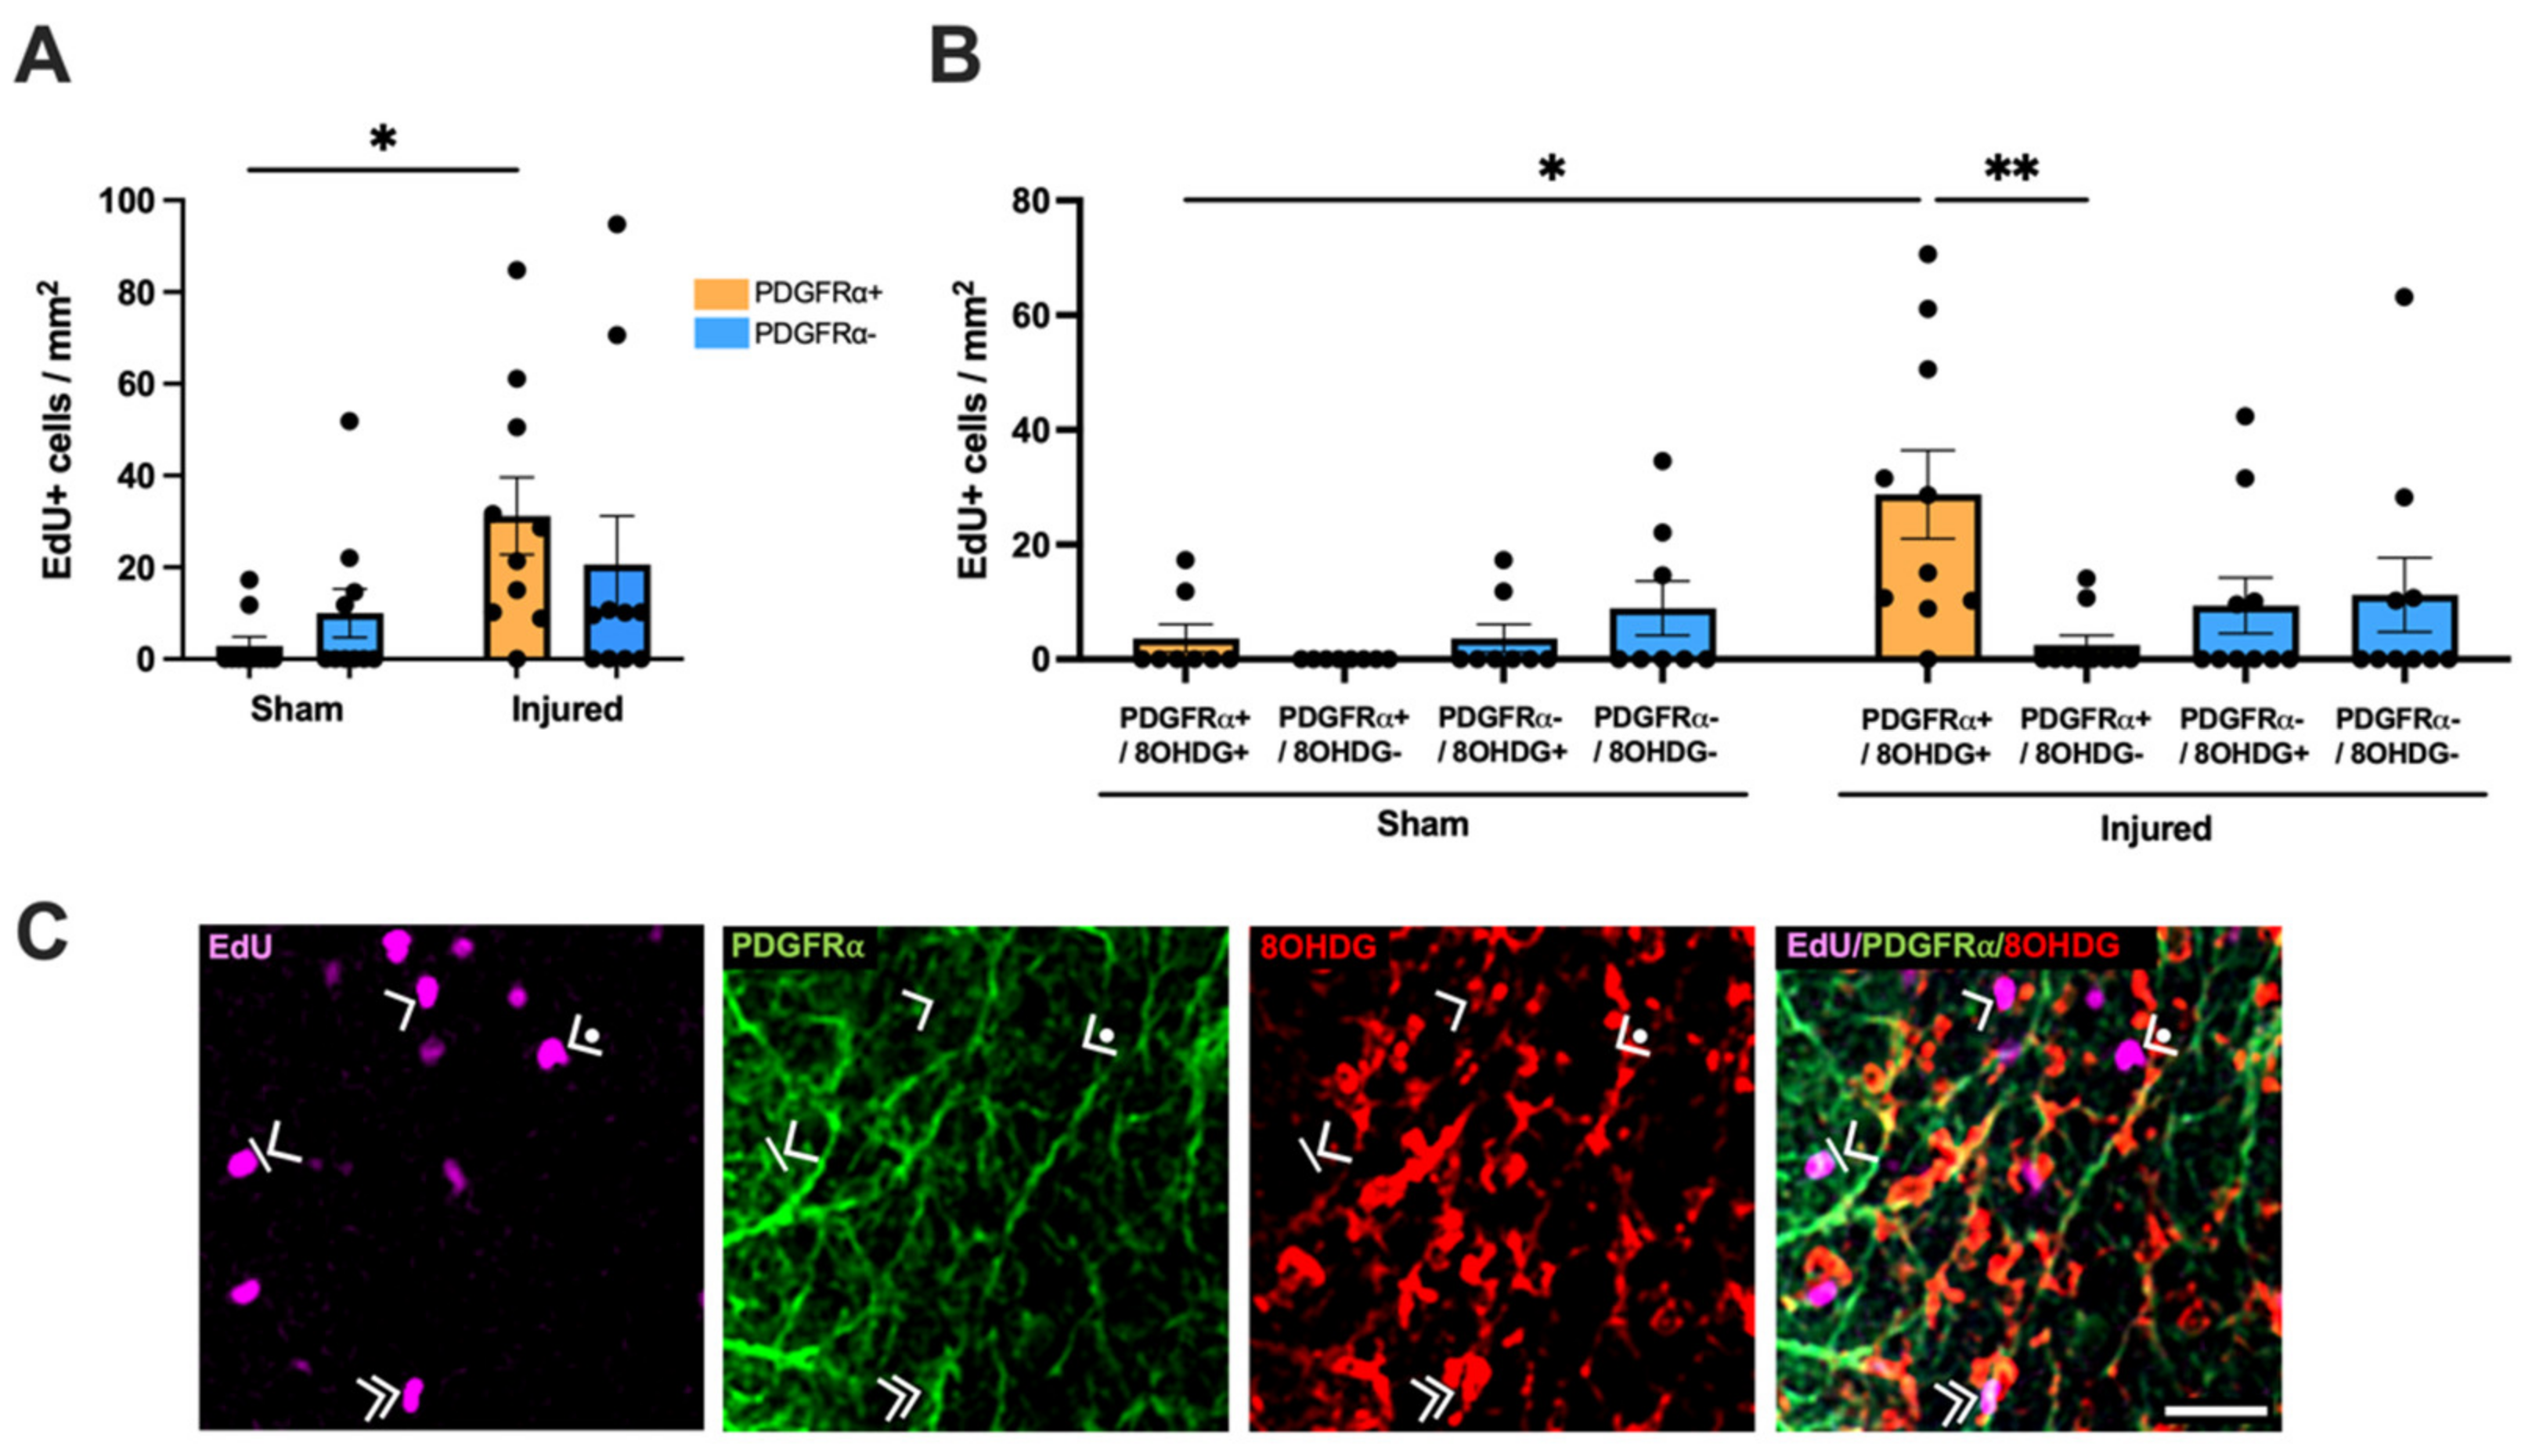
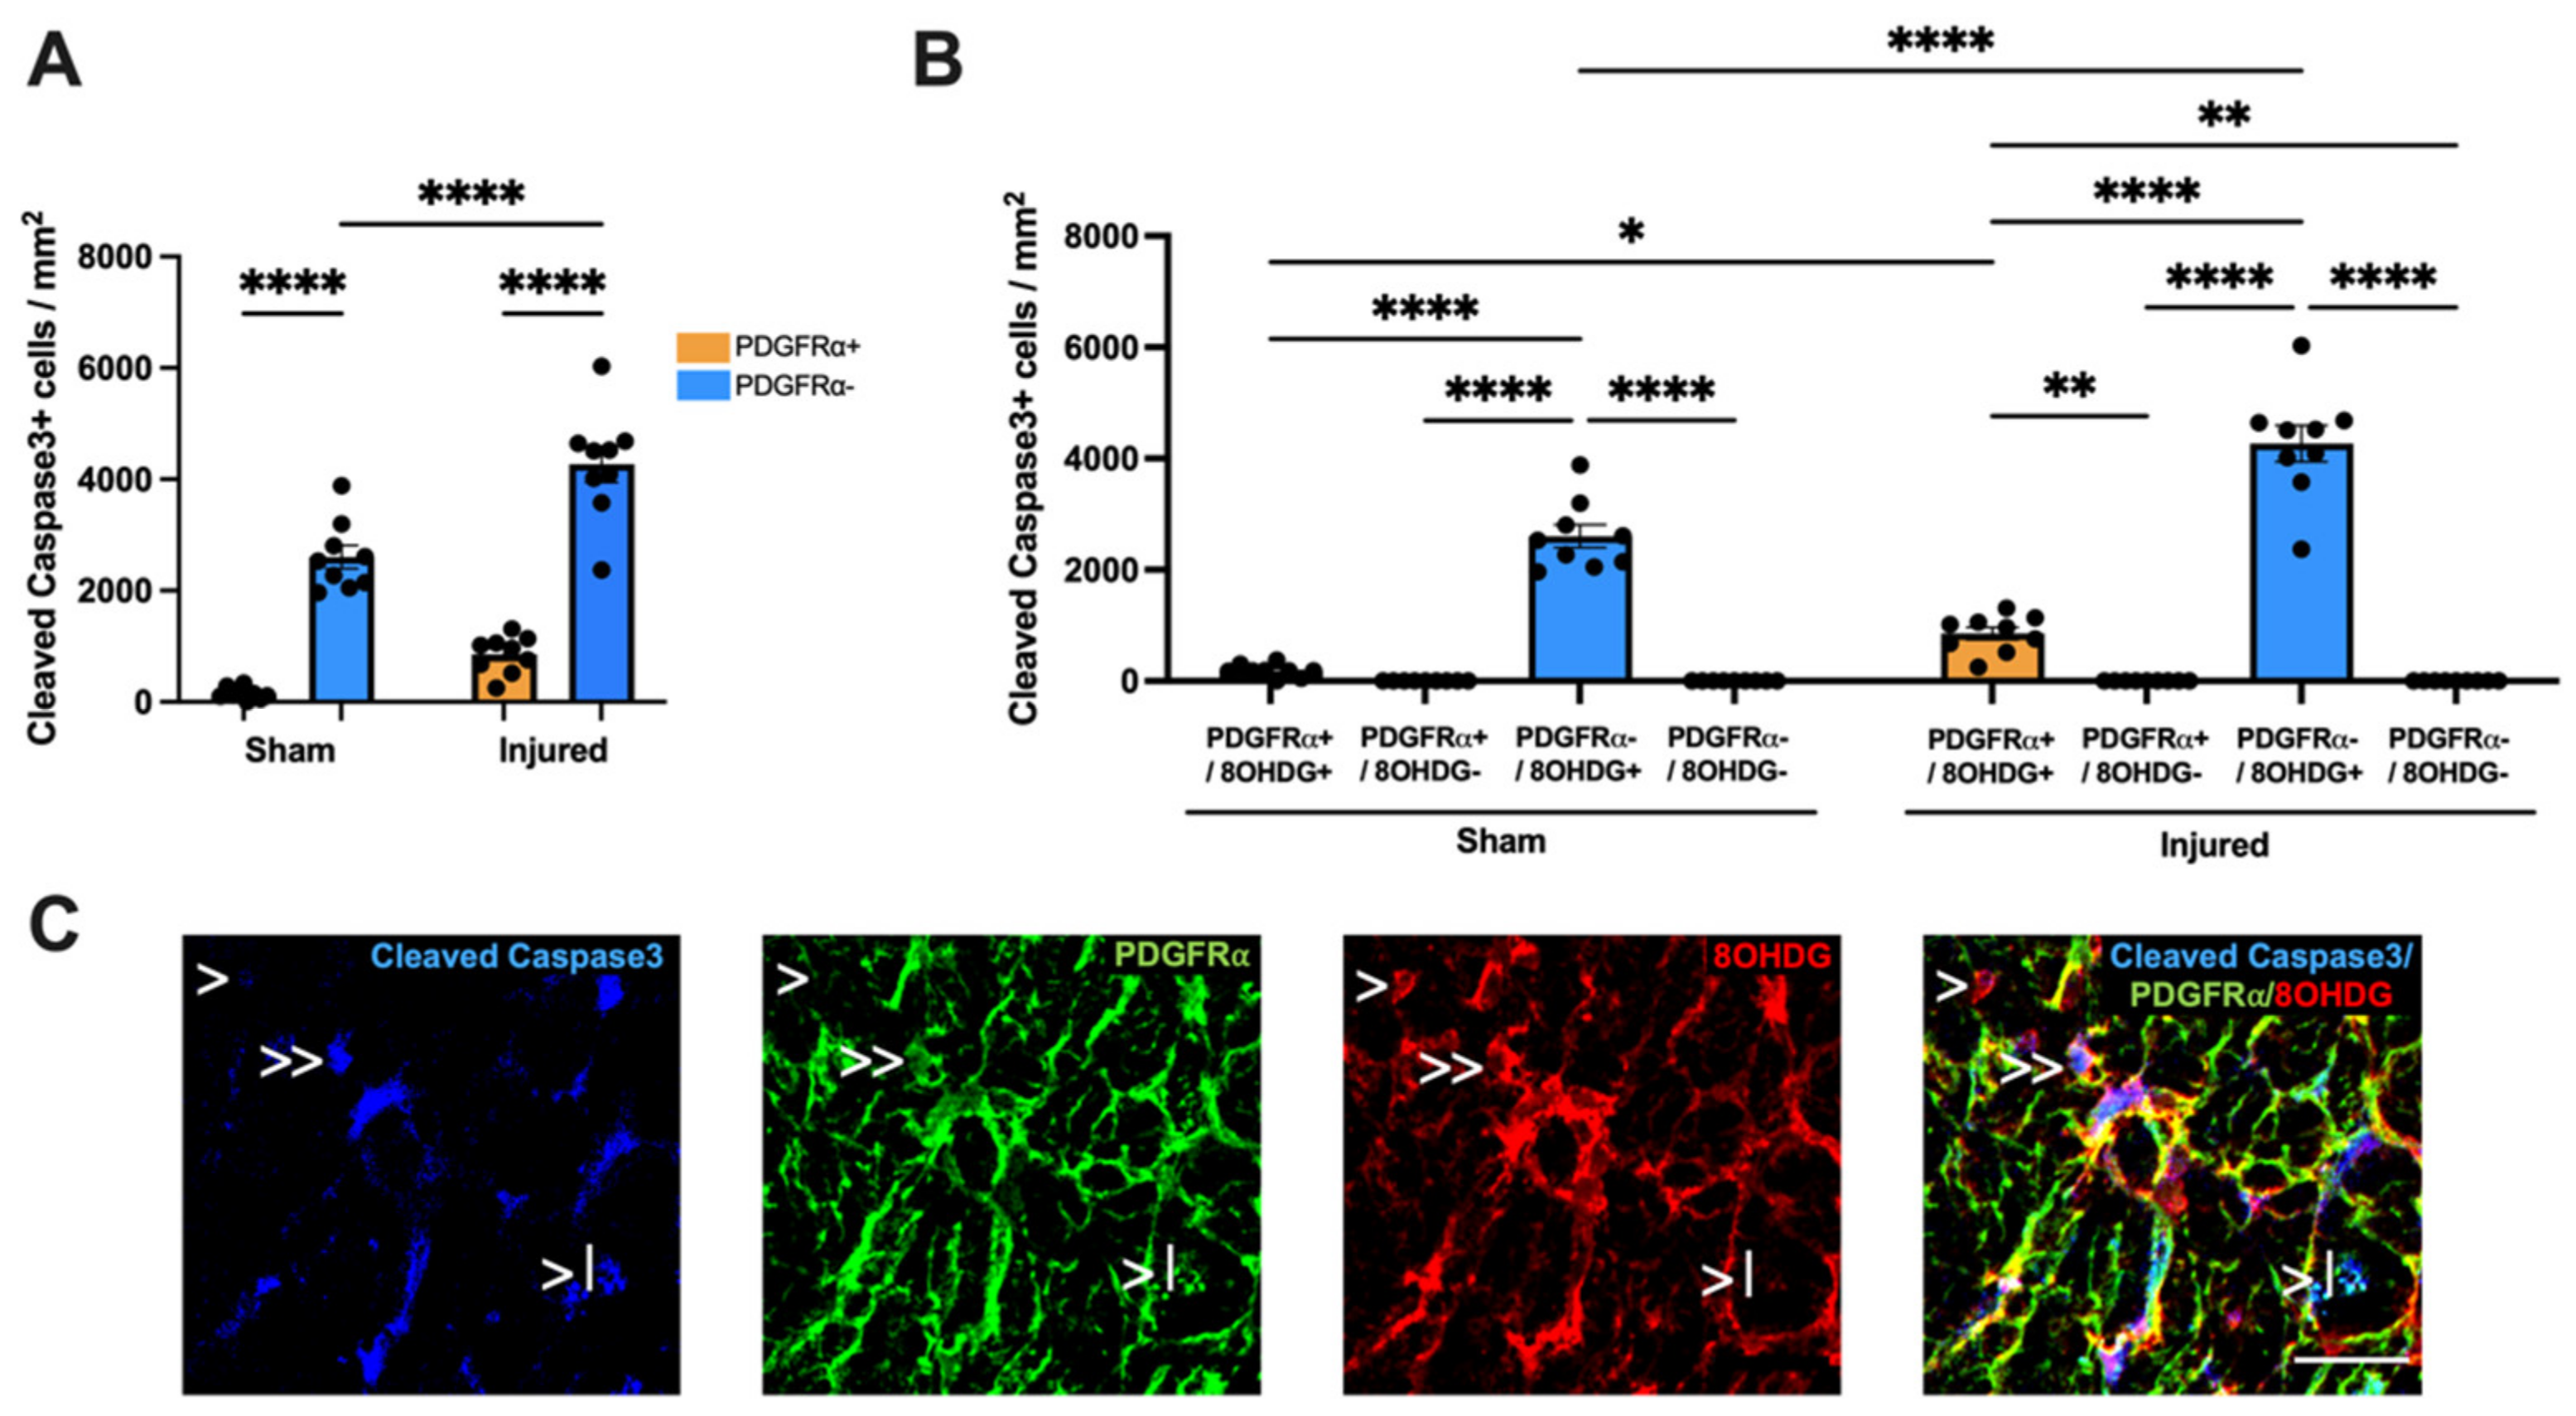
2.3. Proliferative and Apoptotic Status of OPCs with Oxidative DNA Damage
3. Discussion
4. Materials and Methods
4.1. Animal Procedures and Study Design
4.2. Surgical Procedures
4.3. Tissue Processing
4.4. Multiplex Immunohistochemistry
4.5. Imaging and Analysis
4.6. Statistics
Author Contributions
Funding
Institutional Review Board Statement
Data Availability Statement
Conflicts of Interest
References
- Werner, C.; Engelhard, K. Pathophysiology of Traumatic Brain Injury. Br. J. Anaesth. 2007, 99, 4–9. [Google Scholar] [CrossRef] [PubMed]
- Kaur, P.; Sharma, S. Recent Advances in Pathophysiology of Traumatic Brain Injury. Curr. Neuropharmacol. 2018, 16, 1224–1238. [Google Scholar] [CrossRef] [PubMed]
- Li, H.-Y.; Ruan, Y.-W.; Ren, C.-R.; Cui, Q.; So, K.-F. Mechanisms of Secondary Degeneration after Partial Optic Nerve Transection. Neural Regen. Res. 2014, 9, 565–574. [Google Scholar] [CrossRef] [PubMed]
- Tezel, G. Multifactorial Pathogenic Processes of Retinal Ganglion Cell Degeneration in Glaucoma towards Multi-Target Strategies for Broader Treatment Effects. Cells 2021, 10, 1372. [Google Scholar] [CrossRef] [PubMed]
- Chidlow, G.; Wood, J.P.M.; Casson, R.J. Investigations into Hypoxia and Oxidative Stress at the Optic Nerve Head in a Rat Model of Glaucoma. Front. Neurosci. 2017, 11, 478. [Google Scholar] [CrossRef]
- Osborne, N.N.; Melena, J.; Chidlow, G.; Wood, J.P.M. A Hypothesis to Explain Ganglion Cell Death Caused by Vascular Insults at the Optic Nerve Head: Possible Implication for the Treatment of Glaucoma. Br. J. Ophthalmol. 2001, 85, 1252–1259. [Google Scholar] [CrossRef]
- Cash, A.; Theus, M.H. Mechanisms of Blood-Brain Barrier Dysfunction in Traumatic Brain Injury. Int. J. Mol. Sci. 2020, 21, 3344. [Google Scholar] [CrossRef]
- Bartlett, C.; Fitzgerald, M. Partial Transection of Adult Rat Optic Nerve as a Model of Secondary Degeneration in the Central Nervous System. Bio-Protocol. 2018, 8, e3118. [Google Scholar] [CrossRef]
- Warnock, A.; Toomey, L.M.; Wright, A.J.; Fisher, K.; Won, Y.; Anyaegbu, C.; Fitzgerald, M. Damage Mechanisms to Oligodendrocytes and White Matter in Central Nervous System Injury: The Australian Context. J. Neurotrauma 2020, 37, 739–769. [Google Scholar] [CrossRef]
- Smith, N.M.; Gachulincova, I.; Ho, D.; Bailey, C.; Bartlett, C.A.; Norret, M.; Murphy, J.; Buckley, A.; Rigby, P.J.; House, M.J.; et al. An Unexpected Transient Breakdown of the Blood Brain Barrier Triggers Passage of Large Intravenously Administered Nanoparticles. Sci. Rep. 2016, 6, 22595. [Google Scholar] [CrossRef]
- Smith, N.M.; Giacci, M.K.; Gough, A.; Bailey, C.; McGonigle, T.; Black, A.M.; Clarke, T.O.; Bartlett, C.A.; Swaminathan Iyer, K.; Dunlop, S.A.; et al. Inflammation and Blood-Brain Barrier Breach Remote from the Primary Injury Following Neurotrauma. J. Neuroinflammation 2018, 15, 201. [Google Scholar] [CrossRef]
- Cornelius, C.; Crupi, R.; Calabrese, V.; Graziano, A.; Milone, P.; Pennisi, G.; Radak, Z.; Calabrese, E.J.; Cuzzocrea, S. Traumatic Brain Injury: Oxidative Stress and Neuroprotection. Antioxid. Redox Signal. 2013, 19, 836–853. [Google Scholar] [CrossRef]
- Ischiropoulos, H.; Beckman, J.S. Oxidative Stress and Nitration in Neurodegeneration: Cause, Effect, or Association? J. Clin. Investig. 2003, 111, 163–169. [Google Scholar] [CrossRef]
- Laval, J.; Jurado, J.; Saparbaev, M.; Sidorkina, O. Antimutagenic Role of Base-Excision Repair Enzymes upon Free Radical-Induced DNA Damage. Mutat. Res. 1998, 402, 93–102. [Google Scholar] [CrossRef]
- Fitzgerald, M.; Bartlett, C.A.; Harvey, A.R.; Dunlop, S.A. Early Events of Secondary Degeneration after Partial Optic Nerve Transection: An Immunohistochemical Study. J. Neurotrauma 2010, 27, 439–452. [Google Scholar] [CrossRef]
- Giacci, M.K.; Bartlett, C.A.; Smith, N.M.; Iyer, K.S.; Toomey, L.M.; Jiang, H.; Guagliardo, P.; Kilburn, M.R.; Fitzgerald, M. Oligodendroglia Are Particularly Vulnerable to Oxidative Damage after Neurotrauma In Vivo. J. Neurosci. 2018, 38, 6491–6504. [Google Scholar] [CrossRef]
- Matute, C.; Torre, I.; Pérez-Cerdá, F.; Pérez-Samartín, A.; Alberdi, E.; Etxebarria, E.; Arranz, A.M.; Ravid, R.; Rodríguez-Antigüedad, A.; Sánchez-Gómez, M.V.; et al. P2X7 Receptor Blockade Prevents ATP Excitotoxicity in Oligodendrocytes and Ameliorates Experimental Autoimmune Encephalomyelitis. J. Neurosci. 2007, 27, 9525–9533. [Google Scholar] [CrossRef]
- Borges, K.; Ohlemeyer, C.; Trotter, J.; Kettenmann, H. AMPA/Kainate Receptor Activation in Murine Oligodendrocyte Precursor Cells Leads to Activation of a Cation Conductance, Calcium Influx and Blockade of Delayed Rectifying K+ Channels. Neuroscience 1994, 63, 135–149. [Google Scholar] [CrossRef]
- Thorburne, S.K.; Juurlink, B.H. Low Glutathione and High Iron Govern the Susceptibility of Oligodendroglial Precursors to Oxidative Stress. J. Neurochem. 1996, 67, 1014–1022. [Google Scholar] [CrossRef]
- Butts, B.D.; Houde, C.; Mehmet, H. Maturation-Dependent Sensitivity of Oligodendrocyte Lineage Cells to Apoptosis: Implications for Normal Development and Disease. Cell Death Differ. 2008, 15, 1178–1186. [Google Scholar] [CrossRef]
- Fitzgerald, M.; Bartlett, C.A.; Evill, L.; Rodger, J.; Harvey, A.R.; Dunlop, S.A. Secondary Degeneration of the Optic Nerve Following Partial Transection: The Benefits of Lomerizine. Exp. Neurol. 2009, 216, 219–230. [Google Scholar] [CrossRef] [PubMed]
- Payne, S.C.; Bartlett, C.A.; Harvey, A.R.; Dunlop, S.A.; Fitzgerald, M. Chronic Swelling and Abnormal Myelination during Secondary Degeneration after Partial Injury to a Central Nervous System Tract. J. Neurotrauma 2011, 28, 1077–1088. [Google Scholar] [CrossRef] [PubMed]
- Payne, S.C.; Bartlett, C.A.; Harvey, A.R.; Dunlop, S.A.; Fitzgerald, M. Myelin Sheath Decompaction, Axon Swelling, and Functional Loss during Chronic Secondary Degeneration in Rat Optic Nerve. Investig. Ophthalmol. Vis. Sci. 2012, 53, 6093–6101. [Google Scholar] [CrossRef]
- Nicholson, D.W.; Ali, A.; Thornberry, N.A.; Vaillancourt, J.P.; Ding, C.K.; Gallant, M.; Gareau, Y.; Griffin, P.R.; Labelle, M.; Lazebnik, Y.A.; et al. Identification and Inhibition of the ICE/CED-3 Protease Necessary for Mammalian Apoptosis. Nature 1995, 376, 37–43. [Google Scholar] [CrossRef]
- Akay, L.A.; Effenberger, A.H.; Tsai, L.H. Cell of All Trades: Oligodendrocyte Precursor Cells in Synaptic, Vascular, and Immune Function. Genes Dev. 2021, 35, 180–198. [Google Scholar] [CrossRef] [PubMed]
- Bergles, D.E.; Richardson, W.D. Oligodendrocyte Development and Plasticity. Cold Spring Harb. Perspect. Biol. 2016, 8, a020453. [Google Scholar] [CrossRef]
- O’Hare Doig, R.L.; Bartlett, C.A.; Maghzal, G.J.; Lam, M.; Archer, M.; Stocker, R.; Fitzgerald, M. Reactive Species and Oxidative Stress in Optic Nerve Vulnerable to Secondary Degeneration. Exp. Neurol. 2014, 261, 136–146. [Google Scholar] [CrossRef]
- Grammas, P.; Martinez, J.; Miller, B. Cerebral Microvascular Endothelium and the Pathogenesis of Neurodegenerative Diseases. Expert Rev. Mol. Med. 2011, 13, e19. [Google Scholar] [CrossRef]
- Salman, M.M.; Kitchen, P.; Halsey, A.; Wang, M.X.; Törnroth-Horsefield, S.; Conner, A.C.; Badaut, J.; Iliff, J.J.; Bill, R.M. Emerging Roles for Dynamic Aquaporin-4 Subcellular Relocalization in CNS Water Homeostasis. Brain 2022, 145, 64–75. [Google Scholar] [CrossRef]
- Nishiyama, A.; Lin, X.H.; Giese, N.; Heldin, C.H.; Stallcup, W.B. Co-Localization of NG2 Proteoglycan and PDGF α-Receptor on O2A Progenitor Cells in the Developing Rat Brain. J. Neurosci. Res. 1996, 43, 299–314. [Google Scholar] [CrossRef]
- Jakovcevski, I.; Filipovic, R.; Mo, Z.; Rakic, S.; Zecevic, N. Oligodendrocyte Development and the Onset of Myelination in the Human Fetal Brain. Front. Neuroanat. 2009, 3, 5. [Google Scholar] [CrossRef]
- Li, P.; Li, H.X.; Jiang, H.Y.; Zhu, L.; Wu, H.Y.; Li, J.T.; Lai, J.H. Expression of NG2 and Platelet-Derived Growth Factor Receptor Alpha in the Developing Neonatal Rat Brain. Neural Regen. Res. 2017, 12, 1843. [Google Scholar] [CrossRef]
- Payne, S.C.; Bartlett, C.A.; Savigni, D.L.; Harvey, A.R.; Dunlop, S.A.; Fitzgerald, M. Early Proliferation Does Not Prevent the Loss of Oligodendrocyte Progenitor Cells during the Chronic Phase of Secondary Degeneration in a CNS White Matter Tract. PLoS ONE 2013, 8, 65710–65720. [Google Scholar] [CrossRef]
- Karve, I.P.; Taylor, J.M.; Crack, P.J. The Contribution of Astrocytes and Microglia to Traumatic Brain Injury. Br. J. Pharmacol. 2016, 173, 692–702. [Google Scholar] [CrossRef]
- Loane, D.J.; Byrnes, K.R. Role of Microglia in Neurotrauma. Neurotherapeutics 2010, 7, 366–377. [Google Scholar] [CrossRef]
- Beiter, R.M.; Rivet-Noor, C.; Merchak, A.R.; Bai, R.; Johanson, D.M.; Slogar, E.; Sol-Church, K.; Overall, C.C.; Gaultier, A. Evidence for Oligodendrocyte Progenitor Cell Heterogeneity in the Adult Mouse Brain. Sci. Rep. 2022, 12, 12921. [Google Scholar] [CrossRef]
- Maki, T. Novel Roles of Oligodendrocyte Precursor Cells in the Developing and Damaged Brain. Clin. Exp. Neuroimmunol. 2017, 8, 33–42. [Google Scholar] [CrossRef]
- Maki, T.; Maeda, M.; Uemura, M.; Lo, E.K.; Terasaki, Y.; Liang, A.C.; Shindo, A.; Choi, Y.K.; Taguchi, A.; Matsuyama, T.; et al. Potential Interactions between Pericytes and Oligodendrocyte Precursor Cells in Perivascular Regions of Cerebral White Matter. Neurosci. Lett. 2015, 597, 164–169. [Google Scholar] [CrossRef]
- Seo, J.H.; Miyamoto, N.; Hayakawa, K.; Pham, L.D.D.; Maki, T.; Ayata, C.; Kim, K.W.; Lo, E.H.; Arai, K. Oligodendrocyte Precursors Induce Early Blood-Brain Barrier Opening after White Matter Injury. J. Clin. Investig. 2013, 123, 782–786. [Google Scholar] [CrossRef]
- Girolamo, F.; Errede, M.; Longo, G.; Annese, T.; Alias, C.; Ferrara, G.; Morando, S.; Trojano, M.; De Rosbo, N.K.; Uccelli, A.; et al. Defining the Role of NG2-Expressing Cells in Experimental Models of Multiple Sclerosis. A Biofunctional Analysis of the Neurovascular Unit in Wild Type and NG2 Null Mice. PLoS ONE 2019, 14, e0213508. [Google Scholar] [CrossRef]
- Niu, J.; Tsai, H.H.; Hoi, K.K.; Huang, N.; Yu, G.; Kim, K.; Baranzini, S.E.; Xiao, L.; Chan, J.R.; Fancy, S.P.J. Aberrant Oligodendroglial–Vascular Interactions Disrupt the Blood–Brain Barrier, Triggering CNS Inflammation. Nat. Neurosci. 2019, 22, 709–718. [Google Scholar] [CrossRef] [PubMed]
- Kitchen, P.; Salman, M.M.; Halsey, A.M.; Clarke-Bland, C.; MacDonald, J.A.; Ishida, H.; Vogel, H.J.; Almutiri, S.; Logan, A.; Kreida, S.; et al. Targeting Aquaporin-4 Subcellular Localization to Treat Central Nervous System Edema. Cell 2020, 181, 784–799.e19. [Google Scholar] [CrossRef] [PubMed]
- Aldewachi, H.; Al-Zidan, R.N.; Conner, M.T.; Salman, M.M. High-Throughput Screening Platforms in the Discovery of Novel Drugs for Neurodegenerative Diseases. Bioengineering 2021, 8, 30. [Google Scholar] [CrossRef] [PubMed]
- Papaspyropoulos, A.; Tsolaki, M.; Foroglou, N.; Pantazaki, A.A. Modeling and Targeting Alzheimer’s Disease With Organoids. Front. Pharmacol. 2020, 11, 396. [Google Scholar] [CrossRef]
- Salman, M.M.; Marsh, G.; Kusters, I.; Delincé, M.; Di Caprio, G.; Upadhyayula, S.; de Nola, G.; Hunt, R.; Ohashi, K.G.; Gray, T.; et al. Design and Validation of a Human Brain Endothelial Microvessel-on-a-Chip Open Microfluidic Model Enabling Advanced Optical Imaging. Front. Bioeng. Biotechnol. 2020, 8, 1077. [Google Scholar] [CrossRef]


Disclaimer/Publisher’s Note: The statements, opinions and data contained in all publications are solely those of the individual author(s) and contributor(s) and not of MDPI and/or the editor(s). MDPI and/or the editor(s) disclaim responsibility for any injury to people or property resulting from any ideas, methods, instructions or products referred to in the content. |
© 2023 by the authors. Licensee MDPI, Basel, Switzerland. This article is an open access article distributed under the terms and conditions of the Creative Commons Attribution (CC BY) license (https://creativecommons.org/licenses/by/4.0/).
Share and Cite
Toomey, L.M.; Papini, M.G.; Clarke, T.O.; Wright, A.J.; Denham, E.; Warnock, A.; McGonigle, T.; Bartlett, C.A.; Fitzgerald, M.; Anyaegbu, C.C. Secondary Degeneration of Oligodendrocyte Precursor Cells Occurs as Early as 24 h after Optic Nerve Injury in Rats. Int. J. Mol. Sci. 2023, 24, 3463. https://doi.org/10.3390/ijms24043463
Toomey LM, Papini MG, Clarke TO, Wright AJ, Denham E, Warnock A, McGonigle T, Bartlett CA, Fitzgerald M, Anyaegbu CC. Secondary Degeneration of Oligodendrocyte Precursor Cells Occurs as Early as 24 h after Optic Nerve Injury in Rats. International Journal of Molecular Sciences. 2023; 24(4):3463. https://doi.org/10.3390/ijms24043463
Chicago/Turabian StyleToomey, Lillian M., Melissa G. Papini, Thomas O. Clarke, Alexander J. Wright, Eleanor Denham, Andrew Warnock, Terry McGonigle, Carole A. Bartlett, Melinda Fitzgerald, and Chidozie C. Anyaegbu. 2023. "Secondary Degeneration of Oligodendrocyte Precursor Cells Occurs as Early as 24 h after Optic Nerve Injury in Rats" International Journal of Molecular Sciences 24, no. 4: 3463. https://doi.org/10.3390/ijms24043463
APA StyleToomey, L. M., Papini, M. G., Clarke, T. O., Wright, A. J., Denham, E., Warnock, A., McGonigle, T., Bartlett, C. A., Fitzgerald, M., & Anyaegbu, C. C. (2023). Secondary Degeneration of Oligodendrocyte Precursor Cells Occurs as Early as 24 h after Optic Nerve Injury in Rats. International Journal of Molecular Sciences, 24(4), 3463. https://doi.org/10.3390/ijms24043463