
Chromium Nanoparticles Together with a Switch Away from High-Fat/Low-Fiber Dietary Habits Enhances the Pro-Healthy Regulation of Liver Lipid Metabolism and Inflammation in Obese Rats

 , , , and
Abstract
1. Introduction
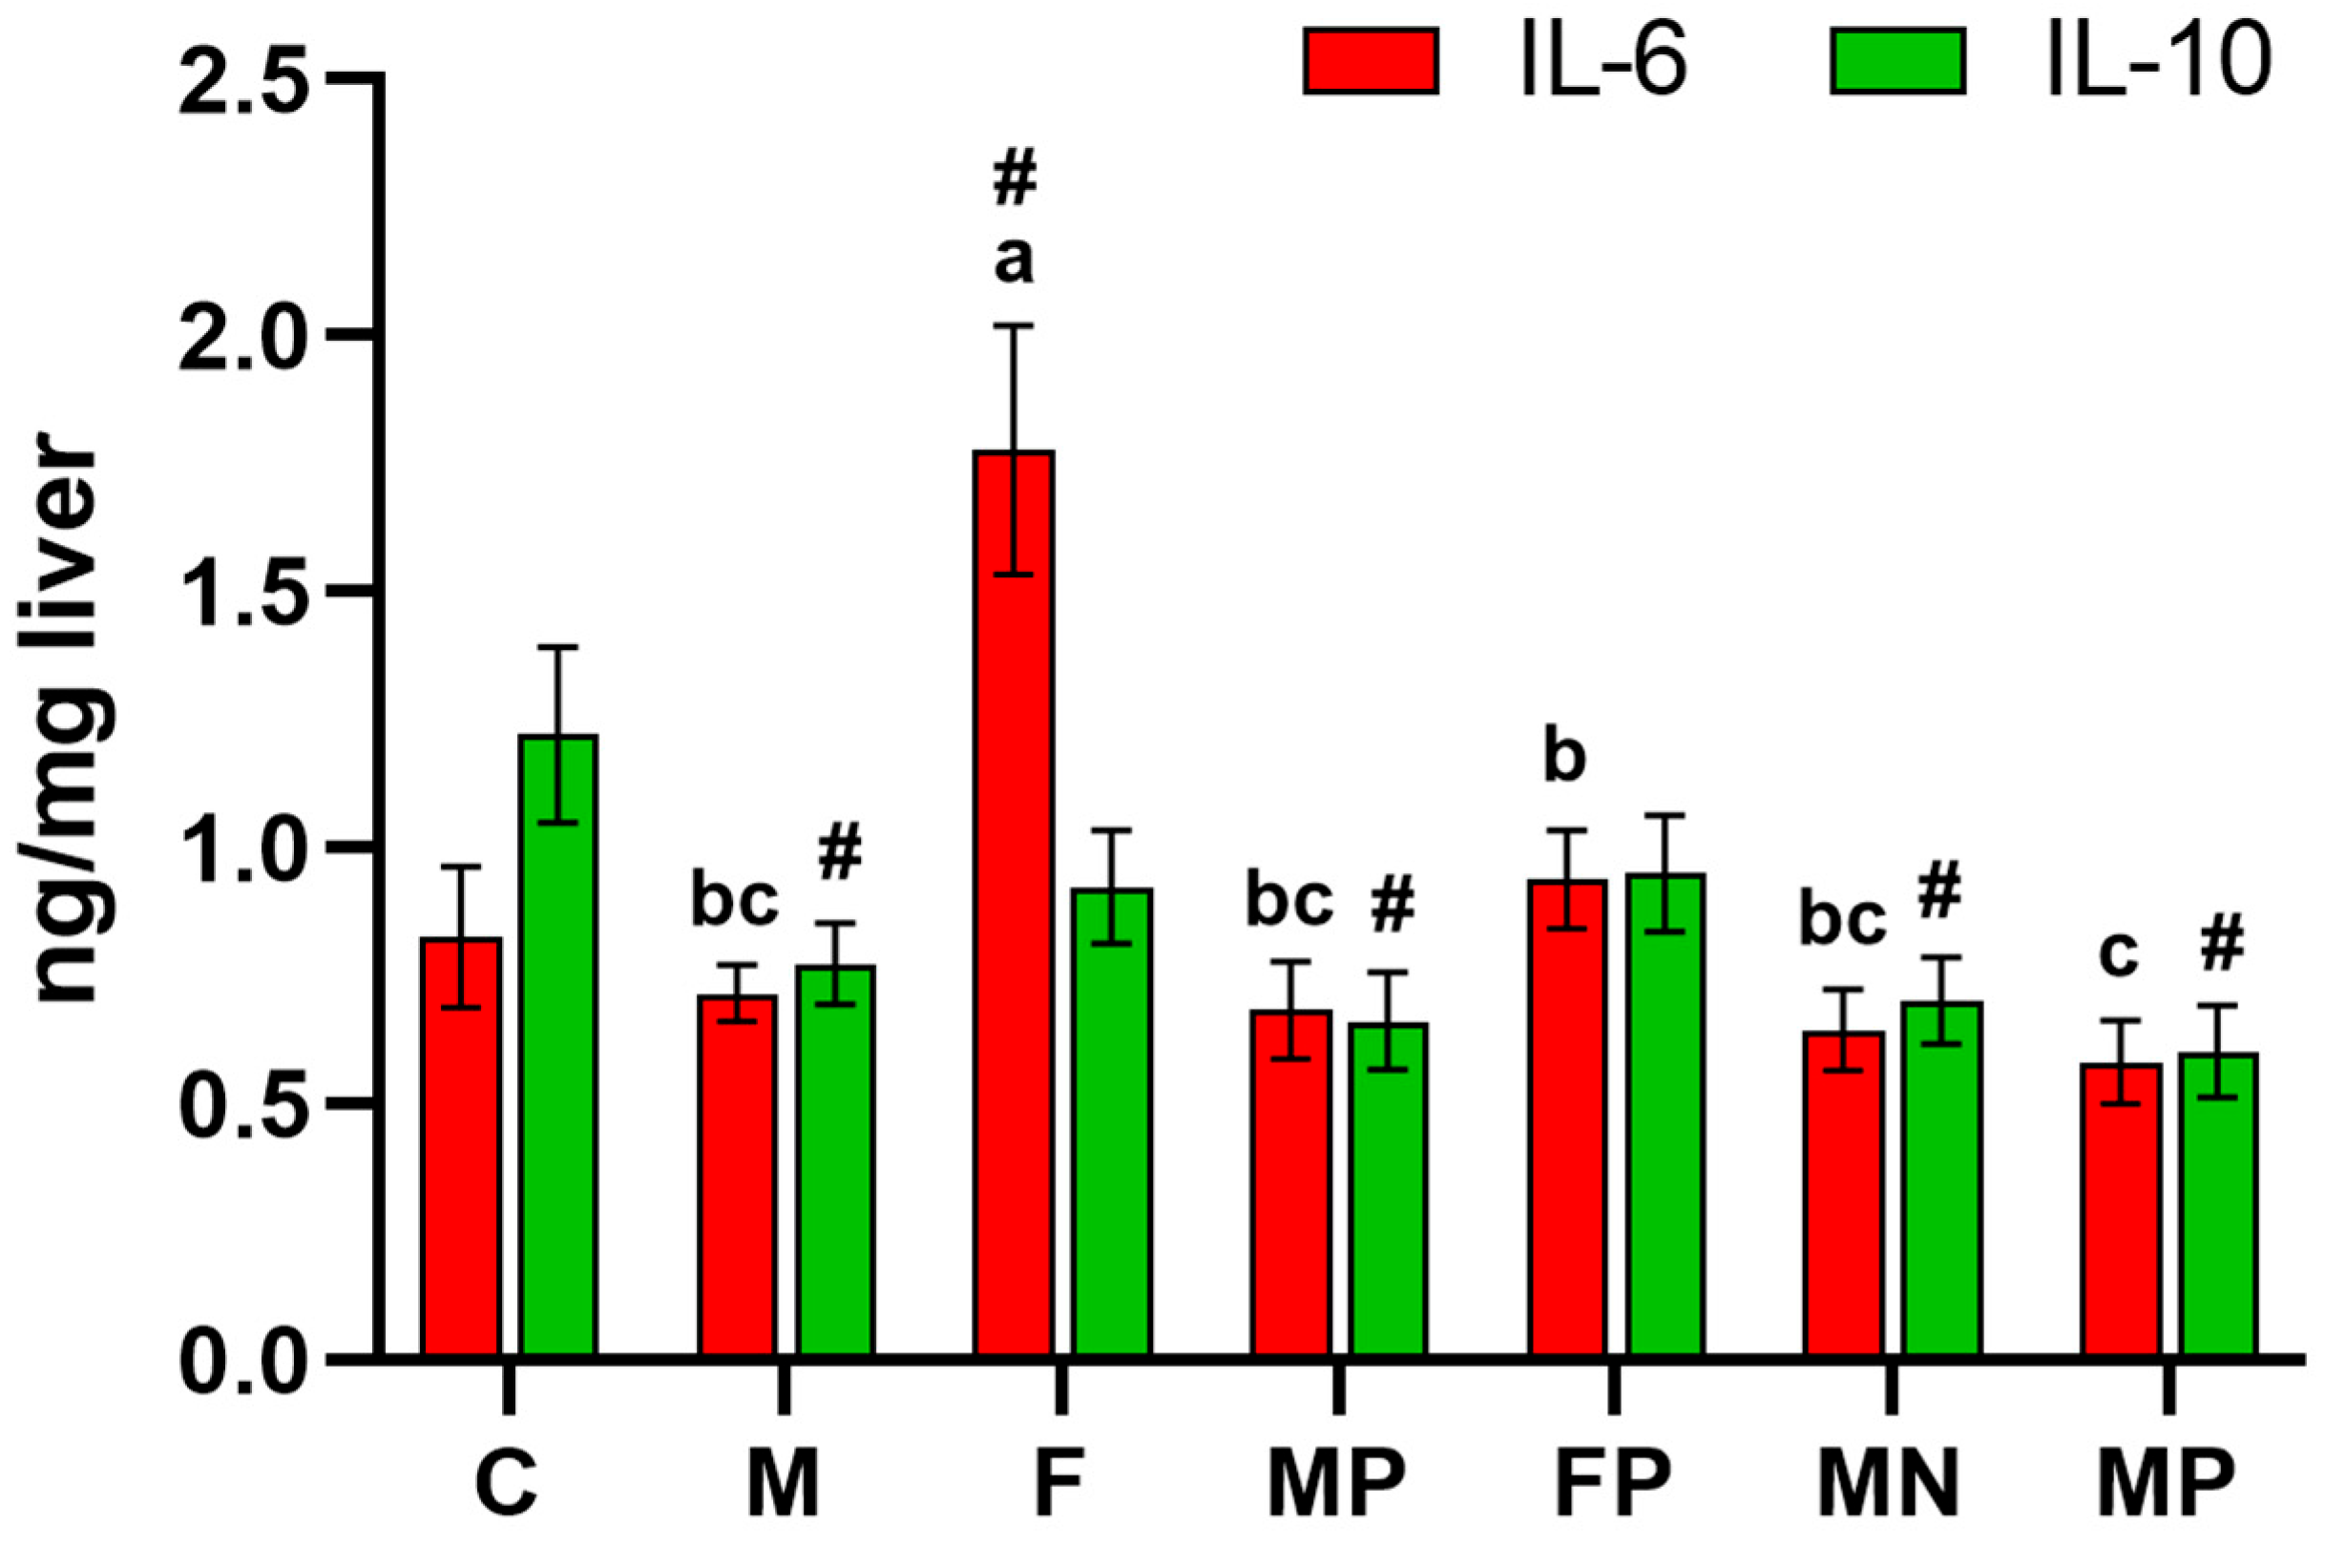
2. Results
3. Discussion
4. Materials and Methods
4.1. Chromium Form Characterization
4.2. The In Vivo Study
4.3. Laboratory Analyses
4.4. Statistics
5. Conclusions
Author Contributions
Funding
Institutional Review Board Statement
Informed Consent Statement
Data Availability Statement
Conflicts of Interest
References
- Wharton, S.; Bonder, R.; Jeffery, A.; Christensen, R.A.G. The safety and effectiveness of commonly-marketed natural supplements for weight loss in populations with obesity: A critical review of the literature from 2006 to 2016. Crit. Rev. Food Sci. Nutr. 2020, 60, 1614–1630. [Google Scholar] [CrossRef]
- Piotrowska, A.; Pilch, W.; Czerwińska-Ledwig, O.; Zuziak, R.; Siwek, A.; Wolak, M.; Nowak, G. The possibilities of using chromium salts as an agent supporting treatment of polycystic ovary syndrome. Biol. Trace Elem. Res. 2019, 192, 91–97. [Google Scholar] [CrossRef]
- Orhan, C.; Kucuk, O.; Tuzcu, M.; Sahin, N.; Komorowski, J.R.; Sahin, K. Effect of supplementing chromium histidinate and picolinate complexes along with biotin on insulin sensitivity and related metabolic indices in rats fed a high-fat diet. Food Sci. Nutr. 2019, 7, 183–194. [Google Scholar] [CrossRef]
- Vincent, J.B. New evidence against chromium as an essential trace element. J. Nutr. 2017, 147, 2212–2219. [Google Scholar] [CrossRef]
- Talavera, A.G.; Reza, A.; Cedra, J. Effect of short term treatment with chromium on BMI, lipids, and fasting glucose in obese subjects. In Diabetes; American Diabetes Association: Alexandria, VA, USA, 2004; p. 596. [Google Scholar]
- Jamilian, M.; Foroozanfard, F.; Kavossian, E.; Kia, M.; Aghadavod, E.; Amirani, E.; Asemi, Z. Effects of Chromium and Carnitine Co-supplementation on Body Weight and Metabolic Profiles in Overweight and Obese Women with Polycystic Ovary Syndrome: A Randomized, Double-Blind, Placebo-Controlled Trial. Biol. Trace Elem. Res. 2020, 193, 334–341. [Google Scholar] [CrossRef]
- Bailey, C.H. Improved meta-analytic methods show no effect of chromium supplements on fasting glucose. Biol. Trace Elem. Res. 2014, 157, 1–8. [Google Scholar] [CrossRef]
- Moradi, F.; Maleki, V.; Saleh-Ghadimi, S.; Kooshki, F.; Gargari, B.P. Potential roles of chromium on inflammatory biomarkers in diabetes: A systematic. Clin. Exp. Pharmacol. Physiol. 2019, 46, 975–983. [Google Scholar] [CrossRef]
- Pala, R.; Sari, M.A.; Erten, F.; Er, B.; Tuzcu, M.; Orhan, C.; Deeh, P.B.D.; Sahin, N.; Cinar, V.; Komorowski, J.R.; et al. The effects of chromium picolinate on glucose and lipid metabolism in running rats. J. Trace Elem. Med. Biol. 2020, 58, 126434. [Google Scholar] [CrossRef]
- Sreejayan, N.; Dong, F.; Kandadi, M.R.; Yang, X.; Ren, J. Chromium alleviates glucose intolerance, insulin resistance, and hepatic ER stress in obese mice. Obesity 2008, 16, 1331–1337. [Google Scholar] [CrossRef]
- Selcuk, M.Y.; Aygen, B.; Dogukan, A.; Tuzcu, Z.; Akdemir, F.; Komorowski, J.R.; Atalay, M.; Sahin, K. Chromium picolinate and chromium histidinate protects against renal dysfunction by modulation of NF-κB pathway in high-fat diet fed and Streptozotocin-induced diabetic rats. Nutr. Metab. 2012, 9, 30. [Google Scholar] [CrossRef]
- Chang, G.R.; Hou, P.H.; Chen, W.K.; Lin, C.T.; Tsai, H.P.; Mao, F.C. Exercise affects blood glucose levels and tTissue chromium distribution in high-fat diet-fed C57BL6 mice. Molecules 2020, 25, 1658. [Google Scholar] [CrossRef]
- Li, T.Y.; Fu, C.M.; Lien, T.F. Effects of nanoparticle chromium on chromium absorbability, growth performance, blood parameters and carcass traits of pigs. Anim. Prod. Sci. 2017, 57, 1193–1200. [Google Scholar] [CrossRef]
- Cao, Y. The Toxicity of Nanoparticles to Human Endothelial Cells. Adv. Exp. Med. Biol. 2018, 1048, 59–69. [Google Scholar] [CrossRef]
- Frőhlich, E.E.; Frőhlich, E. Cytotoxicity of nanoparticles contained in food on intestinal cells and the gut microbiota. Int. J. Mol. Sci. 2016, 17, 509. [Google Scholar] [CrossRef]
- Ognik, K.; Drażbo, A.; Stępniowska, A.; Kozłowski, K.; Listos, P.; Jankowski, J. The effect of chromium nanoparticles and chromium picolinate in broiler chicken diet on the performance, redox status and tissue histology. Anim. Feed Sci. Technol. 2020, 259, 114326. [Google Scholar] [CrossRef]
- Stępniowska, A.; Drażbo, A.; Kozłowski, K.; Ognik, K.; Jankowski, J. The effect of chromium nanoparticles and chromium picolinate in the diet of chickens on levels of selected hormones and tissue antioxidant status. Animals 2020, 10, 45. [Google Scholar] [CrossRef]
- Fabbrini, E.; Sullivan, S.; Klein, S. Obesity and nonalcoholic fatty liver disease: Biochemical, metabolic, and clinical implications. Hepatology 2010, 51, 679–689. [Google Scholar] [CrossRef]
- Braga, S.P.; Delanogare, E.; Machado, A.E.; Prediger, R.D.; Moreira, E.L.G. Switching from high-fat. Behav. Brain Res. 2021, 398, 112969. [Google Scholar] [CrossRef]
- Dworzański, W.; Cholewińska, E.; Fotschki, B.; Juśkiewicz, J.; Listos, P.; Ognik, K. Assessment of DNA methylation and oxidative changes in the heart and brain of rats receiving a high-fat diet supplemented with various forms of chromium. Animals 2020, 10, 1470. [Google Scholar] [CrossRef]
- Majewski, M.; Gromadziński, L.; Cholewińska, E.; Ognik, K.; Fotschki, B.; Juśkiewicz, J. Dietary effects of chromium picolinate and chromium nanoparticles in Wistar rats fed with a high-fat, low-fiber diet: The role of fat normalization. Nutrients 2022, 14, 5138. [Google Scholar] [CrossRef]
- Dworzański, W.; Cholewińska, E.; Fotschki, B.; Juśkiewicz, J.; Ognik, K. Oxidative, epigenetic changes and fermentation processes in the intestine of rats fed high-fat diets supplemented with various chromium forms. Sci. Rep. 2022, 12, 9817. [Google Scholar] [CrossRef]
- Stępniowska, A.; Tutaj, K.; Juśkiewicz, J.; Ognik, K. Effects of a high-fat diet and chromium on hormones level and Cr retention in rats. J. Endocrinol. Investig. 2022, 45, 527–535. [Google Scholar] [CrossRef]
- Stępniowska, A.; Juśkiewicz, J.; Tutaj, K.; Fotschki, J.; Fotschki, B.; Ognik, K. Effect of chromium picolinate and chromium nanoparticles added to low- and high-fat diets on chromium biodistribution and the blood level of selected minerals in rats. Pol. J. Food Nutr. Sci. 2022, 72, 229–238. [Google Scholar] [CrossRef]
- Fatima, R.; Ahmad, R. Hepatotoxicity and chromosomal abnormalities evaluation due to single and repeated oral exposures of chromium oxide nanoparticles in Wistar rats. Toxicol. Ind. Health 2019, 35, 548–557. [Google Scholar] [CrossRef]
- Horie, M.; Nishio, K.; Endoh, S.; Kato, H.; Fujita, K.; Miyauchi, A.; Nakamura, A.; Kinugasa, S.; Yamamoto, K.; Niki, E.; et al. Chromium (III) oxide nanoparticles induced remarkable oxidative stress and apoptosis on culture cells. Environ. Toxicol. 2013, 28, 61–75. [Google Scholar] [CrossRef]
- Alarifi, S.; Ali, D.; Alkahtani, S. Mechanistic investigation of toxicity of chromium oxide nanoparticles in murine fibrosarcoma cells. Int. J. Nanomed. 2016, 11, 1253–1259. [Google Scholar] [CrossRef]
- Moradi, F.; Kooshki, F.; Nokhostin, F.; Khoshbaten, M.; Bazyar, H.; Pourghassem Gargari, B. A pilot study of the effects of chromium picolinate supplementation on serum fetuin-A, metabolic and inflammatory factors in patients with nonalcoholic fatty liver disease: A double-blind, placebo-controlled trial. J. Trace Elem. Med. Biol. 2021, 63, 126659. [Google Scholar] [CrossRef]
- Holzner, L.M.W.; Murray, A.J. Hypoxia-Inducible Factors as Key Players in the Pathogenesis of Non-alcoholic Fatty Liver Disease and Non-alcoholic Steatohepatitis. Front. Med. 2021, 8, 753268. [Google Scholar] [CrossRef]
- Grau, R.; Díaz-Muñoz, M.D.; Cacheiro-Llaguno, C.; Fresno, M.; Iñiguez, M.A. Role of peroxisome proliferator-activated receptor alpha in the control of cyclooxygenase 2 and vascular endothelial growth factor: Involvement in tumor growth. PPAR Res. 2008, 2008, 352437. [Google Scholar] [CrossRef]
- Wang, Y.; Nakajima, T.; Gonzalez, F.J.; Tanaka, N. PPARs as Metabolic Regulators in the Liver: Lessons from Liver-Specific PPAR-Null Mice. Int. J. Mol. Sci. 2020, 21, 2061. [Google Scholar] [CrossRef]
- Barreto, J.; Karathanasis, S.K.; Remaley, A.; Sposito, A.C. Role of LOX-1 (Lectin-Like Oxidized Low-Density Lipoprotein Receptor 1) as a Cardiovascular Risk Predictor: Mechanistic Insight and Potential Clinical Use. Arterioscler. Thromb. Vasc. Biol. 2021, 41, 153–166. [Google Scholar] [CrossRef]
- Wang, Z.; Chen, J.; Zeng, Z.; Zhang, Q.; Du, G.; Guo, X.; Wei, Y. The LOX-1 receptor ectopically expressed in the liver alleviates atherosclerosis by clearing Ox-LDL from the circulation. Mol. Med. 2022, 28, 26. [Google Scholar] [CrossRef]
- Yu, J.; Ip, E.; Dela Peña, A.; Hou, J.Y.; Sesha, J.; Pera, N.; Hall, P.; Kirsch, R.; Leclercq, I.; Farrell, G.C. COX-2 induction in mice with experimental nutritional steatohepatitis: Role as pro-inflammatory mediator. Hepatology 2006, 43, 826–836. [Google Scholar] [CrossRef]
- Zhou, B.; Wang, H.; Luo, G.; Niu, R.; Wang, J. Effect of dietary yeast chromium and L-carnitine on lipid metabolism of sheep. Biol. Trace Elem. Res. 2013, 155, 221–227. [Google Scholar] [CrossRef]
- Fontes-Cal, T.C.M.; Mattos, R.T.; Medeiros, N.I.; Pinto, B.F.; Belchior-Bezerra, M.; Roque-Souza, B.; Dutra, W.O.; Ferrari, T.C.A.; Vidigal, P.V.T.; Faria, L.C.; et al. Crosstalk Between Plasma Cytokines, Inflammation, and Liver Damage as a New Strategy to Monitoring NAFLD Progression. Front. Immunol. 2021, 12, 708959. [Google Scholar] [CrossRef]
- EFSA NDA Panel (EFSA Panel on Dietetic Products, Nutrition and Allergies). Scientific Opinion on Dietary Reference Values for chromium. EFSA J. 2014, 12, 3845. [Google Scholar] [CrossRef]
- Reeves, P.G. Components of the AIN-93 diets as improvements in the AIN-76A diet. J. Nutr. 1997, 127, 838–841. [Google Scholar] [CrossRef]
- Rahman, I.; Kode, A.; Biswas, S.K. Assay for quantitative determination of glutathione and glutathione disulfide levels using enzymatic recycling method. Nat. Protoc. 2006, 1, 3159–3165. [Google Scholar] [CrossRef]
- Folch, J.; Lees, M.; Sloane Stanley, G.H. A simple method for the isolation and purification of total lipids from animal tissues. J. Biol. Chem. 1957, 226, 497–509. [Google Scholar]


| Initial BW | Final BW | BW Gain | Intake | Fat Mass | Lean Mass | Fat | Lean | eWAT | |
|---|---|---|---|---|---|---|---|---|---|
| G | g | g/Day | g/Day | g | G | % | % | g/100 g BW | |
| Control C | 409 | 469 | 1.04 | 18.5 | 74.1 | 118 | 31.6 | 50.2 | 3.65 |
| 2-way ANOVA: | |||||||||
| M | 461 # | 475 | 0.245 c# | 16.7 # | 77.0 c | 118 | 32.5 d | 49.6 a | 3.78 d |
| F | 462 # | 542 # | 1.341 a | 15.5 # | 118 a# | 109 # | 43.3 a# | 40.4 c# | 5.15 a# |
| MP | 462 # | 481 | 0.308 c# | 17.1 # | 79.9 c | 118 | 33.2 d | 48.9 ab | 3.90 d |
| FP | 461 # | 535 # | 1.262 a | 15.5 # | 108 a# | 113 | 40.2 b# | 42.3 c# | 4.73 ab# |
| MN | 462 # | 484 # | 0.356 c# | 16.7 # | 82.0 bc | 117 | 33.8 cd | 48.7 ab | 3.97 cd |
| FN | 453 # | 510 # | 0.977 b | 14.4 # | 94.1 b# | 116 | 36.7 c# | 45.8 b# | 4.40 bc# |
| SEM | 4.139 | 5.508 | 0.058 | 0.183 | 2.302 | 1.21 | 0.604 | 0.540 | 0.080 |
| Cr (additional) | |||||||||
| W (without) | 461 | 509 | 0.793 | 16.1 | 97.3 | 113 | 37.8 | 45.0 | 4.46 |
| P (picolinate) | 461 | 508 | 0.784 | 16.3 | 94.0 | 115 | 36.7 | 45.6 | 4.31 |
| N (nano) | 457 | 497 | 0.666 | 15.5 | 88.0 | 117 | 35.2 | 47.2 | 4.18 |
| p-value | 0.909 | 0.601 | 0.292 | 0.078 | 0.101 | 0.478 | 0.059 | 0.102 | 0.223 |
| D (Diet type) | |||||||||
| M | 461 | 479 b | 0.303 | 16.8 a | 79.6 | 117 a | 33.1 | 49.0 | 3.88 |
| F | 459 | 529 a | 1.19 | 15.1 b | 106 | 112 b | 40.0 | 42.8 | 4.76 |
| p-value | 0.767 | <0.001 | <0.001 | <0.001 | <0.001 | 0.047 | <0.001 | <0.001 | <0.001 |
| Interaction Cr×D | |||||||||
| p-value | 0.864 | 0.294 | 0.029 | 0.332 | 0.006 | 0.428 | 0.002 | 0.016 | 0.015 |
| Weight | Fat | TC | TG | GSH/GSSG | AST | ALT | ALP | |
|---|---|---|---|---|---|---|---|---|
| g/100 g BW | % | mg/g | mg/g | U/L | U/L | U/L | ||
| Control C | 3.07 | 16.8 | 12.3 | 15.5 | 3.57 | 84.9 | 36.6 | 80.2 |
| 2-way ANOVA: | ||||||||
| M | 3.29 | 24.6 c# | 25.5 a# | 32.5 b# | 2.70 # | 105 b# | 80.1 # | 90.9 # |
| F | 3.56 # | 36.9 a# | 24.2 a# | 42.9 a# | 2.39 # | 132 a# | 96.2 # | 91.1# |
| MP | 3.39 # | 24.4 c# | 22.1 b# | 30.9 bc# | 2.90 # | 106 b# | 55.2 # | 85.3 |
| FP | 3.30 | 29.8 b# | 16.2 c# | 21.1 d# | 2.80 # | 106 b# | 69.6 # | 77.9 |
| MN | 3.13 | 19.1 d | 15.7 c# | 22.6 d# | 3.43 | 93.9 b | 60.7 # | 90.4 |
| FN | 3.53 # | 31.0 b# | 15.3 c# | 27.6 c# | 3.05 | 139 a# | 89.6 # | 83.5 |
| SEM | 0.044 | 3.490 | 2.508 | 3.686 | 0.399 | 3.184 | 3.017 | 1.587 |
| Cr (additional) | ||||||||
| W (without) | 3.42 | 30.7 | 24.8 | 37.6 | 2.54 b | 118 | 88.1 a | 90.9 |
| P (picolinate) | 3.34 | 27.1 | 19.1 | 25.9 | 2.85 b | 106 | 62.4 b | 81.5 |
| N (nano) | 3.33 | 25.1 | 15.5 | 25.1 | 3.24 a | 116 | 75.1 ab | 86.9 |
| p-value | 0.672 | <0.001 | <0.001 | <0.001 | 0.001 | 0.181 | <0.005 | 0.084 |
| D (Diet type) | ||||||||
| M | 3.26 b | 22.7 | 21.1 | 28.7 | 3.01 | 101 | 65.3 b | 88.8 |
| F | 3.46 a | 32.6 | 18.6 | 30.5 | 2.75 | 125 | 85.1 a | 84.1 |
| p-value | 0.037 | <0.001 | <0.001 | 0.158 | 0.083 | <0.001 | <0.001 | 0.171 |
| Interaction Cr×D | ||||||||
| p-value | 0.086 | 0.029 | 0.001 | <0.001 | 0.717 | 0.010 | 0.442 | 0.598 |
| PPARα | COX-2 | HIF-1α | LOX-1 | |
|---|---|---|---|---|
| Control C | 21.6 | 7.51 | 8.05 | 6.54 |
| 2-way ANOVA: | ||||
| M | 14.7 # | 11.1 # | 9.59 # | 12.4 # |
| F | 7.57 # | 13.0 # | 11.0 # | 22.9 # |
| MP | 16.8 | 10.4 # | 8.49 | 9.88 # |
| FP | 14.4 # | 10.4 # | 8.63 | 14.5 # |
| MN | 21.7 | 8.36 | 8.47 | 6.23 |
| FN | 12.7 # | 11.6 # | 10.1 # | 14.0 # |
| SEM | 2.094 | 1.385 | 1.228 | 1.651 |
| Cr (additional) | ||||
| W (without) | 11.1 b | 12.0 a | 10.3 a | 17.6 a |
| P (picolinate) | 15.6 a | 10.4 b | 8.56 b | 12.2 b |
| N (nano) | 17.2 a | 10.0 b | 9.27 b | 10.1 b |
| p-value | 0.007 | 0.047 | 0.001 | <0.001 |
| D (Diet type) | ||||
| M | 17.8 a | 9.96 b | 8.85 b | 9.51 b |
| F | 11.6 b | 11.7 a | 9.90 a | 17.1 a |
| p-value | <0.001 | 0.013 | 0.005 | <0.001 |
| Interaction Cr×D | ||||
| p-value | 0.220 | 0.146 | 0.200 | 0.186 |
| TC | HDL | nHDL | TG | AIP | GL | |
|---|---|---|---|---|---|---|
| mmol/L | mmol/L | mmol/L | mmol/L | log(TG/HDL) | mmol/L | |
| Control C | 1.96 | 0.488 | 1.47 | 1.54 | 0.497 | 13.2 |
| 2-way ANOVA: | ||||||
| M | 2.16 # | 0.414 # | 1.75 # | 1.49 ab | 0.547 ab | 13.7 |
| F | 2.46 # | 0.407 # | 2.06 # | 1.74 a | 0.633 a# | 15.2 # |
| MP | 2.18 # | 0.410 # | 1.77 # | 1.56 ab | 0.577 ab# | 13.3 |
| FP | 2.26 # | 0.408 # | 1.85 # | 1.37 b | 0.513 b | 13.4 |
| MN | 2.16 # | 0.415 # | 1.74 # | 1.60 ab | 0.580 ab# | 13.8 |
| FN | 2.27 # | 0.429 | 1.84 # | 1.33 b | 0.489 b | 15.3 # |
| SEM | 0.032 | 0.008 | 0.030 | 0.038 | 0.012 | 0.164 |
| Cr (additional) | ||||||
| W (without) | 2.31 | 0.410 | 1.90 | 1.61 | 0.590 | 14.4 a |
| P (picolinate) | 2.22 | 0.408 | 1.80 | 1.46 | 0.545 | 13.3 b |
| N (nano) | 2.21 | 0.422 | 1.79 | 1.46 | 0.534 | 14.0 ab |
| p-value | 0.351 | 0.773 | 0.217 | 0.193 | 0.151 | 0.031 |
| D (Diet type) | ||||||
| M | 2.16 b | 0.413 | 1.75 b | 1.54 | 0.568 | 13.6 |
| F | 2.33 a | 0.414 | 1.91 a | 1.47 | 0.545 | 14.2 |
| p-value | 0.012 | 0.933 | 0.004 | 0.383 | 0.352 | 0.062 |
| Interaction Cr×D | ||||||
| p-value | 0.301 | 0.855 | 0.176 | 0.021 | 0.008 | 0.209 |
| C | F | MP | FP | MN | FN | |
|---|---|---|---|---|---|---|
| Casein 1 | 14.8 | 14.8 | 14.8 | 14.8 | 14.8 | 14.8 |
| DL-methionine | 0.2 | 0.2 | 0.2 | 0.2 | 0.2 | 0.2 |
| Cellulose 2 | 8 | 3 | 8 | 3 | 8 | 3 |
| Choline chloride | 0.2 | 0.2 | 0.2 | 0.2 | 0.2 | 0.2 |
| Cholesterol | 0.3 | 0.3 | 0.3 | 0.3 | 0.3 | 0.3 |
| Vitamin mix 3 | 1 | 1 | 1 | 1 | 1 | 1 |
| Mineral mix 4 | 3.5 | 3.5 | 3.5 | 3.5 | 3.5 | 3.5 |
| Maize starch 5 | 64 | 52 | 64 | 52 | 64 | 52 |
| Rapeseed oil | 8 | 8 | 8 (with Cr-Pic) | 8 (with Cr-Pic) | 8 (with Cr-NP) | 8 (with Cr-NP) |
| Lard | 0 | 17 | 0 | 17 | 0 | 17 |
| Calculated nutritional value | ||||||
| Protein, kcal% | 15.1 | 11.6 | 15.1 | 11.6 | 15.1 | 11.6 |
| Fat, kcal% | 21.5 | 48.8 | 21.5 | 48.8 | 21.5 | 48.8 |
| Carbohydrates, kcal% | 63.4 | 39.6 | 63.4 | 39.6 | 63.4 | 39.6 |
| Group Control C | Group M | Group F | Group MP | Group FP | Group MN | Group FN | |
|---|---|---|---|---|---|---|---|
| Initial 9 wk period | Diet C | Diet F | Diet F | Diet F | Diet F | Diet F | Diet F |
| Experimental 9 wk period | Diet C | Diet C | Diet F | Diet MP | Diet FP | Diet MN | Diet FN |
| Initial 9 wk period | Without Cr supplementation | Without Cr supplementation | Without Cr supplementation | Without Cr supplementation | Without Cr supplementation | Without Cr supplementation | Without Cr supplementation |
| Experimental 9 wk period | Without Cr supplementation | Without Cr supplementation | Without Cr supplementation | Cr-Pic (0.3 mg/kg BW) | Cr-Pic (0.3 mg/kg BW) | Cr-NP (0.3 mg/kg BW) | Cr-NP (0.3 mg/kg BW) |
Disclaimer/Publisher’s Note: The statements, opinions and data contained in all publications are solely those of the individual author(s) and contributor(s) and not of MDPI and/or the editor(s). MDPI and/or the editor(s) disclaim responsibility for any injury to people or property resulting from any ideas, methods, instructions or products referred to in the content. |
© 2023 by the authors. Licensee MDPI, Basel, Switzerland. This article is an open access article distributed under the terms and conditions of the Creative Commons Attribution (CC BY) license (https://creativecommons.org/licenses/by/4.0/).
Share and Cite
Fotschki, B.; Ognik, K.; Fotschki, J.; Napiórkowska, D.; Cholewińska, E.; Krauze, M.; Juśkiewicz, J. Chromium Nanoparticles Together with a Switch Away from High-Fat/Low-Fiber Dietary Habits Enhances the Pro-Healthy Regulation of Liver Lipid Metabolism and Inflammation in Obese Rats. Int. J. Mol. Sci. 2023, 24, 2940. https://doi.org/10.3390/ijms24032940
Fotschki B, Ognik K, Fotschki J, Napiórkowska D, Cholewińska E, Krauze M, Juśkiewicz J. Chromium Nanoparticles Together with a Switch Away from High-Fat/Low-Fiber Dietary Habits Enhances the Pro-Healthy Regulation of Liver Lipid Metabolism and Inflammation in Obese Rats. International Journal of Molecular Sciences. 2023; 24(3):2940. https://doi.org/10.3390/ijms24032940
Chicago/Turabian StyleFotschki, Bartosz, Katarzyna Ognik, Joanna Fotschki, Dorota Napiórkowska, Ewelina Cholewińska, Magdalena Krauze, and Jerzy Juśkiewicz. 2023. "Chromium Nanoparticles Together with a Switch Away from High-Fat/Low-Fiber Dietary Habits Enhances the Pro-Healthy Regulation of Liver Lipid Metabolism and Inflammation in Obese Rats" International Journal of Molecular Sciences 24, no. 3: 2940. https://doi.org/10.3390/ijms24032940
APA StyleFotschki, B., Ognik, K., Fotschki, J., Napiórkowska, D., Cholewińska, E., Krauze, M., & Juśkiewicz, J. (2023). Chromium Nanoparticles Together with a Switch Away from High-Fat/Low-Fiber Dietary Habits Enhances the Pro-Healthy Regulation of Liver Lipid Metabolism and Inflammation in Obese Rats. International Journal of Molecular Sciences, 24(3), 2940. https://doi.org/10.3390/ijms24032940