
Copper (II) Species with Improved Anti-Melanoma and Antibacterial Activity by Inclusion in β-Cyclodextrin


 ,
,  , ,
, ,  and
and 
Abstract
1. Introduction
2. Results and Discussion
2.1. Formulation and Characterization of Inclusion Complexes
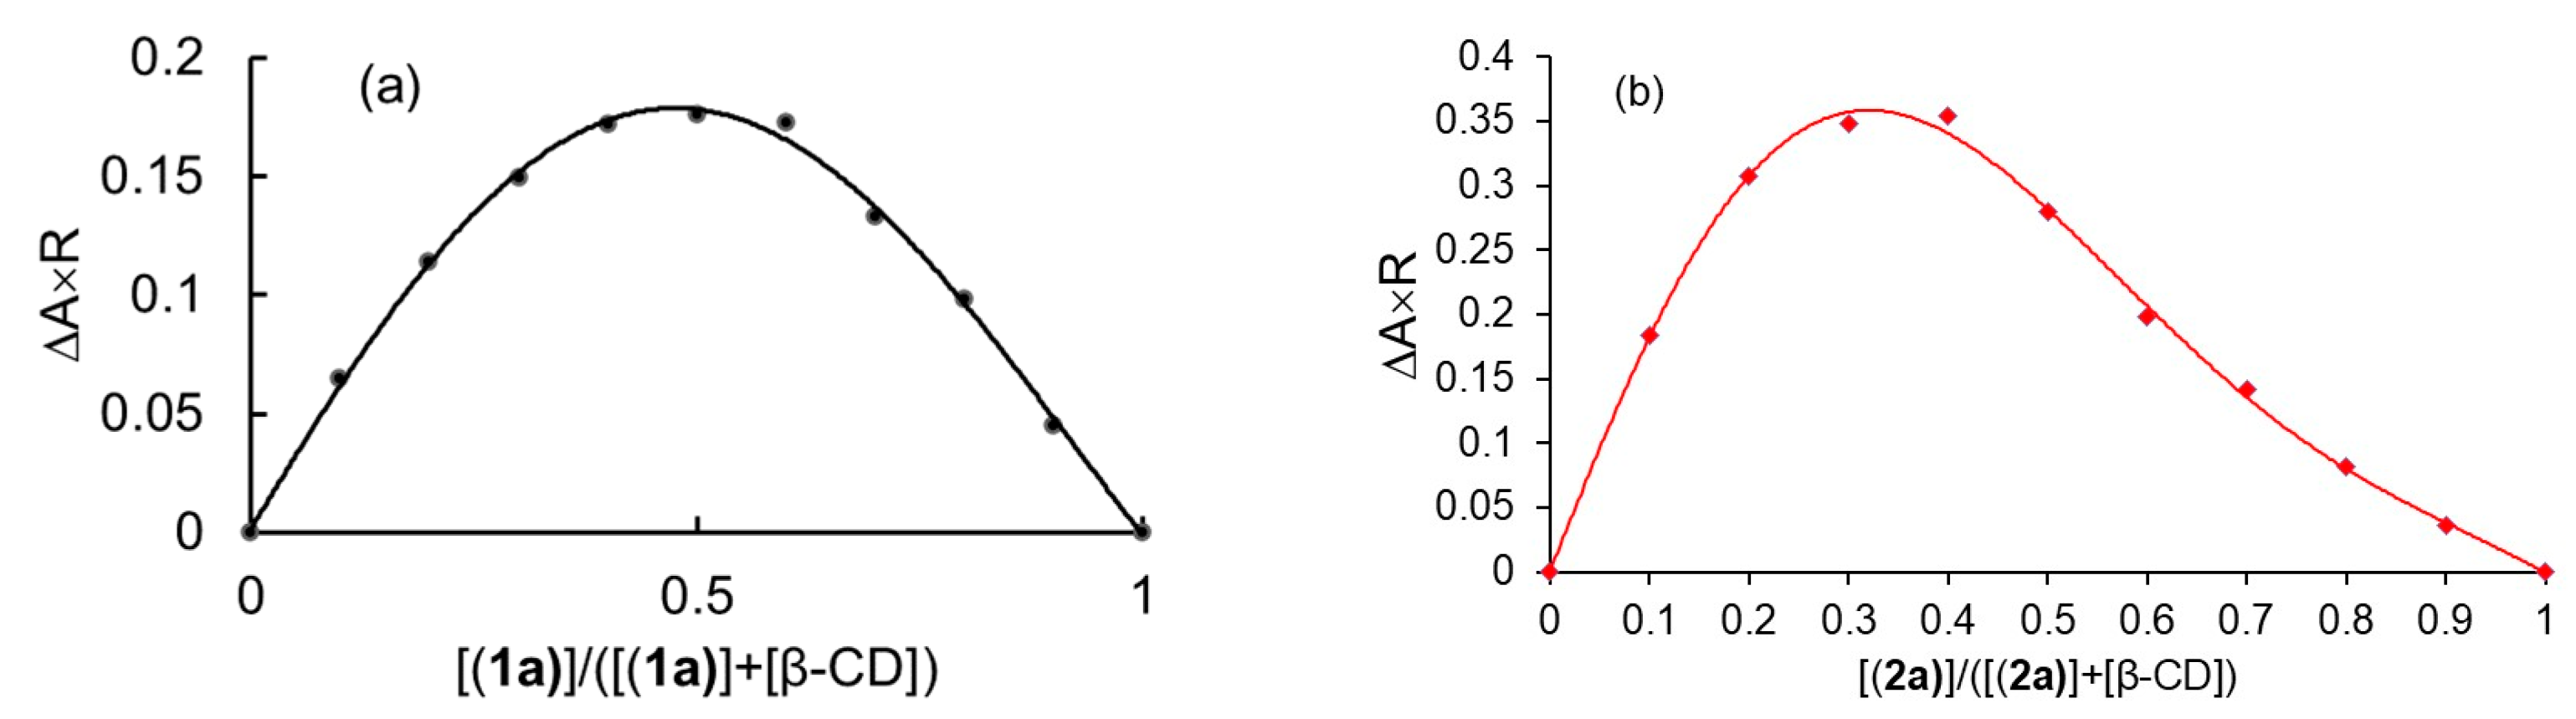
2.1.1. Stoichiometry of Inclusion Complexes
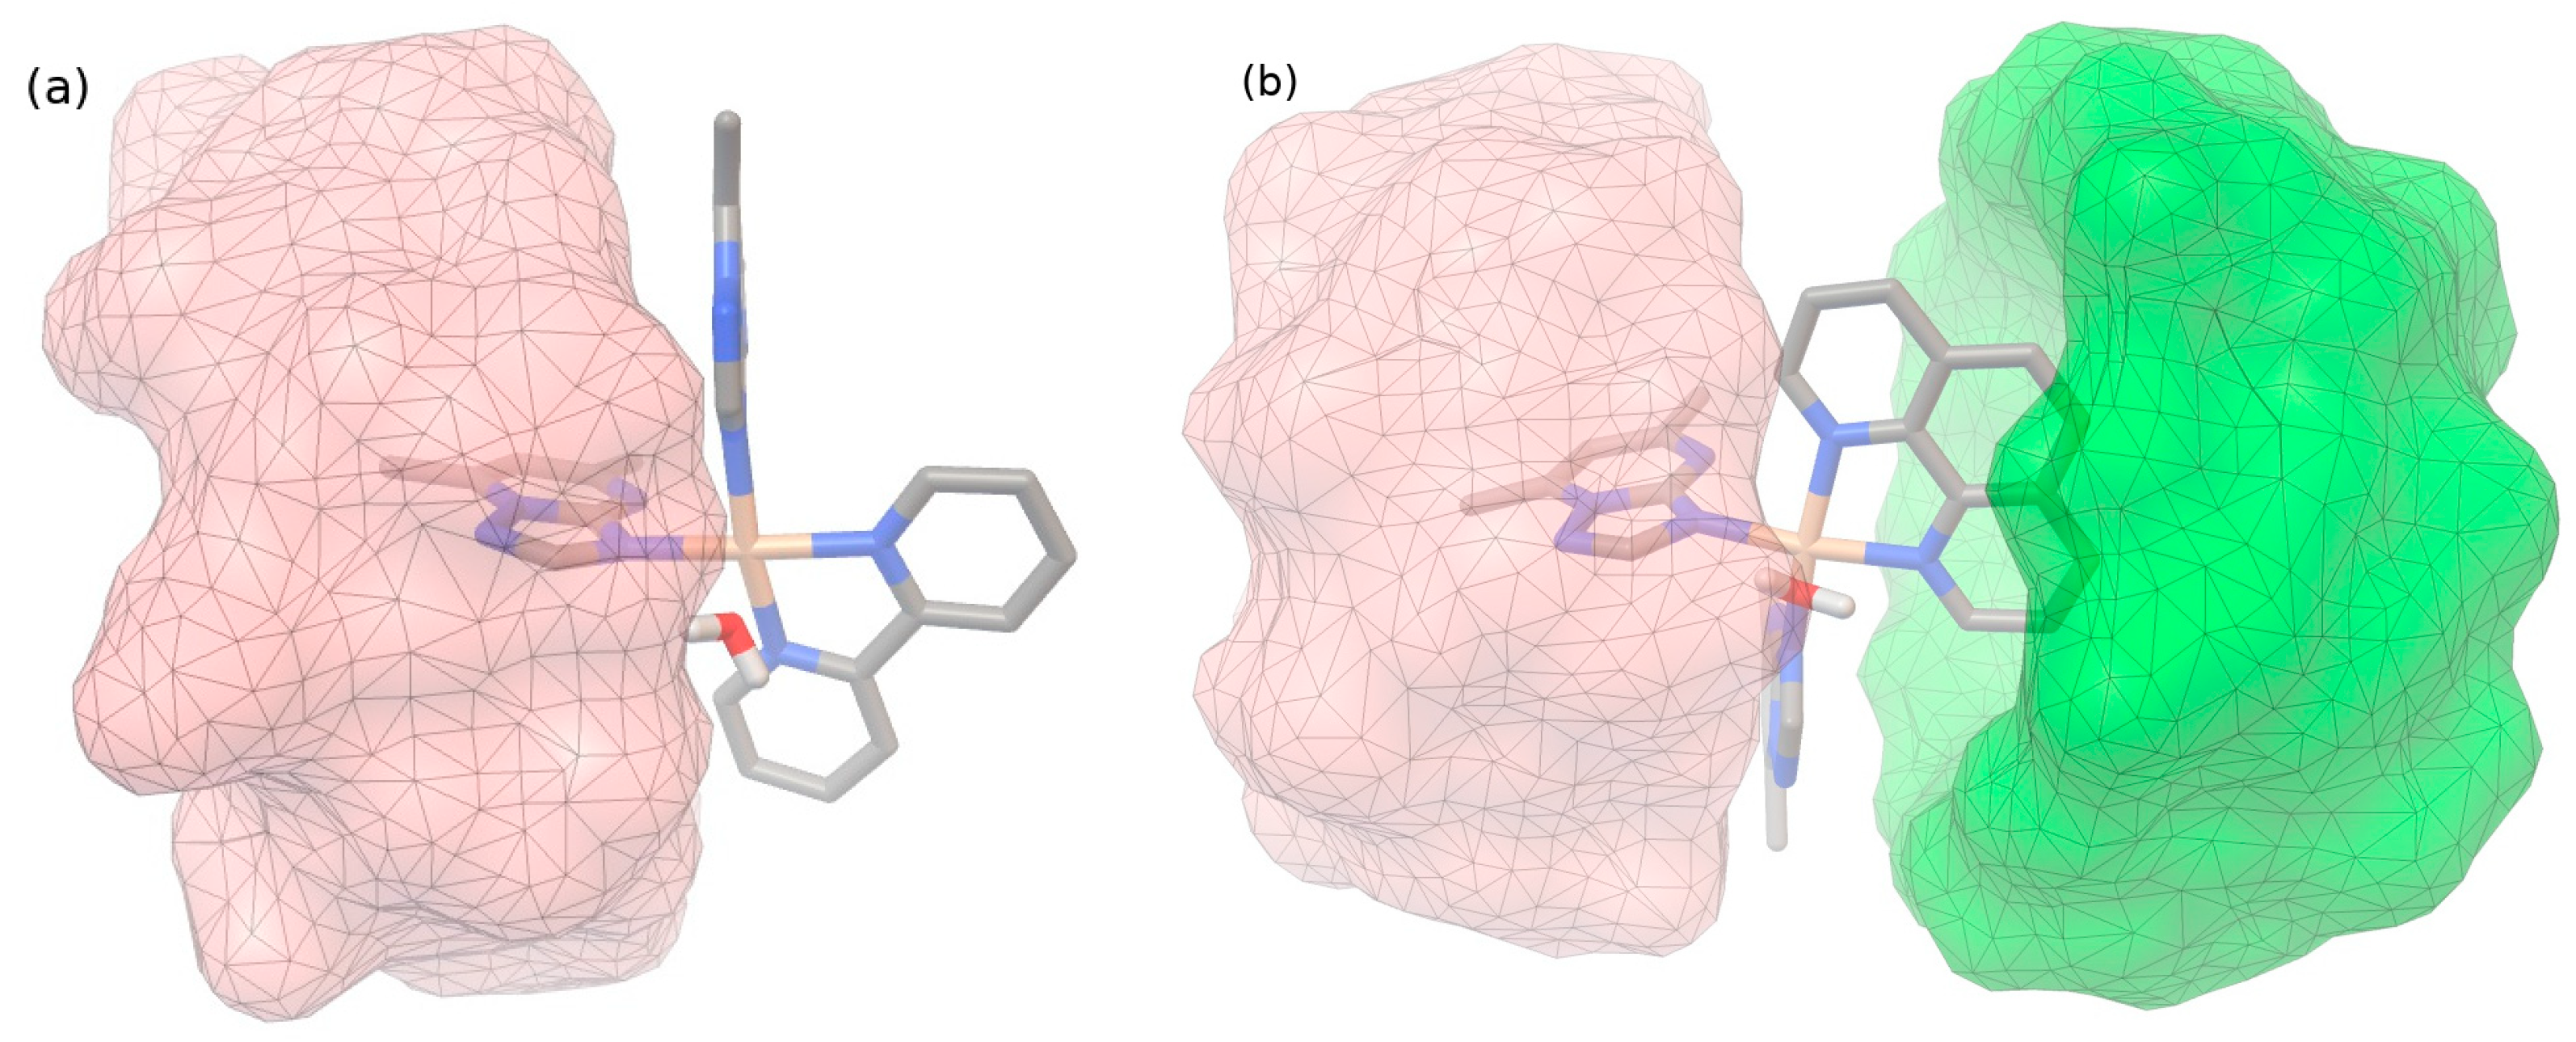
2.1.2. Molecular Docking Studies
2.1.3. Characterization of Inclusion Complexes in Solid State
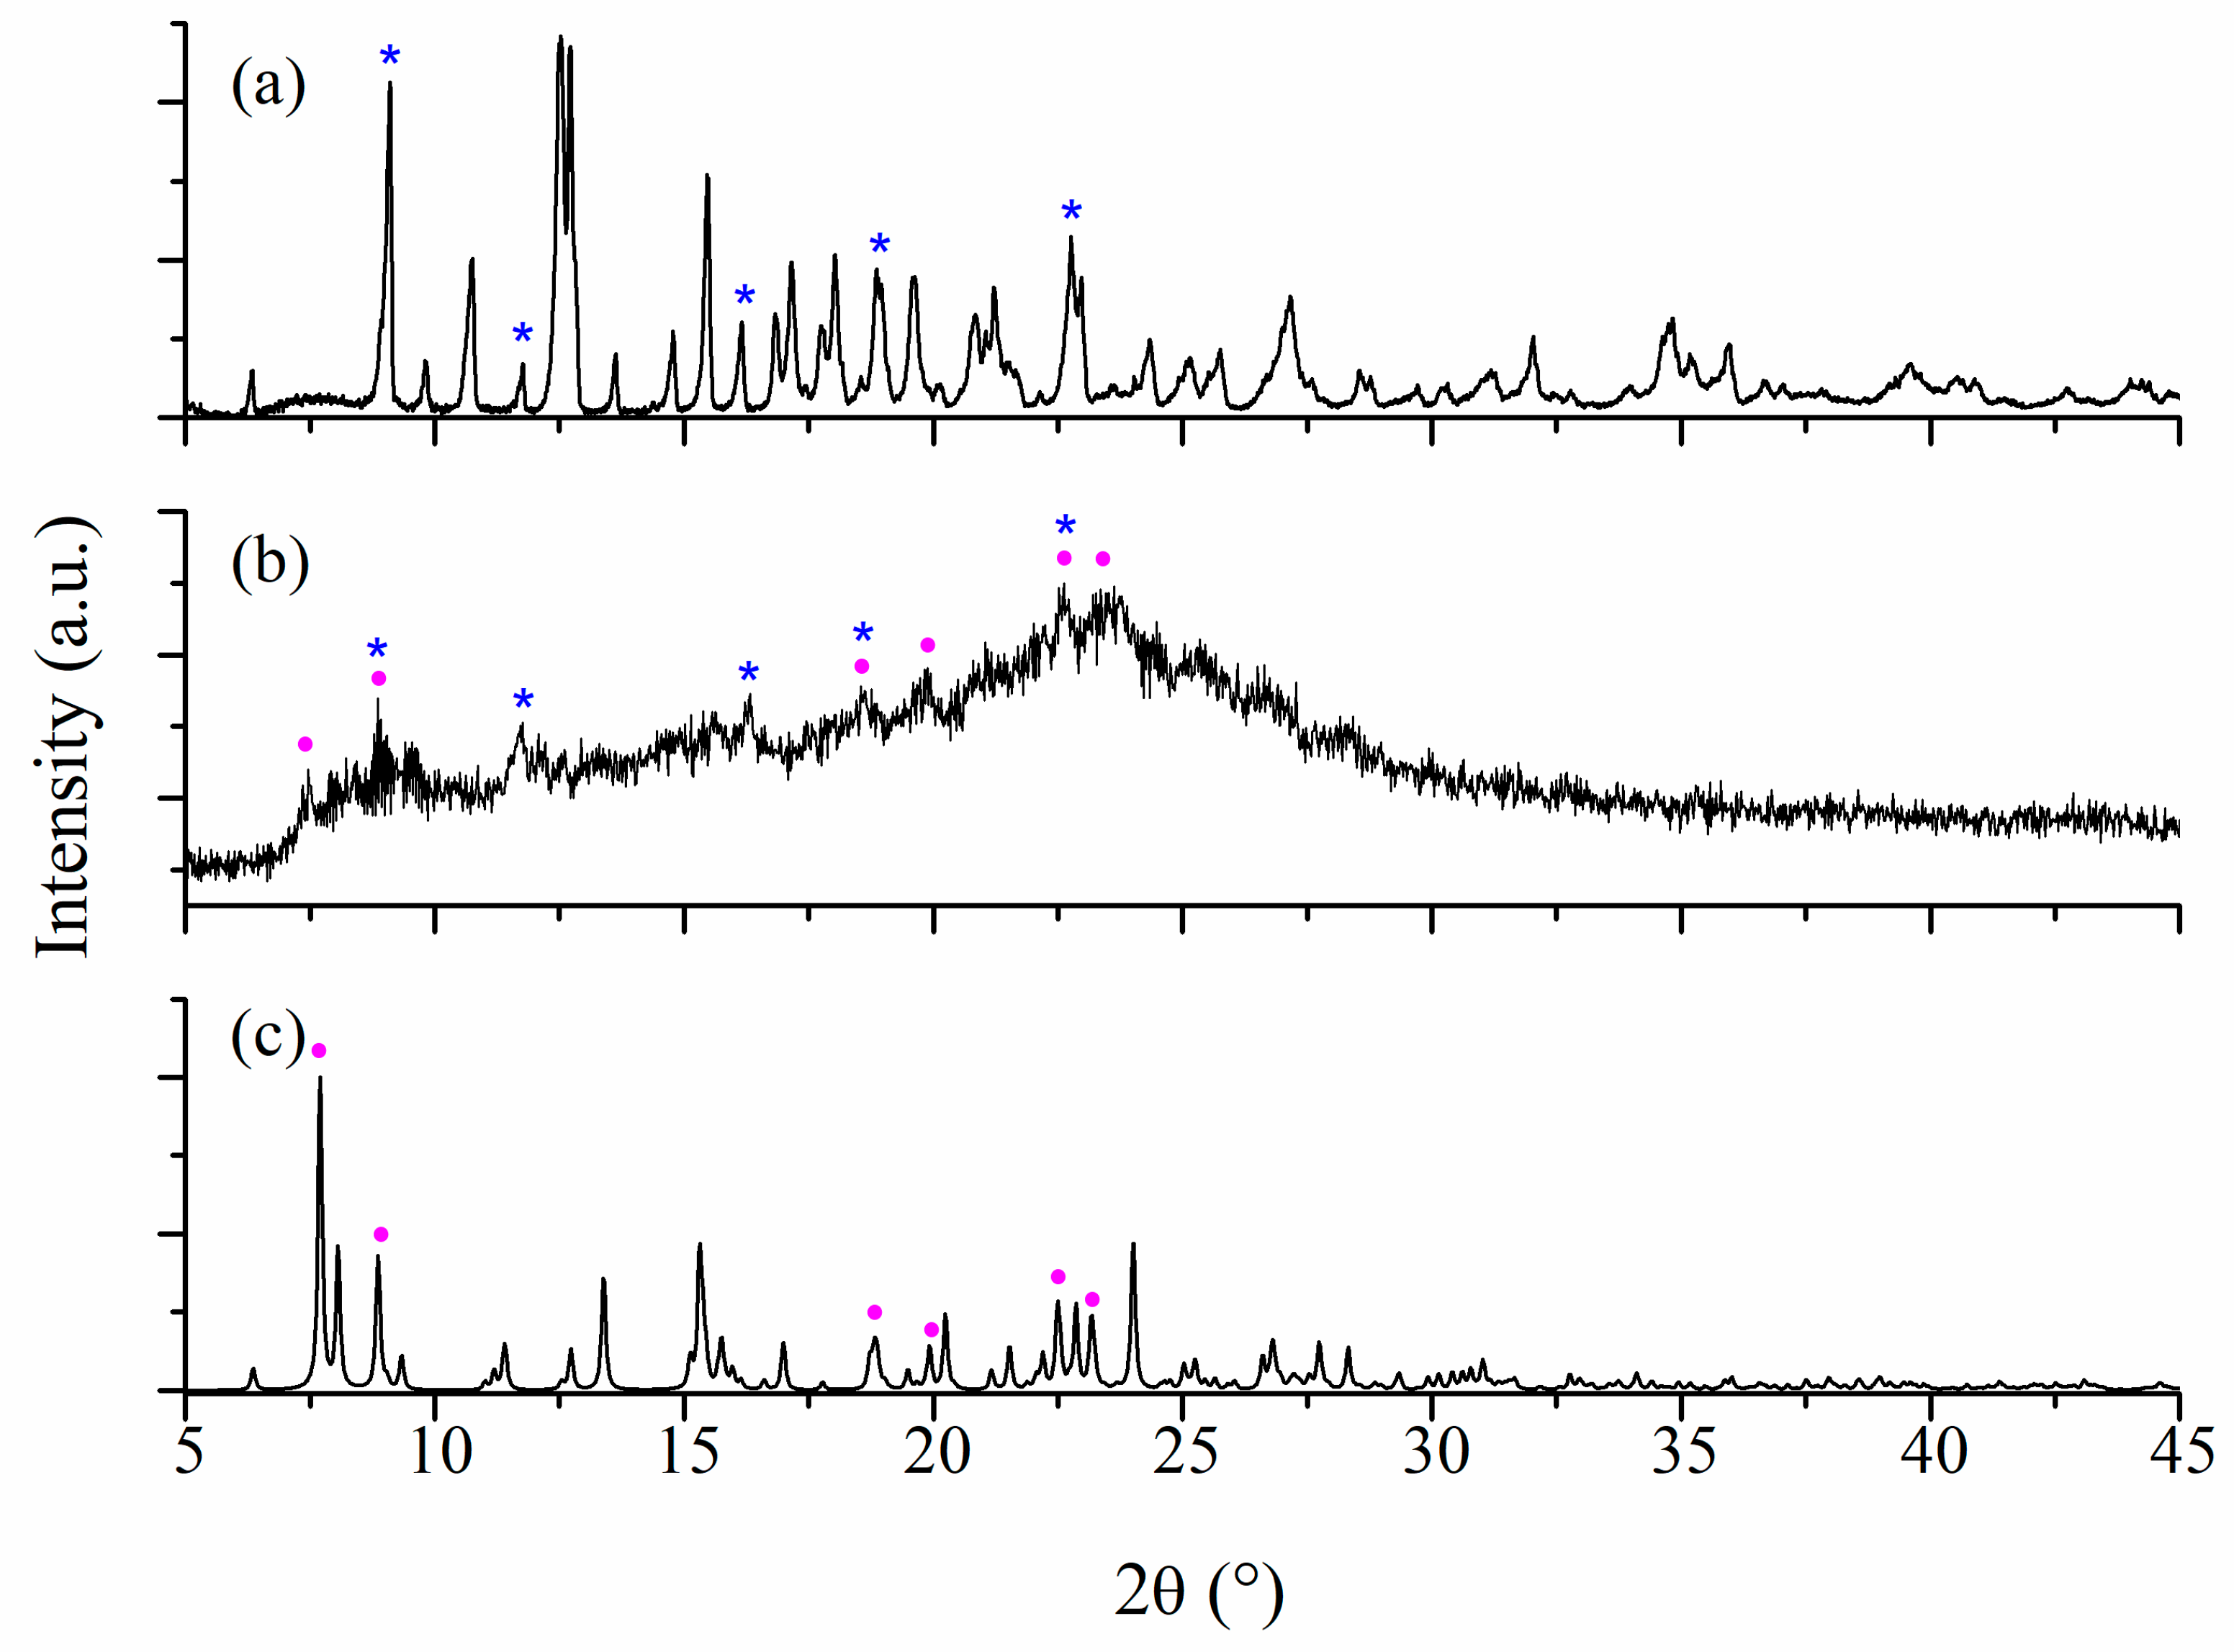
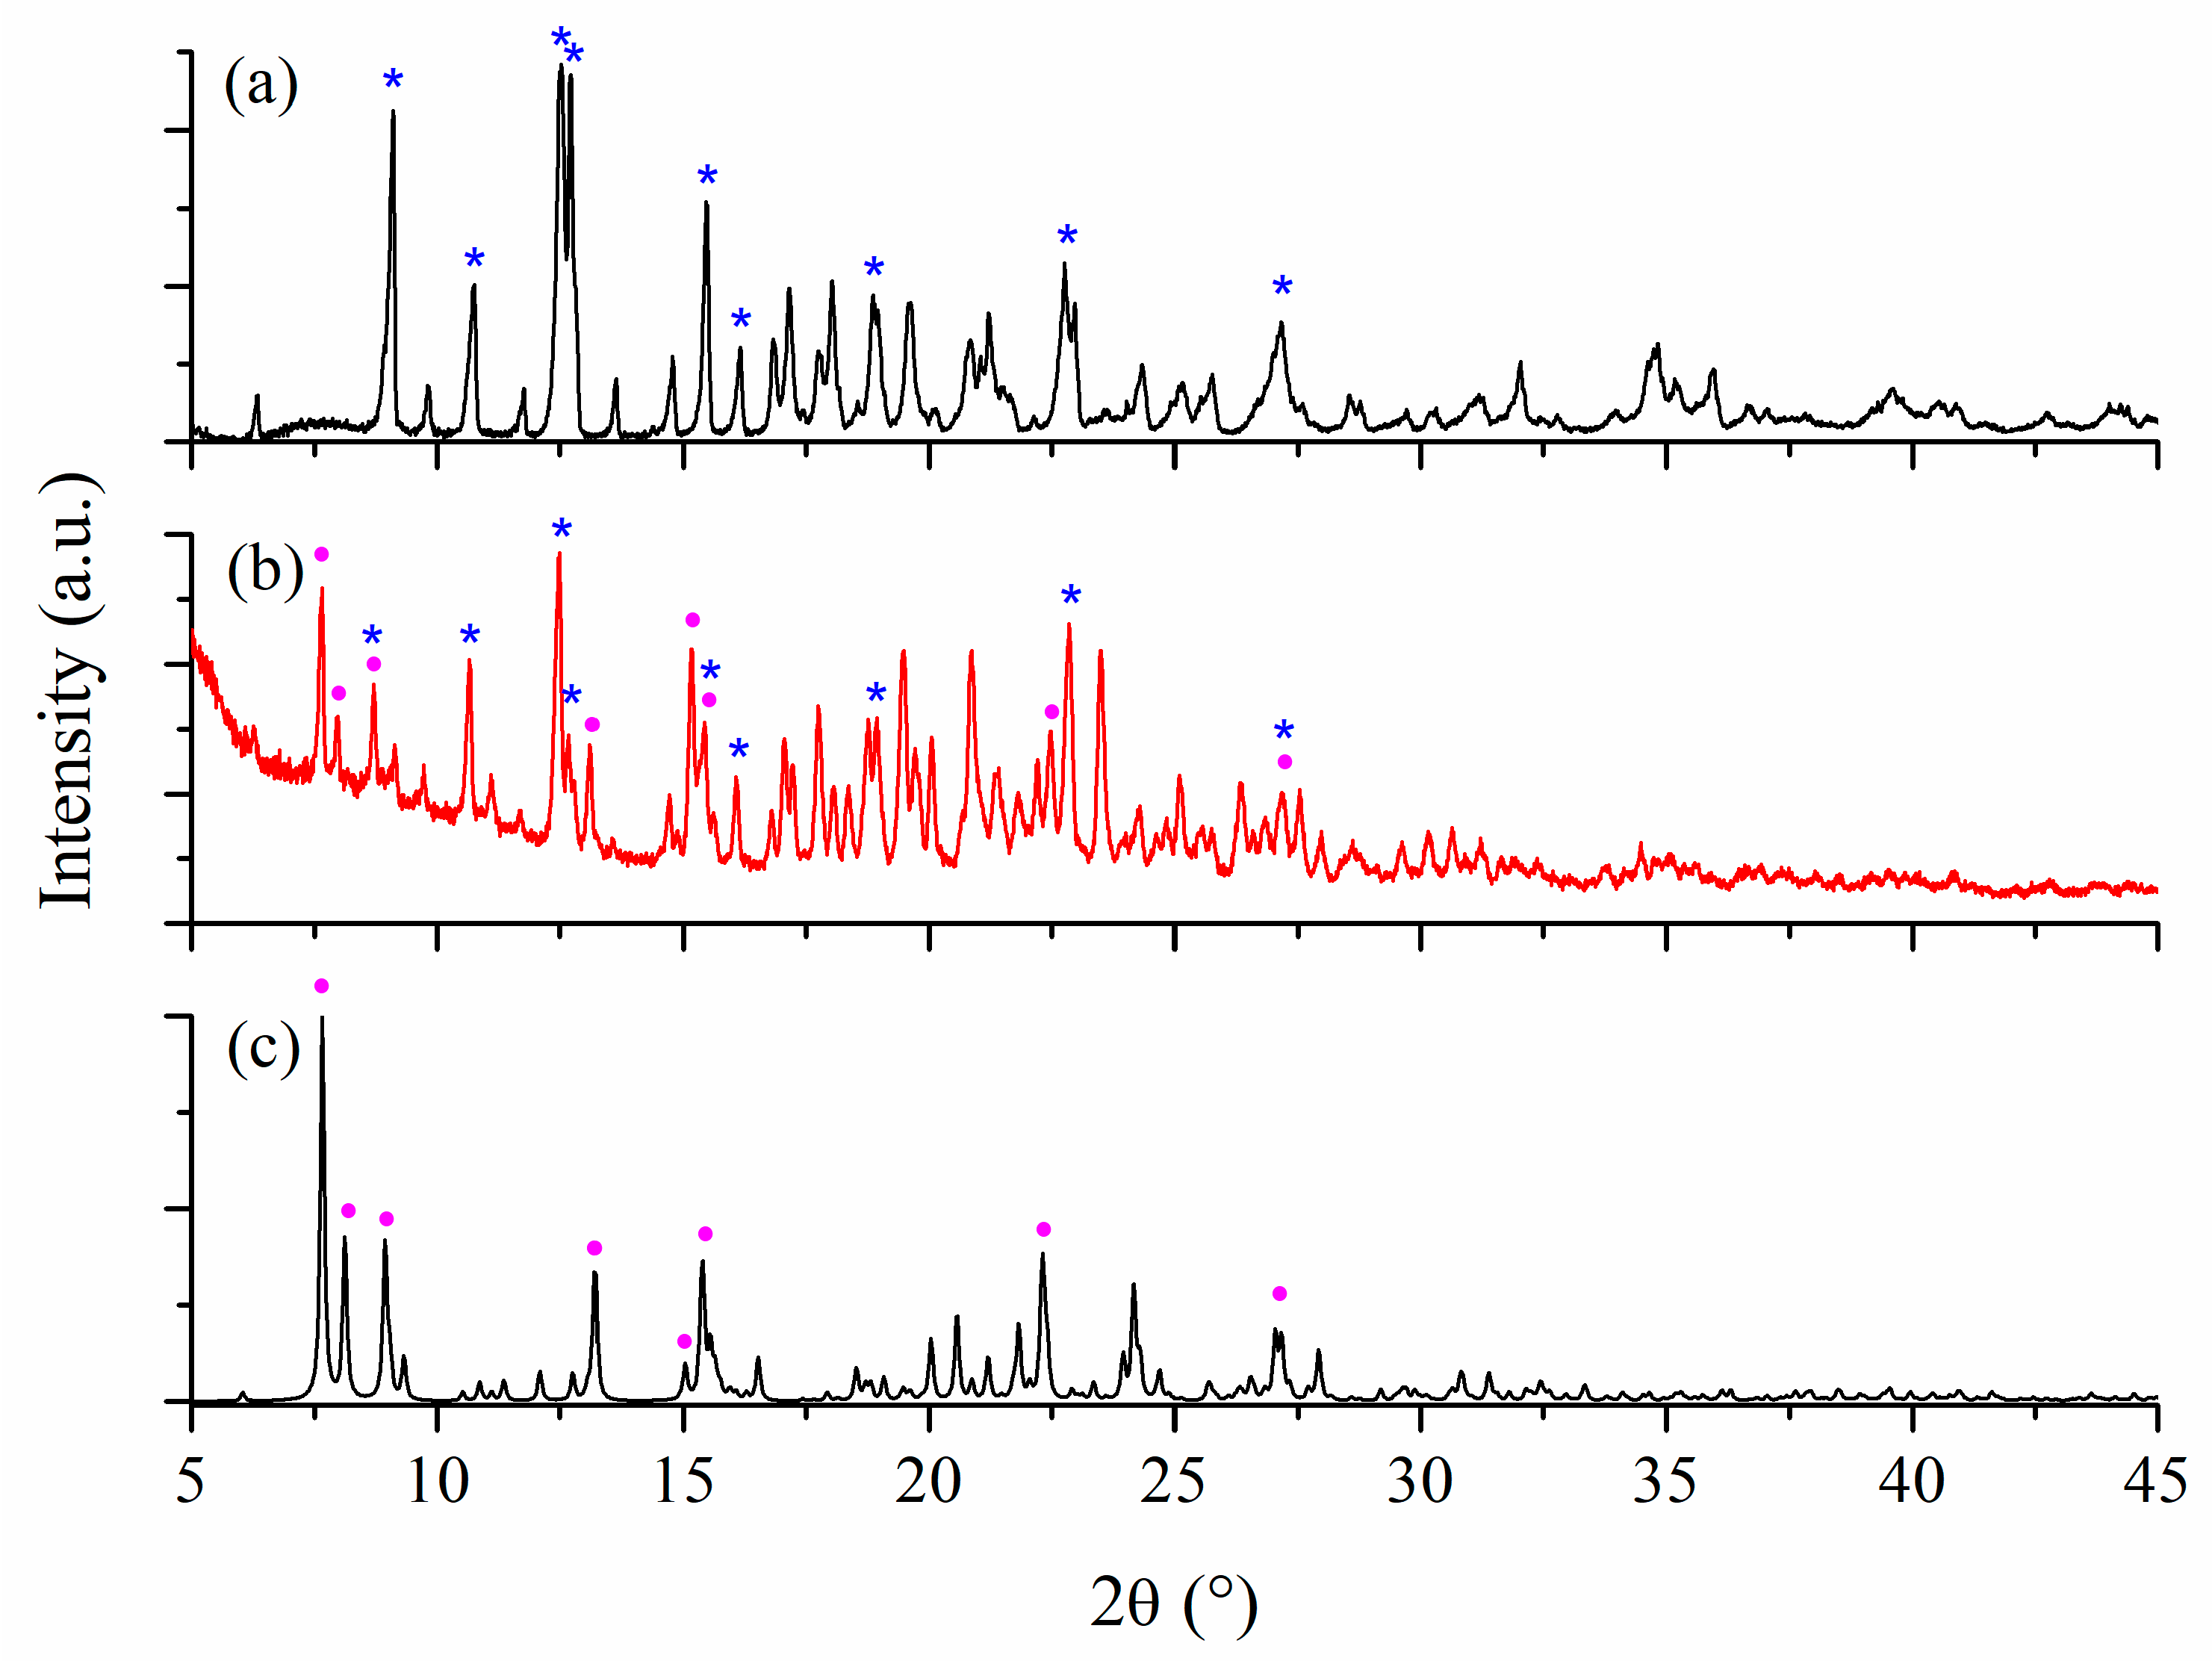
Powder XRD Studies
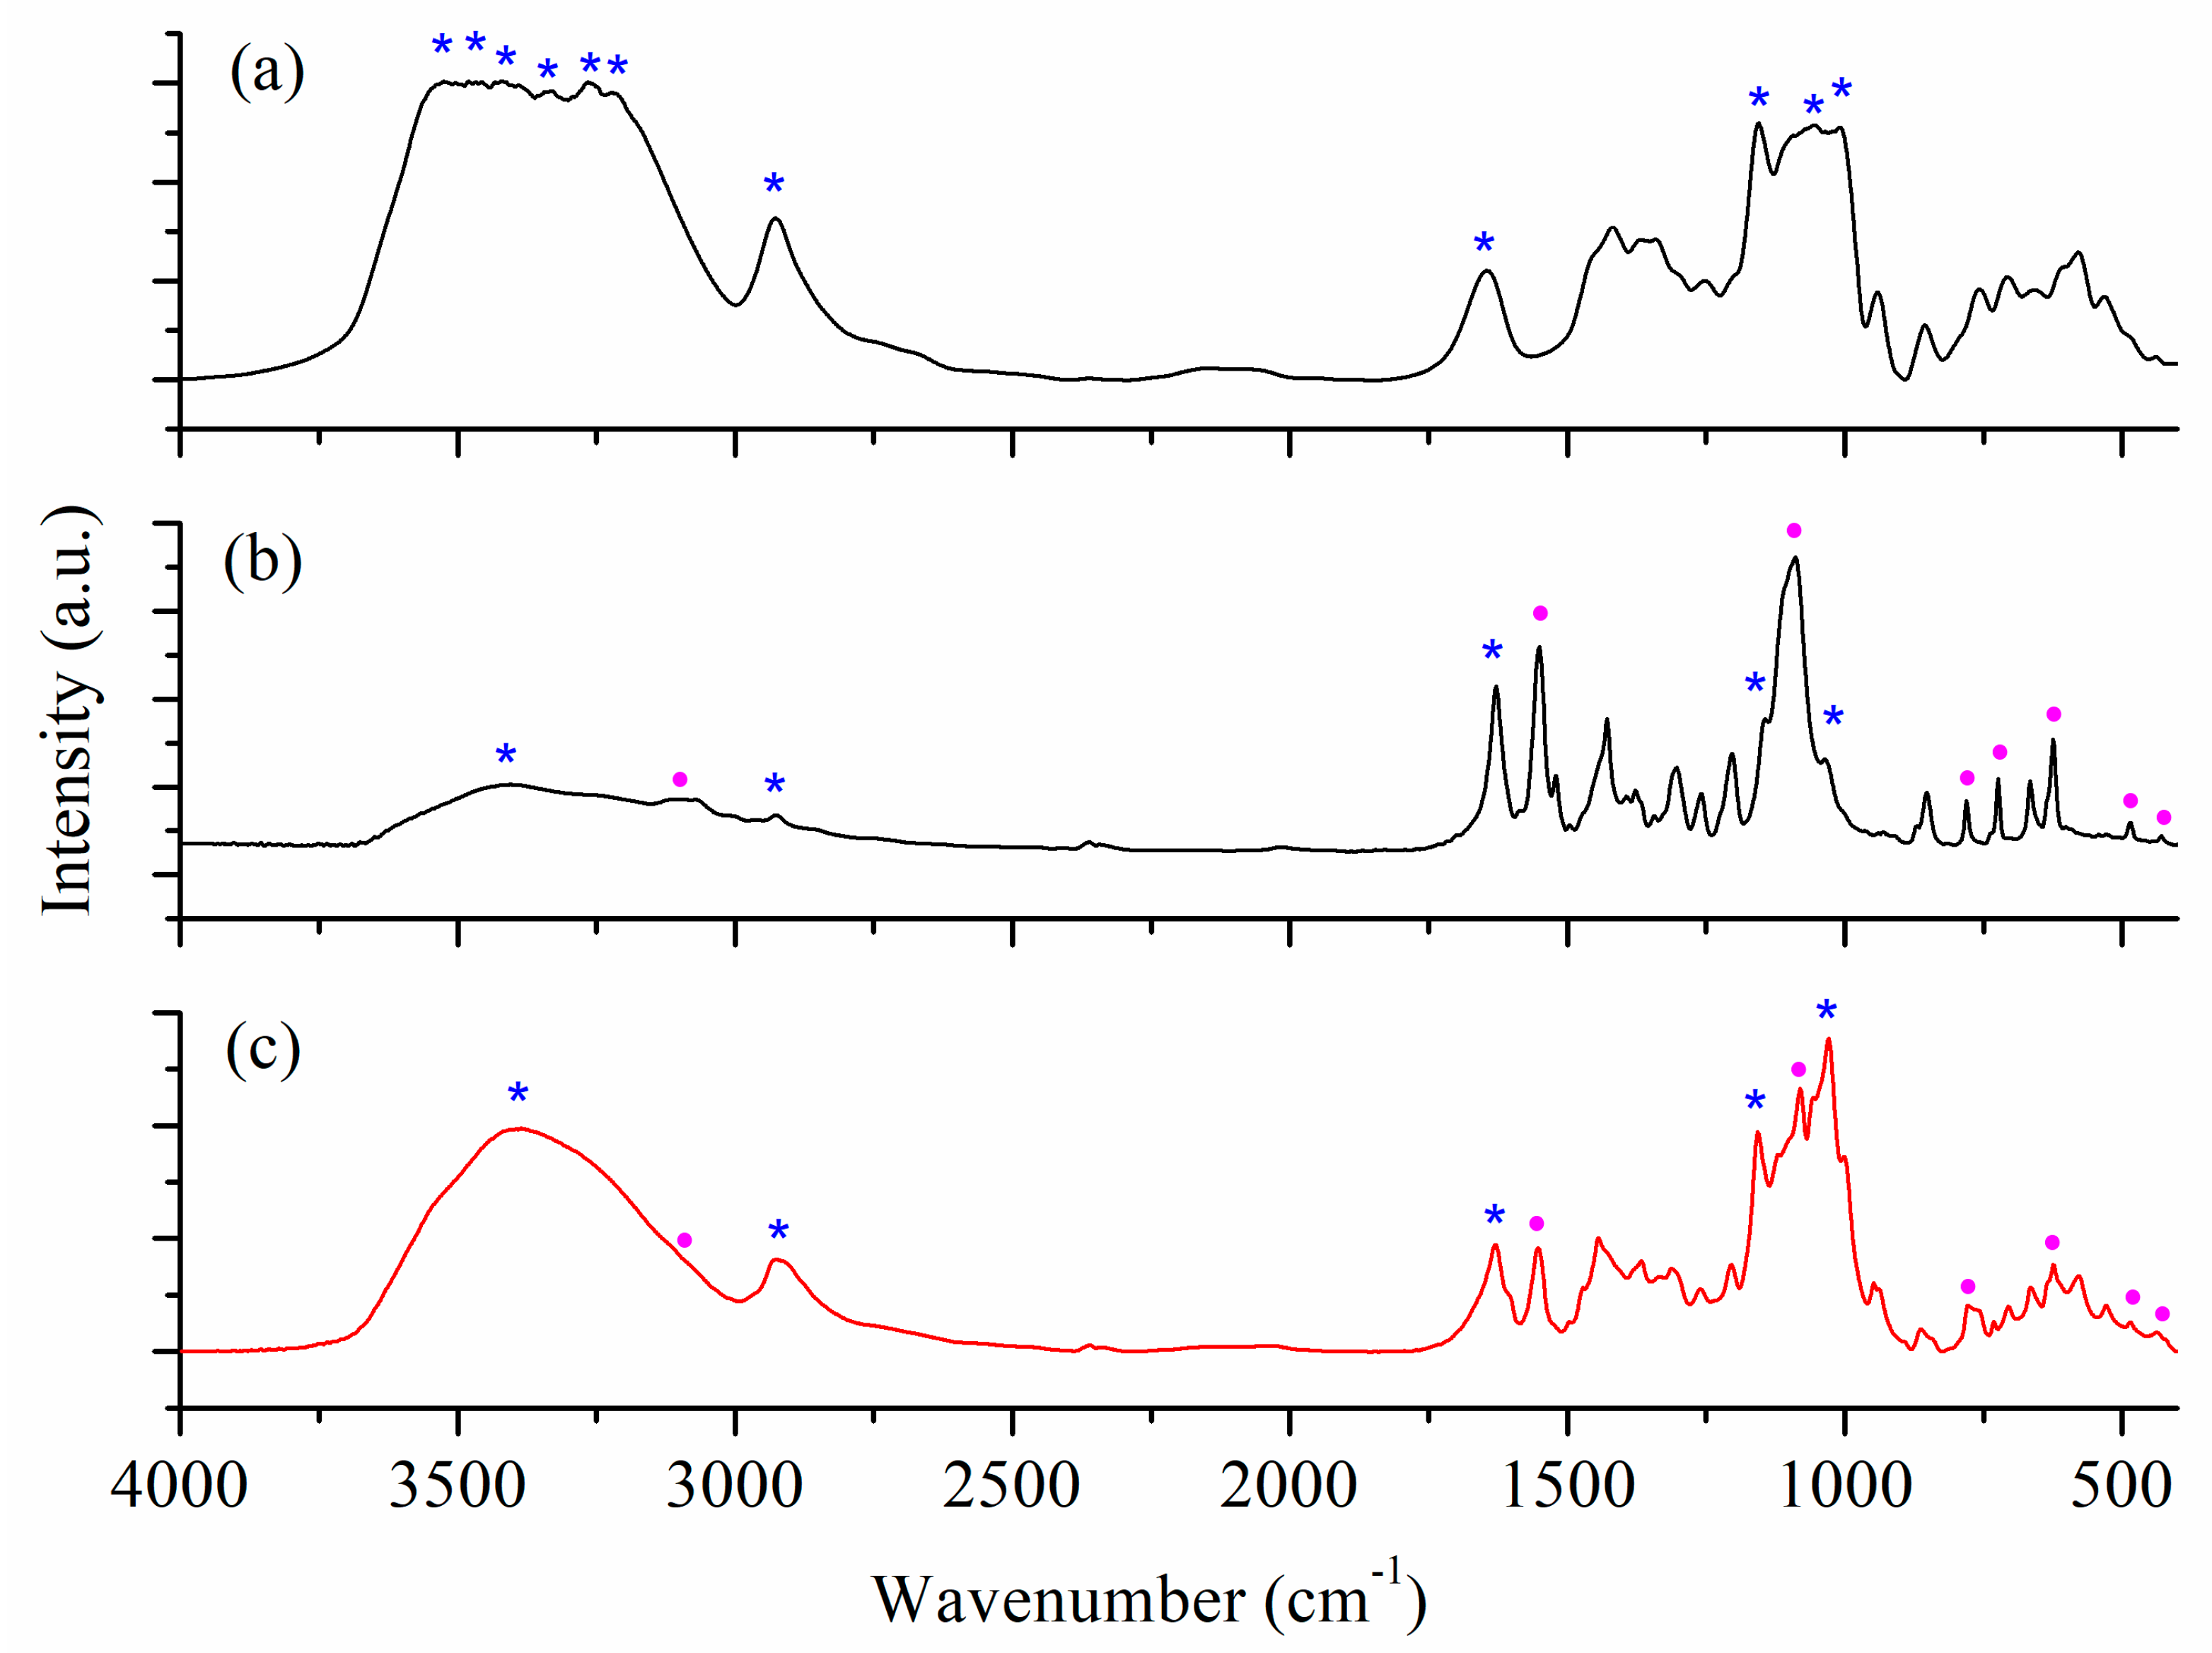
FTIR Spectra
Solid-State UV-Vis Spectra
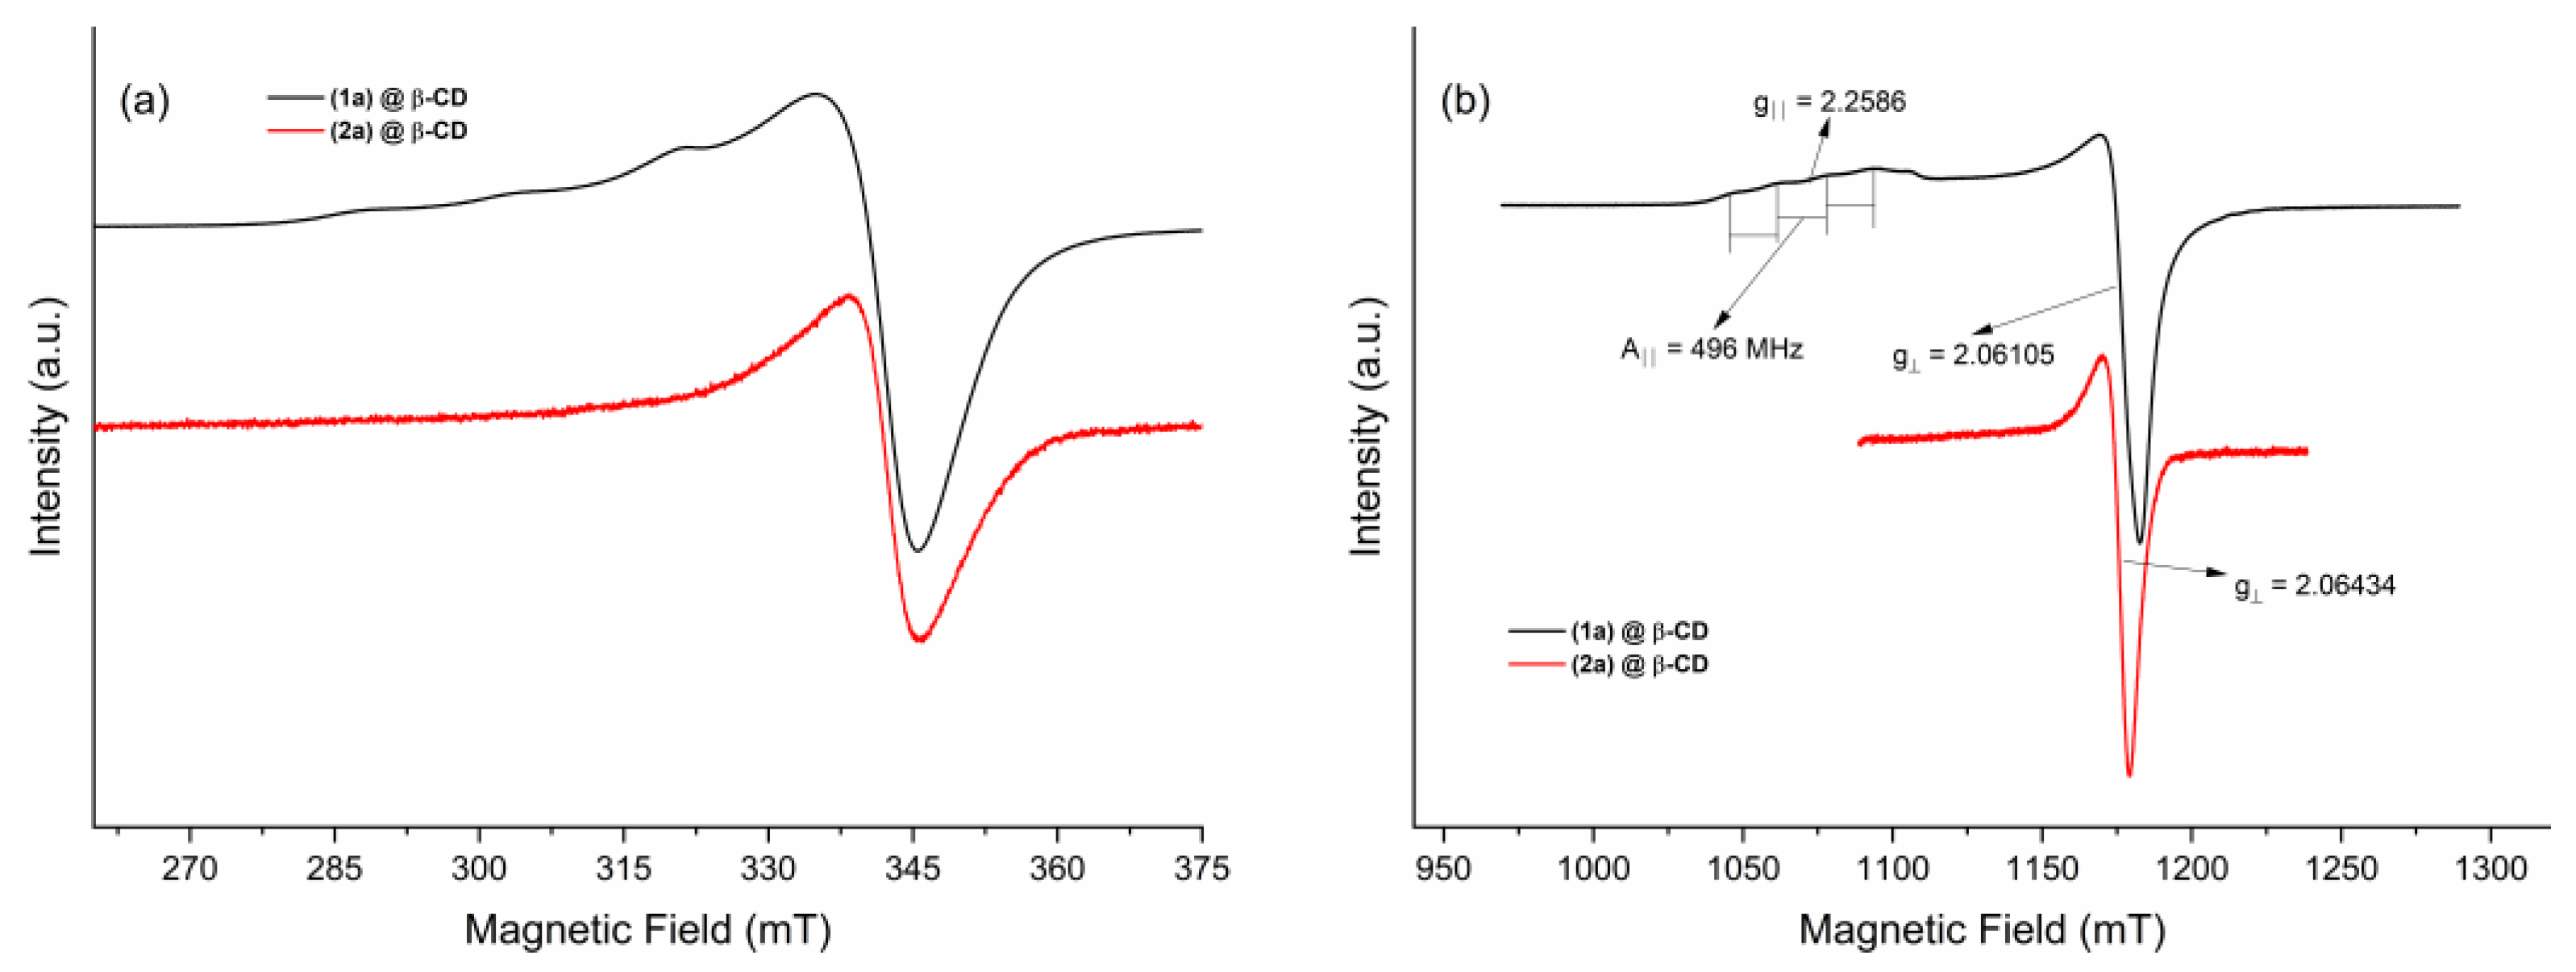
EPR Spectroscopy on Powder Samples
2.1.4. Characterization of Inclusion Complexes in Solution
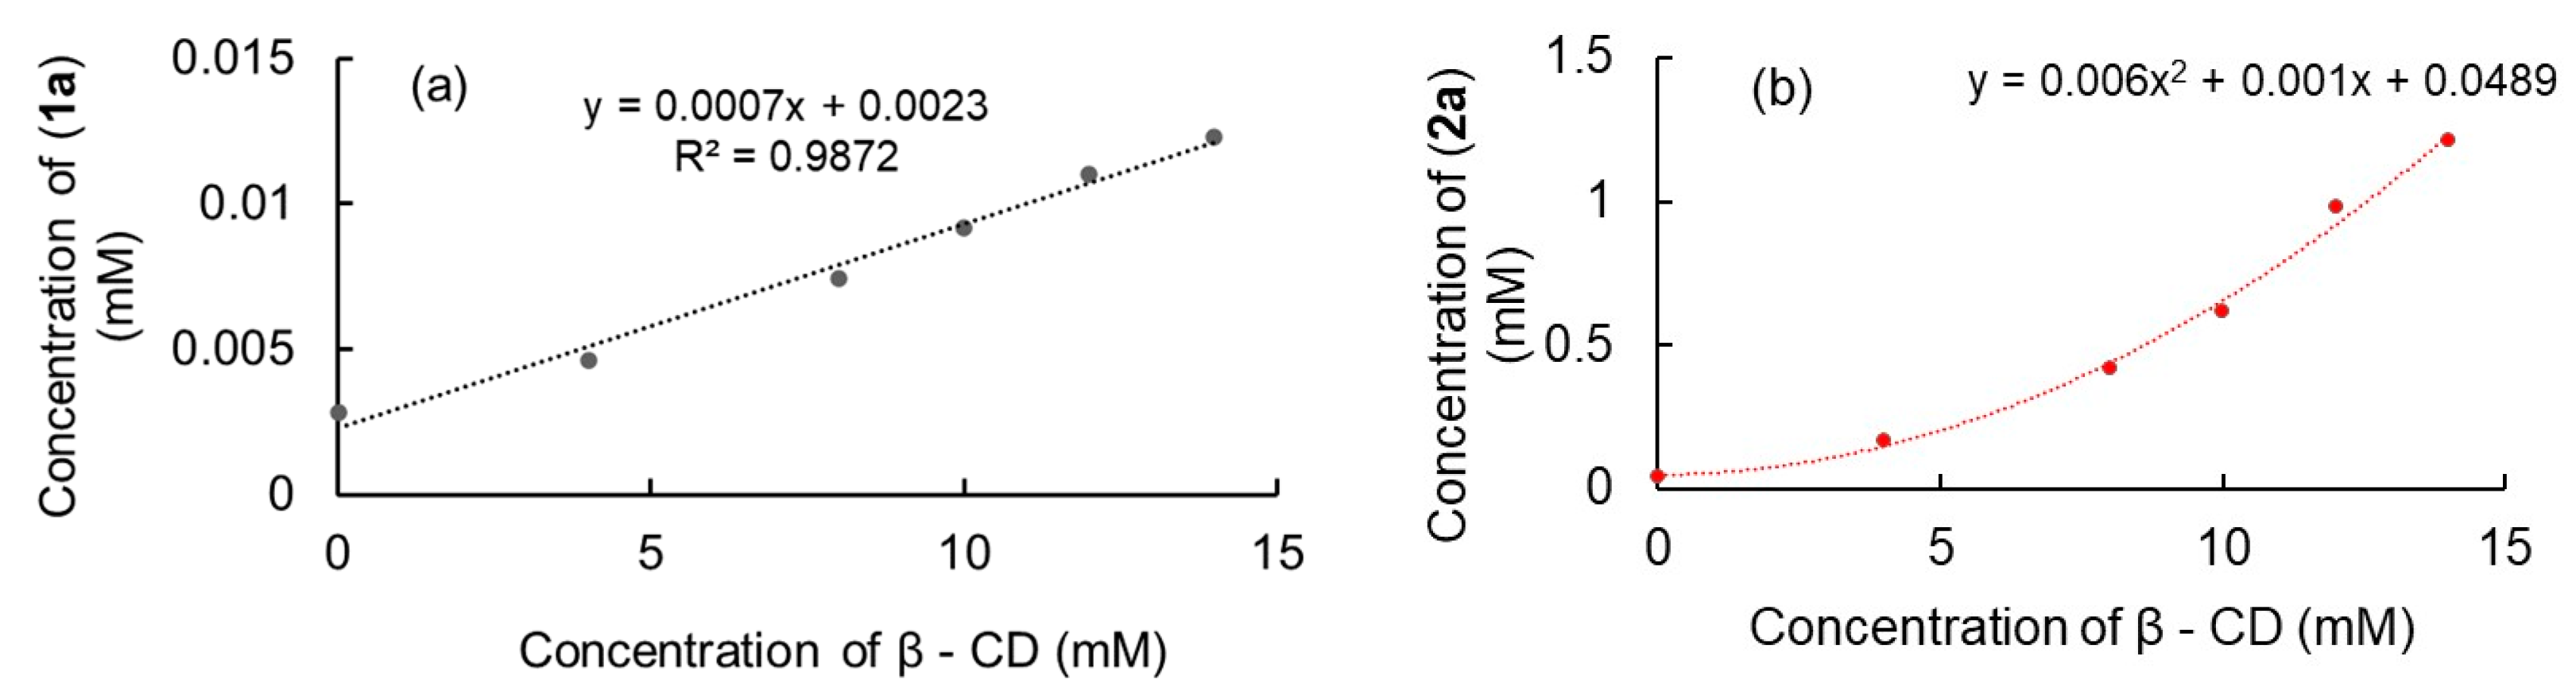
Phase Solubility Study
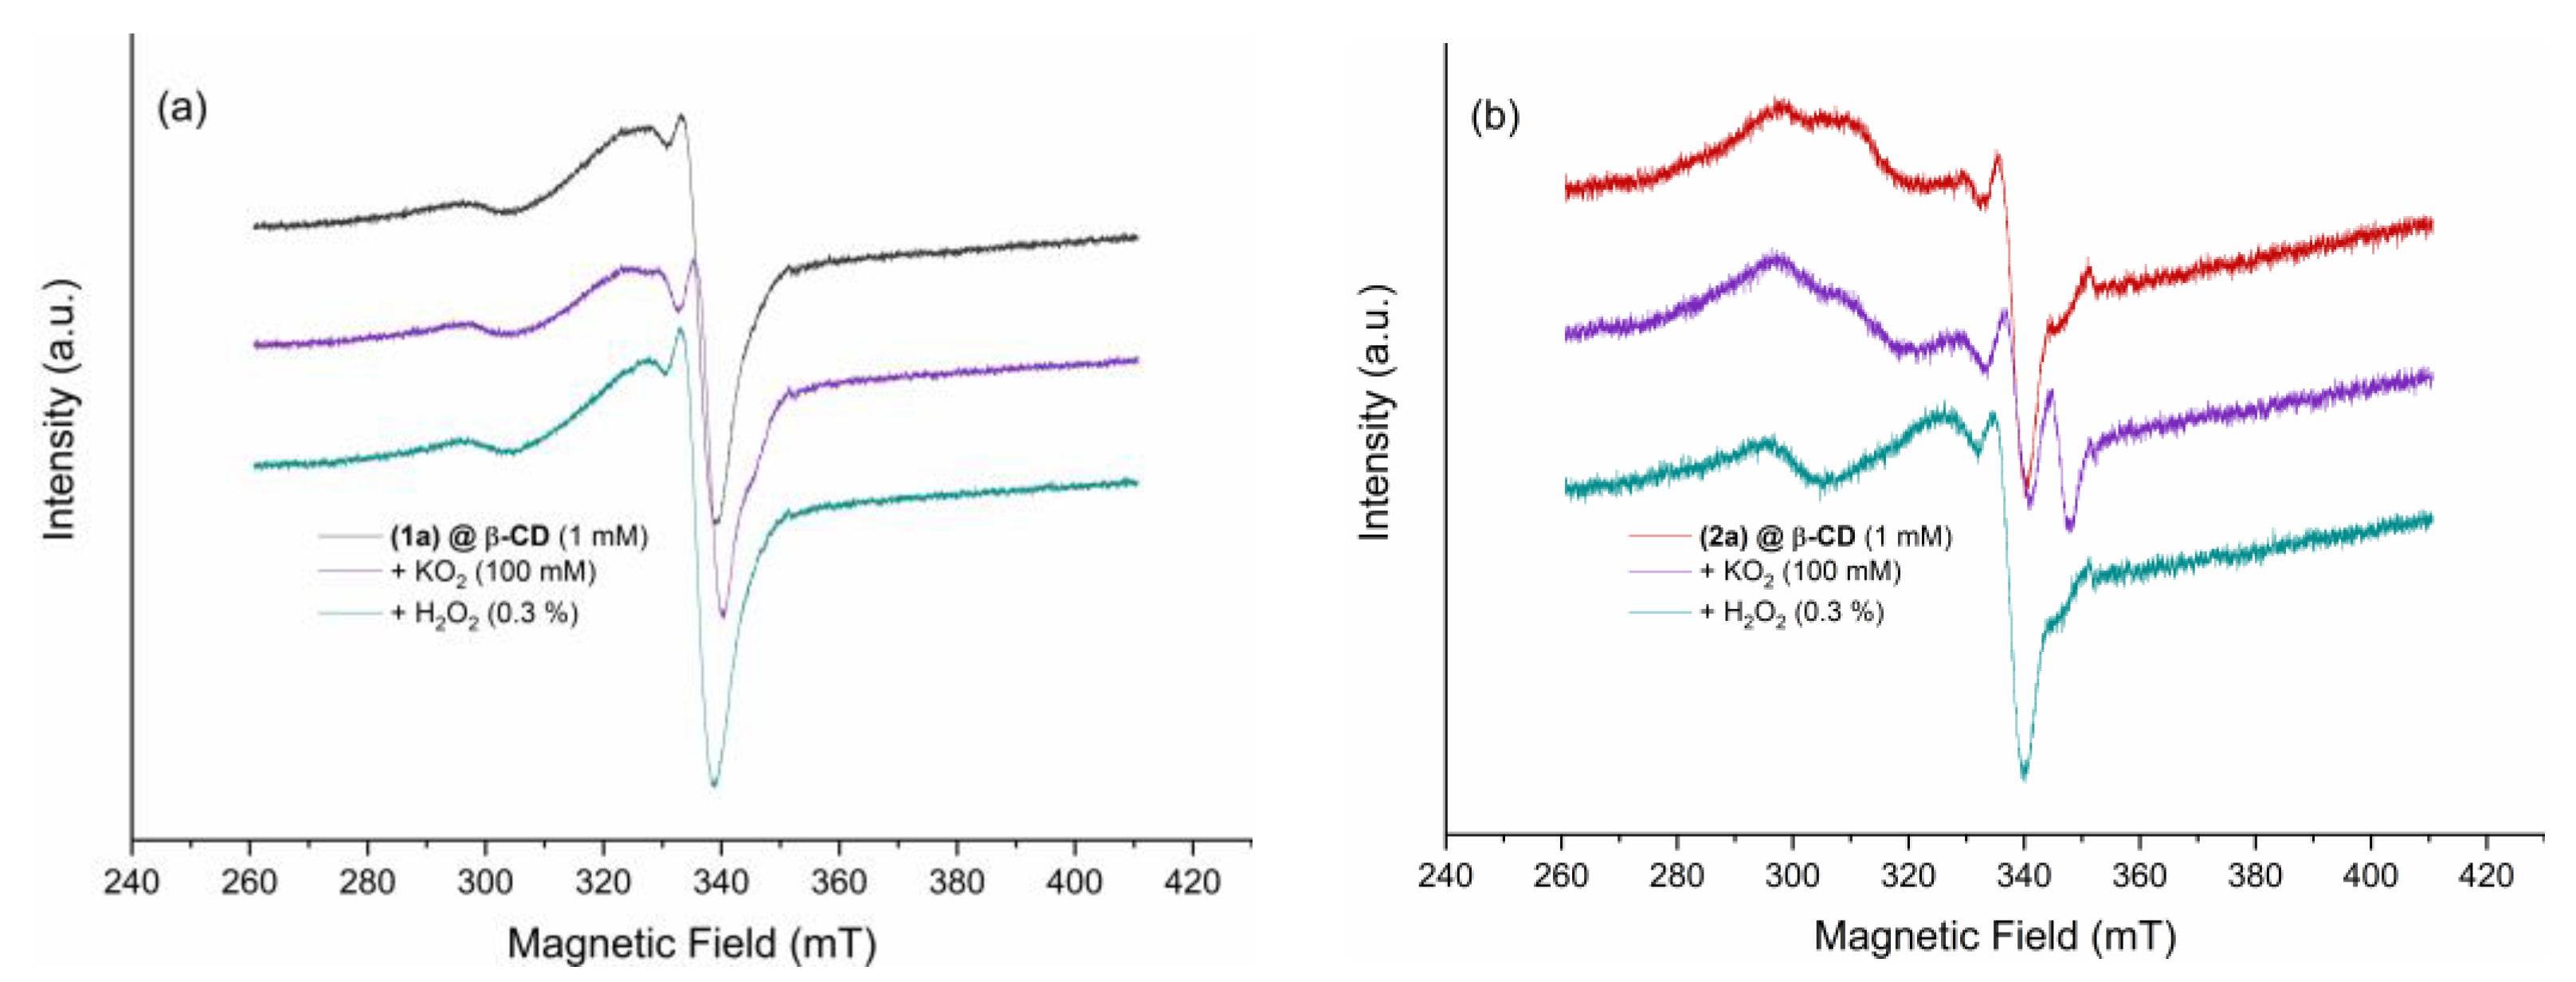
Solution EPR Spectra
2.2. Anti-Melanoma and Antibacterial Activity
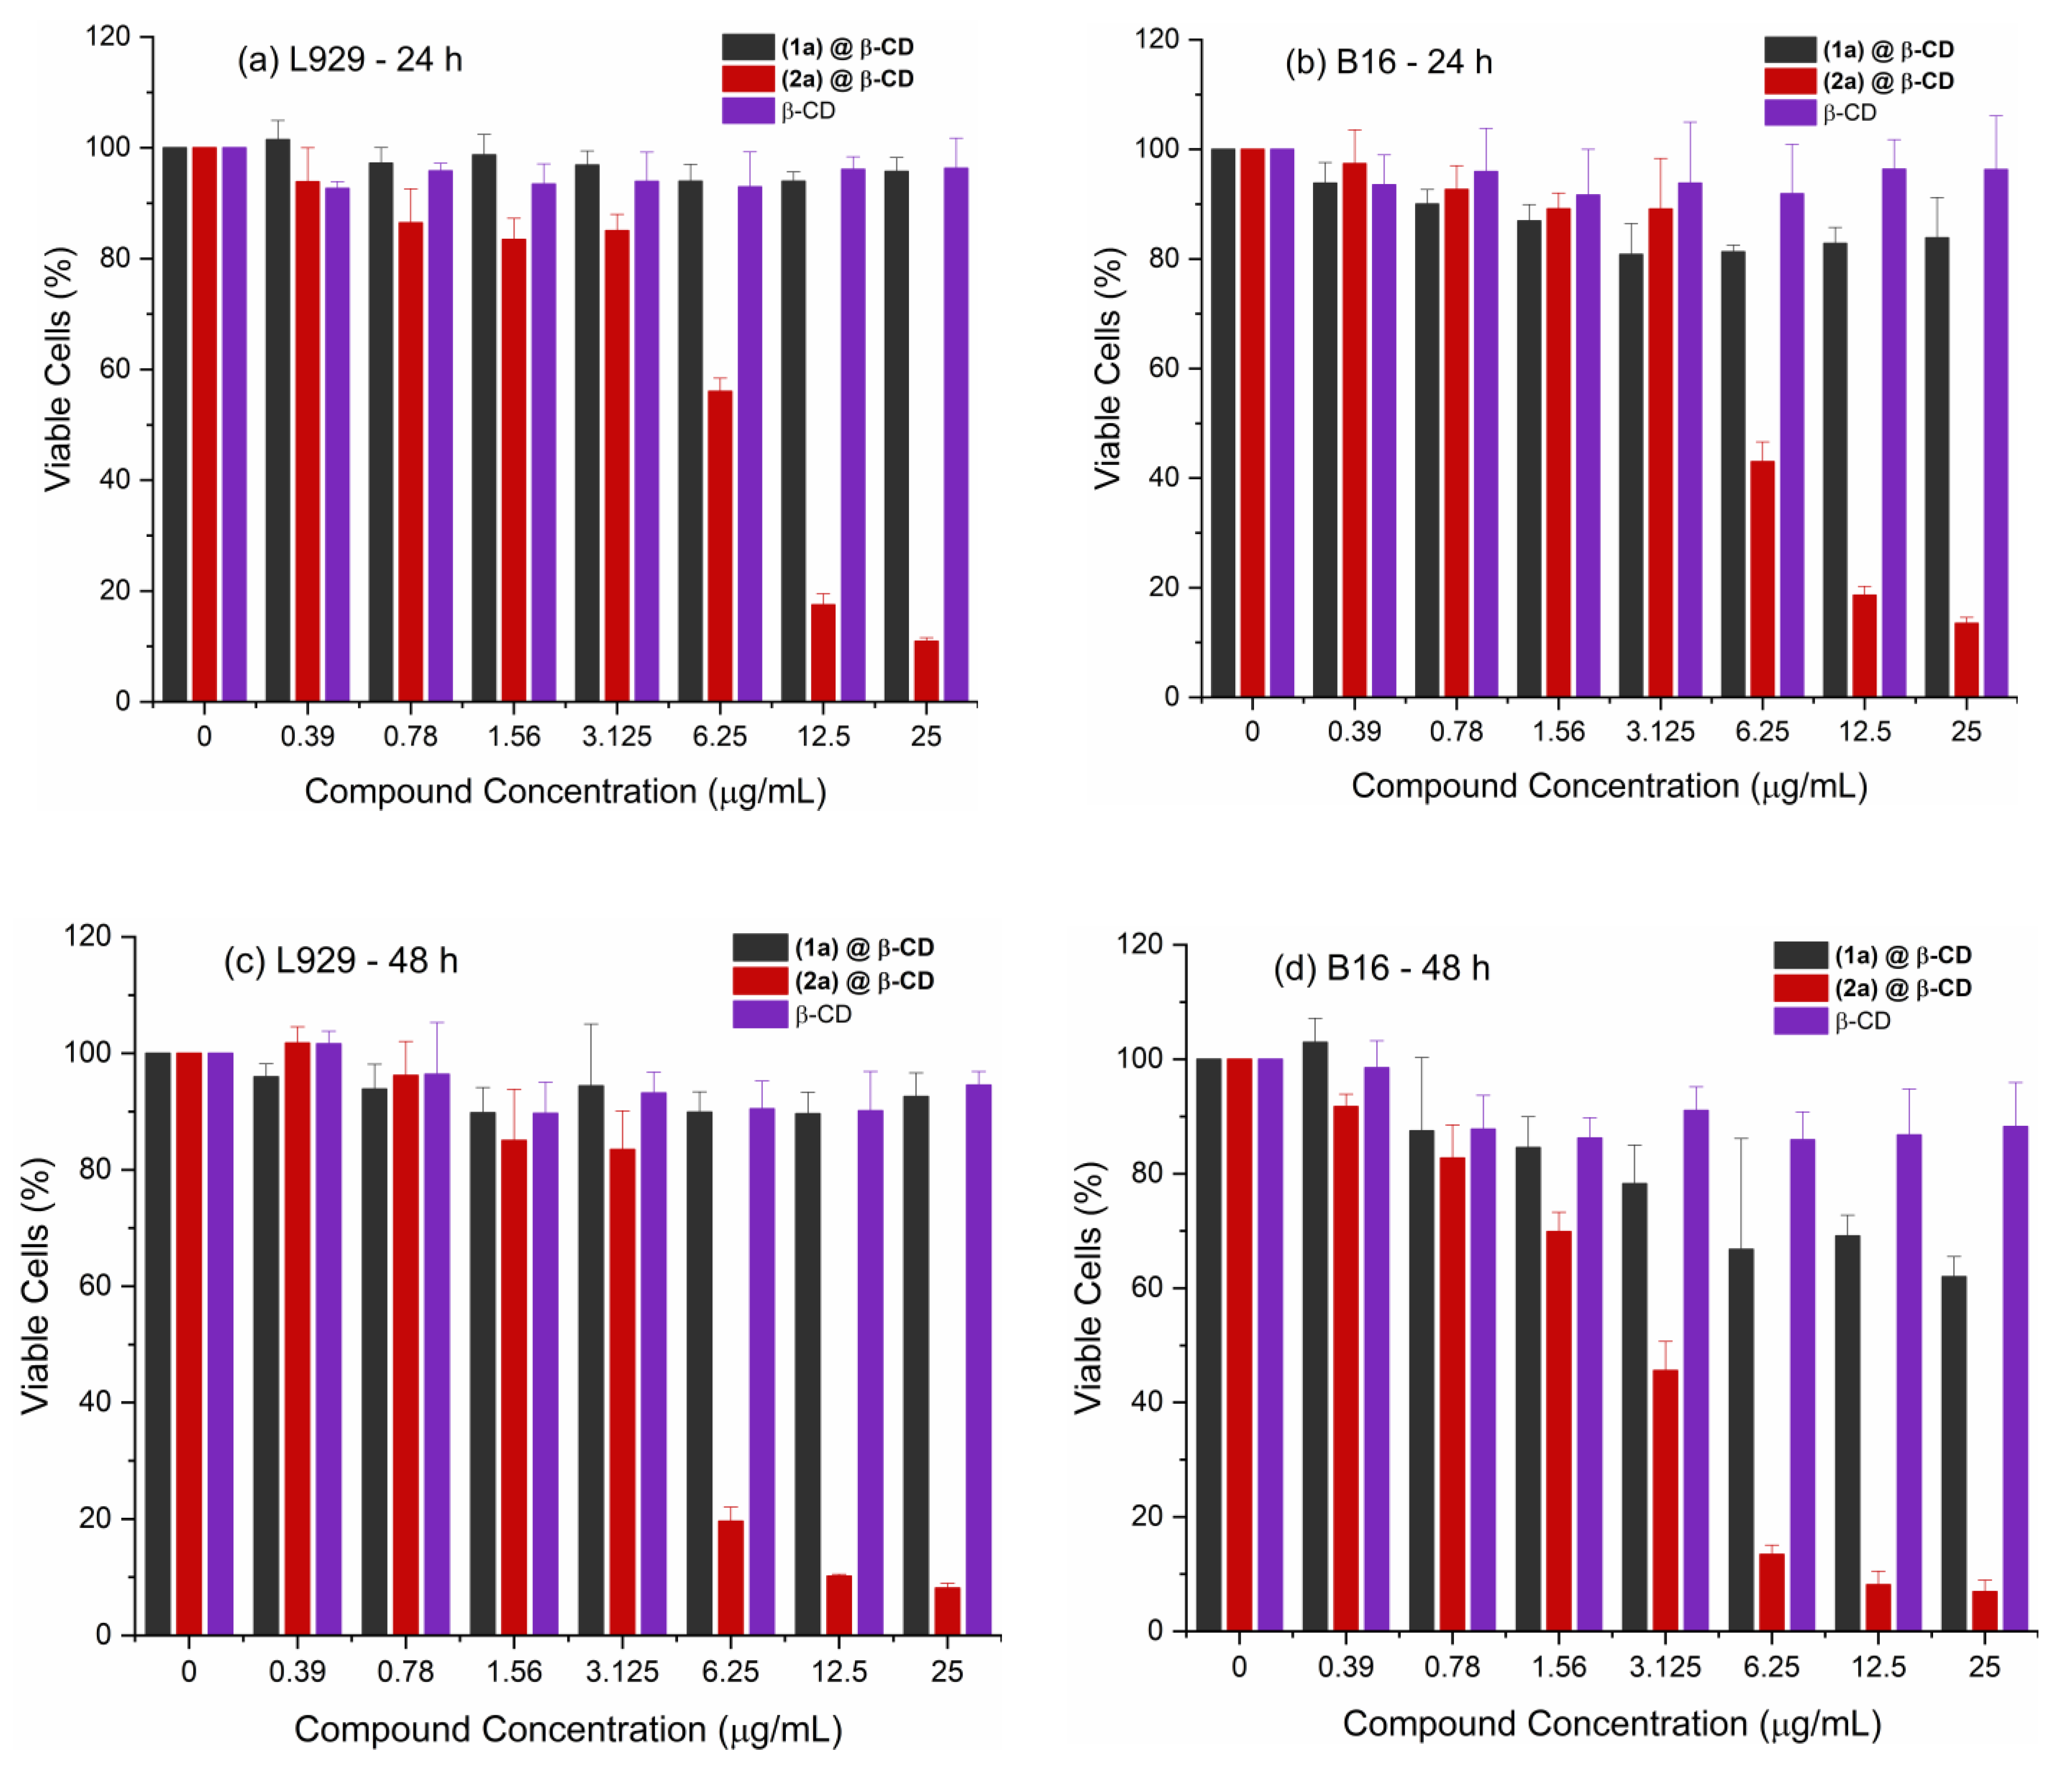
2.2.1. Anti-Melanoma Activity
2.2.2. Antibacterial Activity
3. Materials and Methods
3.1. Materials and Physical Measurements
3.2. Synthesis of Inclusion Complexes
3.3. Study of Host–Guest Equilibrium in Aqueous Solution
3.3.1. Stoichiometry of Inclusion Complexes
3.3.2. Phase-Solubility Studies
3.4. Computational Strategy
3.5. In Vitro Cytotoxicity Assay
3.5.1. Cell Culture Conditions
3.5.2. Cellular Viability Assay
3.5.3. Cell Cycle Analysis
3.6. Antibacterial Activity Assay
3.7. Statistical Analysis
4. Conclusions
Supplementary Materials
Author Contributions
Funding
Institutional Review Board Statement
Informed Consent Statement
Data Availability Statement
Conflicts of Interest
References
- Manzano, C.M.; Nakahata, D.H.; de Paiva, R.E.F. Revisiting metallodrugs for the treatment of skin cancers. Coord. Chem. Rev. 2022, 462, 214506. [Google Scholar] [CrossRef]
- Gupta, A.; Gomes, F.; Lorigan, P. The role for chemotherapy in the modern management of melanoma. Melanoma Manag. 2017, 4, 125. [Google Scholar] [CrossRef] [PubMed]
- Dilruba, S.; Kalayda, G.V. Platinum-based drugs: Past, present and future. Cancer Chemother. Pharmacol. 2016, 77, 1103–1124. [Google Scholar] [CrossRef] [PubMed]
- Uivarosi, V.; Olar, R.; Badea, M. Nanoformulation as a Tool for Improve the Pharmacological Profile of Platinum and Ruthenium Anticancer Drugs. In Descriptive Inorganic Chemistry Researches of Metal Compounds; Akitsu, T., Ed.; INTECH: Rijeka, Croatia, 2017; pp. 1–26. [Google Scholar]
- Santini, C.; Pellei, M.; Gandin, V.; Porchia, M.; Tisato, F.; Marzano, C. Advances in Copper Complexes as Anticancer Agents. Chem. Rev. 2014, 114, 815–862. [Google Scholar] [CrossRef]
- McGivern, T.J.P.; Afsharpour, S.; Marmion, C.J. Copper complexes as artificial DNA metallonucleases: From Sigman’s reagent to next generation anticancer agent? Inorg. Chim. Acta 2018, 472, 12–39. [Google Scholar] [CrossRef]
- Badea, M.; Uivarosi, V.; Olar, R. Improvement in the Pharmacological Profile of Copper Biological Active Complexes by Their Incorporation into Organic or Inorganic Matrix. Molecules 2020, 25, 5830. [Google Scholar] [CrossRef]
- Ioele, G.; Chieffallo, M.; Occhiuzzi, M.A.; De Luca, M.; Garofalo, A.; Ragno, G.; Grande, F. Anticancer Drugs: Recent Strategies to Improve Stability Profile, Pharmacokinetic and Pharmacodynamic Properties. Molecules 2022, 27, 5436. [Google Scholar] [CrossRef]
- Laza-Knoerr, A.L.; Gref, R.; Couvreur, P. Cyclodextrins for drug delivery. J. Drug Target. 2010, 18, 645–656. [Google Scholar] [CrossRef]
- Velhal, K.; Barage, S.; Roy, A.; Lakkakula, J.; Yamgar, R.; Alqahtani, M.S.; Yadav, K.K.; Ahn, Y.; Jeon, B.-H. A Promising Review on Cyclodextrin Conjugated Paclitaxel Nanoparticles for Cancer Treatment. Polymers 2022, 14, 3162. [Google Scholar] [CrossRef]
- Couto, A.R.S.; Ryzhakov, A.; Larsen, K.L.; Loftsson, T. Interaction of native cyclodextrins and their hydroxypropylated derivatives with carbamazepine in aqueous solution. Evaluation of Inclusion Complexes and Aggregates Formation. ACS Omega 2019, 4, 1460–1469. [Google Scholar] [CrossRef]
- Nazia Tarannum, Deepak Kumar, Nitin Kumar, β-Cyclodextrin-Based Nanocomposite Derivatives: State of the Art in Synthesis, Characterization and Application in Molecular Recognition. Chem. Select 2022, 7, e202200140. [CrossRef]
- Nadar, S.S.; Vaidya, L.; Maurya, S.; Rathod, V.K. Polysaccharide based metal organic frameworks (polysaccharide–MOF): A review. Coord. Chem. Rev. 2019, 396, 1–21. [Google Scholar] [CrossRef]
- Jacob, S.; Nair, A.B. Cyclodextrin complexes: Perspective from drug delivery and formulation. Drug Dev. Res. 2018, 79, 201–217. [Google Scholar] [CrossRef]
- Morin-Crini, N.; Fourmentin, S.; Fenyvesi, É.; Lichtfouse, E.; Torri, G.; Fourmentin, M.; Crini, G. 130 years of cyclodextrin discovery for health, food, agriculture, and the industry: A review. Environ. Chem. Lett. 2021, 19, 2581–2617. [Google Scholar] [CrossRef]
- Topuz, F.; Uyar, T. Advances in the development of cyclodextrin-based nanogels/microgels for biomedical applications: Drug delivery and beyond. Carbohydr. Polym. 2022, 297, 120033. [Google Scholar] [CrossRef]
- Xu, H.; Nie, W.; Dai, L.; Luo, R.; Lin, D.; Zhang, M.; Zhang, J.; Gao, F. Recent advances in natural polaccharides-based controlled release nanosystems for anticancer phototherapy. Carbohydr. Polym. 2023, 301, 120311. [Google Scholar] [CrossRef] [PubMed]
- Yadav, N.; Francis, A.P.; Priya, V.V.; Patil, S.; Mustaq, S.; Khan, S.S.; Alzahrani, K.J.; Banjer, H.J.; Mohan, S.K.; Mony, U.; et al. Polysaccharide-Drug Conjugates: A Tool for Enhanced Cancer Therapy. Polymers 2022, 14, 950. [Google Scholar] [CrossRef]
- Narayanan, G.; Shen, J.; Matai, I.; Sachdev, A.; Boy, R.; Tonelli, A.E. Cyclodextrin-based nanostructures. Prog. Mater. Sci. 2022, 124, 100869. [Google Scholar] [CrossRef]
- Gidwani, B.; Vyas, A. A Comprehensive Review on Cyclodextrin-Based Carriers for Delivery of Chemotherapeutic Cytotoxic Anticancer Drugs. BioMed Res. Int. 2015, 2015, 198268. [Google Scholar] [CrossRef]
- Li, H.; Wang, J.; Wu, C.; Wang, L.; Chen, Z.-S.; Cui, W. The combination of disulfiram and copper for cancer treatment. Drug Discov. Today 2020, 25, 1099–1108. [Google Scholar] [CrossRef]
- Said Suliman, A.; Khoder, M.; Tolaymat, I.; Webster, M.; Alany, R.G.; Wang, W.; Elhissi, A.; Najlah, M. Cyclodextrin Diethyldithiocarbamate Copper II Inclusion Complexes: A Promising Chemotherapeutic Delivery System against Chemoresistant Triple Negative Breast Cancer Cell Lines. Pharmaceutics 2021, 13, 84. [Google Scholar] [CrossRef]
- Gaurav, C.; Goutam, R.; Rohan, K.N.; Sweta, K.T.; Abhay, C.S.; Amit, G.K. (Copper–curcumin) β-cyclodextrin vaginal gel: Delivering a novel metal–herbal approach for the development of topical contraception prophylaxis. Eur. J. Pharm. Sci. 2014, 65, 183–191. [Google Scholar] [CrossRef] [PubMed]
- Zhang, J.; Qu, L.; Lin, Y.; Guo, Z.; Cai, Z.; Ge, F. The preparation of antibacterial eco-friendly bio-based PTT-based β-cyclodextrin. SAGE J. 2021, 92, 2800–2807. [Google Scholar] [CrossRef]
- Ruta, L.L.; Farcasanu, I.C.; Bacalum, M.; Răileanu, M.; Rostas, A.M.; Daniliuc, C.; Chifiriuc, M.C.; Măruțescu, L.; Popa, M.; Badea, M.; et al. Biological Activity of Triazolopyrimidine Copper(II) Complexes Modulated by an Auxiliary N-N-Chelating Heterocycle Ligands. Molecules 2021, 26, 6772. [Google Scholar] [CrossRef] [PubMed]
- Saha, S.; Roy, A.; Roy, K.; Roy, M.N. Study to explore the mechanism to form inclusion complexes of β-cyclodextrin with vitamin molecules. Sci. Rep. 2016, 6, 35764. [Google Scholar] [CrossRef]
- Kromann, J.C.; Christensen, A.S.; Steinmann, C.; Korth, M.; Jensen, J.H. A third-generation dispersion and third-generation hydrogen bonding corrected PM6 method: PM6-D3H+. PeerJ 2014, 2, e449. [Google Scholar] [CrossRef]
- Barca, G.M.J.; Bertoni, C.; Carrington, L.; Datta, D.; De Silva, N.; Deustua, J.E.; Fedorov, D.G.; Gour, J.R.; Gunina, A.O.; Guidez, E.; et al. Recent developments in the general atomic and molecular electronic structure system. J. Chem. Phys. 2020, 152, 154102. [Google Scholar] [CrossRef]
- Trott, O.; Olson, A.J. AutoDock Vina: Improving the speed and accuracy of docking with a new scoring function, efficient optimization and multithreading. J. Comp. Chem. 2010, 31, 455–461. [Google Scholar] [CrossRef] [PubMed]
- Eberhardt, J.; Santos Martins, D.; Tillack, A.F.; Forli, S. AutoDock Vina 1.2.0: New Docking Methods, Expanded Force Field and Python Bindings. J. Chem. Inf. Model. 2021, 61, 3891–3898. [Google Scholar] [CrossRef]
- Hathaway, B.J. Oxyanions. In Comprehensive Coordination Chemistry, 1st ed.; Wilkinson, G., Gillard, R.D., McCleverty, J.A., Eds.; Pergamon Press: Oxford, UK, 1987; pp. 413–434. [Google Scholar]
- Lever, A.B.P. Inorganic Electronic Spectroscopy; Elsevier: Amsterdam, The Netherlands, 1986; pp. 555–572. [Google Scholar]
- Hathaway, B.J. A new look at the stereochemistry and electronic properties of complexes of the copper(II) ion. Struct Bond. 1984, 57, 55–118. [Google Scholar] [CrossRef]
- Garribba, E.; Micera, G. The Determination of the Geometry of Cu(II) Complexes: An EPR Spectroscopy Experiment. J. Chem. Educ. 2006, 83, 1229. [Google Scholar] [CrossRef]
- Saokham, P.; Muankaew, C.; Jansook, P.; Loftsson, T. Solubility of Cyclodextrins and Drug/Cyclodextrin Complexes. Molecules 2018, 23, 1161. [Google Scholar] [CrossRef] [PubMed]
- Peeters, J.; Neeskens, P.; Tollenaere, J.P.; Van Remoortere, P.; Brewster, M.E. Characterization of the interaction of 2-hydroxypropyl-β-cyclodextrin with itraconazole at pH 2, 4, and 7. J. Pharm. Sci. 2002, 91, 1414–1422. [Google Scholar] [CrossRef] [PubMed]
- Stoll, S.; Schweiger, A. EasySpin, a comprehensive software package for spectral simulation and analysis in EPR. J. Magn. Reson. 2006, 178, 42–55. [Google Scholar] [CrossRef]
- Rajalakshmi, S.; Kiran, M.S.; Unni Nair, B. DNA condensation by copper(II) complexes and their anti-proliferative effect on cancerous and normal fibroblast cells. Eur. J. Med. Chem. 2014, 80, 393–406. [Google Scholar] [CrossRef]
- Hussain, A.; AlAjmi, M.F.; Rehman, M.T.; Amir, S.; Husain, F.M.; Alsalme, A.; Siddiqui, M.A.; AlKhedhairy, A.A.; Khan, R.A. Copper(II) complexes as potential anticancer and Nonsteroidal anti-inflammatory agents: In vitro and in vivo studies. Sci. Rep. 2019, 9, 5237. [Google Scholar] [CrossRef]
- Paul, A.; Sellamuthu, A.; Sharma, G.; Kuznetsov, M.L.; Koch, B.; Guedes da Silva, M.F.C.; Pombeiro, A.J.L. Synthesis, DNA binding, cellular DNA lesion and cytotoxicity of a series of new benzimidazole-based Schiff base copper(II) complexes. Dalton Trans. 2015, 44, 19983–19996. [Google Scholar] [CrossRef]
- Elsayed, S.A.; Elnabky, I.M.; di Biase, A.; El-Hendawy, A.M. New mixed ligand copper(II) hydrazone-based complexes: Synthesis, characterization, crystal structure, DNA/RNA/BSA binding, in vitro anticancer, apoptotic activity, and cell cycle analysis. Appl. Organomet. Chem. 2022, 36, 6481. [Google Scholar] [CrossRef]
- Gałczyńska, K.; Drulis-Kawa, Z.; Arabski, M. Antitumor Activity of Pt(II), Ru(III) and Cu(II) Complexes. Molecules 2020, 25, 3492. [Google Scholar] [CrossRef]
- Barnum, K.J.; O’Connell, M.J. Cell Cycle Regulation by Checkpoints. In Cell Cycle Control: Mechanisms and Protocols, Methods in Molecular Biology; Noguchi, E., Gadaleta, M.C., Eds.; Springer Science + Business Media: New York, NY, USA, 2014; Volume 1170, pp. 29–40. [Google Scholar] [CrossRef]
- Shaltiel, I.A.; Krenning, L.; Bruinsma, W.; Medema, R.H. The same, only different—DNA damage checkpoints and their reversal throughout the cell cycle. J. Cell Sci. 2015, 128, 607–620. [Google Scholar] [CrossRef]
- Hu, J.; Liao, C.; Guo, Y.; Yang, F.; Sang, W.; Zhao, J. Copper(II) complexes inducing apoptosis in cancer cells, and demonstrating DNA and HSA interactions. Polyhedron 2017, 132, 28–38. [Google Scholar] [CrossRef]
- Olar, R.; Badea, M.; Chifiriuc, M.C. Metal Complexes—A Promising Approach to Target Biofilm Associated Infections. Molecules 2022, 27, 758. [Google Scholar] [CrossRef] [PubMed]
- Parvin, N.; Nallapureddy, R.R.; Mandal, T.K.; Joo, S.W. Construction of bimetallic hybrid multishell hollow spheres via sequential template approach for less cytotoxic antimicrobial effect. IEEE Trans. NanoBiosci. 2022. [Google Scholar] [CrossRef] [PubMed]
- Mandal, T.K.; Parvin, N. Rapid Detection of Bacteria by Carbon Quantum Dots. J. Biomed. Nanotech. 2011, 7, 846–848. [Google Scholar] [CrossRef] [PubMed]
- Wu, X.; Li, J.; Hu, C.; Zheng, Y.; Zhang, Y.; Li, J.; Li, M.; Xiao, D.; Lu, L.; Huang, Y.; et al. Inclusion Complex of Isoliquiritigenin with Sulfobutyl Ether-β-Cyclodextrin: Preparation, Characterization, Inclusion Mode, Solubilization, and Stability. Front. Chem. 2022, 10, 930297. [Google Scholar] [CrossRef]
- Sanner, M.F. Python: A programming language for software integration and development. J. Mol. Graphics Mod. 1999, 17, 57–61. [Google Scholar] [CrossRef]
- Ahmad, M.; Suhaimi, S.-N.; Chu, T.-L.; Abdul Aziz, N.; Mohd Kornain, N.-K.; Samiulla, D.S.; Lo, K.-W.; Ng, C.-H.; Khoo, A.S.-B. Ternary copper(II) complex: NCI60 screening, toxicity studies, and evaluation of efficacy in xenograft models of nasopharyngeal carcinoma. PLoS ONE 2018, 13, 0191295. [Google Scholar] [CrossRef]


| Compound | Temperature (K) | Simulated EPR Parameters | |||
|---|---|---|---|---|---|
| g-Tensor | A-Tensor (MHz) | Line Width (mT) | Correlation Times (ns) | ||
| [gx gy gz] | [Ax Ay Az] | [Gaussian Lorenzian] | |||
| (1a)@β-CD | 260 | [2.279 2.076 2.072] | [436 5.4 0.7] | [4 2.5] | --- |
| 308 | [3 2.1] | [0.02 25.11 0.18] | |||
| (2a)@β-CD | 260 | [2.282 2.081 2.069] | [460 5.4 0.7] | [4 1.5] | --- |
| 308 | [2.5 1.5] | [9.54 0.19 0.14] | |||
| Compounds | IC50/µg/mL (µM) | TI | ||||
|---|---|---|---|---|---|---|
| L929 | B16 | |||||
| 24 h | 48 h | 24 h | 48 h | 24 h | 48 h | |
| (1a)@β-CD | - | - | - | - | - | - |
| (2a)@β-CD | 6.88 (2.27) | 4.97 (1.64) | 5.98 (1.97) | 2.92 (0.96) | 1.15 | 1.70 |
| β-CD | - | - | - | - | - | - |
Disclaimer/Publisher’s Note: The statements, opinions and data contained in all publications are solely those of the individual author(s) and contributor(s) and not of MDPI and/or the editor(s). MDPI and/or the editor(s) disclaim responsibility for any injury to people or property resulting from any ideas, methods, instructions or products referred to in the content. |
© 2023 by the authors. Licensee MDPI, Basel, Switzerland. This article is an open access article distributed under the terms and conditions of the Creative Commons Attribution (CC BY) license (https://creativecommons.org/licenses/by/4.0/).
Share and Cite
Tirsoaga, A.; Cojocaru, V.; Badea, M.; Badea, I.A.; Rostas, A.M.; Stoica, R.; Bacalum, M.; Chifiriuc, M.C.; Olar, R. Copper (II) Species with Improved Anti-Melanoma and Antibacterial Activity by Inclusion in β-Cyclodextrin. Int. J. Mol. Sci. 2023, 24, 2688. https://doi.org/10.3390/ijms24032688
Tirsoaga A, Cojocaru V, Badea M, Badea IA, Rostas AM, Stoica R, Bacalum M, Chifiriuc MC, Olar R. Copper (II) Species with Improved Anti-Melanoma and Antibacterial Activity by Inclusion in β-Cyclodextrin. International Journal of Molecular Sciences. 2023; 24(3):2688. https://doi.org/10.3390/ijms24032688
Chicago/Turabian StyleTirsoaga, Alina, Victor Cojocaru, Mihaela Badea, Irinel Adriana Badea, Arpad Mihai Rostas, Roberta Stoica, Mihaela Bacalum, Mariana Carmen Chifiriuc, and Rodica Olar. 2023. "Copper (II) Species with Improved Anti-Melanoma and Antibacterial Activity by Inclusion in β-Cyclodextrin" International Journal of Molecular Sciences 24, no. 3: 2688. https://doi.org/10.3390/ijms24032688
APA StyleTirsoaga, A., Cojocaru, V., Badea, M., Badea, I. A., Rostas, A. M., Stoica, R., Bacalum, M., Chifiriuc, M. C., & Olar, R. (2023). Copper (II) Species with Improved Anti-Melanoma and Antibacterial Activity by Inclusion in β-Cyclodextrin. International Journal of Molecular Sciences, 24(3), 2688. https://doi.org/10.3390/ijms24032688