
The Effect of the Histone Chaperones HSPA8 and DEK on Tumor Immunity in Hepatocellular Carcinoma

 , and
, and 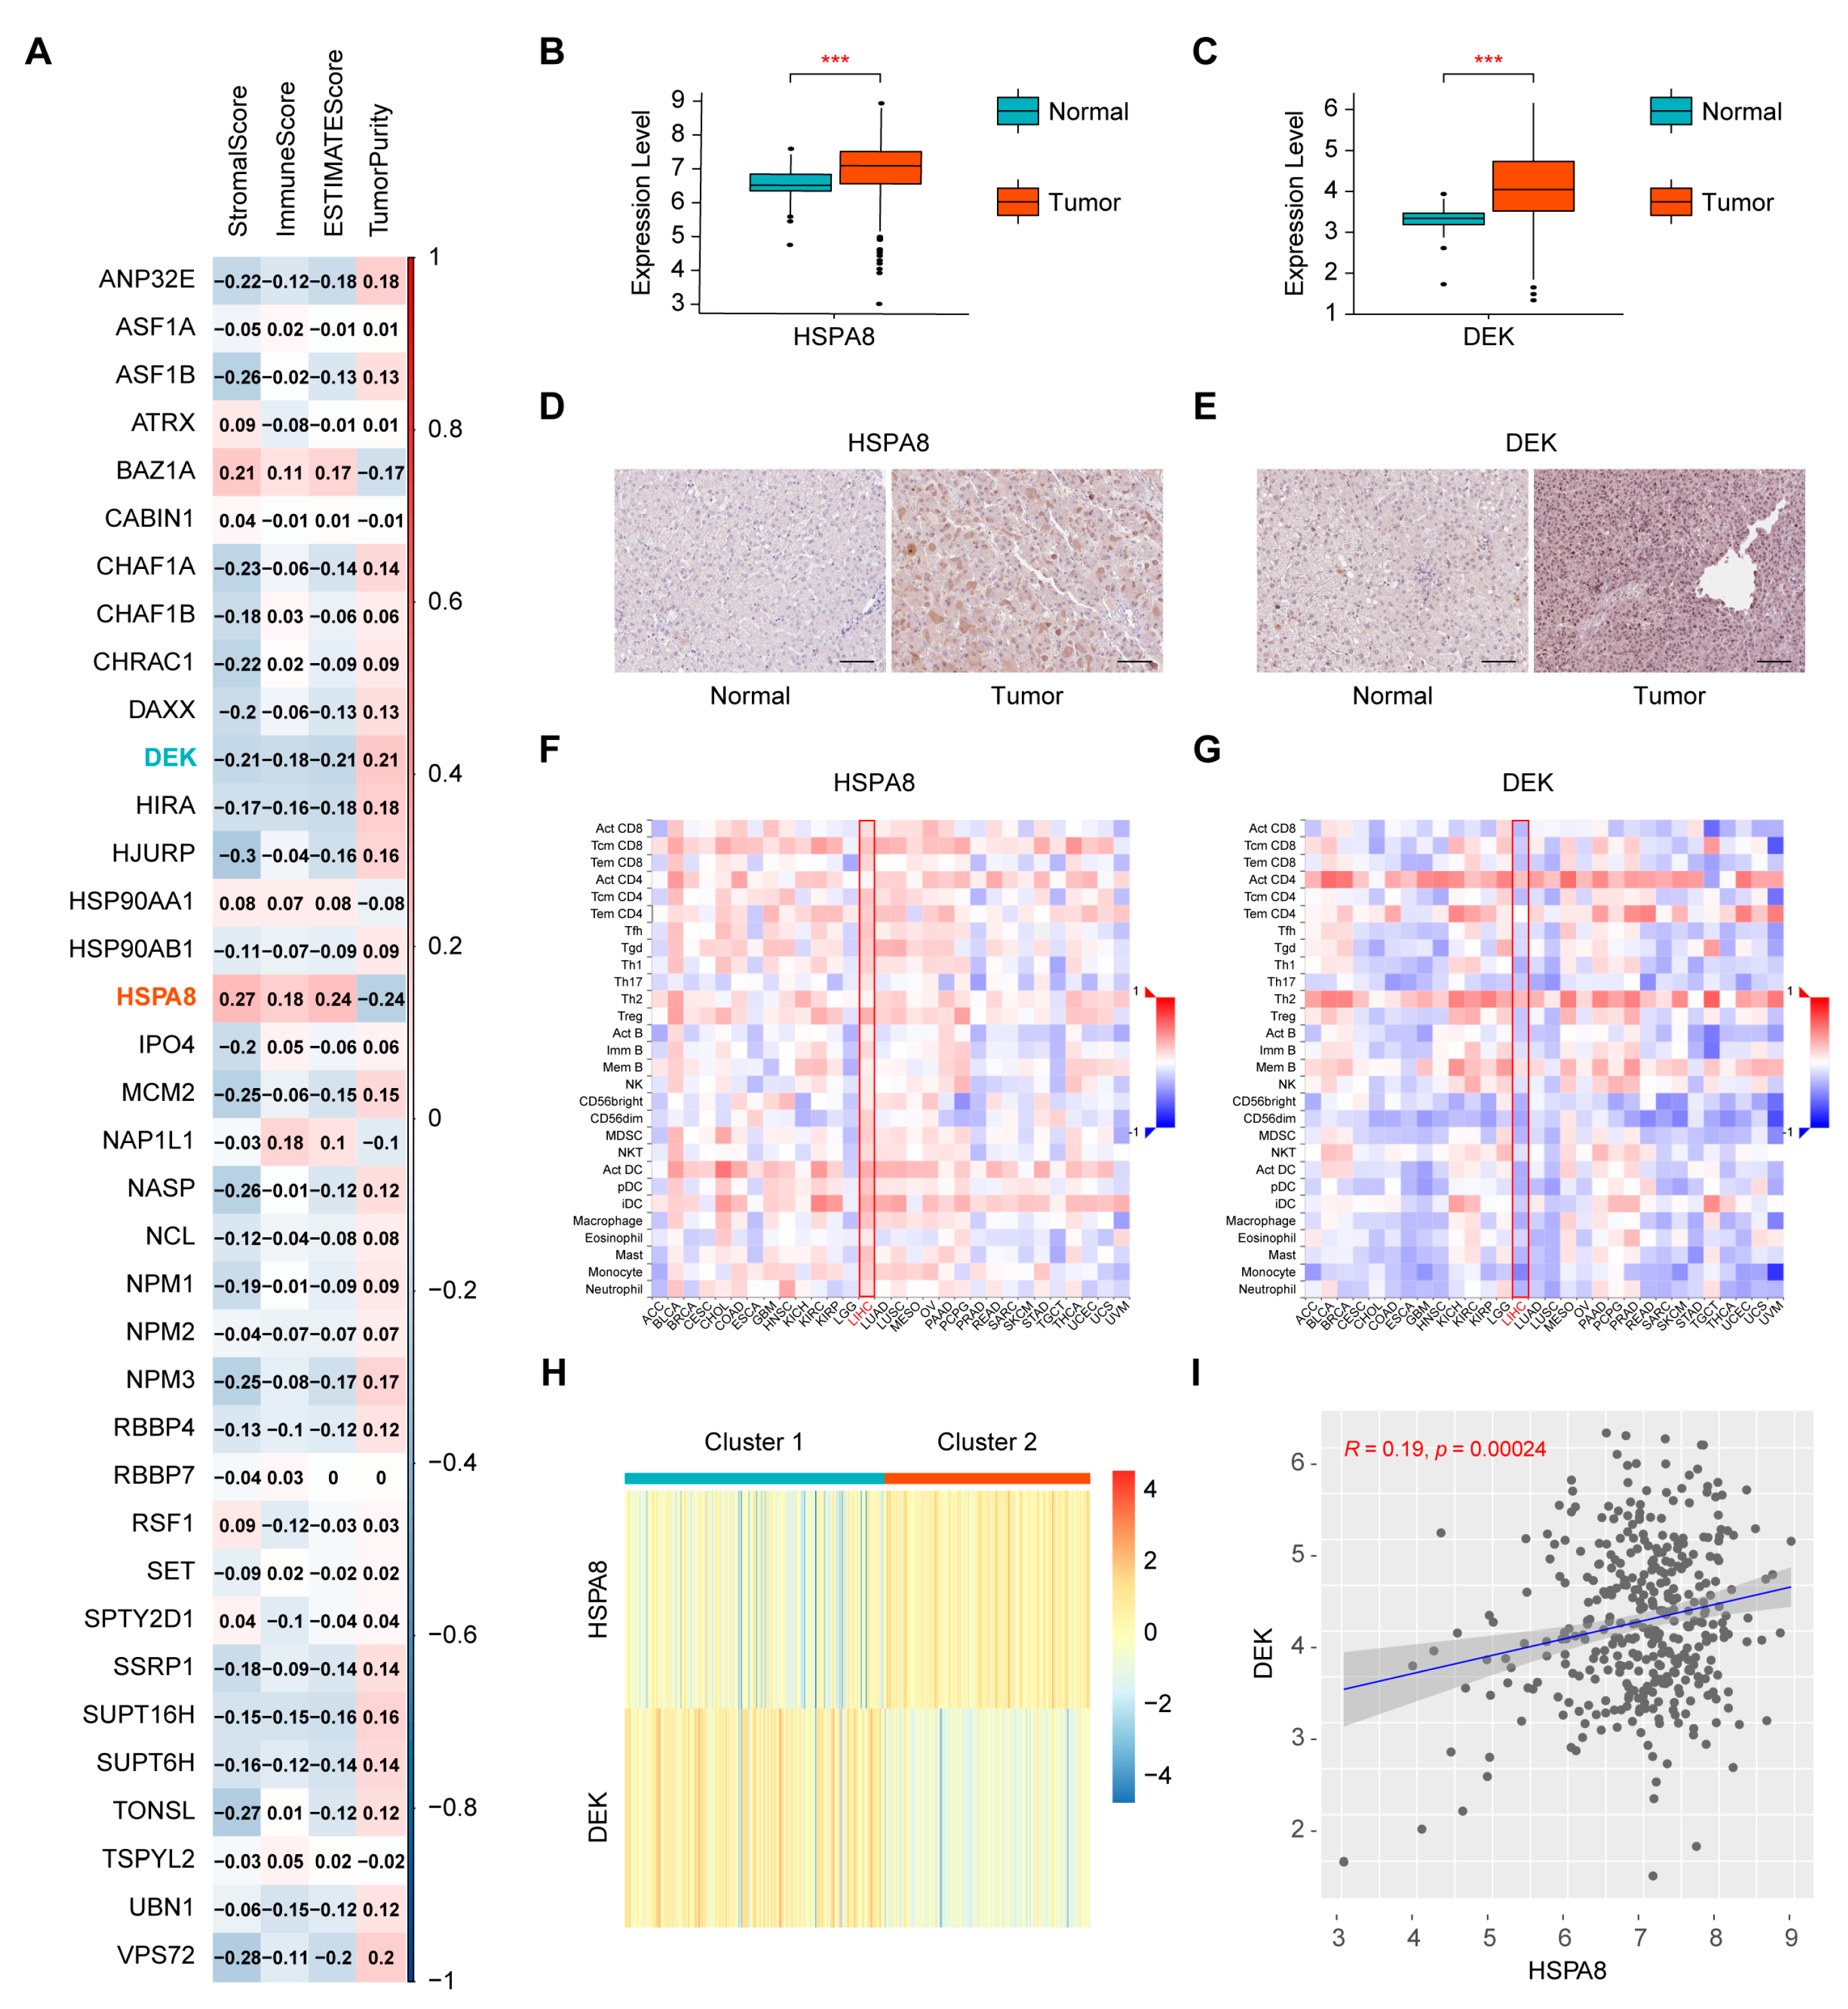
Abstract
1. Introduction
2. Results
2.1. Screening of Immune-Related Histone Chaperones and Consensus Clustering of the Cancer Genome Atlas-Liver Hepatocellular Carcinoma (TCGA-HCC) Samples
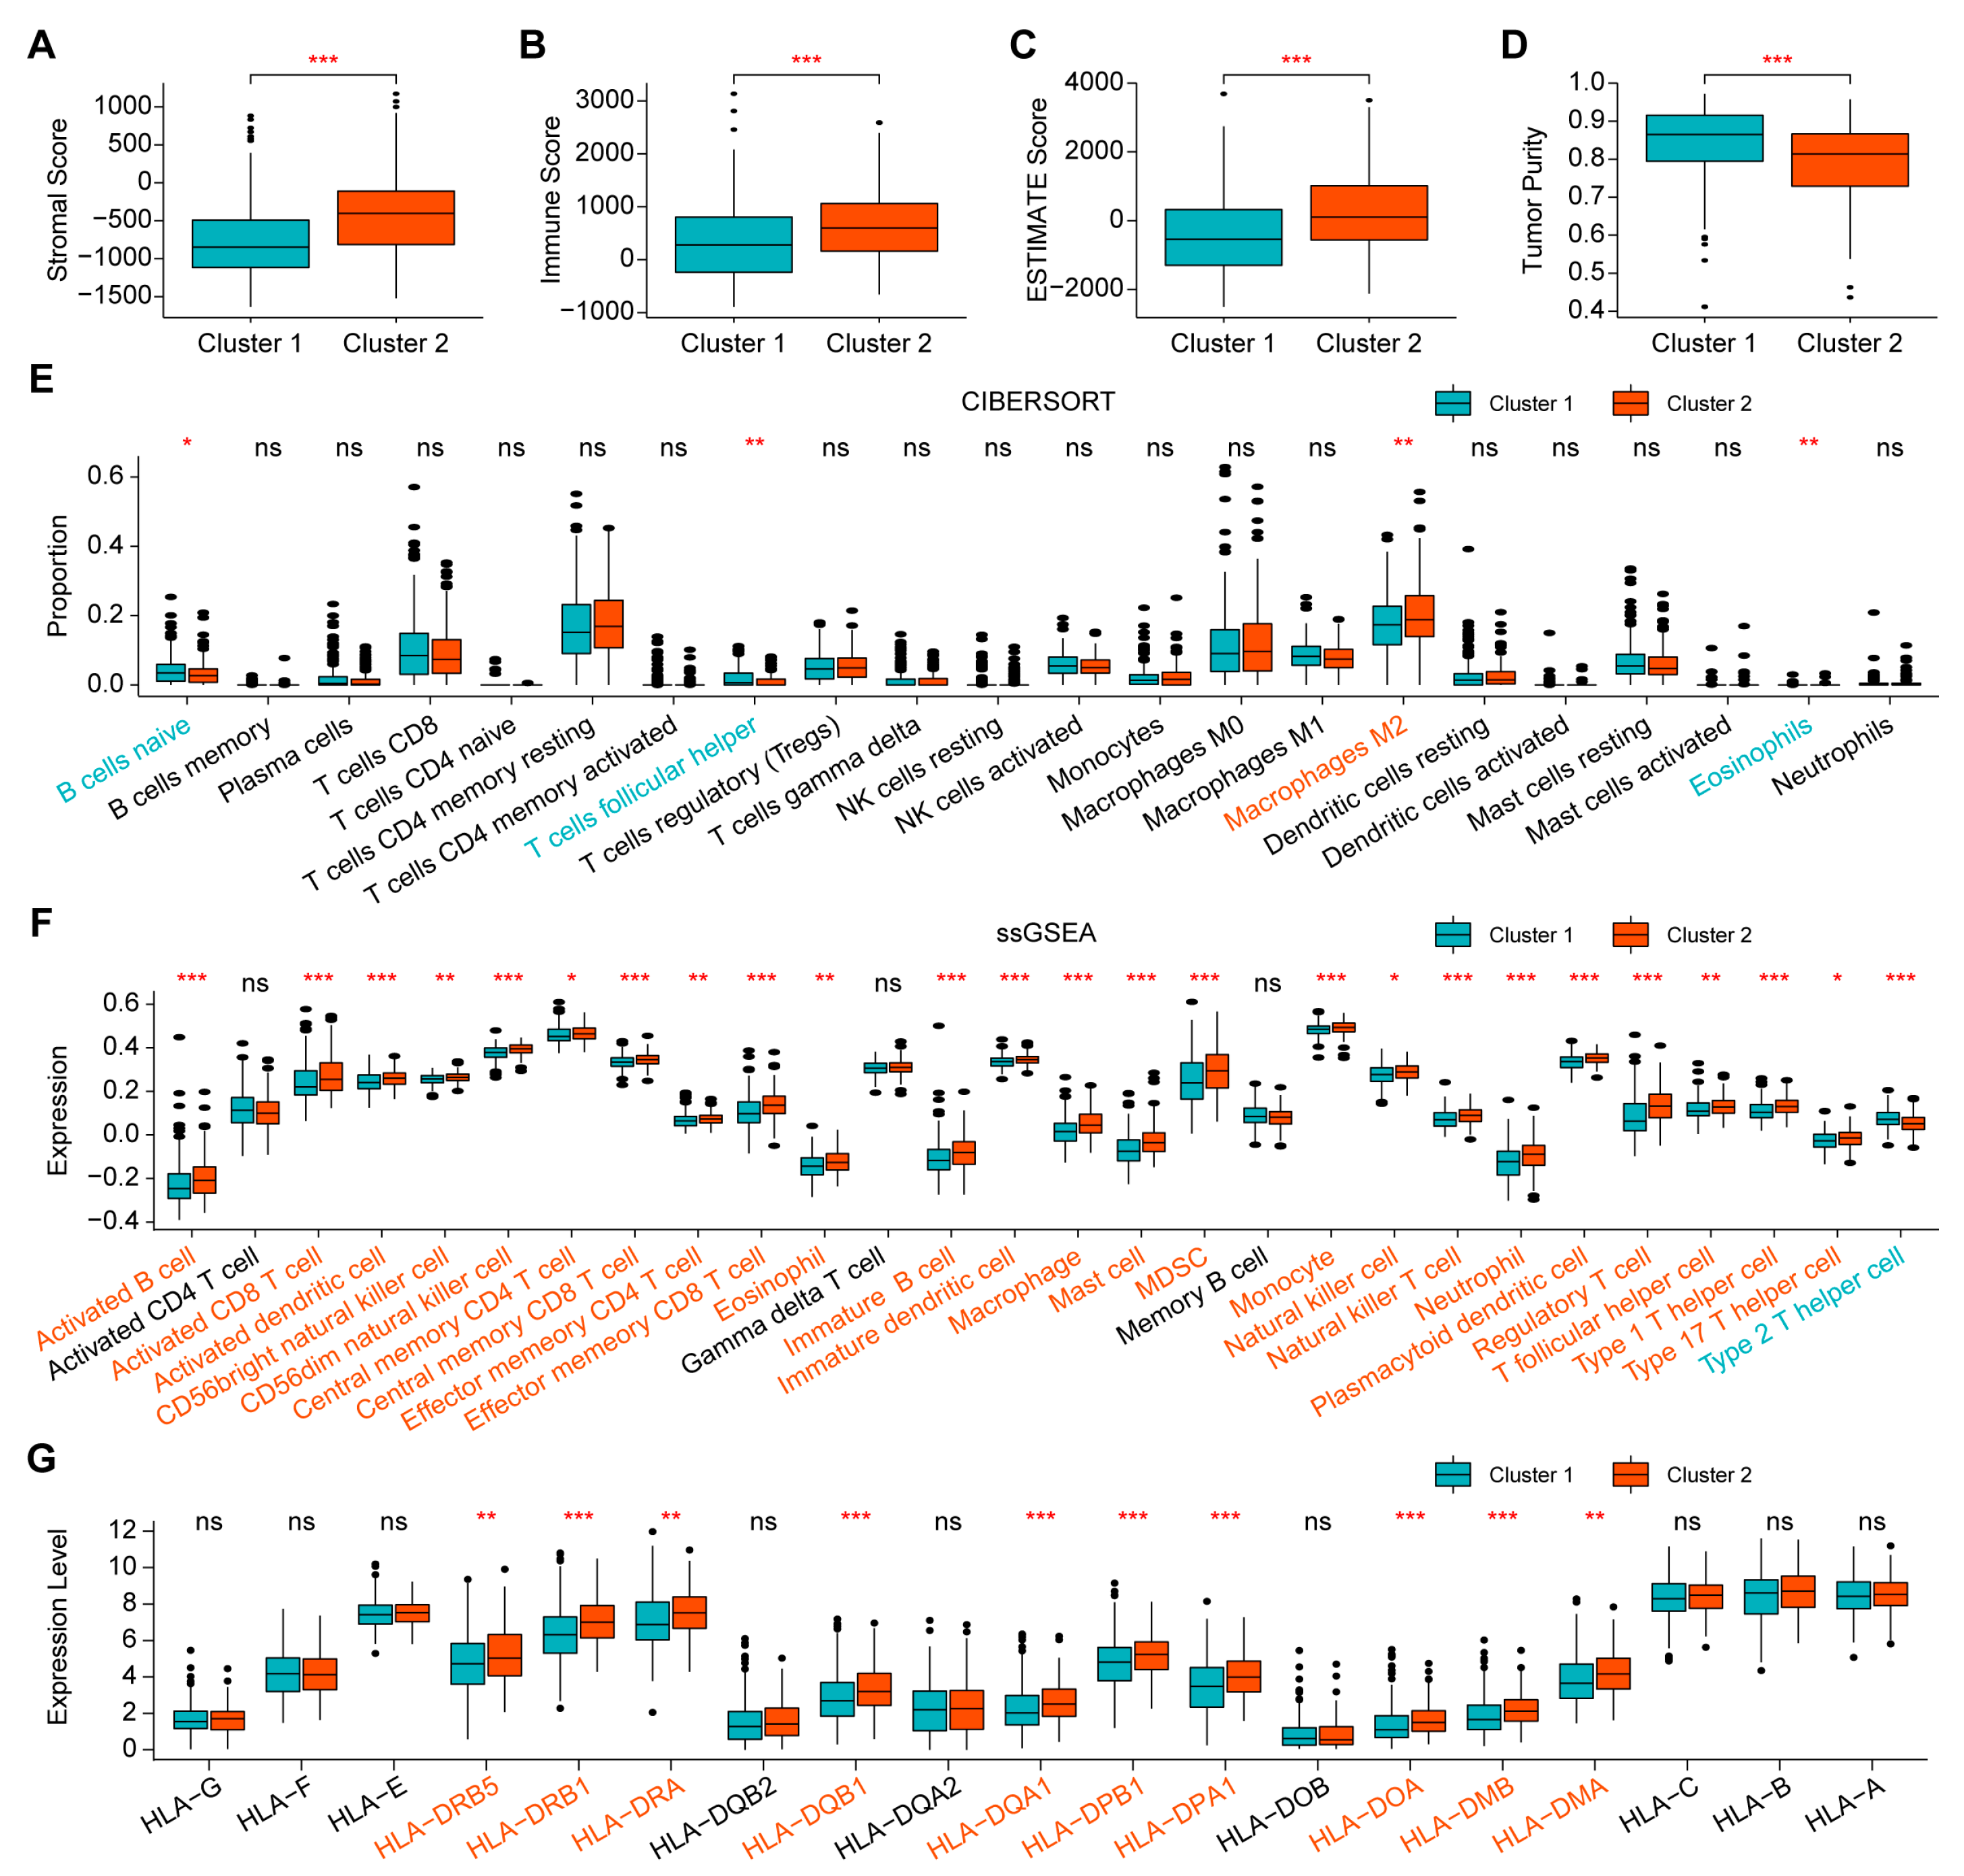
2.2. Comparison of Immune Infiltration between the Two Clusters
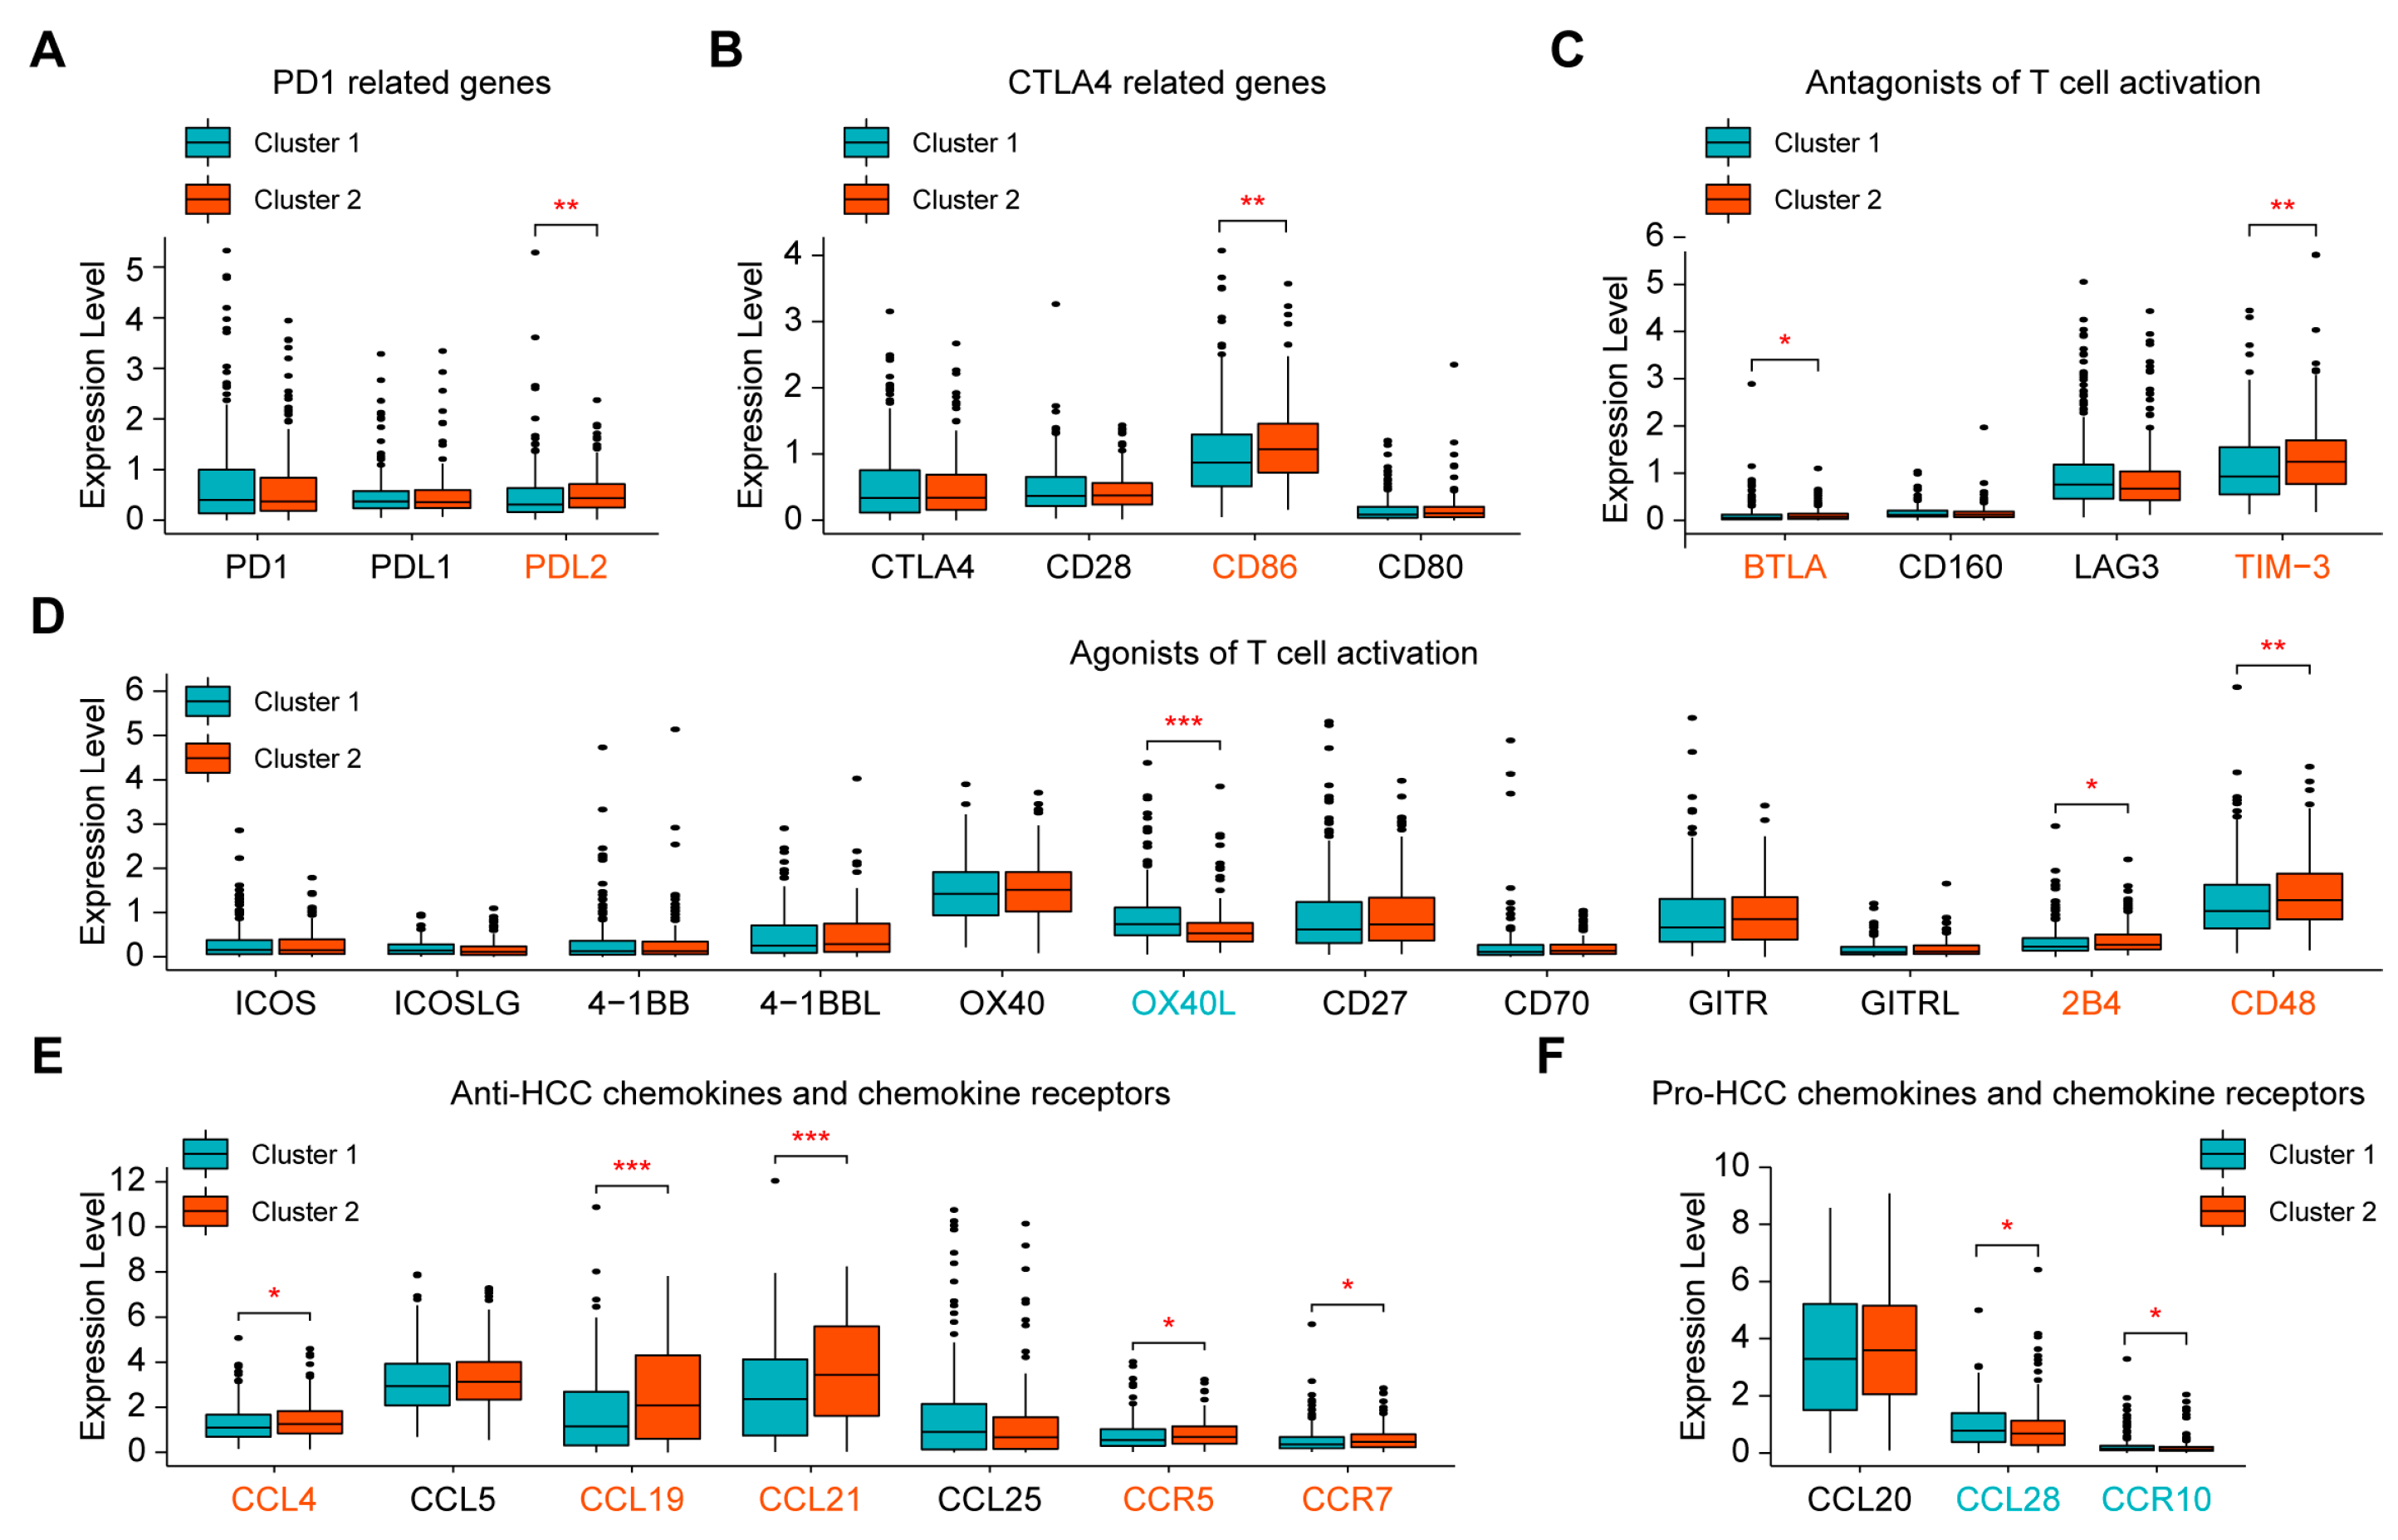
2.3. Evaluation of Sensitivity to Immunotherapy of the Two Clusters
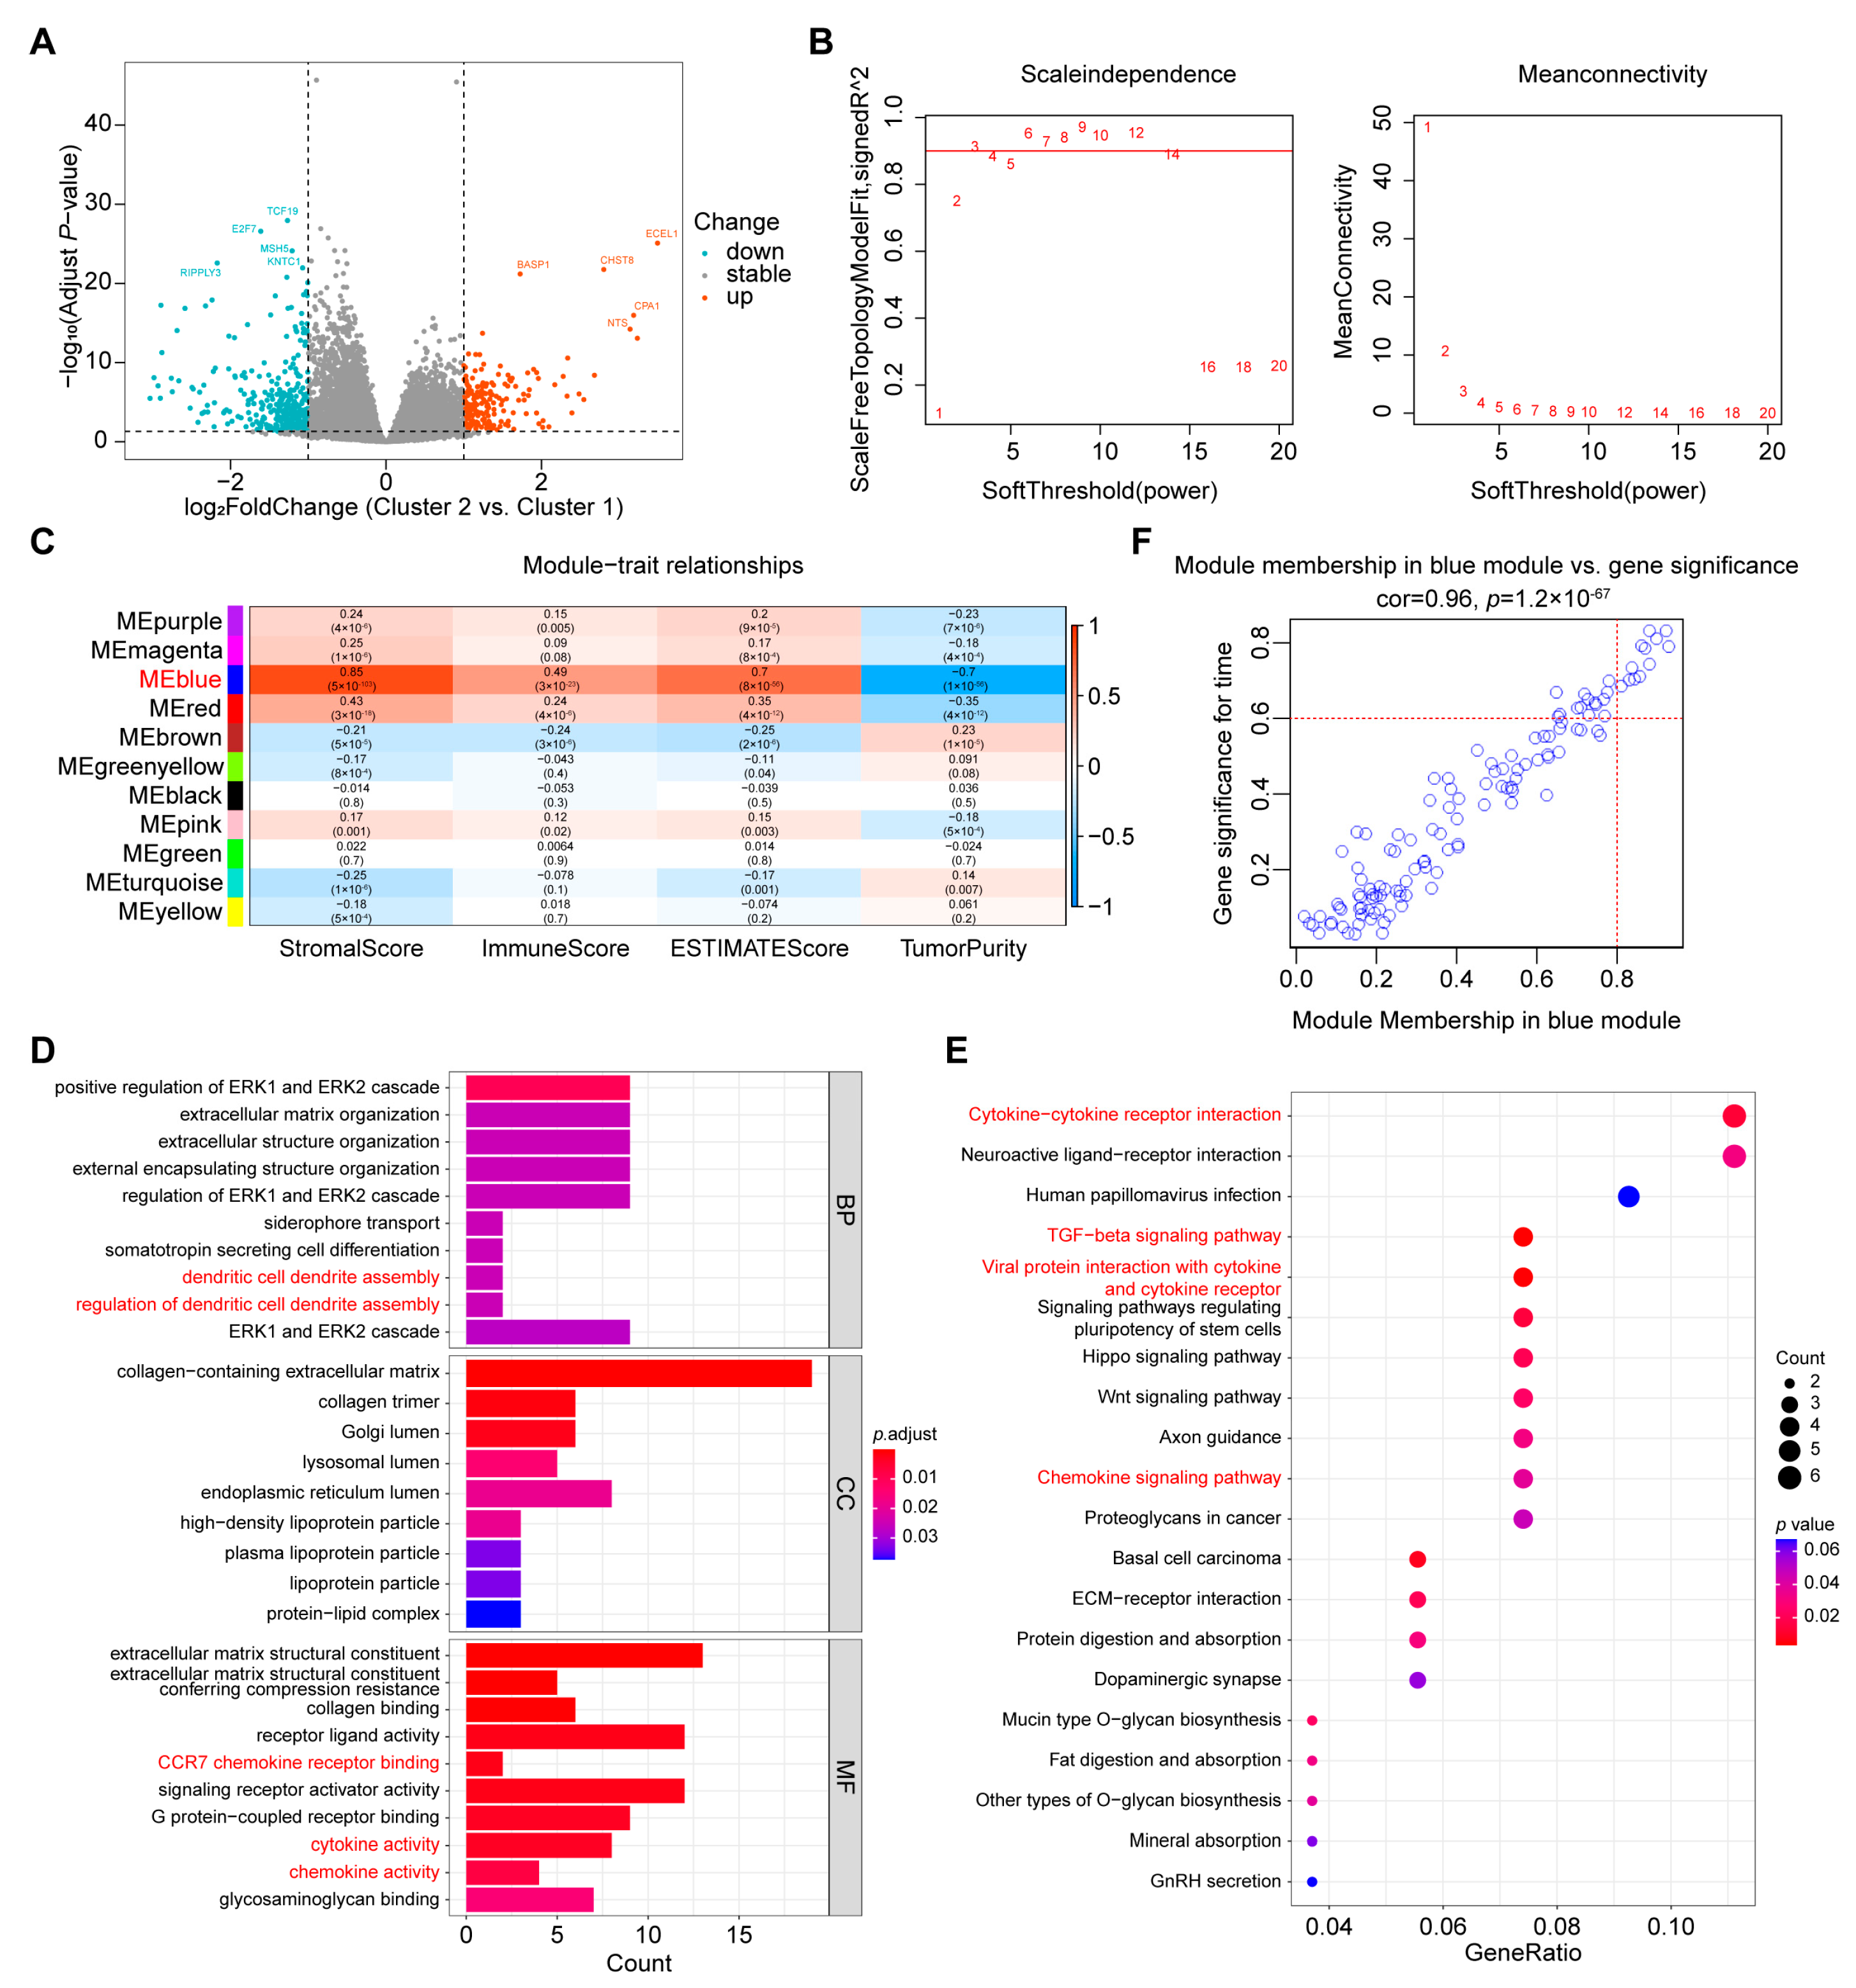
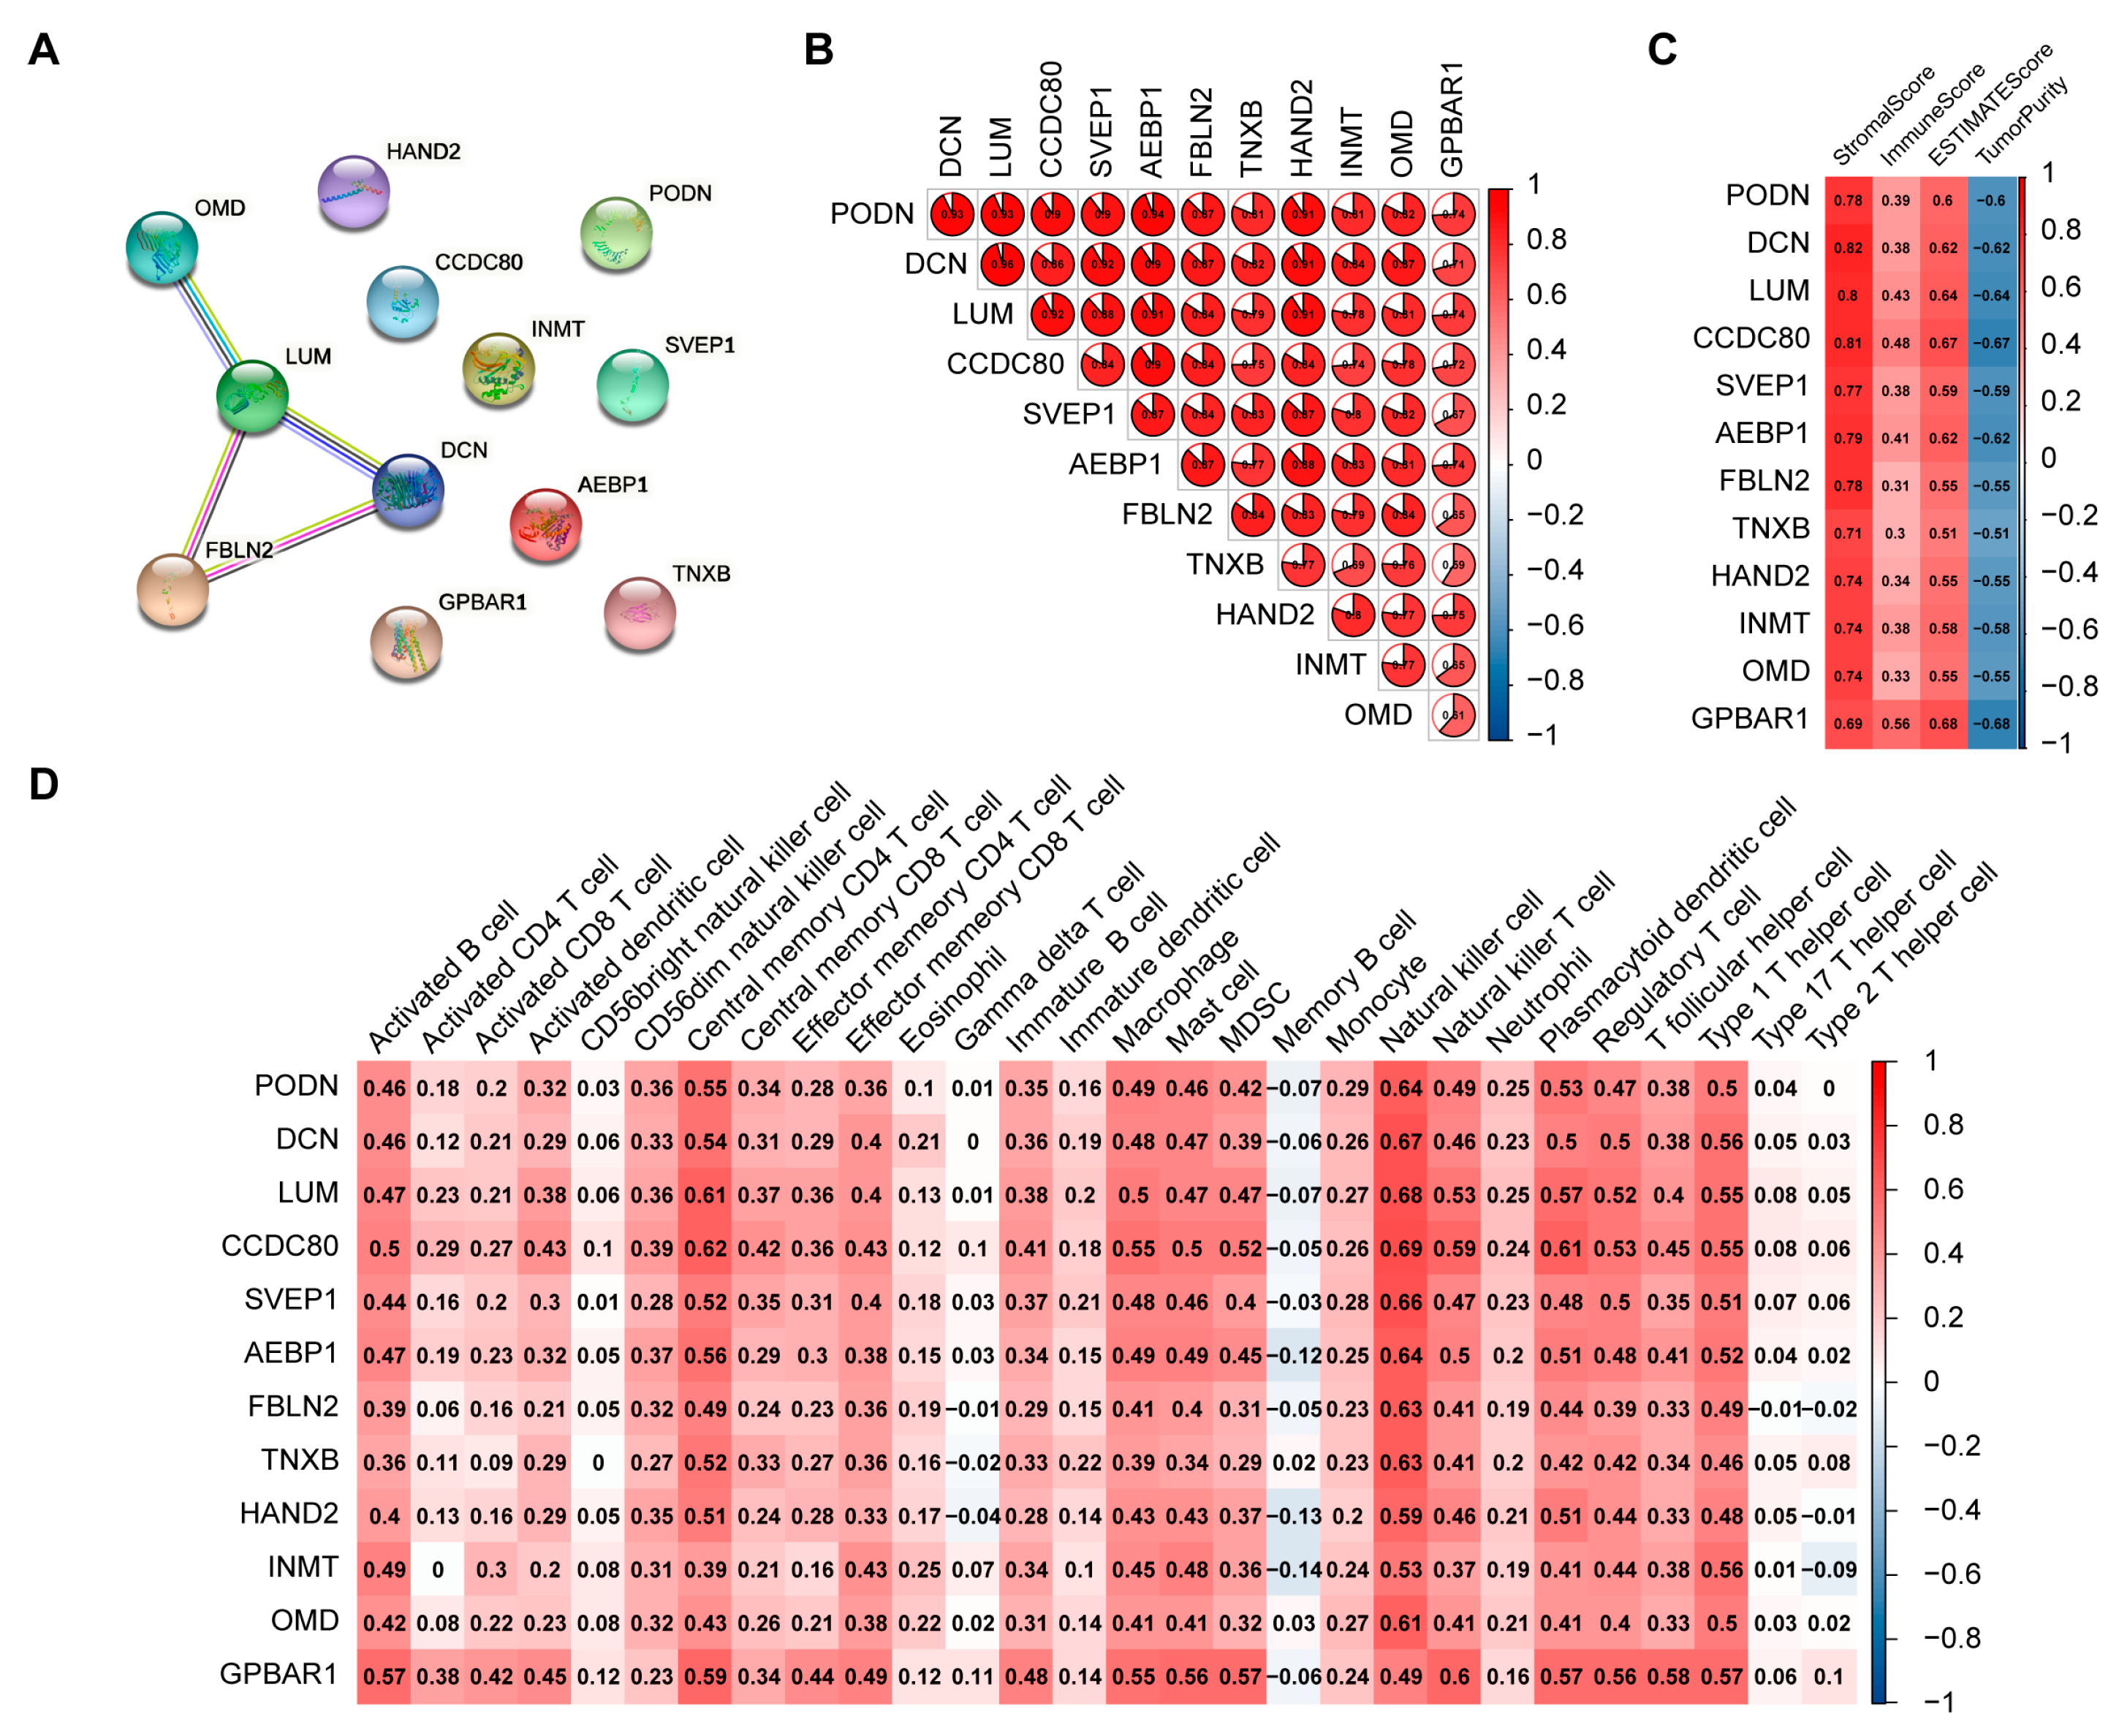
2.4. Screening of Hub Genes Related to Immune Infiltration between the Two Clusters
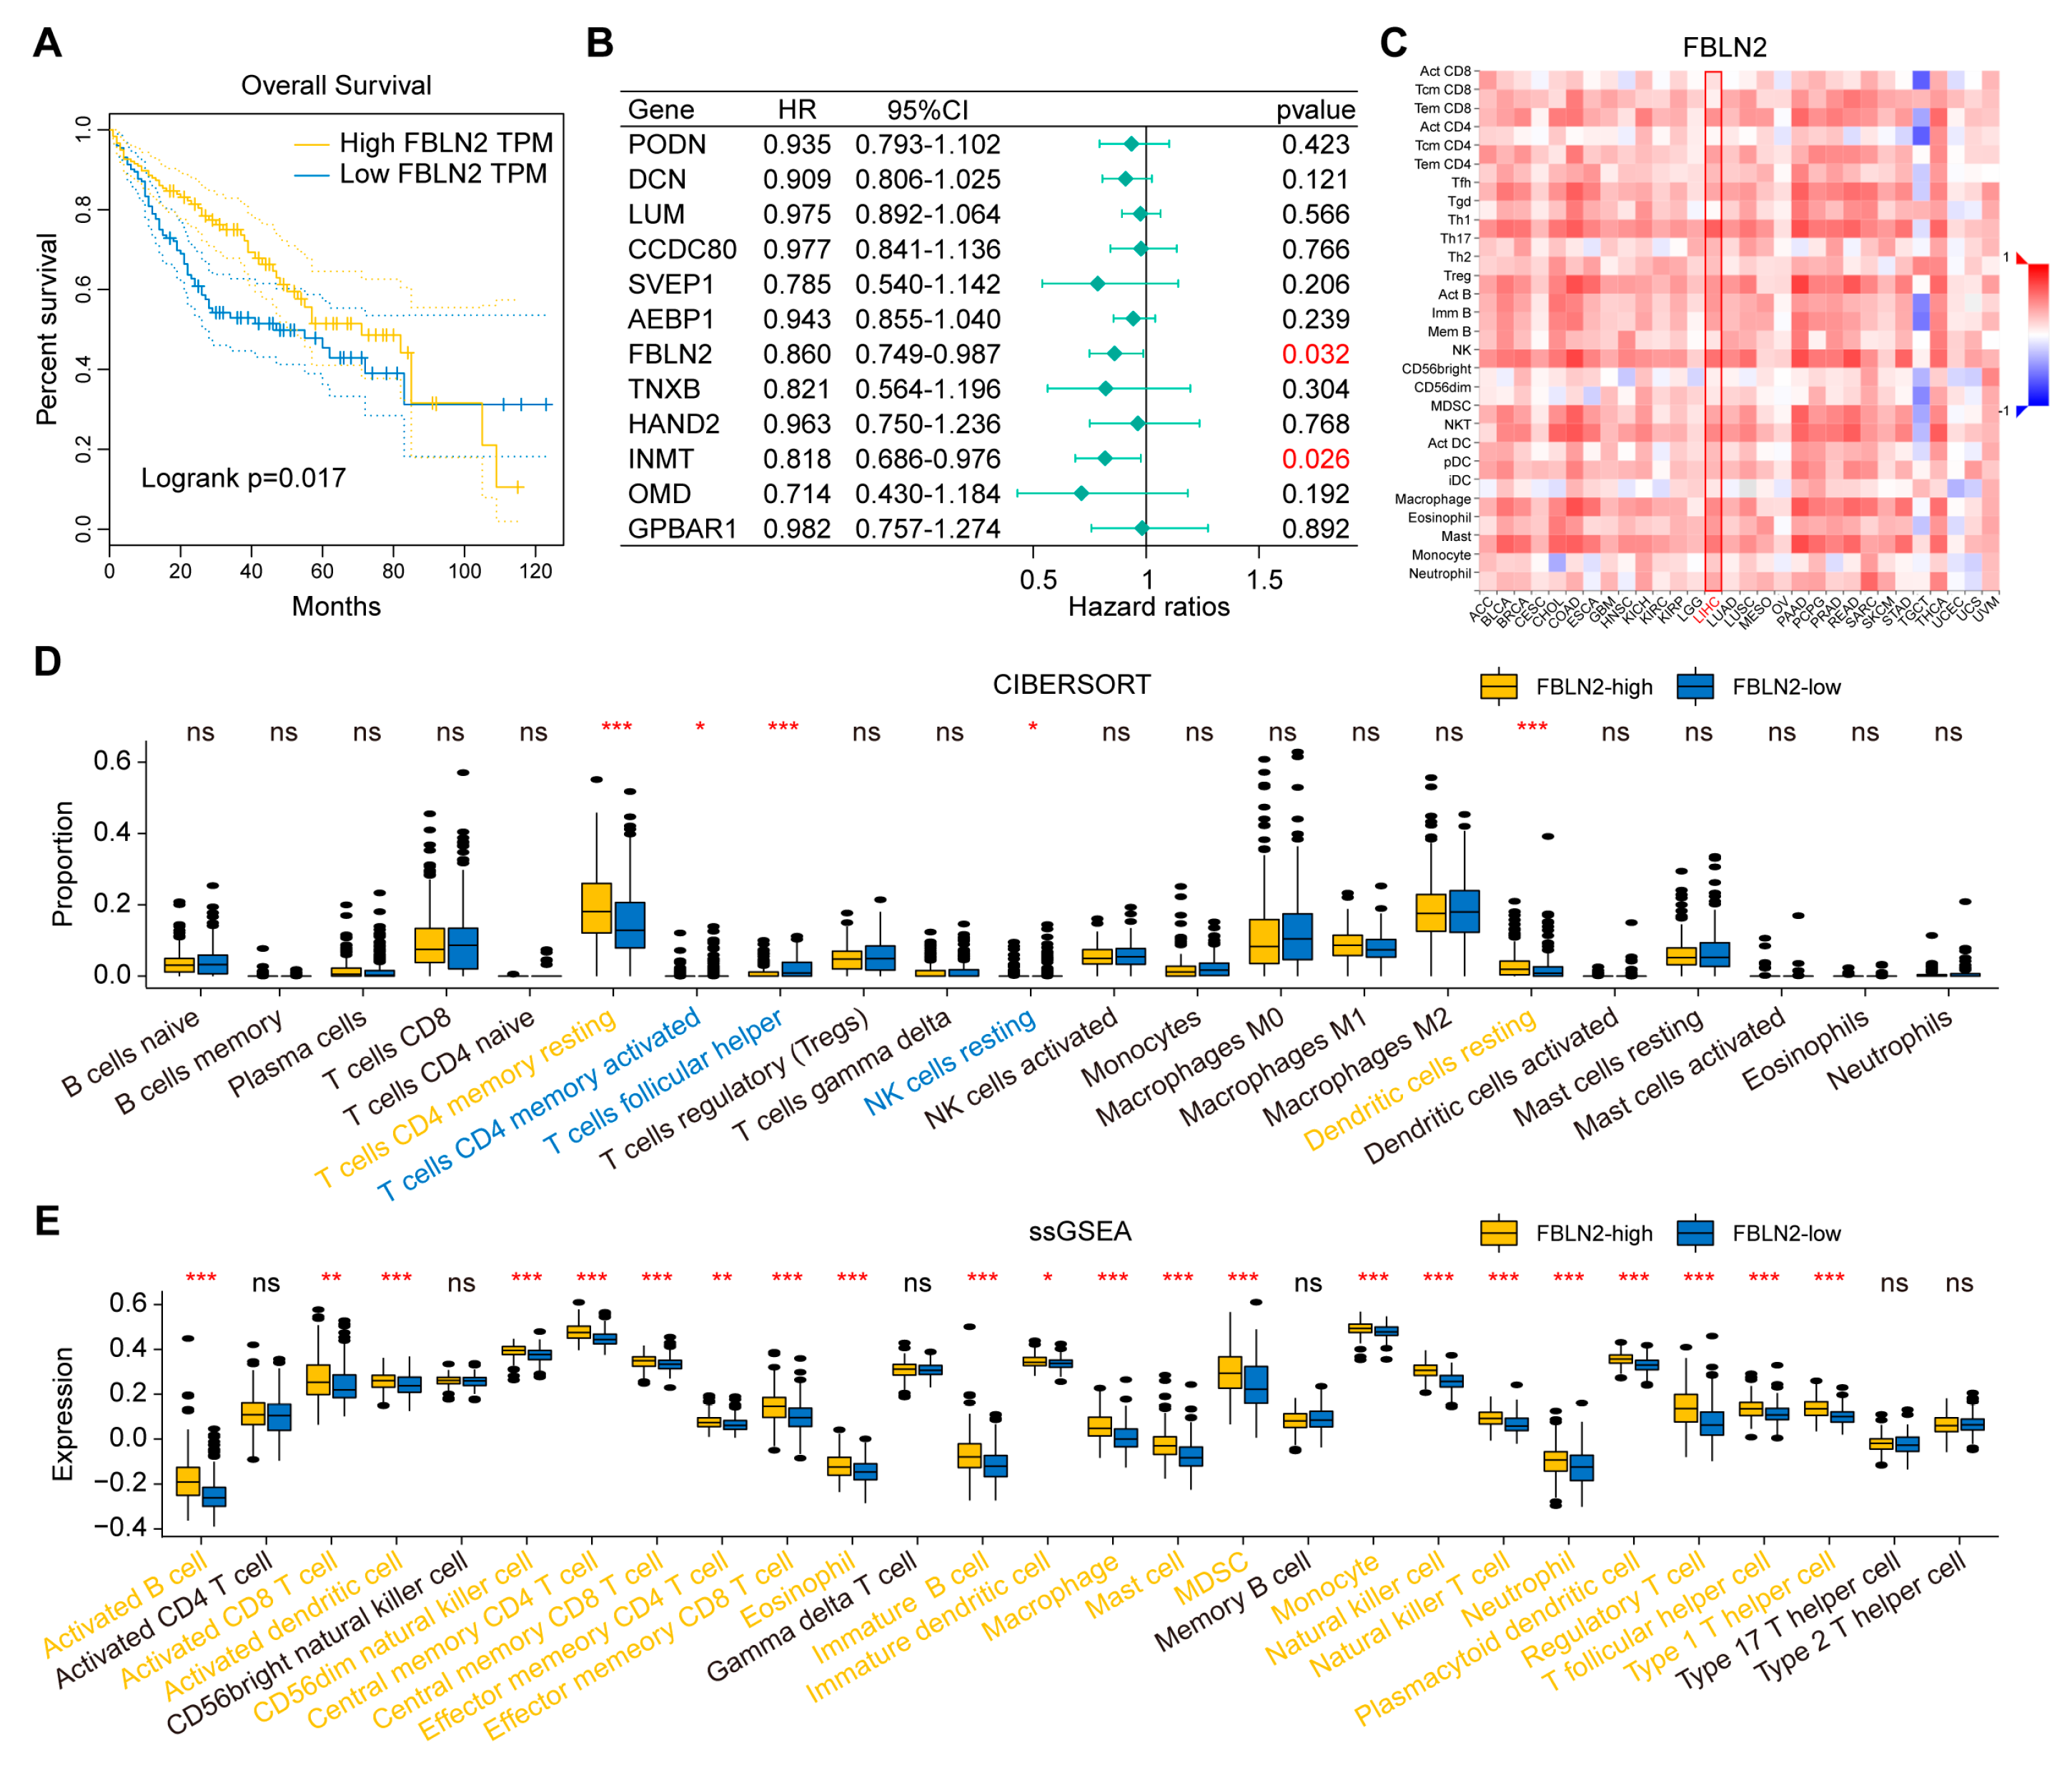
2.5. Determination of FBLN2 Functions
2.6. Validation of Immune Features by the Gene Expression Omnibus (GEO) and International Cancer Genome Consortium (ICGC) Databases
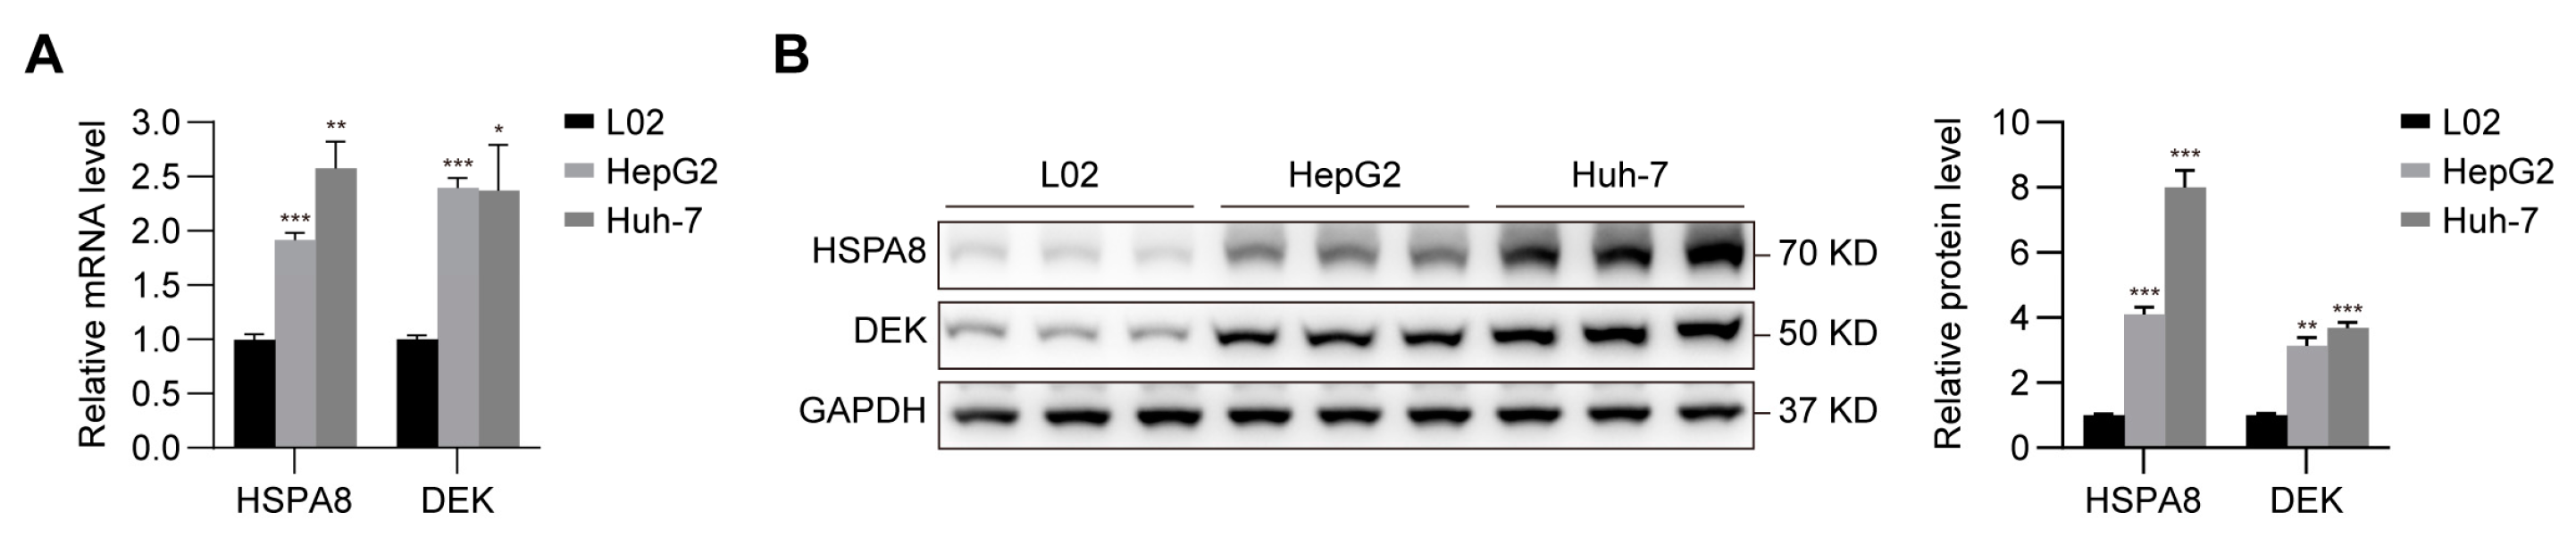
2.7. Verification of the Expression of HSPA8 and DEK in HCC Cells
3. Discussion
4. Materials and Methods
4.1. Data Acquisition
4.2. ESTIMATE Analysis
4.3. CIBERSORT Analysis
4.4. ssGSEA
4.5. HPA Database
4.6. TISIDB
4.7. Consensus Clustering
4.8. Tumor Mutation Burden Calculation
4.9. DEG Identification
4.10. WGCNA
4.11. GO Enrichment Analysis
4.12. KEGG Pathway Analysis
4.13. STRING
4.14. Cell Culture and qRT-PCR
- 18S-F, 5′-TTCGAACGTCTGCCCTATCAA-3′;
- 18S-R, 5′-ATGGTAGGCACGGCGACTA-3′;
- HSPA8-F, 5′-GCTTCTATCCAGAGGAGGTGTCTT-3′;
- HSPA8-R, 5′-GACCAGCAATAGTTCCAGCATCTT-3′;
- DEK-F, 5′-CTGGAATGGCAAGGAAGGCTAAG-3′;
- DEK-R, 5′-TTTGGTGGCTCCTCTTCACTTTC-3′.
4.15. Western Blotting
4.16. Statistical Analysis
5. Conclusions
Supplementary Materials
Author Contributions
Funding
Institutional Review Board Statement
Informed Consent Statement
Data Availability Statement
Acknowledgments
Conflicts of Interest
Abbreviations
References
- Siegel, R.L.; Miller, K.D.; Fuchs, H.E.; Jemal, A. Cancer Statistics, 2021. CA Cancer J. Clin. 2021, 71, 7–33. [Google Scholar] [CrossRef] [PubMed]
- Njei, B.; Rotman, Y.; Ditah, I.; Lim, J.K. Emerging trends in hepatocellular carcinoma incidence and mortality. Hepatology 2014, 61, 191–199. [Google Scholar] [CrossRef]
- Llovet, J.M.; Kelley, R.K.; Villanueva, A.; Singal, A.G.; Pikarsky, E.; Roayaie, S.; Lencioni, R.; Koike, K.; Zucman-Rossi, J.; Finn, R.S. Hepatocellular carcinoma. Nat. Rev. Dis. Primers 2021, 7, 6. [Google Scholar] [CrossRef] [PubMed]
- Llovet, J.M.; Montal, R.; Sia, D.; Finn, R.S. Molecular therapies and precision medicine for hepatocellular carcinoma. Nat. Rev. Clin. Oncol. 2018, 15, 599–616. [Google Scholar] [CrossRef] [PubMed]
- Rizzo, A.; Ricci, A.D.; Di Federico, A.; Frega, G.; Palloni, A.; Tavolari, S.; Brandi, G. Predictive Biomarkers for Checkpoint Inhibitor-Based Immunotherapy in Hepatocellular Carcinoma: Where Do We Stand? Front. Oncol. 2021, 11, 803133. [Google Scholar] [CrossRef] [PubMed]
- Sangro, B.; Sarobe, P.; Hervás-Stubbs, S.; Melero, I. Advances in immunotherapy for hepatocellular carcinoma. Nat. Rev. Gastroenterol. Hepatol. 2021, 18, 525–543. [Google Scholar] [CrossRef]
- Di Federico, A.; Rizzo, A.; Carloni, R.; De Giglio, A.; Bruno, R.; Ricci, D.; Brandi, G. Atezolizumab-bevacizumab plus Y-90 TARE for the treatment of hepatocellular carcinoma: Preclinical rationale and ongoing clinical trials. Expert Opin. Investig. Drugs 2021, 31, 361–369. [Google Scholar] [CrossRef]
- Galle, P.R.; Finn, R.S.; Qin, S.; Ikeda, M.; Zhu, A.X.; Kim, T.-Y.; Kudo, M.; Breder, V.; Merle, P.; Kaseb, A.; et al. Patient-reported outcomes with atezolizumab plus bevacizumab versus sorafenib in patients with unresectable hepatocellular carcinoma (IMbrave150): An open-label, randomised, phase 3 trial. Lancet Oncol. 2021, 22, 991–1001. [Google Scholar] [CrossRef]
- Rizzo, A.; Ricci, A.D.; Di Federico, A.; Frega, G.; Palloni, A.; Tavolari, S.; Brandi, G. Which role for predictors of response to immune checkpoint inhibitors in hepatocellular carcinoma? Expert Rev. Gastroenterol. Hepatol. 2022, 16, 333–339. [Google Scholar] [CrossRef]
- Llovet, J.M.; Castet, F.; Heikenwalder, M.; Maini, M.K.; Mazzaferro, V.; Pinato, D.J.; Pikarsky, E.; Zhu, A.X.; Finn, R.S. Immunotherapies for hepatocellular carcinoma. Nat. Rev. Clin. Oncol. 2022, 19, 151–172. [Google Scholar] [CrossRef]
- Hammond, C.; Strømme, C.B.; Huang, H.; Patel, D.J.; Groth, A. Histone chaperone networks shaping chromatin function. Nat. Rev. Mol. Cell Biol. 2017, 18, 141–158. [Google Scholar] [CrossRef] [PubMed]
- Watanabe, R.; Kanno, S.-I.; Roushandeh, A.M.; Ui, A.; Yasui, A. Nucleosome remodelling, DNA repair and transcriptional regulation build negative feedback loops in cancer and cellular ageing. Philos. Trans. R. Soc. B Biol. Sci. 2017, 372, 20160473. [Google Scholar] [CrossRef] [PubMed]
- Shen, J.; Chen, M.; Lee, D.; Law, C.T.; Wei, L.; Tsang, F.H.; Chin, D.W.; Cheng, C.L.; Lee, J.M.; Ng, I.O.; et al. Histone chaperone FACT complex mediates oxidative stress response to promote liver cancer progression. Gut 2020, 69, 329–342. [Google Scholar] [CrossRef] [PubMed]
- Bonam, S.R.; Ruff, M.; Muller, S. HSPA8/HSC70 in Immune Disorders: A Molecular Rheostat that Adjusts Chaperone-Mediated Autophagy Substrates. Cells 2019, 8, 849. [Google Scholar] [CrossRef]
- Stricher, F.; Macri, C.; Ruff, M.; Muller, S. HSPA8/HSC70 chaperone protein: Structure, function, and chemical targeting. Autophagy 2013, 9, 1937–1954. [Google Scholar] [CrossRef]
- Xiang, X.; You, X.M.; Li, L.Q. Expression of HSP90AA1/HSPA8 in hepatocellular carcinoma patients with depression. OncoTargets Ther. 2018, 11, 3013–3023. [Google Scholar] [CrossRef]
- Khosla, R.; Hemati, H.; Rastogi, A.; Ramakrishna, G.; Sarin, S.K.; Trehanpati, N. mir-26b-5p helps in EpCAM + cancer stem cells maintenance via HSC71/HSPA8 and augments malignant features in HCC. Liver Int. 2019, 39, 1692–1703. [Google Scholar] [CrossRef]
- Pease, N.; Shephard, M.; Sertorio, M.; Waltz, S.; Vinnedge, L. DEK Expression in Breast Cancer Cells Leads to the Alternative Activation of Tumor Associated Macrophages. Cancers 2020, 12, 1936. [Google Scholar] [CrossRef]
- Pease, N.A.; Wise-Draper, T.; Vinnedge, L.P. Dissecting the Potential Interplay of DEK Functions in Inflammation and Cancer. J. Oncol. 2015, 2015, 1–13. [Google Scholar] [CrossRef]
- Xu, Y.; Han, C.; Sun, J.; Zhao, J.; Liu, Q.; An, P. Long Noncoding RNA NR2F1-AS1 Enhances the Migration and Invasion of Hepatocellular Carcinoma via Modulating miR-642a/DEK Pathway. J. Oncol. 2021, 2021, 1–10. [Google Scholar] [CrossRef]
- Ren, D.; Hua, Y.; Yu, B.; Ye, X.; He, Z.; Li, C.; Wang, J.; Mo, Y.; Wei, X.; Chen, Y.; et al. Predictive biomarkers and mechanisms underlying resistance to PD1/PD-L1 blockade cancer immunotherapy. Mol. Cancer 2020, 19, 19. [Google Scholar] [CrossRef] [PubMed]
- Havel, J.J.; Chowell, D.; Chan, T.A. The evolving landscape of biomarkers for checkpoint inhibitor immunotherapy. Nat. Rev. Cancer 2019, 19, 133–150. [Google Scholar] [CrossRef] [PubMed]
- Saibil, S.D.; Ohashi, P. Targeting T Cell Activation in Immuno-Oncology. Curr. Oncol. 2020, 27, 98–105. [Google Scholar] [CrossRef] [PubMed]
- Ozga, A.J.; Chow, M.T.; Luster, A.D. Chemokines and the immune response to cancer. Immunity 2021, 54, 859–874. [Google Scholar] [CrossRef] [PubMed]
- Korbecki, J.; Grochans, S.; Gutowska, I.; Barczak, K.; Baranowska-Bosiacka, I. CC Chemokines in a Tumor: A Review of Pro-Cancer and Anti-Cancer Properties of Receptors CCR5, CCR6, CCR7, CCR8, CCR9, and CCR10 Ligands. Int. J. Mol. Sci. 2020, 21, 7619. [Google Scholar] [CrossRef]
- Chan, T.; Yarchoan, M.; Jaffee, E.; Swanton, C.; Quezada, S.; Stenzinger, A.; Peters, S. Development of tumor mutation burden as an immunotherapy biomarker: Utility for the oncology clinic. Ann. Oncol. 2018, 30, 44–56. [Google Scholar] [CrossRef]
- Villanueva, A.; Hoshida, Y.; Battiston, C.; Tovar, V.; Sia, D.; Alsinet, C.; Cornella, H.; Liberzon, A.; Kobayashi, M.; Kumada, H.; et al. Combining clinical, pathology, and gene expression data to predict recur-rence of hepatocellular carcinoma. Gastroenterology 2011, 140, 1501–1512. [Google Scholar] [CrossRef]
- Toffanin, S.; Hoshida, Y.; Lachenmayer, A.; Villanueva, A.; Cabellos, L.; Minguez, B.; Savic, R.; Ward, S.C.; Thung, S.; Chiang, D.Y.; et al. MicroRNA-based classification of hepatocellular carcinoma and oncogenic role of miR-517a. Gastroenterology 2011, 140, 1618–1628. [Google Scholar] [CrossRef]
- Boussiotis, V.A. Molecular and Biochemical Aspects of the PD-1 Checkpoint Pathway. N. Engl. J. Med. 2016, 375, 1767–1778. [Google Scholar] [CrossRef]
- Guo, M.; Yuan, F.; Qi, F.; Sun, J.; Rao, Q.; Zhao, Z.; Huang, P.; Fang, T.; Yang, B.; Xia, J. Expression and clinical significance of LAG-3, FGL1, PD-L1 and CD8(+)T cells in hepatocellular carcinoma using multiplex quantitative analysis. J. Transl. Med. 2020, 18, 306. [Google Scholar] [CrossRef]
- Wculek, S.K.; Cueto, F.J.; Mujal, A.M.; Melero, I.; Krummel, M.F.; Sancho, D. Dendritic cells in cancer immunology and immunotherapy. Nat. Rev. Immunol. 2020, 20, 7–24. [Google Scholar] [CrossRef] [PubMed]
- Shimasaki, N.; Jain, A.; Campana, D. NK cells for cancer immunotherapy. Nat. Rev. Drug Discov. 2020, 19, 200–218. [Google Scholar] [CrossRef] [PubMed]
- Ma, C.; Han, M.; Heinrich, B.; Fu, Q.; Zhang, Q.; Sandhu, M.; Agdashian, D.; Terabe, M.; Berzofsky, J.A.; Fako, V.; et al. Gut microbiome–mediated bile acid metabolism regulates liver cancer via NKT cells. Science 2018, 360, eaan5931. [Google Scholar] [CrossRef] [PubMed]
- Bae, E.-A.; Seo, H.; Kim, B.-S.; Choi, J.; Jeon, I.; Shin, K.-S.; Koh, C.-H.; Song, B.; Kim, I.-K.; Min, B.S.; et al. Activation of NKT Cells in an Anti-PD-1–Resistant Tumor Model Enhances Antitumor Immunity by Reinvigorating Exhausted CD8 T Cells. Cancer Res 2018, 78, 5315–5326. [Google Scholar] [CrossRef] [PubMed]
- Patel, S.P.; Kurzrock, R. PD-L1 Expression as a Predictive Biomarker in Cancer Immunotherapy. Mol. Cancer Ther. 2015, 14, 847–856. [Google Scholar] [CrossRef]
- Rotman, J.; den Otter, L.A.S.; Bleeker, M.C.G.; Samuels, S.S.; Heeren, A.M.; Roemer, M.G.M.; Kenter, G.G.; Zijlmans, H.J.M.A.A.; van Trommel, N.E.; de Gruijl, T.D.; et al. PD-L1 and PD-L2 Expression in Cervical Cancer: Regulation and Biomarker Potential. Front. Immunol. 2020, 11, 596825. [Google Scholar] [CrossRef]
- Yao, F.; Zhu, Z.F.; Wen, J.; Zhang, F.Y.; Zhang, Z.; Zhu, L.Q.; Su, G.H.; Yuan, Q.W.; Zhen, Y.F.; Wang, X.D. PODN is a prognostic biomarker and correlated with immune infiltrates in osteosarcoma. Cancer Cell Int. 2021, 21, 1–16. [Google Scholar] [CrossRef]
- Fu, Y.; Bao, Q.; Liu, Z.; He, G.; Wen, J.; Liu, Q.; Xu, Y.; Jin, Z.; Zhang, W. Development and Validation of a Hypoxia-Associated Prognostic Signature Related to Osteosarcoma Metastasis and Immune Infiltration. Front. Cell Dev. Biol. 2021, 9, 633607. [Google Scholar] [CrossRef]
- Wang, W.D.; Wu, G.Y.; Bai, K.H.; Shu, L.L.; Chi, P.D.; He, S.Y.; Huang, X.; Zhang, Q.Y.; Li, L.; Wang, D.W.; et al. A prognostic stemness biomarker CCDC80 reveals acquired drug resistance and immune infiltration in colorectal cancer. Clin. Transl. Med. 2020, 10, e225. [Google Scholar] [CrossRef]
- Luo, Y.; Zhang, M.; Wang, Z.; Li, Z.; Chen, X.; Cao, J.; Que, J.; Chen, L.; Deng, X. Effects of SVEP1 on lung squamous cell carcinoma and the association with tumor mutation burden, prognosis and immune regulation. Comb. Chem. High Throughput Screen. 2022; published online ahead of print. [Google Scholar]
- Liu, M.; Yu, Y.; Zhang, Z.; Chen, Z.; Chen, B.; Cheng, Y.; Wei, Y.; Li, J.; Shang, H. AEBP1 as a potential immune-related prognostic biomarker in glioblastoma: A bioinformatic analyses. Ann. Transl. Med. 2021, 9, 1657. [Google Scholar] [CrossRef]
- Ma, Y.; Nenkov, M.; Schröder, D.C.; Abubrig, M.; Gassler, N.; Chen, Y. Fibulin 2 Is Hypermethylated and Suppresses Tumor Cell Proliferation through Inhibition of Cell Adhesion and Extracellular Matrix Genes in Non-Small Cell Lung Cancer. Int. J. Mol. Sci. 2021, 22, 11834. [Google Scholar] [CrossRef] [PubMed]
- Yi, C.-H.; Smith, D.J.; West, W.W.; Hollingsworth, M.A. Loss of Fibulin-2 Expression Is Associated with Breast Cancer Progression. Am. J. Pathol. 2007, 170, 1535–1545. [Google Scholar] [CrossRef] [PubMed]
- Yoshihara, K.; Shahmoradgoli, M.; Martínez, E.; Vegesna, R.; Kim, H.; Torres-Garcia, W.; Trevino, V.; Shen, H.; Laird, P.W.; Levine, D.A.; et al. Inferring tumour purity and stromal and immune cell admixture from expression data. Nat. Commun. 2013, 4, 2612. [Google Scholar] [CrossRef]
- Newman, A.M.; Liu, C.L.; Green, M.R.; Gentles, A.J.; Feng, W.; Xu, Y.; Hoang, C.D.; Diehn, M.; Alizadeh, A.A. Robust enumeration of cell subsets from tissue expression profiles. Nat. Methods 2015, 12, 453–457. [Google Scholar] [CrossRef] [PubMed]
- Hänzelmann, S.; Castelo, R.; Guinney, J. GSVA: Gene set variation analysis for microarray and RNA-Seq data. BMC Bioinform. 2013, 14, 7. [Google Scholar] [CrossRef] [PubMed]
- Ru, B.; Wong, C.N.; Tong, Y.; Zhong, J.Y.; Zhong, S.S.W.; Wu, W.C.; Chu, K.C.; Wong, C.Y.; Lau, C.Y.; Chen, I.; et al. TISIDB: An integrated repository portal for tumor–immune system interactions. Bioinformatics 2019, 35, 4200–4202. [Google Scholar] [CrossRef] [PubMed]
- Wilkerson, M.D.; Hayes, D.N. ConsensusClusterPlus: A class discovery tool with confidence assessments and item tracking. Bioinformatics 2010, 26, 1572–1573. [Google Scholar] [CrossRef]
- Mayakonda, A.; Lin, D.-C.; Assenov, Y.; Plass, C.; Koeffler, H.P. Maftools: Efficient and comprehensive analysis of somatic variants in cancer. Genome Res. 2018, 28, 1747–1756. [Google Scholar] [CrossRef]
- Love, M.I.; Huber, W.; Anders, S. Moderated estimation of fold change and dispersion for RNA-seq data with DESeq2. Genome Biol. 2014, 15, 550. [Google Scholar] [CrossRef]
- Langfelder, P.; Horvath, S. WGCNA: An R package for weighted correlation network analysis. BMC Bioinform. 2008, 9, 559. [Google Scholar] [CrossRef]
- Yu, G.; Wang, L.-G.; Han, Y.; He, Q.-Y. clusterProfiler: An R Package for Comparing Biological Themes Among Gene Clusters. OMICS J. Integr. Biol. 2012, 16, 284–287. [Google Scholar] [CrossRef] [PubMed]
- Szklarczyk, D.; Gable, A.L.; Nastou, K.C.; Lyon, D.; Kirsch, R.; Pyysalo, S.; Doncheva, N.T.; Legeay, M.; Fang, T.; Bork, P.; et al. The STRING database in 2021: Customizable protein-protein networks, and functional characterization of user-uploaded gene/measurement sets. Nucleic Acids Res. 2021, 49, D605–D612. [Google Scholar] [CrossRef] [PubMed]


Disclaimer/Publisher’s Note: The statements, opinions and data contained in all publications are solely those of the individual author(s) and contributor(s) and not of MDPI and/or the editor(s). MDPI and/or the editor(s) disclaim responsibility for any injury to people or property resulting from any ideas, methods, instructions or products referred to in the content. |
© 2023 by the authors. Licensee MDPI, Basel, Switzerland. This article is an open access article distributed under the terms and conditions of the Creative Commons Attribution (CC BY) license (https://creativecommons.org/licenses/by/4.0/).
Share and Cite
Yang, C.; Shao, Y.; Wang, X.; Wang, J.; Wang, P.; Huang, C.; Wang, W.; Wang, J. The Effect of the Histone Chaperones HSPA8 and DEK on Tumor Immunity in Hepatocellular Carcinoma. Int. J. Mol. Sci. 2023, 24, 2653. https://doi.org/10.3390/ijms24032653
Yang C, Shao Y, Wang X, Wang J, Wang P, Huang C, Wang W, Wang J. The Effect of the Histone Chaperones HSPA8 and DEK on Tumor Immunity in Hepatocellular Carcinoma. International Journal of Molecular Sciences. 2023; 24(3):2653. https://doi.org/10.3390/ijms24032653
Chicago/Turabian StyleYang, Chuanxin, Yaodi Shao, Xiangjun Wang, Jie Wang, Puxiongzhi Wang, Chao Huang, Wei Wang, and Jian Wang. 2023. "The Effect of the Histone Chaperones HSPA8 and DEK on Tumor Immunity in Hepatocellular Carcinoma" International Journal of Molecular Sciences 24, no. 3: 2653. https://doi.org/10.3390/ijms24032653
APA StyleYang, C., Shao, Y., Wang, X., Wang, J., Wang, P., Huang, C., Wang, W., & Wang, J. (2023). The Effect of the Histone Chaperones HSPA8 and DEK on Tumor Immunity in Hepatocellular Carcinoma. International Journal of Molecular Sciences, 24(3), 2653. https://doi.org/10.3390/ijms24032653