Article

Changes in Plasma Metabolomic Profile Following Bariatric Surgery, Lifestyle Intervention or Diet Restriction—Insights from Human and Rat Studies

1
Department of General, Visceral, and Transplant Surgery, Ludwig-Maximilians-University Munich, 81377 Munich, Germany
2
Department of Internal Medicine I, Division of Endocrinology and Diabetes, University Hospital, University of Wuerzburg, 97080 Wuerzburg, Germany
3
Central Laboratory, Core Unit Clinical Mass Spectrometry, University Hospital, University of Wuerzburg, 97080 Wuerzburg, Germany
4
Department of General and Visceral Surgery, Sana-Krankenhaus Huerth GmbH, 50354 Huerth, Germany
*
Author to whom correspondence should be addressed.
Int. J. Mol. Sci. 2023, 24(3), 2354; https://doi.org/10.3390/ijms24032354
Submission received: 31 October 2022 / Revised: 28 December 2022 / Accepted: 21 January 2023 / Published: 25 January 2023
(This article belongs to the Special Issue Role of Nutrition in Human Health and Disease)

Abstract

:
Although bariatric surgery is known to change the metabolome, it is unclear if this is specific for the intervention or a consequence of the induced bodyweight loss. As the weight loss after Roux-en-Y Gastric Bypass (RYGB) can hardly be mimicked with an evenly effective diet in humans, translational research efforts might be helpful. A group of 188 plasma metabolites of 46 patients from the randomized controlled Würzburg Adipositas Study (WAS) and from RYGB-treated rats (n = 6) as well as body-weight-matched controls (n = 7) were measured using liquid chromatography tandem mass spectrometry. WAS participants were randomized into intensive lifestyle modification (LS, n = 24) or RYGB (OP, n = 22). In patients in the WAS cohort, only bariatric surgery achieved a sustained weight loss (BMI −34.3% (OP) vs. −1.2% (LS), p ≤ 0.01). An explicit shift in the metabolomic profile was found in 57 metabolites in the human cohort and in 62 metabolites in the rodent model. Significantly higher levels of sphingolipids and lecithins were detected in both surgical groups but not in the conservatively treated human and animal groups. RYGB leads to a characteristic metabolomic profile, which differs distinctly from that following non-surgical intervention. Analysis of the human and rat data revealed that RYGB induces specific changes in the metabolome independent of weight loss.

1. Introduction

The prevalence of obesity has nearly tripled in the last 40 years and continues to increase in many parts of the world [1]. Recent studies report at least 30% of men and 35% of women to be obese in the US [2]. As a result, obesity and related metabolic disorders, particularly type 2 diabetes, are responsible for more deaths than undernourishment in most countries of the world [1]. Insulin resistance (IR), cardiovascular diseases and musculoskeletal disorders [3,4] as well as several types of cancer are well-known comorbidities of obesity [3,5,6]. Bariatric surgery, such as Roux-en-Y Gastric Bypass (RYGB), has proven not only to achieve a sustained weight loss but also a remission of diabetes and an improvement in other comorbidities [7,8].
Obesity correlates with an alteration in the small molecules in the fluids and tissues of the body [9,10]. The composition of these circulating small molecules or metabolites, the so-called metabolome, changes with obesity itself and again with an effective treatment [11]. It is well known that metabolomic profiles consisting of acylcarnitines (C), phosphatidylcholines (PC), lysophosphatidylcholines (lysoPC), sphingolipids (SM), amino acids, sugars and nucleotides correlate with lifestyle factors in general [9,12]. Blood metabolomic profiles of obesity and IR were characterized in multiple observation studies [13,14]. Notably a profound shift in SMs, PCs and amino acids after bariatric surgery has been repeatedly described [4,15]. Furthermore, associations between the branched-chain amino acids (BCAA), isoleucine, leucine and valine and the body mass index (BMI) were consistently reported [16]. BCAA have been described previously as potential biomarkers for IR [17,18]. Although the pathophysiological background of most of these metabolites has been shown before, the knowledge about causality and translational relevance is still poorly understood [11,19,20]. One reliable method to measure targeted metabolomics is liquid chromatography coupled with tandem mass spectrometry (LC-MS/MS) [21]. This high-throughput analysis allows the quantification of large numbers of low-molecular-weight metabolites in fluids, cells or tissue [5,11].
To identify metabolomic changes induced by RYGB, serum samples of morbidly obese patients treated with bariatric surgery (OP) or psychotherapy-enhanced lifestyle intervention (LS) from the randomized controlled Würzburg Adipositas Study (WAS) were analyzed as well as samples of rats treated with RYGB and body-weight-matched controls under a restrictive diet [22].

2. Results

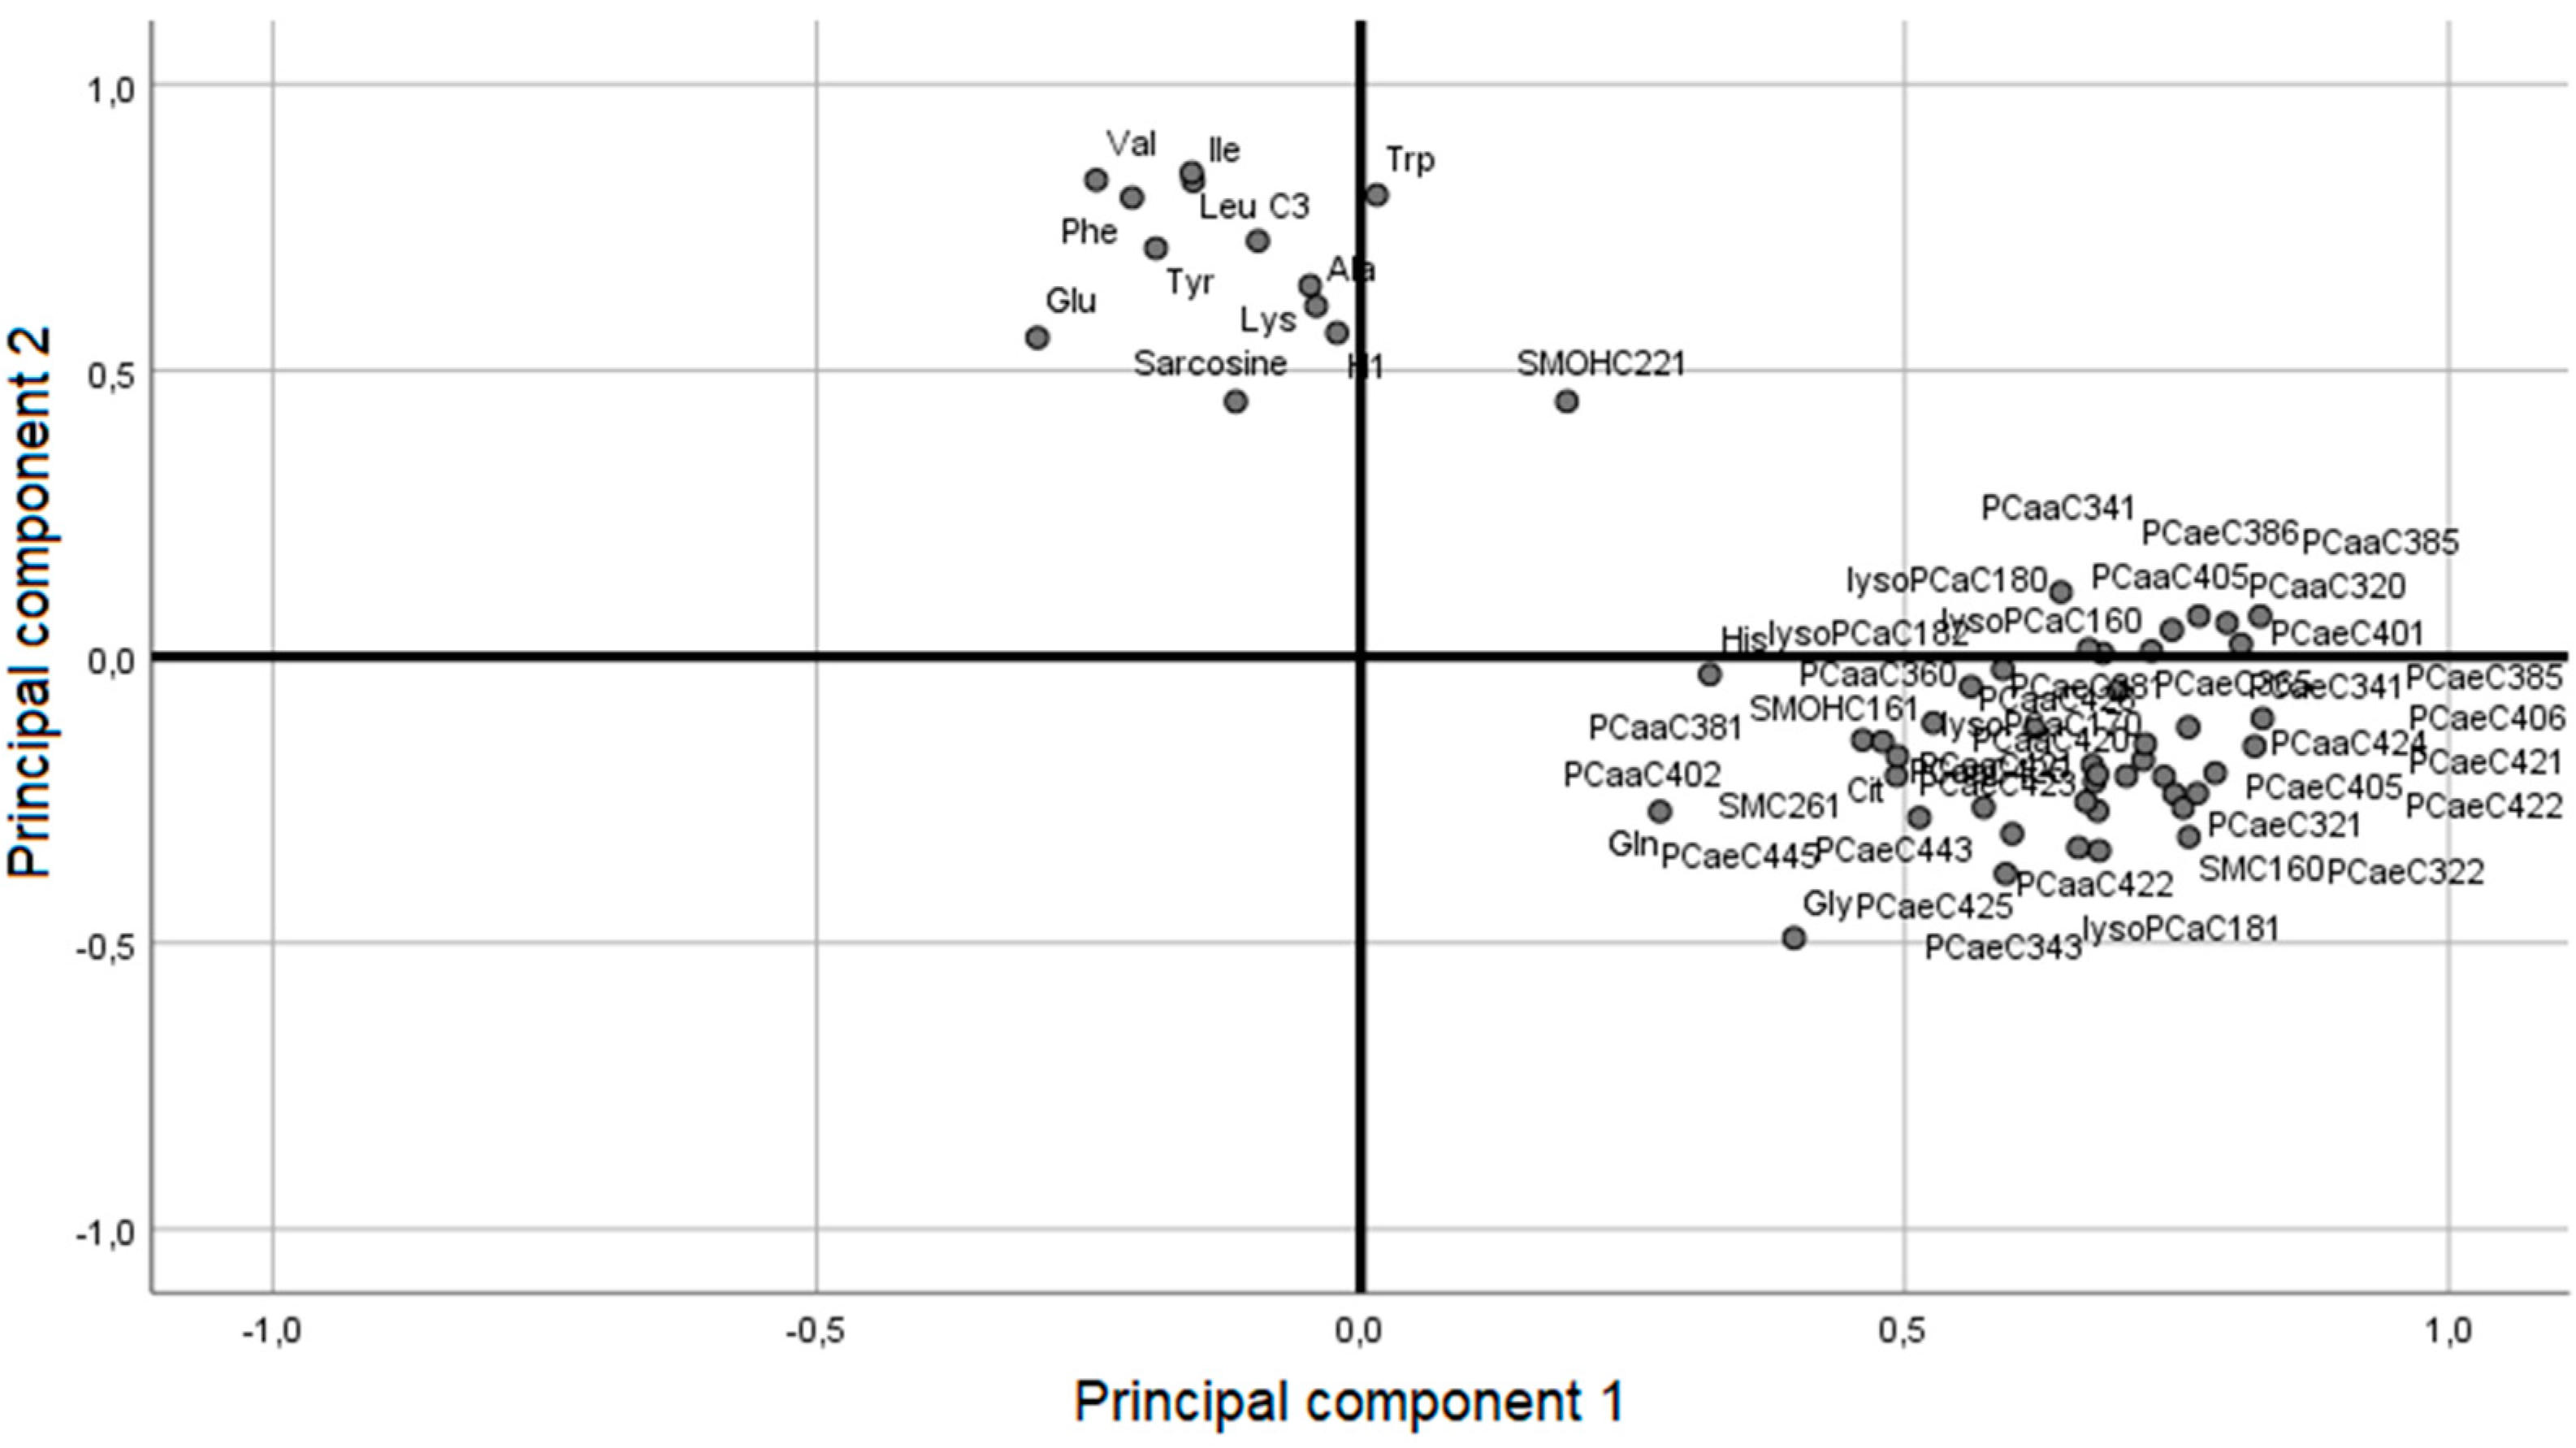
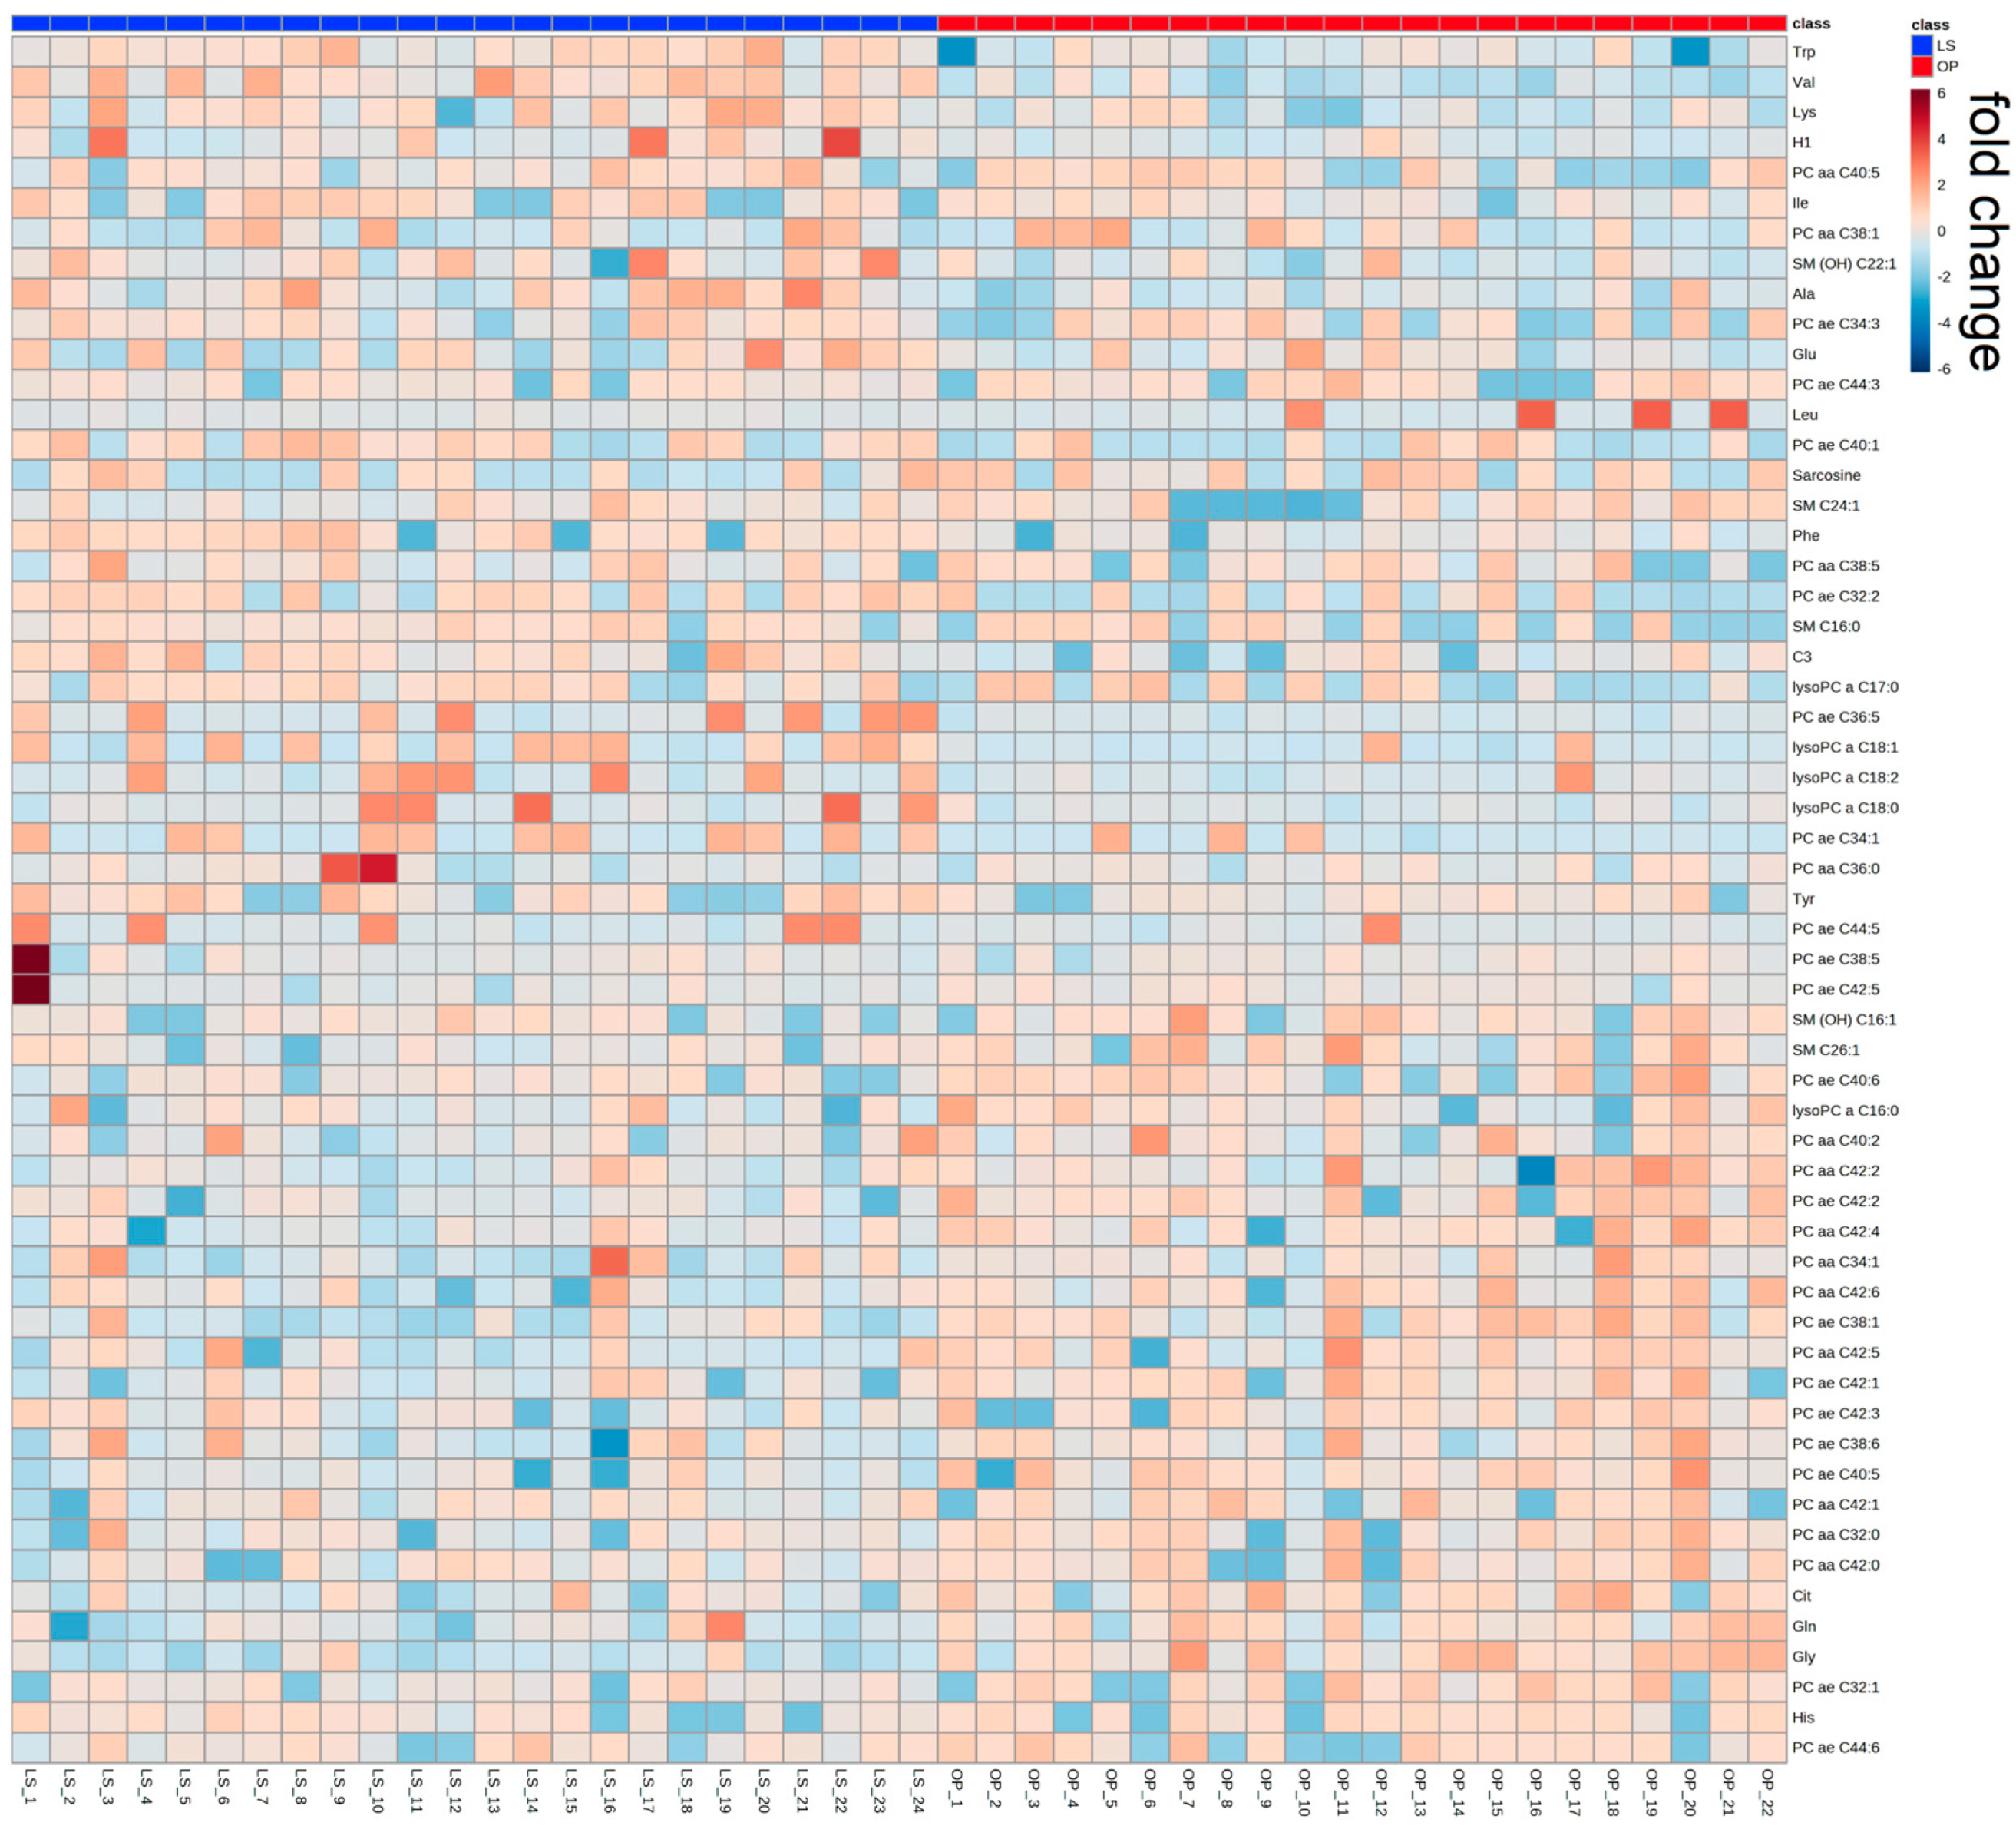
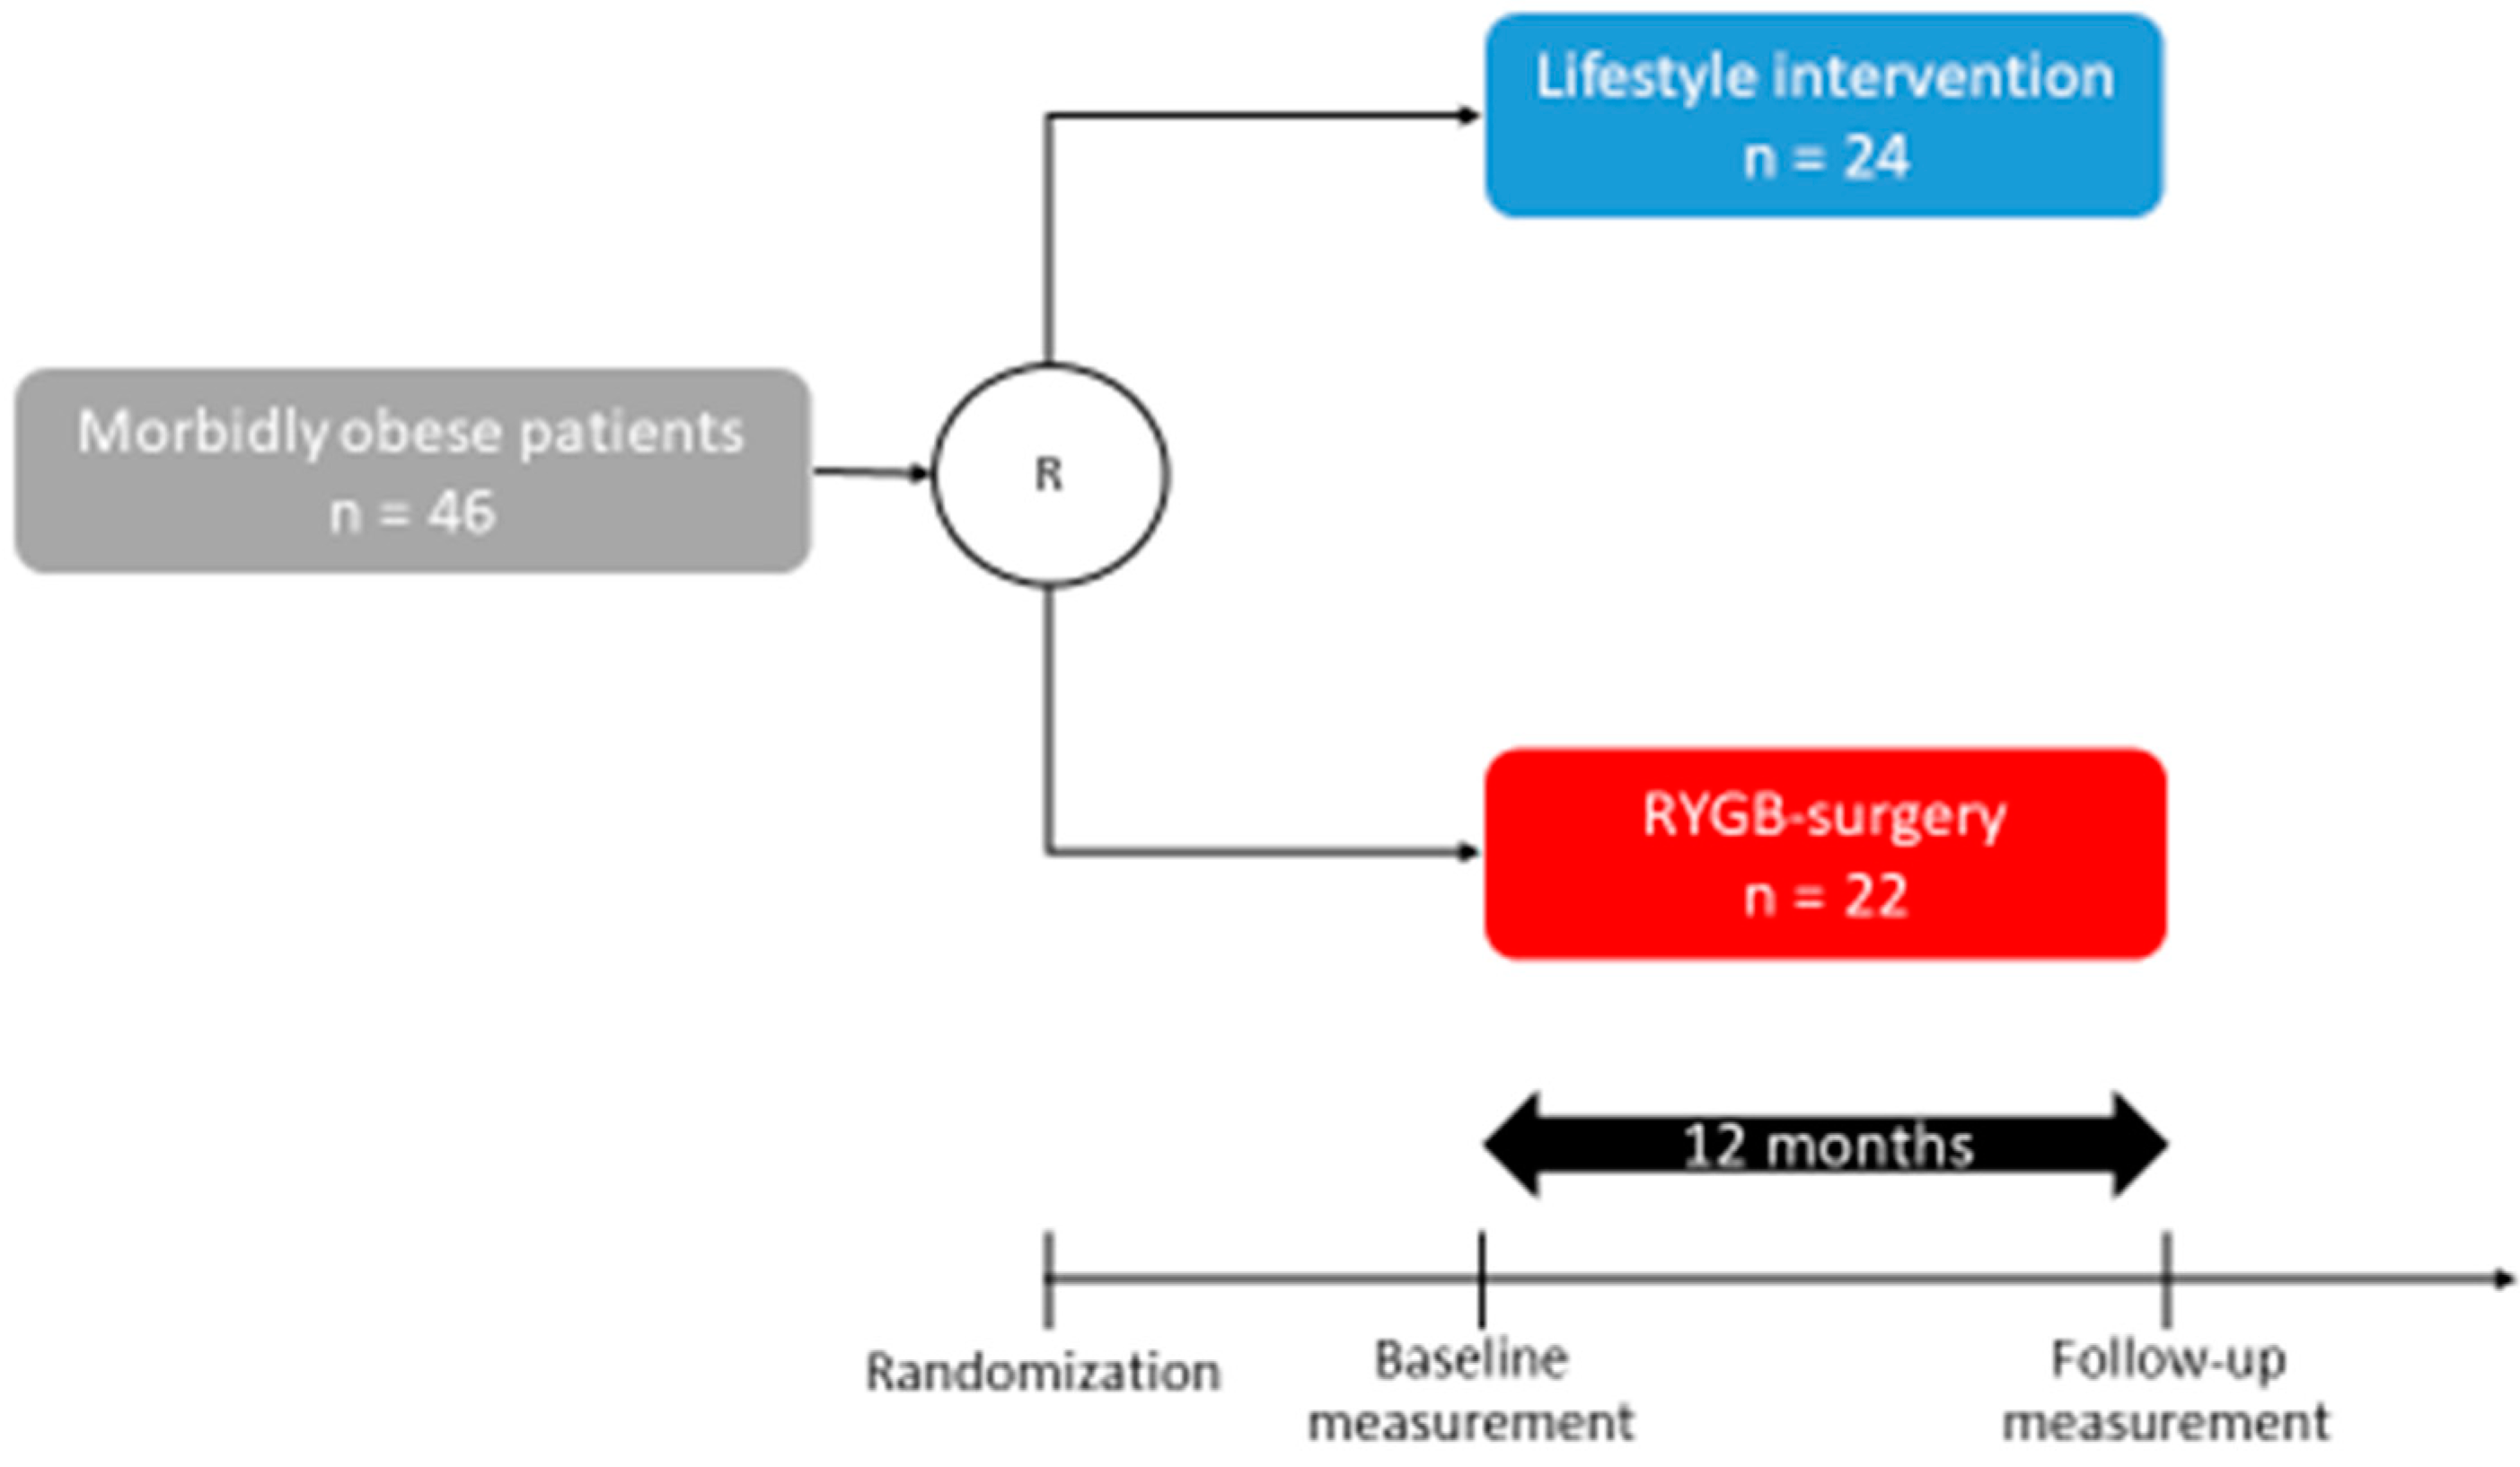
2.1. Participants from the WAS Trial
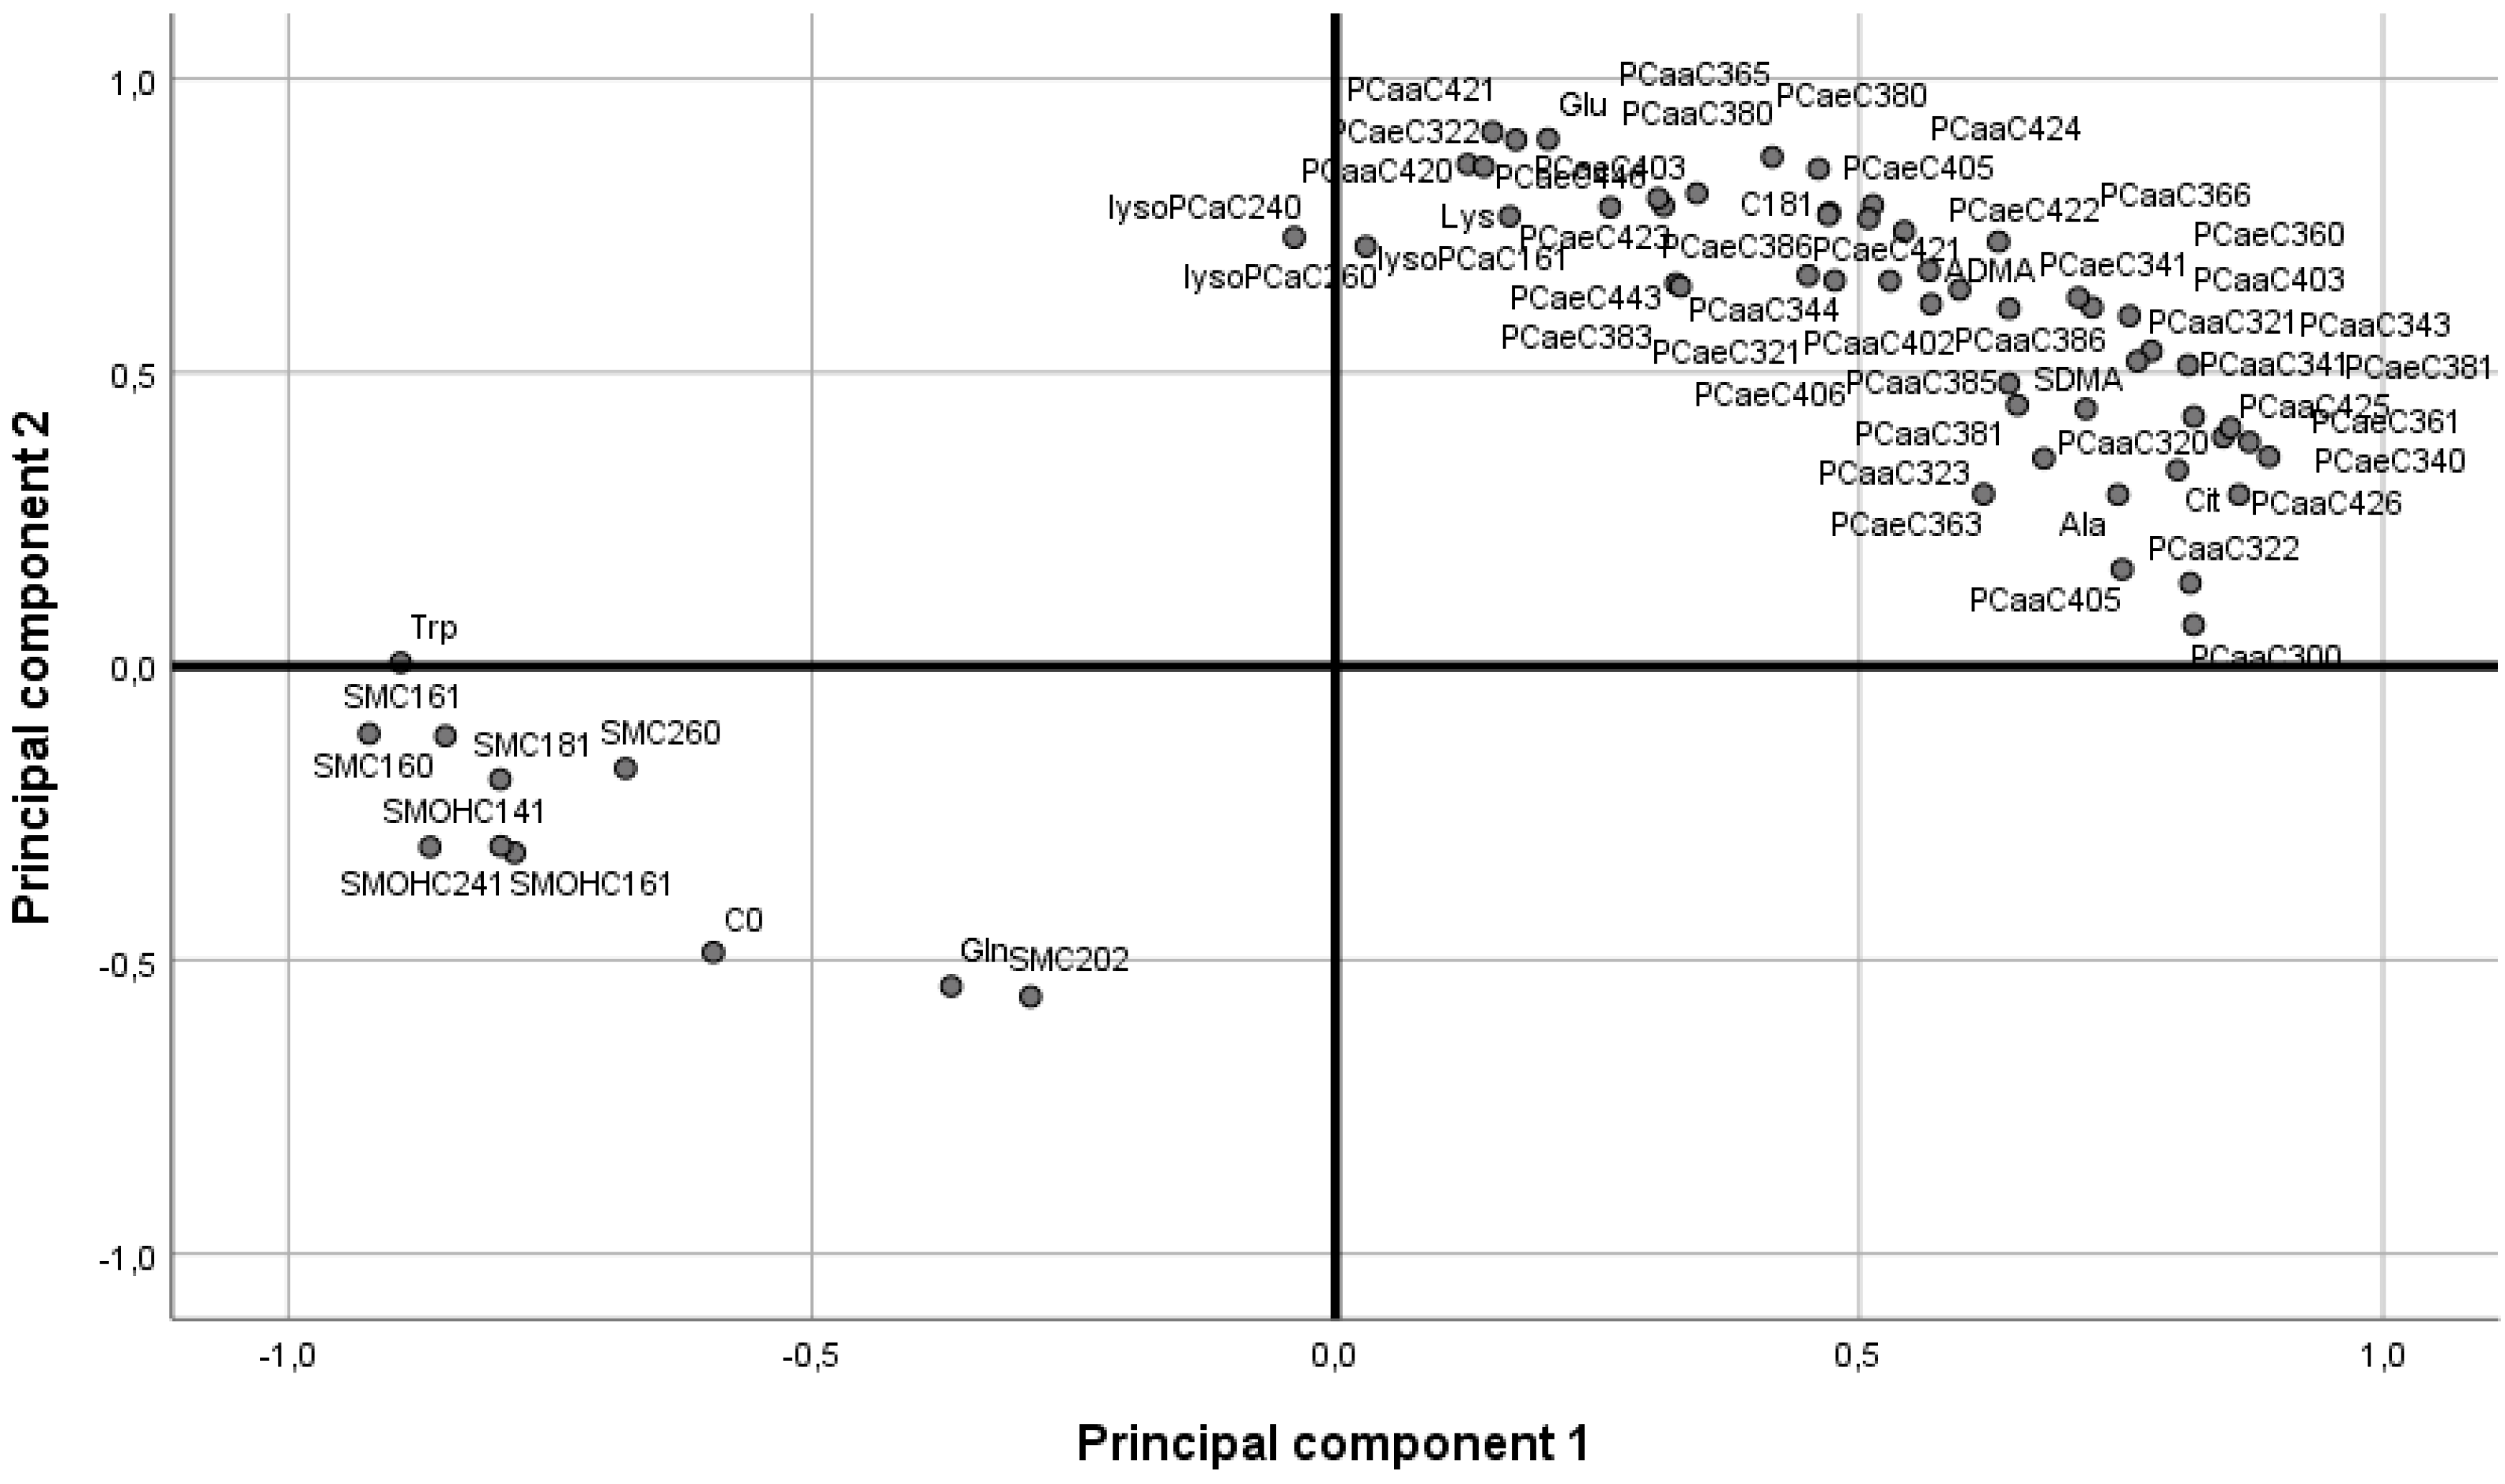
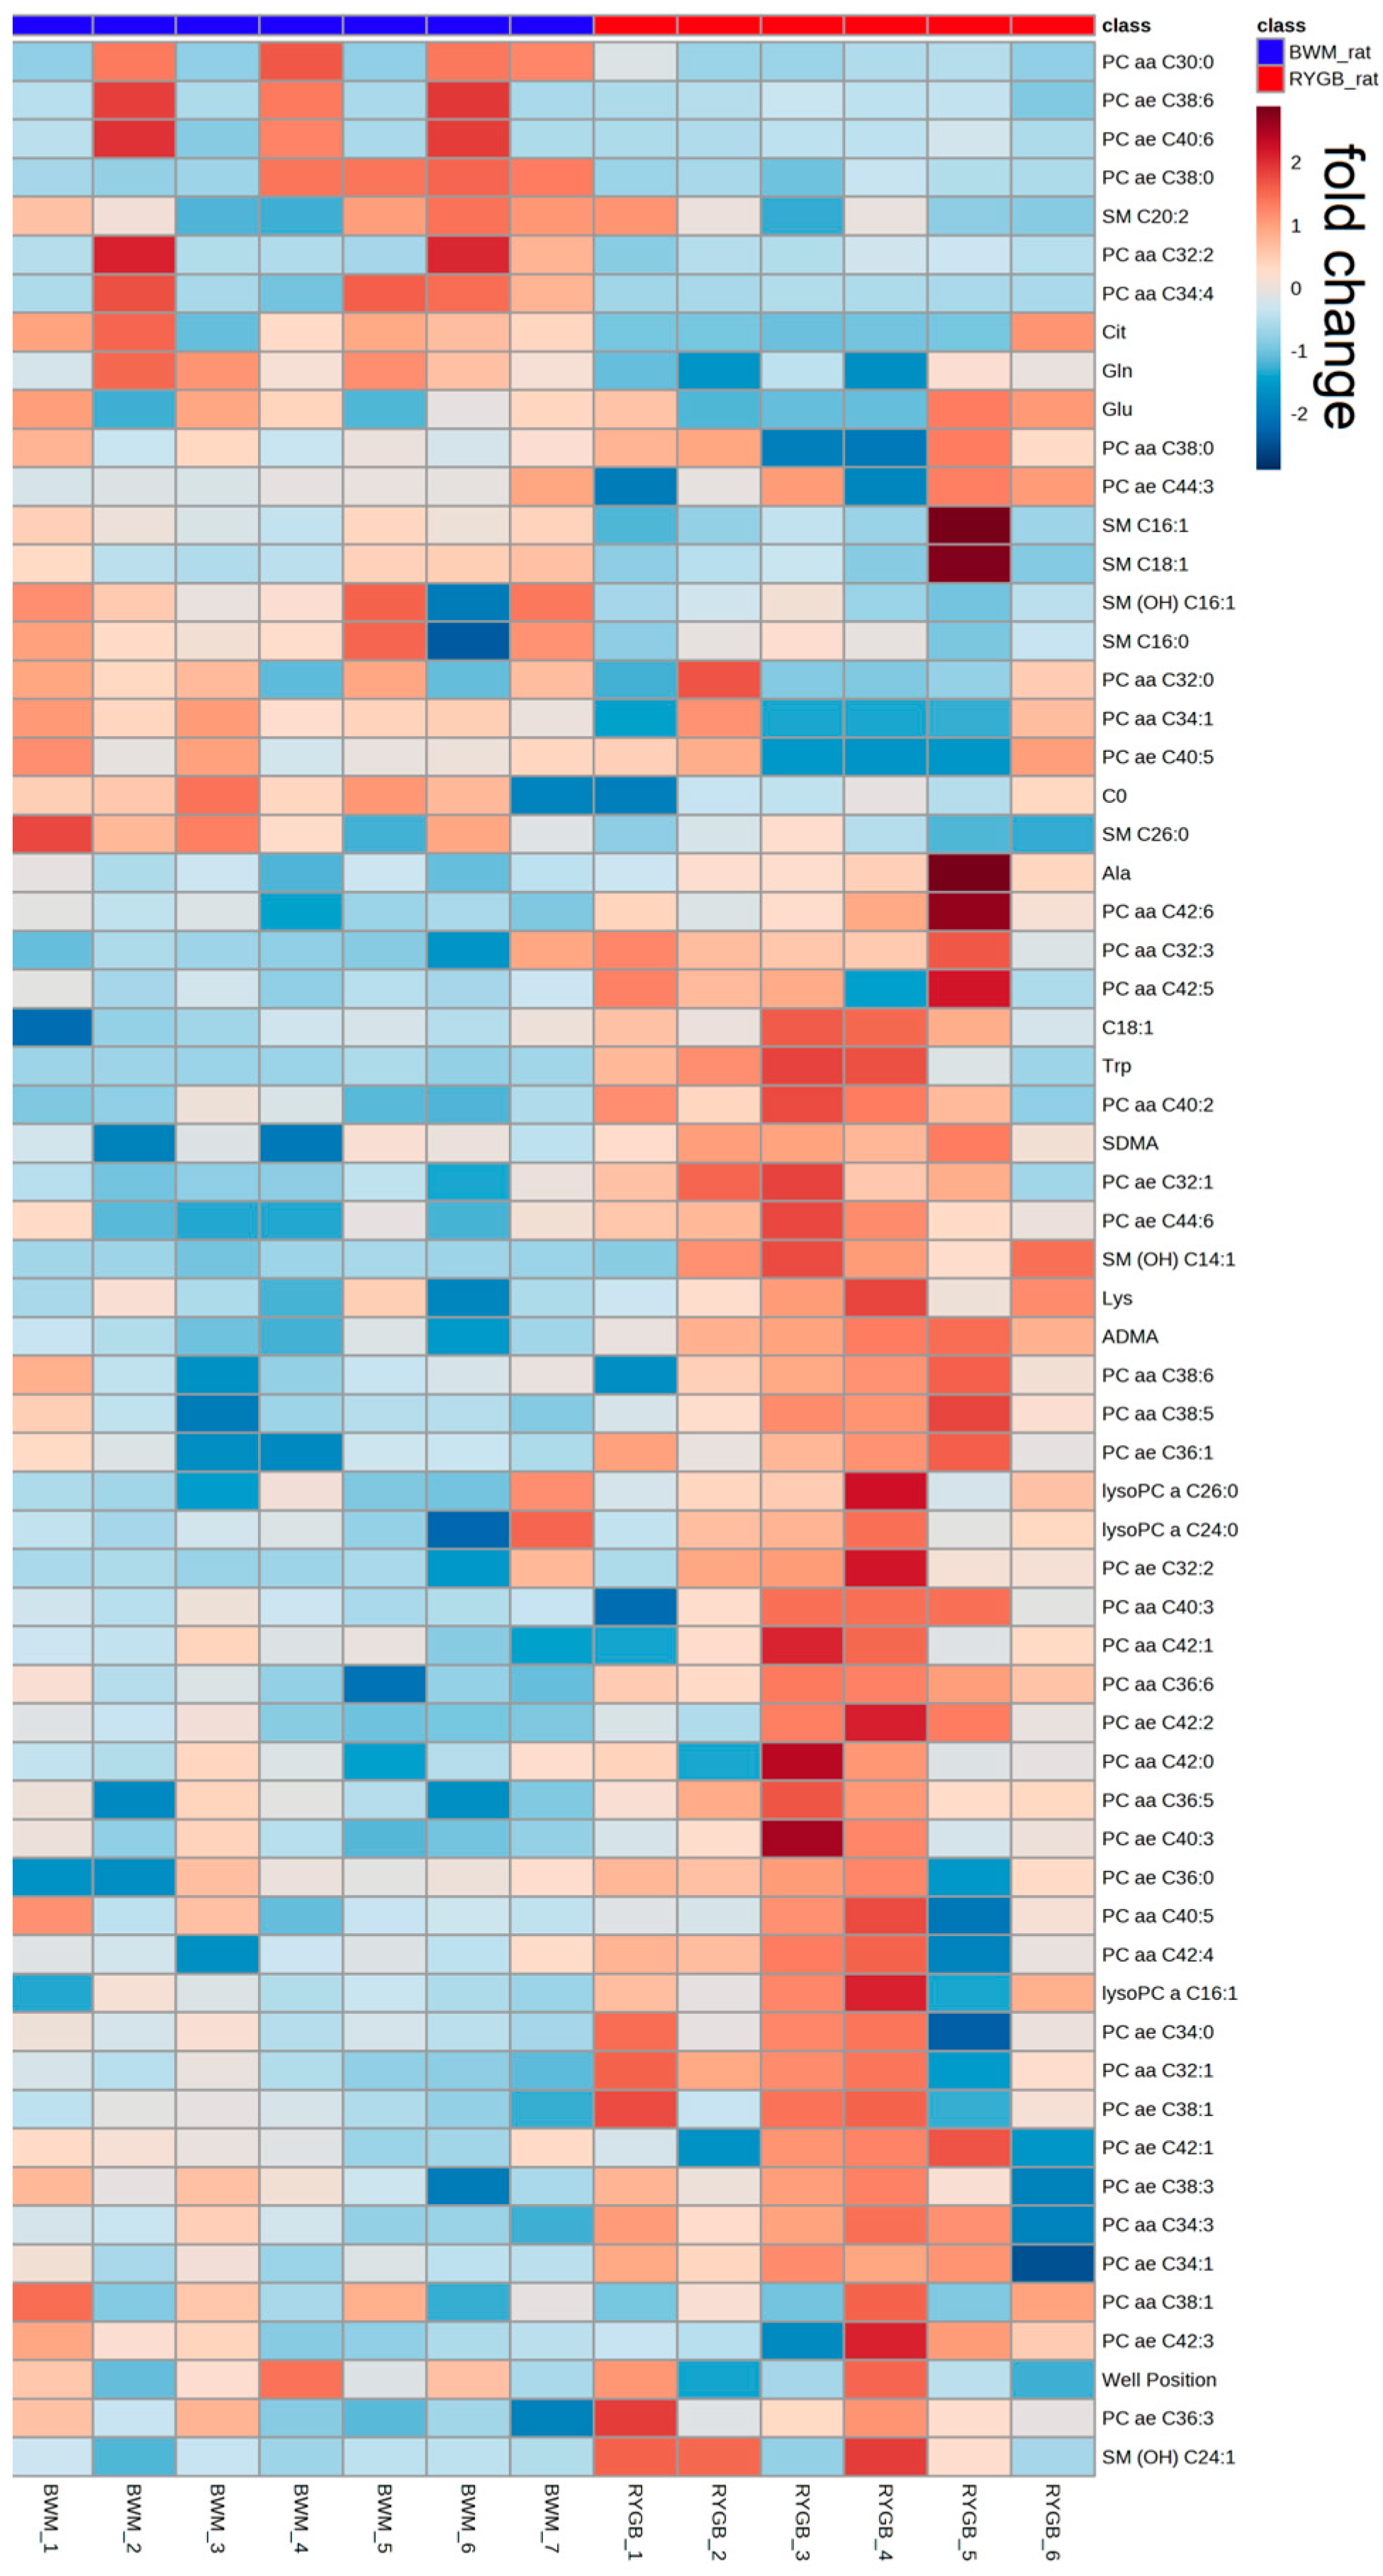
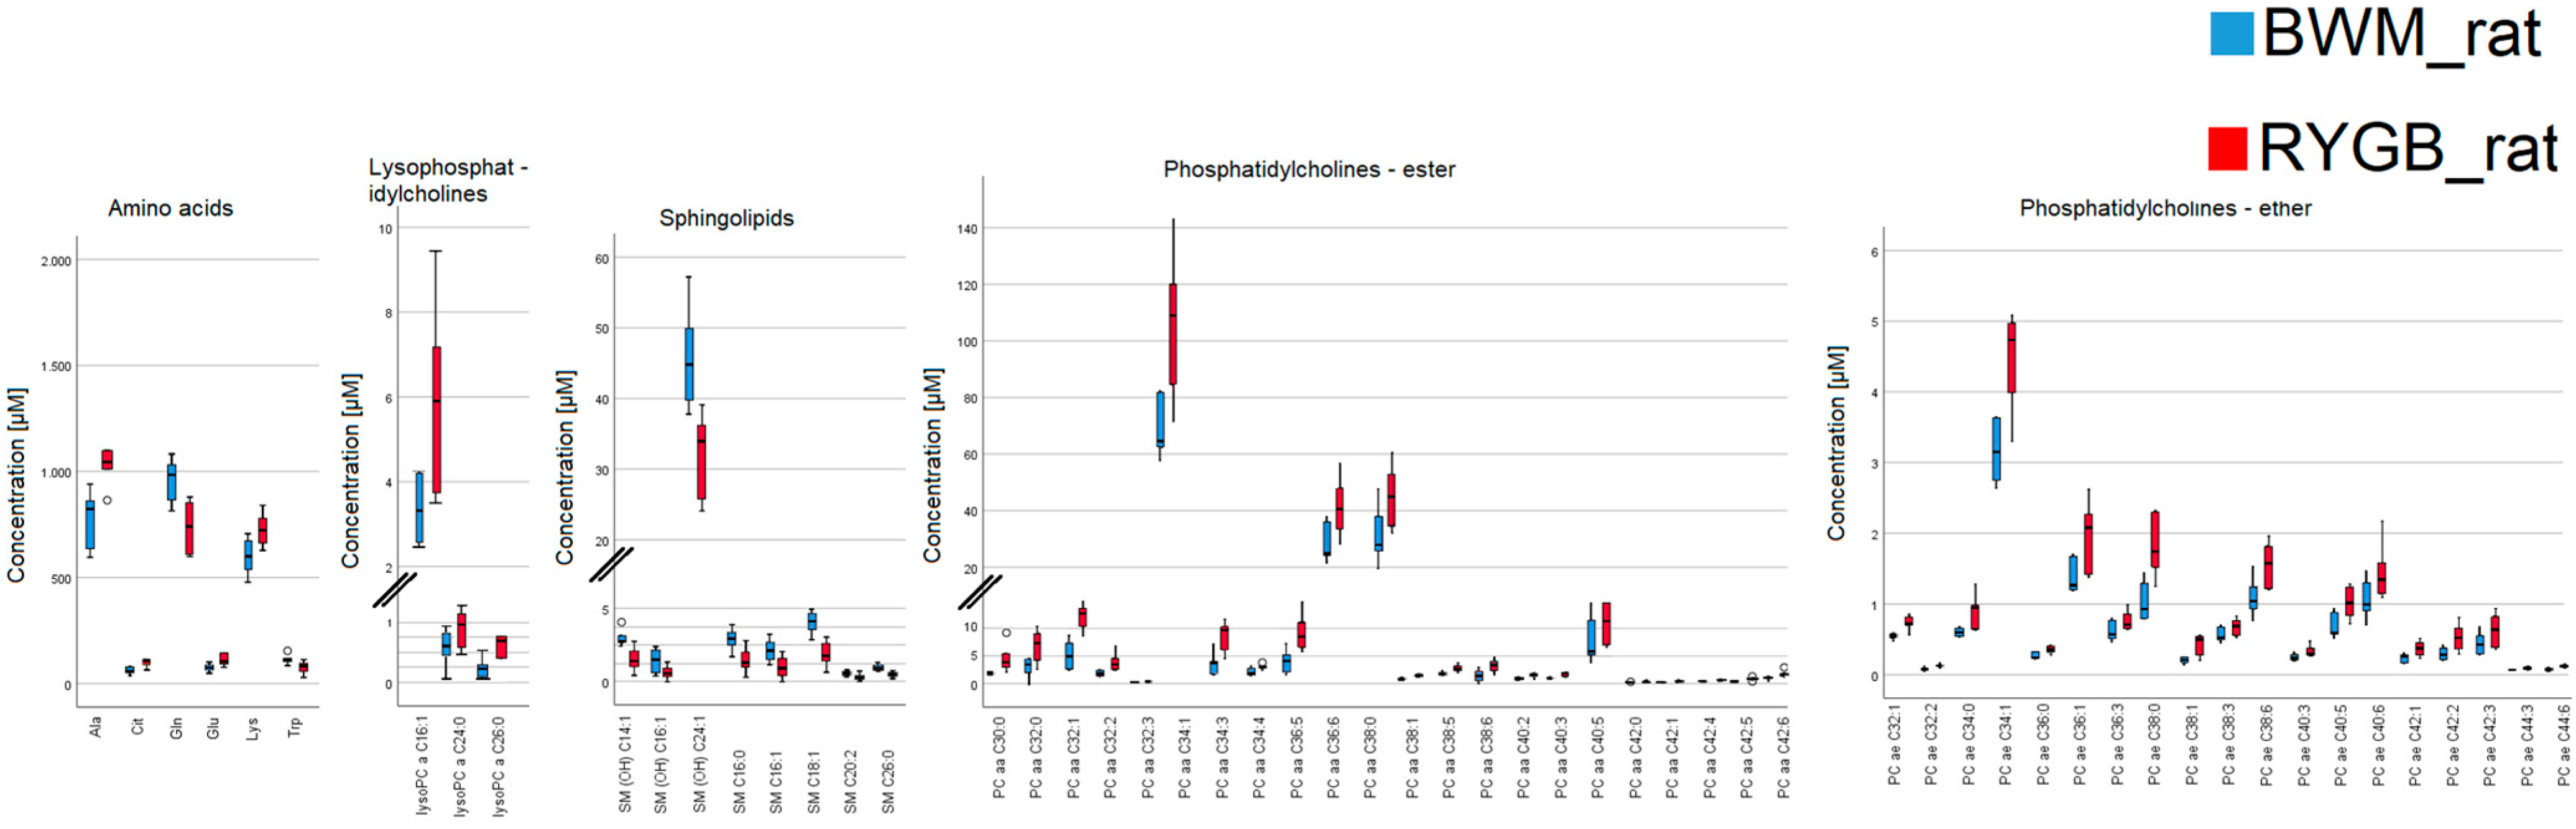
Characteristics of the patient cohort at the start of the study have been described in detail previously [22]. At baseline, the patients had a mean BMI of 48 kg/m2. Further clinical characteristics are presented in Table 1. Significant differences could be detected in thirteen metabolites between both groups. No biochemical pathway could be identified with these thirteen metabolites via principal component analysis (see Supplementary Figure S1).
At 1-year follow-up patients of the RYGB-surgery group achieved a significant weight loss of −34.3% (BMI 49.1 [46–51] kg/m2 vs. 32 [30–33] kg/m2, p < 0.01) as well as a significant improvement in IR measured by the Homeostatic Model Assessment for Insulin Resistance (HOMA-IR) (5.1 [4.6–6.1] vs. 1.4 [1–1.9], p < 0.01). In contrast, a non-significant weight loss of −1.2% (BMI 48.2 [45–50] vs. 47.5 [45–49] kg/m2, p = 0.07) was detected in the LS group one year after randomization. Accordingly, there was no significant change in the HOMA-IR (7.5 [6.7–7.8] vs. 7.5 [3.3–7.8], p = 0.1). Apart from the gender distribution, no significant differences in clinical parameters could be detected at baseline (see Table 1).
A total of 188 metabolites were measured in 46 serum samples at randomization and one year after randomization. Forty-nine metabolites were not considered due to exclusion criteria. Thus, 139 metabolites (9 Cs, 21 amino acids, 9 biogenic amines, 13 lysoPCs, 72 PCs, a hexose and 14 SMs) were valid and retained for the main analysis and the derivation of metabolomic profiles. Fifty-seven metabolites were found to be significantly different between groups (1 acylcarnitine, 13 amino acids, 1 biogenic amine, 5 lysoPCs, 31 PCs, 5 SMs and a hexose) as shown in Table 2.
The performed principal component analysis (PCA) resulted in twelve discriminating components with an eigenvalue > 1. The first two components explained 49% of the variance. Hence, further investigation was performed based on a two-component model. The first principal component (PC1) was characterized predominantly by phosphatidylcholines and sphingolipids, whereas the second principal component (PC2) was characterized by BCAA, aromatic acids and acylcarnitines (see Figure 1).
We performed hierarchical clustering of the 57 metabolites with significant differences between the LS and OP group (see Figure 2) at one-year follow-up. A cluster of phosphatidylcholines, especially PC aa C42:Ys, as well as in SM (OH) C16:1, SM C26:1, lysoPC a C16:0, glutamine, glycine, citrulline and histidine were identified to be enriched only in patients from the OP group but not in patients from the LS group.

2.2. Rodent Model

Characteristics of the rodent model have been described in detail previously [23]. Rats of the bariatric surgery group (RYGB_rat) experienced a significant weight loss of −7.3% (486.8 ± 9.3 g vs. 451.3 ± 18.5 g). In the body-weight-matched group (BWM_rat), a weight loss of 1.1% (481.9 ± 12.7 g vs. 476.4 ± 28.8 g) could be detected. At the time of the blood sampling, the body weights of RYGB_rat and BWM_rat were not significantly different (p = 0.16). A total of 188 metabolites were measured. Fifty-seven metabolites were excluded due to the below-mentioned criteria. A total of 131 metabolites (6 Cs, 19 amino acids, 10 biogenic amines, 13 lysoPCs, 68 PCs, a hexose and 14 SMs) were valid and retained for the main analysis and the derivation of metabolomic profiles. Sixty-two metabolites were found to be significantly different as shown in Table 3.
Further analysis of these metabolites (2 acylcarnitines, 6 amino acids, 2 biogenic amine, 3 lysoPCs, 41 PCs and 8 sphingolipids) with PCA showed that the first two components explained 74% of the variance. PC1 was mainly characterized by phosphatidylcholines. PC2 was not characterized by a specific subgroup of metabolites (see Figure 3) four weeks after the start of the interventions.
We performed hierarchical clustering of the 62 metabolites with significant differences between the RYGB_rat and the BWM_rat group (see Figure 4). A cluster of phosphatidylcholines with ester and ether bonding, especially PC aa C42:Ys, as well as in SM (OH) C14:1, SM (OH) C24:1, lysoPC a C16:1, lysine, tryptophane, alanine and in the biogenic amines ADMA and SDMA were identified as being enriched only in the RYGB_rat group but not in the weight-identical BWM_rat group.

2.3. Analysis of Overlapping Metabolomic Profiles in the Human OP and the Rat RYGB Group

Thirty-one metabolites with significant differences in both OP vs. LS and RYGB_rat vs. BWM_rat could be identified (see Table 4). Additionally, we performed an indirect comparison between the human data and the rodent model. In accordance with previously published data, the transferability of data from a morbidly obese patient to a rat with diet-induced obesity has to be performed with caution and only in cohesion with methodical comparability (e.g., comparable surgery) [24]. In indirect comparison to the conservatively treated groups LS and BWM_rat, the surgical groups OP and the RYGB_rat were characterized by metabolomic profiles of increased long-chain phosphatidylcholines and citrulline as well as decreased tryptophan (see Figure 5 and Figure 6). The data are presented as means with standard deviation, respectively.
In terms of individual metabolites, six amino acids with a significant difference between RYGB_rat and BWM_rat were also found to be significantly different in the human cohort: Alanine (485.6 µM in LS vs. 392.6 µM in OP; 829 µM in BWM_rat vs. 1044.5 µM in RYGB_rat), citrulline (25.5 µM in LS vs. 35.8 µM in OP; 73.3 µM in BWM_rat vs. 123.5 µM in RYGB_rat), glutamine (702 µM in LS vs. 834 µM in OP; 946 µM in BWM_rat vs. 735.5 µM in RYGB_rat), glutamate (73.7 µM in LS vs. 38.5 µM in OP; 67 µM in BWM_rat vs. 99.2 µM in RYGB_rat), lysine (296.9 µM in LS vs. 260.5 µM in OP; 602 µM in BWM_rat vs. 722.5 µM in RYGB_rat) and tryptophan (65.5 µM in LS vs. 54.5 µM, in OP; 113 µM in BWM_rat vs. 82.3 µM in RYGB_rat).
Analyzing the phosphatidylcholines with ester bonding, eleven PCs could be identified to be significantly different in both comparisons: PC aa C32:0 (16.0 µM in LS vs. 18.5 µM in OP; 5.7 µM in BWM_rat vs. 11.4 µM in RYGB_rat), PC aa C34:1 (257 µM in LS vs. 283 µM in OP; 66 µM in BWM_rat vs. 106 µM in RYGB_rat), PC aa C38:1 (0.62 µM in LS vs. 0.97 µM in OP; 0.43 µM in BWM_rat vs. 1.08 µM in RYGB_rat), PC aa C38:5 (44.1 µM in LS vs. 52.1 µM in OP; 24.3 µM in BWM_rat vs. 40.5 µM in RYGB_rat), PC aa C40:2 (0.16 µM in LS vs. 0.19 µM in OP; 0.26 µM in BWM_rat vs. 0.51 µM in RYGB_rat) and PC aa C40:5 (6.5 µM in LS vs. 8.0 µM in OP; 5.7 µM in BWM_rat vs. 9.2 µM in RYGB_rat).
Five of these PCs are characterized by forty-two carbon atoms (PC aa C42:Y): PC aa C42:0 (0.29 µM in LS vs. 0.35 µM in OP; 0.06 µM in BWM_rat vs. 0.10 µM in RYGB_rat), PC aa C42:1 (0.13 µM in LS vs. 0.16 µM in OP; 0.08 µM in BWM_rat vs. 0.11 µM in RYGB_rat), PC aa C42:4 (0.09 µM in LS vs. 0.12 µM in OP; 0.13 µM in BWM_rat vs. 0.20 µM in RYGB_rat), PC aa C42:5 (0.21 µM in LS vs. 0.28 µM in OP; 0.13 µM in BWM_rat vs. 0.28 µM in RYGB_rat) and PC aa C42:6 (0.24 µM in LS vs. 0.29 µM in OP; 0.31 µM in BWM_rat vs. 0.49 µM in RYGB_rat).
Twelve phosphatidylcholines with ether bonding were found to be significantly different in the human cohort, ten of these phosphatidylcholines were significantly different in RYGB_rat vs. BWM_rat: PC ae C32:1 (3.18 µM in LS vs. 3.85 µM in OP; 0.54 µM in BWM_rat vs. 0.72 µM in RYGB_rat), PC ae C32:2 (0.85 µM in LS vs. 1.04 µM in OP; 0.09 µM in BWM_rat vs. 0.12 µM in RYGB_rat), PC ae C34:1 (10.5 µM in LS vs. 12.7 µM in OP; 2.97 µM in BWM_rat vs. 4.73 µM in RYGB_rat), PC ae C38:1 (0.17 µM in LS vs. 0.31 µM in OP; 0.19 µM in BWM_rat vs. 0.49 µM in RYGB_rat), PC ae C38:6 (5.89 µM in LS vs. 6.51 µM in OP; 1.13 µM in BWM_rat vs. 1.57 µM in RYGB_rat), PC ae C40:5 (2.32 µM in LS vs. 2.93 µM in OP; 0.59 µM in BWM_rat vs. 1.01 µM in RYGB_rat), PC ae C40:6 (2.79 µM in LS vs. 3.44 µM in OP; 1.05 µM in BWM_rat vs. 1.34 µM in RYGB_rat), PC ae C42:1 (0.25 µM in LS vs. 0.33 µM in OP; 0.25 µM in BWM_rat vs. 0.37 µM in RYGB_rat), PC ae C42:2 (0.35 µM in LS vs. 0.45 µM in OP; 0.23 µM in BWM_rat vs. 0.52 µM in RYGB_rat), PC ae C42:3 (0.44 µM in LS vs. 0.51 µM in OP; 0.43 µM in BWM_rat vs. 0.63 µM in RYGB_rat), PC ae C44:3 (0.1 µM in LS vs. 0.11 µM in OP; 0.06 µM in BWM_rat vs. 0.10 µM in RYGB_rat) and PC ae C44:6 (0.68 µM in LS vs. 0.81 µM in OP; 0.06 µM in BWM_rat vs. 0.11 µM in RYGB_rat).
Finally, two out of five sphingolipids with a significant difference in the human cohort were also found to be significantly different in the rodent model: SM (OH) C16:1 (2.27 µM in LS vs. 2.54 µM in OP; 0.73 µM in BWM_rat vs. 0.42 µM in RYGB_rat), and SM C16:0 (77.5 µM in LS vs. 93.4 µM in OP; 46.6 µM in BWM_rat vs. 32.2 µM in RYGB_rat). No lysophosphatidylcholines were found to overlap in both comparisons.

3. Discussion

The aim of our study was to identify and characterize a comprehensive metabolomic profile, which highlights the effect of bariatric surgery on the metabolome beyond weight loss. Whereas patients of the WAS intensified lifestyle group failed to lose weight significantly, patients with bariatric surgery lost a significant amount of their body weight as expected. To clarify the role of RYGB-induced body weight loss itself, the same metabolomic parameters were analyzed in rats treated with RYGB or a similar effective food restriction regime.
Examining the human data, twelve principal components with 57 significantly different metabolites between the LS and OP group were identified at 1-year follow-up. A characteristic metabolomic profile could be identified including two main components of differentiation. Upon closer examination of these components, sphingolipids and phosphatidylcholines were identified as the main metabolomic subgroups separating the two human cohorts. Both lipid groups are essential in the formation of the cell membrane and intracellular signal transduction.
Sphingolipids maintain lipid microenvironments of plasma membranes and form lipid rafts [19]. As well as their role as components of the cell membrane, sphingolipids build the carcass of myelin sheaths [25]. Recently, higher concentrations of sphingolipids together with low concentrations of BCAAs have been reported to correlate with a healthy liver phenotype [26]. The importance of sphingolipids in IR has been highlighted previously [27]. Phosphatidylcholines on the other hand build the major part of the membrane matrix [28]. Conclusively, a sensitive balance in these lipids is liable for polarization and signal transduction in the cell environment [29]. Recently, alterations in phosphatidylcholines and sphingolipids were identified as relevant, although differently regulated parts of the metabolomic profile in morbid obese as well as in patients with gastric adenocarcinoma and as key effectors of apoptosis and tumor cell growth, possibly explaining the well-known increased lifetime risk for cancer in obese subjects [30,31].
A further metabolomic subgroup included BCAA, and aromatic amino acids. The BCAAs could be identified as a valid separator of the LS and OP group at one year after randomization. As described before, BCAAs correlate with BMI and HOMA-IR [16,32,33]. Studies analyzing human adipose and muscle tissue in obese and diabetic conditions show a reduced activity of mitochondrial branched-chain aminotransferase. This is in accordance with the development of IR, especially if the concentration of BCAAs is elevated over a longer period of time [34]. Subjects with chronically elevated concentrations of BCAAs also have higher HOMA-IR values. Elevated leucine and valine concentrations have been associated with IR [35]. Among others, BCAAs affect the intracellular insulin signaling in human cells by binding to Rag GTPases, leading to the activation of mammalian target of rapamycin complex 1 (mTORC1), the activation of ribosomal S6 kinase 1 (S6K), the inhibition of insulin receptor substrate 1 (IRS-1) and the stimulation of mitochondrial dysfunction [36]. See Supplementary Figure S2 for further explanation.
Analyzing overlapping phosphatidylcholines from the metabolomic profiles as a translational approach with indirect comparison, PC aa C42:Ys have been identified as being significantly different metabolites in both comparisons, OP vs. LS and RYGB_rat vs. BWM_rat. PC aa C42:Ys, better known as lecithins, have been repeatedly mentioned in studies investigating metabolomics in obesity [16,24,28,37]. With respect to the method of analysis, the length of the two fatty acids on these phosphatidylcholines could not be delineated. However, the most frequently identified PCs are arachidic acid, lignoceric acid and arachidonic acid. All three of these fatty acids have been reported to be decreased in obese patients [12,38,39]. In the present cohort, a significant enrichment of PC aa C42:Ys was found in both surgical groups in the human and rat cohort. Interestingly, no significant increase in lecithins was detected in both conservatively treated groups. Therefore, an effect of RYGB on lecithins independently of weight loss can be assumed. As the weight-loss-independent effect of RYGB is a recent focus of clinical research to find effective and sustainable alternatives for the therapy of morbidly obese patients, the presented changes in the metabolome after bariatric surgery, consensually, is in accordance with previous findings [10,40].
The analysis of the metabolomics of rats with similar body weights after RYGB and diet restriction and similar food composition overcomes the limitation that weight loss effects cannot be differentiated from the effects of the bariatric intervention (i.e., changed absorbance) itself. Interestingly, lipids play a crucial role in differentiating RYGB from BWM rats, while amino acids do not facilitate the separation of these intervention groups. Therefore, changes in BCAAs after RYGB do not seem to be caused by bariatric surgery itself. A significant increase in sphingolipids as well as PC aa C42:Ys in the OP group of the WAS trial and higher levels in the BWM vs. RYGB group of our animal experiment were detected. The role of sphingolipids in obesity and IR is not fully understood and has to be investigated in further human studies with an adequate diet restriction paradigm [41].
Our study has several limitations. The very low sample size compared to the large number of analyzed metabolites may have hampered the interpretation of data. It was also not possible to consider the whole spectrum of confounders (e.g., smoking status) potentially influencing the metabolic spectrum. Although there was no difference in the nutrition counseling, we cannot exclude that the actual nutrition might have differed from the references within the nutrition counseling. Additionally, gender distribution differed significantly between the LS and OP group of the WAS cohort. Furthermore, a direct comparison of human metabolomic data with the metabolome of rats is not uncritical and therefore allows only limited conclusions regarding the underlying pathophysiological mechanism [42,43]. Nevertheless, the strength of our study was the inclusion of excellent annotated material, both from humans and animals that have undergone a randomly assigned intervention.

4. Materials and Methods

4.1. Patients

The Würzburg Adipositas Study is a randomized trial comparing the effects of RYGB vs. psychotherapy-enhanced lifestyle intervention not including calorie-limited nutrition in morbidly obese patients. Details of the design of the study are published elsewhere [22]. Twenty-four participants were randomized into intensive lifestyle modification, 22 were randomized into an RYGB-surgery group, which was performed at the department of general, visceral, transplant, vascular and pediatric surgery in the University Hospital of Wuerzburg. At twelve months after randomization, blood samples were taken for further analyses (see Figure 7). The WAS study protocol was approved by the Ethics Committee of the University Hospital of Wuerzburg (182/08). All patients provided written informed consent.

4.2. Animals

As described in detail elsewhere, adult male Wistar rats (Charles River Laboratories, n = 13) with initial body weight 323.1 ± 4.7 g, 9–10 weeks old, were group-housed in a certified facility with an ambient room temperature of 22 °C and a 12-h light/dark cycle. These animals were part of a series that was recently published [44]. Animals had free access to a high-fat diet (C1090-60 HF diet, 5228 kcal/kg; 60% calories from fat, 16% from protein and 24% from carbohydrate; Altromin, Lage, Germany) for about 6 weeks to induce obesity. The animals were then randomized into the following treatment groups and, after the respective intervention, kept on a choice of the high- and a low-fat diet (C1090-10 LF, 3514 kcal/kg; 10% calories from fat, 24% from protein and 66% from carbohydrate; Altromin). RYGB was performed on six animals. Seven animals were body-weight-matched controls, which underwent sham surgery and were then kept on chronic food restriction to induce a similar weight course as in RYGB animals. This was achieved by restricting the amount of high- and low-fat diet they consumed compared to that of RYGB_rat. As published before, animals were isoflurane-anesthetized and under butorphanol (0.1 mg/kg) analgesia for RYGB and sham operation [45]. For RYGB, a small gastric pouch 5% of the original stomach size was created, and the biliopancreatic and common limbs were made to measure 15 cm and 25 cm in length, respectively [45,46]. Four weeks after intervention, blood samples were taken in a fasted state (12 h). The local regulatory authority (Regierung von Unterfranken: 55.2-2532-2-467) approved all animal procedures.

4.3. Laboratory Measurements

In brief, serum samples from patients were obtained upon enrolment under standardized conditions. After an overnight fast, the blood was drawn from the cubital vein with a Safety-Multifly® 21G (Sarstedt AG & Co.KG, Nümbrecht). Samples for analysis of fasting glucose were stored in S-Monovette® Fluoride/EDTA (Sarstedt AG & Co.KG). Samples for the analysis of insulin and metabolome were stored in S-Monovette® Serum (Sarstedt AG & Co.KG). All samples were centrifuged immediately after blood drawn at 500× g for 5 min. Afterwards, serum was stored at −80 °C until further analysis. HOMA-IR was calculated as follows:
HOMA-IR = insulin (fasting) (mU/l) ∗ glucose (fasting) (mg/dl)/405
Plasma samples from rats were collected after a 12-h fasting period under deep anesthesia shortly prior to euthanasia. Immediately after collection in tubes pretreated with a DPP-IV inhibitor (Merck), plasma was separated from the blood samples by centrifugation at 5 krpm for 10 min at 4 °C and stored at −80 °C.

4.4. Targeted Metabolomics

Reagents, standards and controls were prepared according to manufacturer’s instructions (Biocrates UM-P180-SCIEX-13) for mass spectrometry. Analytical columns (Acquity UPLC BEH C18 1.7 µm 2.1 mm × 75 mm, Waters) and pre-column (Acquity BEH C18 1.7 VANGUARD) from Waters (Eschborn, Germany) were used. Targeted metabolomics was performed using the AbsoluteIDQ p180 Kit (BIOCRATES Life Sciences AG, Innsbruck, Austria) [47], which complies with the EMA ‘Guideline on bioanalytical method validation’ (21 July 2011) and implies proof of reproducibility within a given error range [48]. The Biocrates AbsoluteIDQ p180 kit simultaneously identifies and quantifies 188 metabolites including 21 amino acids, 21 biogenic amines, 40 acylcarnitines, 15 sphingolipids, 14 lysophosphatidylcholines, 76 phosphatidylcholines and 1 hexose (>90% glucose). The assay-specific procedures have been described in detail elsewhere [49,50].
Serum from each sample was processed according to the manufacturer’s recommendations. In brief, 10 μL of the internal standard solution was added to each well on a filter spot of the 96-well extraction plate. After drying under a gentle stream of nitrogen, 10 μL of each serum sample, quality control (QC) sample, blank, zero sample or calibration standard, was added to the appropriate wells. The plate was then dried under a gentle stream of nitrogen. Derivatization was performed using 5% phenyl isothiocyanate (33% ethanol, 33% water, 33% pyridine). Samples were incubated for 20 min followed by extraction with methanol. Electrospray ionization (ESI)—LC-MS/MS and flow injection (FIA) MS/MS was performed on Sciex 4500QTRAP MD (SCIEX, Framingham, MA, USA). MS-system was coupled to an Agilent 1290 UHPLC-system (G4226A autosampler, infinity BinPump, G1316C column-oven, G1330B thermostat (Agilent, Santa Clara, CA, USA)).
Data were processed with Analyst Software version 1.6.2 MD (SCIEX, Framingham, MA, USA). LC- and MS/MS settings were set according to the manufacturer’s manual. MetIDQ software (5.5.4-DB 100 Boron-2623 (Biocrates, Innsbruck, Austria)) was used for validation and processing of MS data. Amino acids and biogenic amines were separated by UHPLC before injection into the mass spectrometer, while flow injection analysis was used for PCs, hexose, Cs and SMs. In this dataset, metabolites with more than 60% measurements at the limit of detection (LOD) or below lowest limit of quantification (LLOQ), and those samples with missing values for more than 60% of the metabolites were excluded from the analyses as described previously [51]. To ensure comparability of data between batch measurements, each metabolite value was normalized to four human reference samples included into each batch as previously described. Normal ranges for metabolites based on data described elsewhere [25,26]. In the nomenclature of presented lipids ´Cx:Y` describes the composition of the lipid chain with ´x` indicating the number of carbon atoms and ´y` the number of double bonds.

4.5. Statistical Analysis

Analyses were conducted using SPSS software (PASW version 25.0, SPSS Inc. Chicago, IL, USA), GraphPad Prism version 9.1.2 for Windows (GraphPad Software, La Jolla, CA, USA) and MetaboAnalyst (version 5.0, www.metaboanalyst.ca, accessed on 10 October 2022). The dataset was tested for normal distribution using the Shapiro–Wilk test. All normally distributed values are presented as mean ± SD whereas non-normally distributed data are presented as medians ± interquartile range (IQR). Outliers were defined with values >1.5 interquartile ranges (IQR) below the first quartile or above the third quartile. No outliers were identified in the human cohort. One rat was identified as an outlier and excluded from further analysis. Post hoc comparisons (Tukey–Kramer Honest Significant Difference method) were performed to control for family-wise error rates (FWER). Hierarchical clustering analysis was conducted on the final dataset to assess their putative abundances (clustering by Euclidean distance measure and Ward linkage). To visualize class differences from a multivariate dataset and to determine whether there is any cluster distinction between different groups, principal component analysis was performed. The validity of the PCA was calculated using Bartlett’s test and the Kaiser–Meyer–Olkin measure of sampling adequacy. According to the Kaiser criteria, only factors with an eigenvalue ≥ 1 were considered. The calculated principal components were defined as factor analysis components.
Clinical data of the WAS cohort was not normally distributed (Shapiro–Wilk test, p < 0.05). Hence, we performed Mann–Whitney tests for clinical parameters to investigate differences between groups at one-year follow-up. Data from the metabolomics followed normal distribution (Shapiro–Wilk test, p > 0.05). To adjust for differences at baseline, a repeated-measures analysis of covariance (ANCOVA) was performed (correcting for age and sex).
Data in the rodent model were normally distributed (Shapiro–Wilk test, p > 0.05). A one-way ANOVA was performed to assess the effects of obesity treatment on body weight and the metabolome four weeks after intervention. p-values for the respective comparisons after correction for multiple comparisons are reported.

5. Conclusions

We analyzed the effects of surgical vs. lifestyle intervention on the serum metabolome of obese and insulin resistant human patients of the randomized controlled WAS and compared them with the results from a rodent model. As the conservatively treated human group failed to achieve significant weight loss, the difference in the metabolomic profile could either be associated with RYGB or weight loss. However, several metabolites were found to be significantly different in rats following RYGB vs. rats treated with an evenly effective food restriction paradigm. By indirectly comparing the metabolomic profiles of both species as a translational approach, a high number of overlapping parameters could be found. A subgroup of sphingolipids, BCAAs and phosphatidylcholines was found to be altered in both surgical groups, but not in the conservatively treated human and rat groups. Thus, these metabolites might indeed be a specific consequence of the RYGB. The significant increase in the hereby-identified lipids as well as a significant decrease in BCAA has been shown before to improve the glucose metabolism. Thereby, our investigation is in accordance with several methodically comparable studies, clarifying the complex role of RYGB, and, hence, supports the worldwide effort to investigate the weight-loss-independent effects of bariatric surgery.

Supplementary Materials

The following supporting information can be downloaded at: https://www.mdpi.com/article/10.3390/ijms24032354/s1, Figure S1: Unsupervised principal component analysis of 13 significantly different metabolites between lifestyle intervention and surgery group in the WAS cohort at baseline visit.; Figure S2: Intracellular BCAA pathway leading to insulin resistance.

Author Contributions

Conceptualization, U.D., I.B. and M.F.; methodology, M.K. and I.B.; software, M.K. and U.D.; validation, U.D., M.K. and M.F.; formal analysis, I.B.; investigation, U.D.; resources, M.F., A.-C.K., C.S. and U.D.; data curation, M.K.; writing—original draft preparation, I.B.; writing—review and editing, U.D., M.F., M.K., A.-C.K. and C.S.; visualization, I.B.; supervision, U.D. and M.F.; project administration, M.F.; funding acquisition, M.F and A.-C.K. All authors have read and agreed to the published version of the manuscript.

Funding

The animal research in this manuscript was funded by the Interdisciplinary Center for Clinical Research (IZKF) of the University Hospital Wuerzburg, grant number IZKF Z-2/71. This work was supported by the German Ministry of Research and Education (BMBF) within the Comprehensive Heart Failure Centre Würzburg (01EO1004 and 01EO1504).

Institutional Review Board Statement

The WAS study was conducted in accordance with the Declaration of Helsinki, and approved by the Ethics Committee of the University Hospital of Wuerzburg (182/08, approved on 16 December 2014). The rodent model was conducted according to the guidelines of the Declaration of Helsinki and approved by the local regulatory authority (Regierung von Unterfranken, Wuerzburg, Germany, AZ: 55.2-2532-2-467). All experiments were performed in accordance with German and European laws and regulations (TierSchG, TierSchVersV, Directive 2010/63/EU).

Informed Consent Statement

Informed consent was obtained from all subjects involved in the study.

Data Availability Statement

Data are contained within the article or Supplementary Material. The raw data are available on request from the corresponding author.

Acknowledgments

The authors are particularly grateful to all members of the WAS study group for their contribution.

Conflicts of Interest

The authors declare no conflict of interest. The funders had no role in the design of the study; in the collection, analyses, or interpretation of data; in the writing of the manuscript; or in the decision to publish the results.

References

  1. WHO. Obesity and Overweight. 2021. Available online: http://www.who.int/en/news-room/fact-sheets/detail/obesity-and-overweight (accessed on 1 September 2022).
  2. The GDB 2015 Obesity Collaborators. Health effects of overweight and obesity in 195 countries over 25 years. N. Engl. J. Med. 2017, 377, 13–27. [Google Scholar]
  3. Ford, E.S. Risks for all-cause mortality, cardiovascular disease, and diabetes associated with the metabolic syndrome: A summary of the evidence. Diabetes Care 2005, 28, 1769–1778. [Google Scholar] [CrossRef] [PubMed] [Green Version]
  4. Wang, T.J.; Wollert, K.C.; Larson, M.G.; Coglianese, E.; McCabe, E.L.; Cheng, S.; Ho, J.E.; Fradley, M.G.; Ghorbani, A.; Xanthakis, V.; et al. Prognostic utility of novel biomarkers of cardiovascular stress: The framingham heart study. Circulation 2012, 126, 1596–1604. [Google Scholar] [CrossRef] [PubMed] [Green Version]
  5. Newsholme, P. Overview: Metabolomics and lipidomics in nutrition and metabolism research. Essays Biochem 2016, 60, 407. [Google Scholar] [CrossRef] [PubMed]
  6. Chissini, R.D.B.C.; Kuschnir, M.C.; de Oliveira, C.L.; Giannini, D.T.; Santos, B. Cutoff values for HOMA-IR associated with metabolic syndrome in the Study of Cardiovascular Risk in Adolescents (ERICA Study). Nutrition 2020, 71, 110608. [Google Scholar] [CrossRef]
  7. Schauer, P.R.; Kashyap, S.R.; Wolski, K.; Brethauer, S.A.; Kirwan, J.P.; Pothier, C.E.; Thomas, S.; Abood, B.; Nissen, S.E.; Bhatt, D.L. Bariatric surgery versus intensive medical therapy in obese patients with diabetes. N. Engl. J. Med. 2012, 366, 1567–1576. [Google Scholar] [CrossRef]
  8. Neto, R.M.L.; Herbella, F.A.; Tauil, R.M.; Silva, F.S.; de Lima, S.E. Comorbidities remission after roux-en-y gastric bypass for morbid obesity is sustained in a long-term Follow-up and correlates with weight regain. Obes. Surg. 2012, 22, 1580–1585. [Google Scholar] [CrossRef]
  9. Rauschert, S.; Mori, T.A.; Beilin, L.J.; Jacoby, P.; Uhl, O.; Koletzko, B.; Oddy, W.H.; Hellmuth, C. Early life factors, obesity risk, and the metabolome of young adults. Obesity 2017, 25, 1549–1555. [Google Scholar] [CrossRef] [Green Version]
  10. Hameed, A.; Mojsak, P.; Buczynska, A.; Suleria, H.A.R.; Kretowski, A.; Ciborowski, M. Altered metabolome of lipids and Amino acids species: A source of early signature biomarkers of T2DM. J. Clin. Med. 2020, 9, 2257. [Google Scholar] [CrossRef]
  11. Newgard, C.B. Metabolomics and metabolic diseases: Where do we stand? Cell. Metab. 2017, 25, 43–56. [Google Scholar] [CrossRef] [Green Version]
  12. Adamski, J. Key elements of metabolomics in the study of biomarkers of diabetes. Diabetologia 2016, 59, 2497–2502. [Google Scholar] [CrossRef] [Green Version]
  13. Liu, R.; Hong, J.; Xu, X.; Feng, Q.; Zhang, D.; Gu, Y.; Shi, J.; Zhao, S.; Liu, W.; Wang, X.; et al. Gut microbiome and serum metabolome alterations in obesity and after weight-loss intervention. Nat. Med. 2017, 23, 859–868. [Google Scholar] [CrossRef]
  14. Rangel-Huerta, O.D.; Pastor-Villaescusa, B.; Gil, A. Are we close to defining a metabolomic signature of human obesity? A systematic review of metabolomics studies. Metabolomics 2019, 15, 1–31. [Google Scholar] [CrossRef] [Green Version]
  15. Gao, X.; Zhang, W.; Wang, Y.; Pedram, P.; Cahill, F.; Zhai, G.; Randell, E.; Gulliver, W.; Sun, G. Serum metabolic biomarkers distinguish metabolically healthy peripherally obese from unhealthy centrally obese individuals. Nutr. Metab. 2016, 13, 33. [Google Scholar] [CrossRef] [Green Version]
  16. Newgard, C.B.; An, J.; Bain, J.R.; Muehlbauer, M.J.; Stevens, R.D.; Lien, L.F.; Haqq, A.M.; Shah, S.H.; Arlotto, M.; Slentz, C.A. A branched-chain amino acid-related metabolic signature that differentiates obese and lean humans and contributes to insulin resistance. Cell Metab. 2009, 9, 311–326. [Google Scholar] [CrossRef] [Green Version]
  17. Roberts, L.D.; Koulman, A.; Griffin, J.L. Towards metabolic biomarkers of insulin resistance and type 2 diabetes: Progress from the metabolome. Lancet Diabetes Endocrinol 2014, 2, 65–75. [Google Scholar] [CrossRef]
  18. Batch, B.C.; Shah, S.H.; Newgard, C.B.; Turer, C.B.; Haynes, C.; Bain, J.R.; Muehlbauer, M.; Patel, M.J.; Stevens, R.D.; Appel, L.J.; et al. Branched chain amino acids are novel biomarkers for discrimination of metabolic wellness. Metabolism 2013, 62, 961–969. [Google Scholar] [CrossRef] [Green Version]
  19. Breslow, D.K.; Weissman, J.S. Membranes in balance: Mechanisms of sphingolipid homeostasis. Mol. Cell 2010, 40, 267–279. [Google Scholar] [CrossRef] [Green Version]
  20. Carayol, M.; Leitzmann, M.F.; Ferrari, P.; Zamora-Ros, R.; Achaintre, D.; Stepien, M.; Schmidt, J.A.; Travis, R.C.; Overvad, K.; Tjønneland, A.; et al. Blood metabolic signatures of body mass index: A targeted metabolomics study in the epic cohort. J. Proteome Res. 2017, 16, 3137–3146. [Google Scholar] [CrossRef]
  21. Pitt, J.J. Principles and applications of liquid chromatography-mass spectrometry in clinical biochemistry. Clin. Biochem. Rev. 2009, 30, 19–34. [Google Scholar]
  22. Koschker, A.C.; Warrings, B.; Morbach, C.; Seyfried, F.; Rickert, N.; Jung, P.; Geier, A.; Dischinger, U.; Krauthausen, M.; Herrmann, M.J.; et al. Cardio-psycho-metabolic outcomes of bariatric surgery: Design and baseline of the WAS trial. Endocr. Connect 2022, 11, e210338. [Google Scholar] [CrossRef]
  23. Dischinger, U.; Heckel, T.; Bischler, T.; Hasinger, J.; Königsrainer, M.; Schmitt-Böhrer, A.; Otto, C.; Fassnacht, M.; Seyfried, F.; Hankir, M.K. Roux-en-Y gastric bypass and caloric restriction but not gut hormone-based treatments profoundly impact the hypothalamic transcriptome in obese rats. Nutrients 2021, 14, 116. [Google Scholar] [CrossRef] [PubMed]
  24. Blais, E.M.; Rawls, K.D.; Dougherty, B.V.; Li, Z.I.; Kolling, G.L.; Ye, P.; Wallqvist, A.; Papin, J.A. Reconciled rat and human metabolic networks for comparative toxicogenomics and biomarker predictions. Nat. Commun. 2017, 8, 14250. [Google Scholar] [CrossRef] [PubMed] [Green Version]
  25. Haid, M.; Muschet, C.; Wahl, S.; Römisch-Margl, W.; Prehn, C.; Möller, G.; Adamski, J. Long-term stability of human plasma metabolites during storage at −80 °C. J. Proteome Res. 2018, 17, 203–211. [Google Scholar] [CrossRef] [PubMed]
  26. Trabado, S.; Al-Salameh, A.; Croixmarie, V.; Masson, P.; Corruble, E.; Fève, B.; Colle, R.; Ripoll, L.; Walther, B.; Boursier-Neyret, C.; et al. The human plasma-metabolome: Reference values in 800 French healthy volunteers; impact of cholesterol, gender and age. PLoS ONE 2017, 12, e0173615. [Google Scholar] [CrossRef] [Green Version]
  27. Feldman, A.; Eder, S.K.; Felder, T.K.; Paulweber, B.; Zandanell, S.; Stechemesser, L.; Schranz, M.; Strebinger, G.; Huber-Schönauer, U.; Niederseer, D.; et al. Clinical and metabolic characterization of obese subjects without non-alcoholic fatty liver: A targeted metabolomics approach. Diabetes Metab. 2019, 45, 132–139. [Google Scholar] [CrossRef]
  28. Gault, C.R.; Obeid, L.M.; Hannun, Y.A. An overview of sphingolipid metabolism: From synthesis to breakdown. Adv. Exp. Med. Biol. 2010, 688, 1–23. [Google Scholar]
  29. Wahl, S.; Holzapfel, C.; Yu, Z.; Breier, M.; Kondofersky, I.; Fuchs, C.; Singmann, P.; Prehn, C.; Adamski, J.; Grallert, H.; et al. Metabolomics reveals determinants of weight loss during lifestyle intervention in obese children. Metabolomics 2013, 9, 1157–1167. [Google Scholar] [CrossRef] [Green Version]
  30. Morad, S.A.; Cabot, M.C. Ceramide-orchestrated signalling in cancer cells. Nat. Rev. Cancer 2013, 13, 51–65. [Google Scholar] [CrossRef]
  31. Kadam, W.; Wei, B.; Li, F. Metabolomics of Gastric Cancer. Adv. Exp. Med. Biol. 2021, 1280, 291–301. [Google Scholar]
  32. Hendruch, A.; Michalak, K. Lipids as a target for drugs modulations multidrug resistanceof cancer cells. Curr. Drug Targets 2003, 4, 23–30. [Google Scholar] [CrossRef]
  33. Vieira, E.E.S.; Pereira, I.C.; Braz, A.F.; Nascimento-Ferreira, M.V.; de Oliveira Torres, L.R.; de Freitas Brito, A.; do Nascimento Marreiro, D.; e Sousa, J.M.D.C.; da Silva, F.C.C.; Torres-Leal, F.L. Food consumption of branched chain amino acids and insulin resistance: A systematic review of observational studies in humans. Clin. Nutr. ESPEN 2020, 40, 277–281. [Google Scholar] [CrossRef]
  34. Nie, C.; He, T.; Zhang, W.; Zhang, G.; Ma, X. Branched Chain amino acids: Beyond nutrition metabolism. Int. J. Mo.l Sci. 2018, 19, 954. [Google Scholar] [CrossRef] [Green Version]
  35. Houten, S.M.; Wanders, R.J. A general introduction to the biochemistry of mitochondrial fatty acid beta-oxidation. J. Inherit. Metab. Dis. 2010, 33, 469–477. [Google Scholar] [CrossRef] [Green Version]
  36. Crossland, H.; Smith, K.; Idris, I.; Phillips, B.E.; Atherton, P.J.; Wilkinson, D.J. Exploring mechanistic links between extracellular branched-chain amino acids and muscle insulin resistance: An in vitro approach. Am. J. Physiol. Cell. Physiol. 2020, 319, C1151–C1157. [Google Scholar] [CrossRef]
  37. Klaus, V.S.; Schriever, S.C.; Kuhn, J.M.M.; Peter, A.; Irmler, M.; Tokarz, J.; Prehn, C.; Kastenmüller, G.; Beckers, J.; Adamski, J.; et al. Correlation guided Network Integration (CoNI) reveals novel genes affecting hepatic metabolism. Mol. Metab. 2021, 53, 101295. [Google Scholar] [CrossRef]
  38. Boulet, M.M.; Chevrier, G.; Grenier-Larouche, T.; Pelletier, M.; Nadeau, M.; Scarpa, J.; Prehn, C.; Marette, A.; Adamski, J.; Tchernof, A. Alterations of plasma metabolite profiles related to adipose tissue distribution and cardiometabolic risk. Am. J. Physiol. Endocrinol. Metab. 2015, 309, E736–E746. [Google Scholar] [CrossRef] [Green Version]
  39. Lau, L.H.Y.; Nano, J.; Cecil, A.; Schederecker, F.; Rathmann, W.; Prehn, C.; Zeller, T.; Lechner, A.; Adamski, J.; Peters, A.; et al. Cross-sectional and prospective relationships of endogenous progestogens and estrogens with glucose metabolism in men and women: A KORA F4/FF4 Study. BMJ Open Diabetes Res. Care 2021, 9. [Google Scholar] [CrossRef]
  40. Dreyfuss, J.M.; Yuchi, Y.; Dong, X.; Efthymiou, V.; Pan, H.; Simonson, D.C.; Vernon, A.; Halperin, F.; Aryal, P.; Konkar, A.; et al. High-throughput mediation analysis of human proteome and metabolome identifies mediators of post-bariatric surgical diabetes control. Nat. Commun. 2021, 12, 1–13. [Google Scholar] [CrossRef]
  41. Yoshino, M.; Kayser, B.D.; Yoshino, J.; Stein, R.I.; Reeds, D.; Eagon, J.C.; Eckhouse, S.R.; Watrous, J.D.; Jain, M.; Knight, R.; et al. Effects of diet versus gastric bypass on metabolic function in diabetes. N. Engl. J. Med. 2020, 383, 721–732. [Google Scholar] [CrossRef]
  42. Reinehr, T.; Wolters, B.; Knop, C.; Lass, N.; Hellmuth, C.; Harder, U.; Peissner, W.; Wahl, S.; Grallert, H.; Adamski, J.; et al. Changes in the serum metabolite profile in obese children with weight loss. Eur. J. Nutr. 2015, 54, 173–181. [Google Scholar] [CrossRef] [PubMed]
  43. Even, P.C.; Virtue, S.; Morton, N.M.; Fromentin, G.; Semple, R.K. Editorial: Are rodent models fit for investigation of human obesity and related diseases? Front. Nutr. 2017, 4, 58. [Google Scholar] [CrossRef] [PubMed] [Green Version]
  44. Dischinger, U.; Hasinger, J.; Königsrainer, M.; Corteville, C.; Otto, C.; Fassnacht, M.; Hankir, M.; Seyfried, F.J.D. Toward a medical gastric bypass: Chronic feeding studies with liraglutide + PYY3-36 combination therapy in diet-induced obese rats. Front. Endocrinol. 2020, 11, 598843. [Google Scholar] [CrossRef] [PubMed]
  45. Dischinger, U.; Corteville, C.; Otto, C.; Fassnacht, M.; Seyfried, F.; Hankir, M.K. GLP-1 and PYY3-36 reduce high-fat food preference additively after roux-en-Y gastric bypass in diet-induced obese rats. Surg. Obes. Relat. Dis. 2019, 15, 1483–1492. [Google Scholar] [CrossRef]
  46. Seyfried, F.; Bueter, M.; Spliethoff, K.; Miras, A.D.; Abegg, K.; Lutz, T.A.; Le Roux, C.W. Roux-en Y gastric bypass is superior to duodeno-jejunal bypass in improving glycaemic control in Zucker diabetic fatty rats. Obes. Surg. 2014, 24, 1888–1895. [Google Scholar] [CrossRef]
  47. Zukunft, S.; Sorgenfrei, M.; Prehn, C. Targeted Metabolomics of Dried Blood Spot Extracts. Chromatographia 2013, 76, 1295–1305. [Google Scholar] [CrossRef]
  48. European Medicines Agency. Guedline on Bioanalitycal Method Validation. 2011. Available online: https://www.ema.europa.eu/en/documents/scientific-guideline/guideline-bioanalytical-method-validation_en.pdf (accessed on 31 March 2021).
  49. März, J.; Kurlbaum, M.; Roche-Lancaster, O.; Deutschbein, T.; Peitzsch, M.; Prehn, C.; Weismann, D.; Robledo, M.; Adamski, J.; Fassnacht, M. Plasma metabolome profiling for the diagnosis of catecholamine producing tumors. Front. Endocrinol. 2021, 12, 722656. [Google Scholar] [CrossRef]
  50. Vogg, N.; Müller, T.; Floren, A.; Dandekar, T.; Scherf-Clavel, O.; Fassnacht, M.; Kroiss, M.; Kurlbaum, M. Targeted metabolic profiling of urinary steroids with a focus on analytical accuracy and sample stability. J. Mass Spectrom. Adv. Clin. Lab. 2022, 25, 44–52. [Google Scholar] [CrossRef]
  51. Xia, J.; Psychogios, N.; Young, N.; Wishart, D.S. MetaboAnalyst: A web server for metabolomic data analysis and interpretation. Nucleic Acids Res. 2009, 37, W652–W660. [Google Scholar] [CrossRef] [Green Version]
Figure 1. Unsupervised principal component analysis of 57 significantly different metabolites between lifestyle intervention and surgery group in the WAS cohort at 1-year follow-up. The first component explains 32% of the variation, and the second component 17%. C, acylcarnitine; lysoPC, lysophosphatidylcholine; PC aa, phosphatidylcholine with ester bonding; PC ae phosphatidylcholine with ether bonding; SM, sphingolipid.
Ijms 24 02354 g001
Figure 2. Heat map showing the scaled relative abundance of metabolites, which were significantly different between LS and OP group at one-year follow-up, visualized by hierarchical clustering. Abundance values represent row-wise z-scores of read counts. Each bar in the horizontal columns (which represent different patients) represents the expression intensity. Blue indicates a decreased level, red indicates an increased level. C, acylcarnitine; lysoPC, lysophosphatidylcholine; PC aa, phosphatidylcholine with ester bonding; PC ae phosphatidylcholine with ether bonding; SM, sphingolipid.
Ijms 24 02354 g002
Figure 3. Unsupervised principal component analysis of significantly different metabolites (n = 62) between BWM and RYGB rats. The first component explains 52% of the variation, and the second component 22%. C, acylcarnitine; lysoPC, lysophosphatidylcholine; PC aa, phosphatidylcholine with ester bonding; PC ae phosphatidylcholine with ether bonding; SM, sphingolipid.
Ijms 24 02354 g003
Figure 4. Heat map with the scaled relative abundance of 62 significantly different metabolites in BWM and RYGB rats four weeks postoperative visualized by metabolite hierarchical clustering. Abundance values represent row-wise z-scores of read counts. Each bar in the horizontal columns (which represent different rats) represents the expression intensity. Blue indicates a decreased level, red indicates an increased level. C, acylcarnitine; lysoPC, lysophosphatidylcholine; PC aa, phosphatidylcholine with ester bonding; PC ae phosphatidylcholine with ether bonding; SM, sphingolipid.
Ijms 24 02354 g004
Figure 5. Metabolomic profile of 57 significantly different metabolites of acylcarnitines; amino acids; lysophosphatidylcholines; sphingolipids; acylcarnitines; biogenic amines; phosphatidylcholines with ester bonding; phosphatidylcholines with ether bonding; hexose, between lifestyle (LS) and RYGB (OP) group at one-year follow-up.
Ijms 24 02354 g005
Figure 6. Metabolomic profile of 62 significantly different parameters of amino acids; lysophosphatidylcholines; sphingolipids; acylcarnitines; phosphatidylcholines with ester bonding; phosphatidylcholines with ether bonding, between rats with RYGB and rats with diet restriction (BWM) four weeks after start of the interventions.
Ijms 24 02354 g006
Figure 7. Time schedule of the WAS trial. R, randomization.
Ijms 24 02354 g007
Table 1. Medians ± interquartile range (IQR) of baseline characteristics with standard deviation of patients enrolled in the WAS trial.
Study Cohort (n = 46)LS (n = 24)OP (n = 22)p-Value
Women3918210.32
Men761<0.01
Age (years)41.2 ± 1.539.3 ± 243.1 ± 20.13
Body height (cm)172 ± 1172 ± 2167 ± 20.05
Body weight (kg)134.9 ± 4.2138.9 ± 3.1128.6 ± 2.40.06
BMI (kg/m2)45.0 ± 1.447.4 ± 1.242 ± 10.09
HbA1c (%)5.9 ± 0.26.1 ± 0.35.7 ± 0.10.17
HOMA-IR6.8 ± 1.37.1 ± 2.36.5 ± 0.20.07
Table 2. One-year follow-up means of 57 significantly different metabolites between LS and OP with standard deviation. p-values are adjusted for sex and age and corrected for multiple comparisons. C, acylcarnitine; lysoPC, lysophosphatidylcholine; PC aa, phosphatidylcholine with ester bonding; PC ae phosphatidylcholine with ether bonding; SM, sphingomyelin.
MetabolitesLS (µM)OP (µM)Difference (µM)Difference (%)p-Value
C30.43 ± 0.0190.35 ± 0.010.0822.9<0.01
Ala485.67 ± 21.8392.64 ± 14.7493.0323.7<0.01
Cit25.57 ± 1.6335.84 ± 1.5510.2728.7<0.01
Gln702 ± 30.73834 ± 22.2413215.8<0.01
Glu73.68 ± 6.2538.51 ± 3.5035.1791.3<0.01
Gly249.33 ± 13.55394.68 ± 17.90145.3536.8<0.01
His82.86 ± 2.5388.2 ± 1.375.346.10.04
Ile89.55 ± 3.4865.14 ± 2.0524.4137.5<0.01
Leu168.08 ± 4.52121.61 ± 4.3646.4738.2<0.01
Lys296.96 ± 8.84260.5 ± 7.0936.4614<0.01
Phe 73.2 ± 1.3856.72 ± 1.3616.4829.1<0.01
Trp 65.55 ± 1.8054.53 ± 1.7611.0220.2<0.01
Tyr82.83 ± 4.3360.14 ± 1.6822.6937.7<0.01
Val 305.04 ± 9.83212.09 ± 7.4892.9543.8<0.01
Sarcosine1.14 ± 0.090.85 ± 0.060.2934.10.04
lysoPC a C16:051.14 ± 2.6158.45 ± 2.427.3112.50.04
lysoPC a C17:00.74 ± 0.041.03 ± 0.070.2928.2<0.01
lysoPC a C18:012.43 ± 0.6315.11 ± 0.892.6817.70.03
lysoPC a C18:19.48 ± 0.4115.22 ± 0.935.7437.7<0.01
lysoPC a C18:212.13 ± 0.7015.17 ± 1.003.04200.04
PC aa C32:0 16.01 ± 0.7518.59 ± 0.652.5813.90.03
PC aa C34:1257 ± 16.70283.64 ± 9.7226.649.40.03
PC aa C36:01.44 ± 0.081.73 ± 0.10.2916.80.04
PC aa C38:10.6 ± 0.080.97 ± 0.090.3738.10.03
PC aa C38:544.18 ± 2.5452.19 ± 2.288.0115.30.02
PC aa C40:20.16 ± 0.010.19 ± 0.010.0315.80.04
PC aa C40:56.56 ± 0.408.03 ± 0.451.4718.30.03
PC aa C42:00.29 ± 0.010.35 ± 0.010.0617.10.03
PC aa C42:10.13 ± 0.010.16 ± 0.010.0318.8<0.01
PC aa C42:20.13 ± 0.010.15 ± 0.010.0213.30.04
PC aa C42:40.09 ± 0.010.12 ± 0.010.0325<0.01
PC aa C42:50.21 ± 0.010.28 ± 0.010.0725<0.01
PC aa C42:60.24 ± 0.010.29 ± 0.020.0517.20.04
PC ae C32:13.18 ± 0.123.85 ± 0.130.6717.4<0.01
PC ae C32:20.85 ± 0.031.04 ± 0.040.1918.3<0.01
PC ae C34:110.58 ± 0.5012.69 ± 0.442.1116.6<0.01
PC ae C34:36.8 ± 0.329.45 ± 0.52.6528<0.01
PC ae C36:511.52 ± 0.6013.83 ± 0.612.3116.70.02
PC ae C38:10.17 ± 0.030.31 ± 0.030.1445.2<0.01
PC ae C38:515.55 ± 0.7017.64 ± 0.632.0911.80.04
PC ae C38:6 5.89 ± 0.296.5 ± 0.260.619.40.04
PC ae C40:10.82 ± 0.040.98 ± 0.050.1616.30.03
PC ae C40:5 2.32 ± 0.082.93 ± 0.110.6120.8<0.01
PC ae C40:62.79 ± 0.13.44 ± 0.140.6518.9<0.01
PC ae C42:10.26 ± 0.010.33 ± 0.010.0721.2<0.01
PC ae C42:20.35 ± 0.010.45 ± 0.020.122.2<0.01
PC ae C42:30.44 ± 0.020.52 ± 0.020.0815.40.02
PC ae C42:51.46 ± 0.061.8 ± 0.070.3418.9<0.01
PC ae C44:30.1 ± 0.0020.11 ± 0.0030.019.1<0.01
PC ae C44:51.25 ± 0.051.52 ± 0.070.2717.80.02
PC ae C44:60.68 ± 0.030.81 ± 0.030.13160.01
SM (OH) C16:12.27 ± 0.092.54 ± 0.110.2710.60.02
SM (OH) C22:15.68 ± 0.304.45 ± 0.241.2327.6<0.01
SM C16:077.54 ± 2.2293.49 ± 2.6315.9517.1<0.01
SM C24:121.58 ± 0.8325.51 ± 1.013.9315.40.02
SM C26:10.18 ± 0.010.24 ± 0.020.06250.01
H15286.63 ± 337.924399.09 ± 101.08887.5420.20.02
Table 3. Means of 62 significantly different metabolites at four weeks after start of the interventions between BWM_rat and RYGB_rat with standard deviation. p-values are corrected for multiple comparisons. C, acylcarnitine; lysoPC, lysophosphatidylcholine; PC aa, phosphatidylcholine with ester bonding; PC ae phosphatidylcholine with ether bonding; SM, sphingomyelin.
MetabolitesBWM_rat (µM)RYGB_rat (µM)Difference (µM)Difference (%)p-Value
C049 ± 2.3334.15 ± 2.2514.8543.5<0.01
C18:10.099 ± 0.0050.1465 ± 0.010.047532.40.02
Ala829 ± 44.151044.5 ± 129.02215.520.6<0.01
Cit73.3 ± 5.95123.5 ± 7.3650.240.6<0.01
Gln946 ± 35.40735.5 ± 45.28210.528.60.03
Glu67 ± 6.1799.25 ± 10.2132.2532.50.04
Lys602 ± 26.79722.5 ± 30.22120.516.70.04
Trp113 ± 7.3982.35 ± 11.2430.6537.20.04
ADMA0.37 ± 0.030.66 ± 0.030.2943.90.04
SDMA0.22 ± 0.010.32 ± 0.020.131.30.03
lysoPC a C16:13.08 ± 0.35.9 ± 0.832.8247.80.03
lysoPC a C24:00.422 ± 0.060.6115 ± 0.050.189531.00.04
lysoPC a C26:00.064 ± 0.020.1265 ± 0.020.062549.40.04
PC aa C30:00.992 ± 0.041.65 ± 0.310.65839.9<0.01
PC aa C32:05.73 ± 0.2111.45 ± 1.295.7250.00.04
PC aa C32:13.28 ± 0.347.72 ± 0.474.4457.5<0.01
PC aa C32:20.855 ± 0.091.515 ± 0.20.6643.6<0.01
PC aa C32:30.079 ± 0.010.1165 ± 0.010.037532.20.02
PC aa C34:163.6 ± 4.05109 ± 9.6145.441.7<0.01
PC aa C34:32.57 ± 0.284.57 ± 0.33243.8<0.01
PC aa C34:40.872 ± 0.091.32 ± 0.060.44833.90.03
PC aa C36:53 ± 0.284.525 ± 0.411.52533.70.02
PC aa C36:60.23 ± 0.020.4595 ± 0.030.229549.9<0.01
PC aa C38:00.837 ± 0.031.74 ± 0.080.90351.9<0.01
PC aa C38:10.436 ± 0.121.084 ± 0.140.64859.80.02
PC aa C38:524.3 ± 2.5340.55 ± 4.0516.2540.10.04
PC aa C38:629.2 ± 3.2244.85 ± 4.1315.6534.90.03
PC aa C40:20.269 ± 0.020.519 ± 0.050.2548.20.02
PC aa C40:30.319 ± 0.010.6175 ± 0.050.298548.3<0.01
PC aa C40:55.22 ± 0.57.105 ± 2.221.88526.50.04
PC aa C42:00.061 ± 0.010.1055 ± 0.020.044542.20.02
PC aa C42:10.08 ± 0.010.109 ± 0.020.02926.60.04
PC aa C42:40.132 ± 0.010.2005 ± 0.020.068534.2<0.01
PC aa C42:50.132 ± 0.010.2805 ± 0.030.148552.90.03
PC aa C42:60.311 ± 0.030.4905 ± 0.080.179536.6<0.01
PC ae C32:10.545 ± 0.020.7225 ± 0.040.177524.60.01
PC ae C32:20.096 ± 0.010.124 ± 0.010.02822.60.03
PC ae C34:00.597 ± 0.020.944 ± 0.090.34736.80.02
PC ae C34:12.97 ± 0.144.735 ± 0.261.76537.30.03
PC ae C36:00.254 ± 0.010.372 ± 0.020.11831.70.02
PC ae C36:11.21 ± 0.092.08 ± 0.180.8741.80.02
PC ae C36:30.545 ± 0.060.707 ± 0.050.16222.90.04
PC ae C38:00.566 ± 0.100.8355 ± 0.160.269532.3<0.01
PC ae C38:10.193 ± 0.020.4965 ± 0.060.303561.10.02
PC ae C38:30.506 ± 0.040.6865 ± 0.040.180526.30.04
PC ae C38:61.13 ± 0.091.575 ± 0.120.44528.30.04
PC ae C40:30.225 ± 0.010.2915 ± 0.030.066522.80.04
PC ae C40:50.593 ± 0.061.014 ± 0.090.42141.50.02
PC ae C40:61.05 ± 0.091.345 ± 0.150.29521.90.04
PC ae C42:10.262 ± 0.020.373 ± 0.040.11129.80.04
PC ae C42:20.238 ± 0.030.521 ± 0.080.28354.30.03
PC ae C42:30.368 ± 0.050.6365 ± 0.090.268542.20.04
PC ae C44:30.067 ± 0.0040.102 ± 0.010.03534.30.02
PC ae C44:60.059 ± 0.010.1155 ± 0.010.056548.9<0.01
SM (OH) C14:11.25 ± 0.040.7465 ± 0.070.503567.4<0.01
SM (OH) C16:10.771 ± 0.050.3935 ± 0.030.377595.9<0.01
SM (OH) C24:11.94 ± 0.10.7155 ± 0.151.2245171.1<0.01
SM C16:049 ± 2.5433.95 ± 2.2715.0544.3<0.01
SM C16:13.89 ± 0.182.555 ± 0.31.33552.3<0.01
SM C18:12.84 ± 0.231.37 ± 0.181.47107.30.02
SM C20:20.095 ± 0.010.0455 ± 0.020.0495108.80.04
SM C26:00.148 ± 0.020.074 ± 0.010.074100.0<0.01
Table 4. Eighty-one significantly different metabolites subsequently in LS vs. OP of the WAS cohort at one-year follow-up and in animals treated with RYGB vs. diet-restricted animals of the rat cohort four weeks after start of the interventions. Thirty-one overlapping metabolites found to be significant in both comparisons are printed in bold. Arrows indicate if the metabolite is increased or decreased in the respective surgical group in comparison the conservative group. C, acylcarnitine; lysoPC, lysophosphatidylcholine; PC aa, phosphatidylcholine with ester bonding; PC ae phosphatidylcholine with ether bonding; SM, sphingolipid.
Amino-AcidsLysophosphatidylcholinesPhosphatidylcholines—EsterPhosphatidylcholines—EtherSphingolipids
WASRatWASRatWASRatWASRatWASRat
Gly ↑ lysoPC a C16:0 ↑ PC aa C36:0 ↑ PC ae C34:3 ↑ SM (OH) C22:1 ↓
His ↑ lysoPC a C17:0 ↑ PC aa C42:2 ↑ PC ae C36:5 ↑ SM C24:1 ↑
Ile ↓ lysoPC a C18:0 ↑ PC aa C32:0 ↑↑ PC aa C32:0PC ae C38:5 ↑ SM C26:1 ↑
Leu ↓ lysoPC a C18:1 ↑ PC aa C34:1 ↑↑ PC aa C34:1PC ae C40:1 ↑ SM (OH) C16:1 ↑↓ SM (OH) C16:1
Val ↓ lysoPC a C18:2 ↑ PC aa C38:1 ↑↑ PC aa C38:1PC ae C42:5 ↑ SM C16:0 ↑↓ SM C16:0
Phe ↓ ↑ lysoPC a C16:1PC aa C38:5 ↑↑ PC aa C38:5PC ae C44:5 ↑ ↓ SM (OH) C14:1
Tyr ↓ ↑ lysoPC a C24:0PC aa C40:2 ↑↑ PC aa C40:2PC ae C32:1 ↑↑ PC ae C32:1 ↓ SM (OH) C24:1
Trp ↓↓ Trp ↑ lysoPC a C26:0PC aa C40:5 ↑↑ PC aa C40:5PC ae C32:2 ↑↑ PC ae C32:2 ↓ SM C16:1
Lys ↓↑ Lys PC aa C42:0 ↑↑ PC aa C42:0PC ae C34:1 ↑↑ PC ae C34:1 ↓ SM C18:1
Ala ↓↑ Ala PC aa C42:1 ↑↑ PC aa C42:1PC ae C38:1 ↑↑ PC ae C38:1 ↓ SM C20:2
Cit ↑↑ Cit PC aa C42:4 ↑↑ PC aa C42:4PC ae C38:6 ↑↑ PC ae C38:6 ↓ SM C26:0
Gln ↑↓ Gln PC aa C42:5 ↑↑ PC aa C42:5PC ae C40:5 ↑↑ PC ae C40:5
Glu ↓↑ Glu PC aa C42:6 ↑↑ PC aa C42:6PC ae C40:6 ↑↑ PC ae C40:6
↑ PC aa C30:0PC ae C42:1 ↑↑ PC ae C42:1
↑ PC aa C32:1PC ae C42:2 ↑↑ PC ae C42:2
↑ PC aa C32:2PC ae C42:3 ↑↑ PC ae C42:3
↑ PC aa C32:3PC ae C44:3 ↑↑ PC ae C44:3
↑ PC aa C34:3PC ae C44:6 ↑↑ PC ae C44:6
↑ PC aa C34:4 ↑ PC ae C34:0
↑ PC aa C36:5 ↑ PC ae C36:0
↑ PC aa C36:6 ↑ PC ae C36:1
↑ PC aa C38:0 ↑ PC ae C36:3
↑ PC aa C38:6 ↑ PC ae C38:0
↑ PC aa C40:3 ↑ PC ae C38:3
↑ PC ae C40:3
Disclaimer/Publisher’s Note: The statements, opinions and data contained in all publications are solely those of the individual author(s) and contributor(s) and not of MDPI and/or the editor(s). MDPI and/or the editor(s) disclaim responsibility for any injury to people or property resulting from any ideas, methods, instructions or products referred to in the content.

