Article

Genome-Wide Analyses of Thaumatin-like Protein Family Genes Reveal the Involvement in the Response to Low-Temperature Stress in Ammopiptanthus nanus

1
Key Laboratory of Mass Spectrometry Imaging and Metabolomics, Minzu University of China, National Ethnic Affairs Commission, Beijing 100081, China
2
Key Laboratory of Ecology and Environment in Minority Areas, Minzu University of China, National Ethnic Affairs Commission, Beijing 100081, China
3
College of Life and Environmental Sciences, Minzu University of China, Beijing 100081, China
*
Authors to whom correspondence should be addressed.
Int. J. Mol. Sci. 2023, 24(3), 2209; https://doi.org/10.3390/ijms24032209
Submission received: 31 December 2022 / Revised: 15 January 2023 / Accepted: 20 January 2023 / Published: 22 January 2023
(This article belongs to the Special Issue Molecular Mechanisms of Plant Defense against Abiotic Stress)

Abstract

:
Thaumatin-like proteins (TLPs), a family of proteins with high sequence similarity to thaumatin, are shown to be involved in plant defense, and are thus classified into the pathogenesis related protein family 5. Ammopiptanthus nanus is a rare evergreen broad-leaved shrub distributed in the temperate zone of Central Asia, which has a high tolerance to low-temperature stress. To characterize A. nanus TLPs and understand their roles in low-temperature response in A. nanus, a comprehensive analysis of the structure, evolution, and expression of TLP family proteins was performed. A total of 31 TLP genes were detected in the A. nanus genome, and they were divided into four groups based on their phylogenetic positions. The majority of the AnTLPs contained the conserved cysteine residues and were predicted to have the typical three-dimensional structure of plant TLPs. The primary modes of gene duplication of the AnTLP family genes were segmental duplication. The promoter regions of most AnTLP genes contain multiple cis-acting elements related to environmental stress response. Gene expression analysis based on transcriptome data and fluorescence quantitative PCR analysis revealed that several AnTLP genes were involved in cold-stress response. We further showed that a cold-induced AnTLP gene, AnTLP13, was localized in apoplast, and heterologous expression of the AnTLP13 in Escherichia coli and yeast cells and tobacco leaves enhanced low-temperature stress tolerance when compared with the control cells or seedlings. Our study provided important data for understanding the roles of TLPs in plant response to abiotic stress.

1. Introduction

Thaumatin-like proteins (TLPs) are polypeptides composed of approximately 200 amino acid residues, and their sequences are similar to thaumatin. Thaumatin is a sweet-tasting protein, which was originally found in the Thaumatococcus daniellii in West African [1]. Plant TLPs are classified as pathogenesis-related protein family 5 (PR5) due to their induced expression under the invasion of pathogens and pests [2]. Most TLP proteins contain a highly conserved motif, G-X-[GF]-X-C-X-T-[GA]-D-C-X(1,2)-G-X-(2,3)-C, a REDDD (arginine, glutamic acid, and three aspartic acid residues) structure, and sixteen or ten conserved cysteine residues, which form eight or five disulfide bonds [2,3,4]. These disulfide bonds help to maintain the three-dimensional structures of TLPs in unfavorable environments with high temperature or low pH. TLPs have been systematically identified in many plant species, such as barley [5], melon [6], watermelon [7], Vitis vinifera [8], and bread wheat [9].
TLPs have been shown to be involved in defense systems against various biotic stresses, and many TLP proteins have broad-spectrum antifungal activity [2,10]. Compared with wild-type, rice seedlings overexpressing TLP showed higher tolerance to Rhizoctonia solani and Sarocladium oryzae [11]. Arabidopsis thaliana plants overexpressing the VvTLP29 gene from grape showed stronger resistance to powdery mildew [8]. The TLP protein purified from banana exerts its antifungal activity by inducing fungal cell membrane disorder and cell wall disintegration [12]. Some recent studies showed that TLPs were also involved in plant response to abiotic stress. For example, ectopic expression of a TLP gene from peanut enhances the tolerance of tobacco seedlings to salt and oxidative stress [13]. Compared with the control, Saccharomyces cerevisiae overexpressing wheat TaTLP2 gene exhibited stronger tolerance to cold, heat, osmotic, and salt stress [9].
Plants usually live in ever-changing environments that are often unfavorable for plant growth and development. These unfavorable environmental factors include biotic stresses, such as pests or weeds, and abiotic stresses, including low temperature, drought, and high salinity [14,15]. Low temperature and drought are the main environmental factors affecting plant distribution and crop yield. It is estimated that low-temperature stress may lead to about 40% annual crop yield reduction in temperate regions [16]. Low-temperature stress can induce osmotic and oxidative stress, resulting in reactive oxygen species accumulation, protein denaturation, cell membrane damage, nucleic acid damage, and even plant death [17]. Plants can adapt to environmental stress by activating molecular networks, including signal transduction, stress perception, metabolite production, and expression of stress-tolerance related genes. Stress-tolerance related genes mainly include functional genes that encode proteins protecting cellular components, and regulatory genes that regulate stress responses [18]. At present, many functional genes for protecting cells have been characterized, including heat shock protein (HSP), late embryogenesis-abundant (LEA) protein, antioxidant enzymes, and membrane transporters [19]. Mining novel stress-tolerance related genes from plants in special habitats can provide candidate genes for cultivating crop varieties that can tolerate abiotic stresses.
Ammopiptanthus nanus is mainly distributed in Wuqia County, Xinjiang Uygur Autonomous Region, China, and Kyrgyzstan. A. nanus is a rare evergreen broad-leaved shrub in temperate desert areas and plays an important role in maintaining the fragile plant ecosystem in dryland of central Asia [20]. A. nanus has grown in the harsh desert environment of Central Asia for a long time and has a high tolerance to environmental stresses, including low-temperature stress [21]. The stress-related genes in the A. nanus genome might contribute to the high abiotic stress tolerance of A. nanus. Some stress-related genes of A. nanus, including AnGoIS1 [22] and AnVP1 [23], have been isolated and characterized by overexpressing in Arabidopsis plants. Preliminary studies have shown that some TLP genes are up-regulated under low-temperature stress, thus it is speculated that TLP genes might be involved in the response of plants to low-temperature stress in A. nanus. In the present study, the whole-genome identification of the TLP family of A. nanus was conducted, and the chromosome distribution, phylogenetic relationships, gene replication events, and expression profiling for the TLP gene family members under low-temperature stress in A. nanus were analyzed. The biological function of an AnTLP gene was further investigated by being expressed in E. coli, yeast, and tobacco seedlings. This study will provide important data for understanding the biological function of TLPs in A. nanus.

2. Results

2.1. Genome-Wide Identification of TLPs in A. nanus

A total of 31 TLPs were identified from the genome of A. nanus (Table 1). The pI values of the 31 predicted TLPs range from 4.27 to 9.25. The amino acid length of AnTLPs ranged from 196 (AnTLP7) to 348 (AnTLP21), with a molecular weight of 20.9 kDa to 35.1 kDa, respectively. There were 21 acidic proteins in the AnTLP family, accounting for 74.19% of all AnTLPs. A total of 20 AnTLPs were hydrophilic proteins, accounting for 64.52%. Signal peptides were detected in 24 AnTLPs, with an average length of 26 amino acids. There were two transmembrane domains in AnTLP24 and AnTLP28, and one transmembrane domain in 13 AnTLP proteins. Subcellular localization analysis showed that the majority of AnTLPs were located in apoplast.
The 31 AnTLP genes were unevenly distributed on all chromosomes of A. nanus (Figure 1). There were eight AnTLP genes on chromosomes 2 and 3, while only one AnTLP gene was found on chromosomes 1, 7, 8, and 9.

2.2. Structural Analysis of TLPs in A. nanus

Amino acid sequences of all the AnTLPs were used to conduct multiple sequence alignment for identification of the conserved domains. As shown in Figure 2, the majority of the AnTLPs possess the typical 16 conserved cysteine residues, while AnTLP8 (EVM0011680) and AnTLP7 (EVM0027347) contain only 6 or 7 cysteine residues, respectively. Most AnTLPs contain the conserved signatures (PS00316, blue box in Figure 2; IPR001938, red boxes in Figure 2), and the conserved REDDD amino acid sequences.
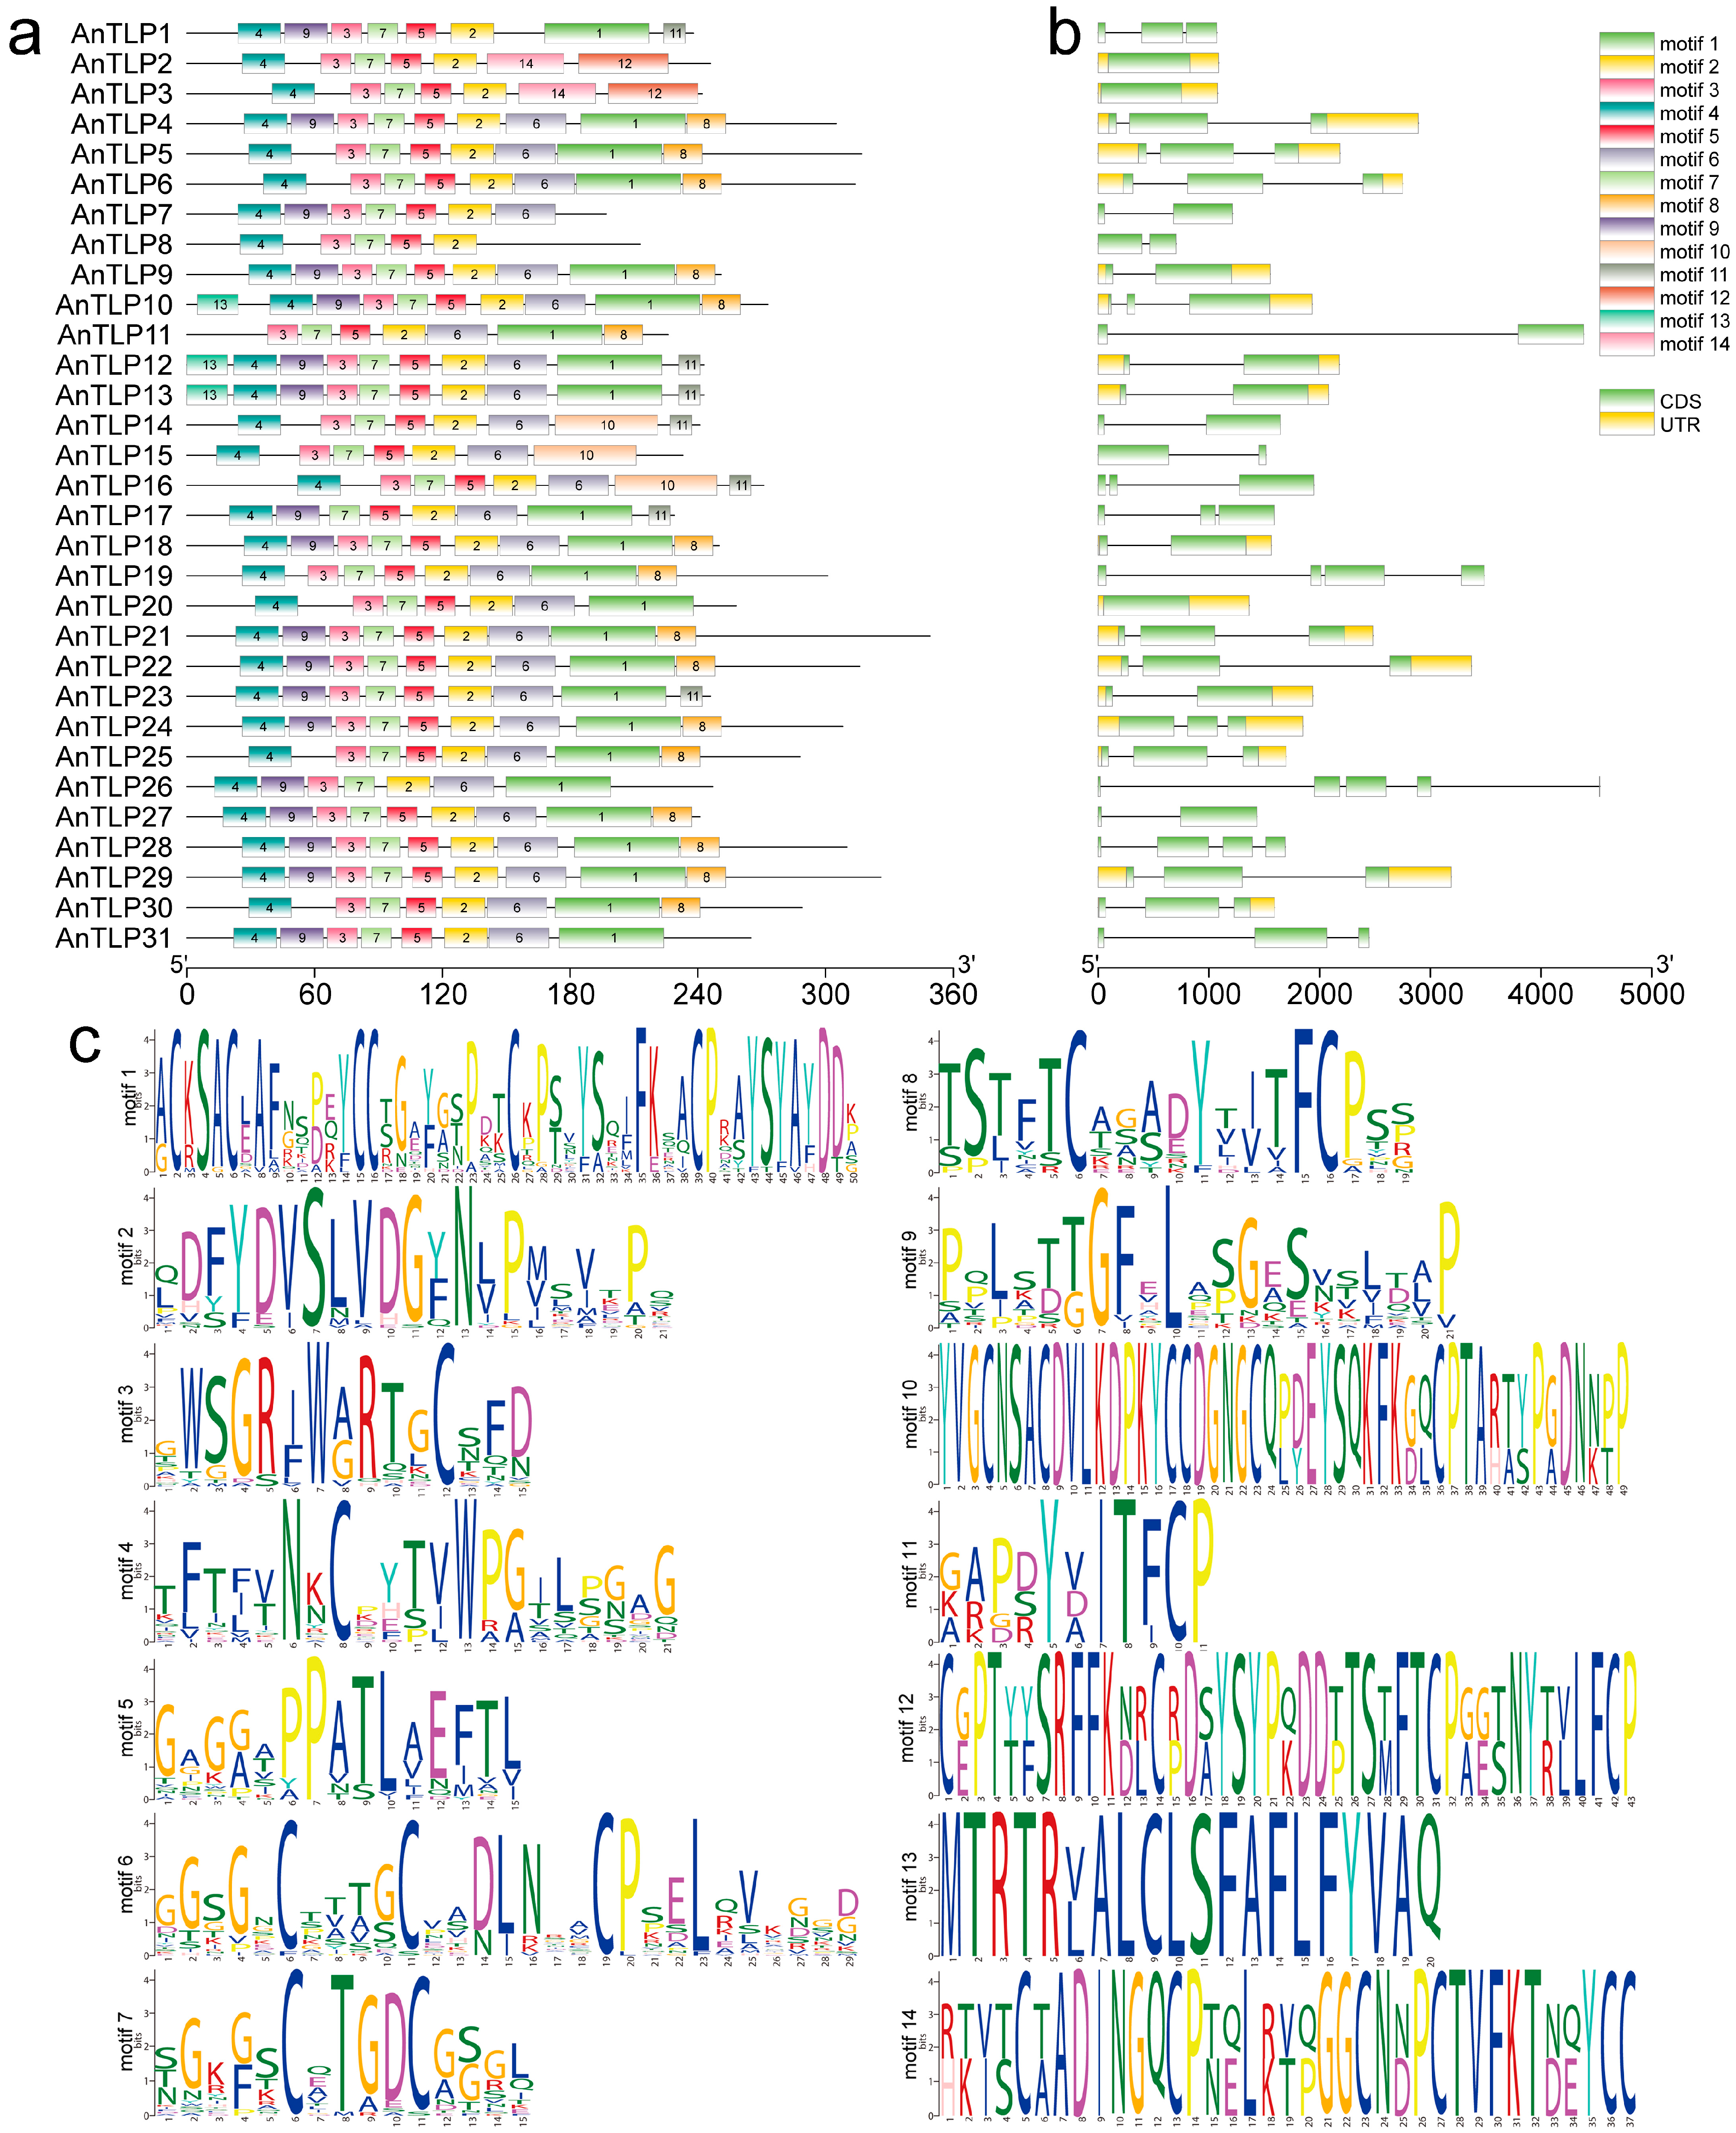
We also conducted MEME analysis to identify the protein motif in amino acid sequences of AnTLPs. The majority of the AnTLP proteins contained motif1, motif 2, motif 3, motif 4, motif 5, motif 6, motif 7, motif 8, and motif 9, indicating that these motifs were the core sequences of the conserved domain of the AnTLPs. Some motifs were only detected in one or two AnTLPs. For example, motif 12 and motif 14 were only present in AnTLP2 and AnTLP3 (Figure 3a). All AnTLP loci ranged in length from 591 bp to 1047 bp, with the longest gene being AnTLP21 and the shortest being AnTLP7. Most AnTLP (28/31, 90.32%) loci contain less than three introns, and 14 AnTLP loci have only one or zero intron (Figure 3b).
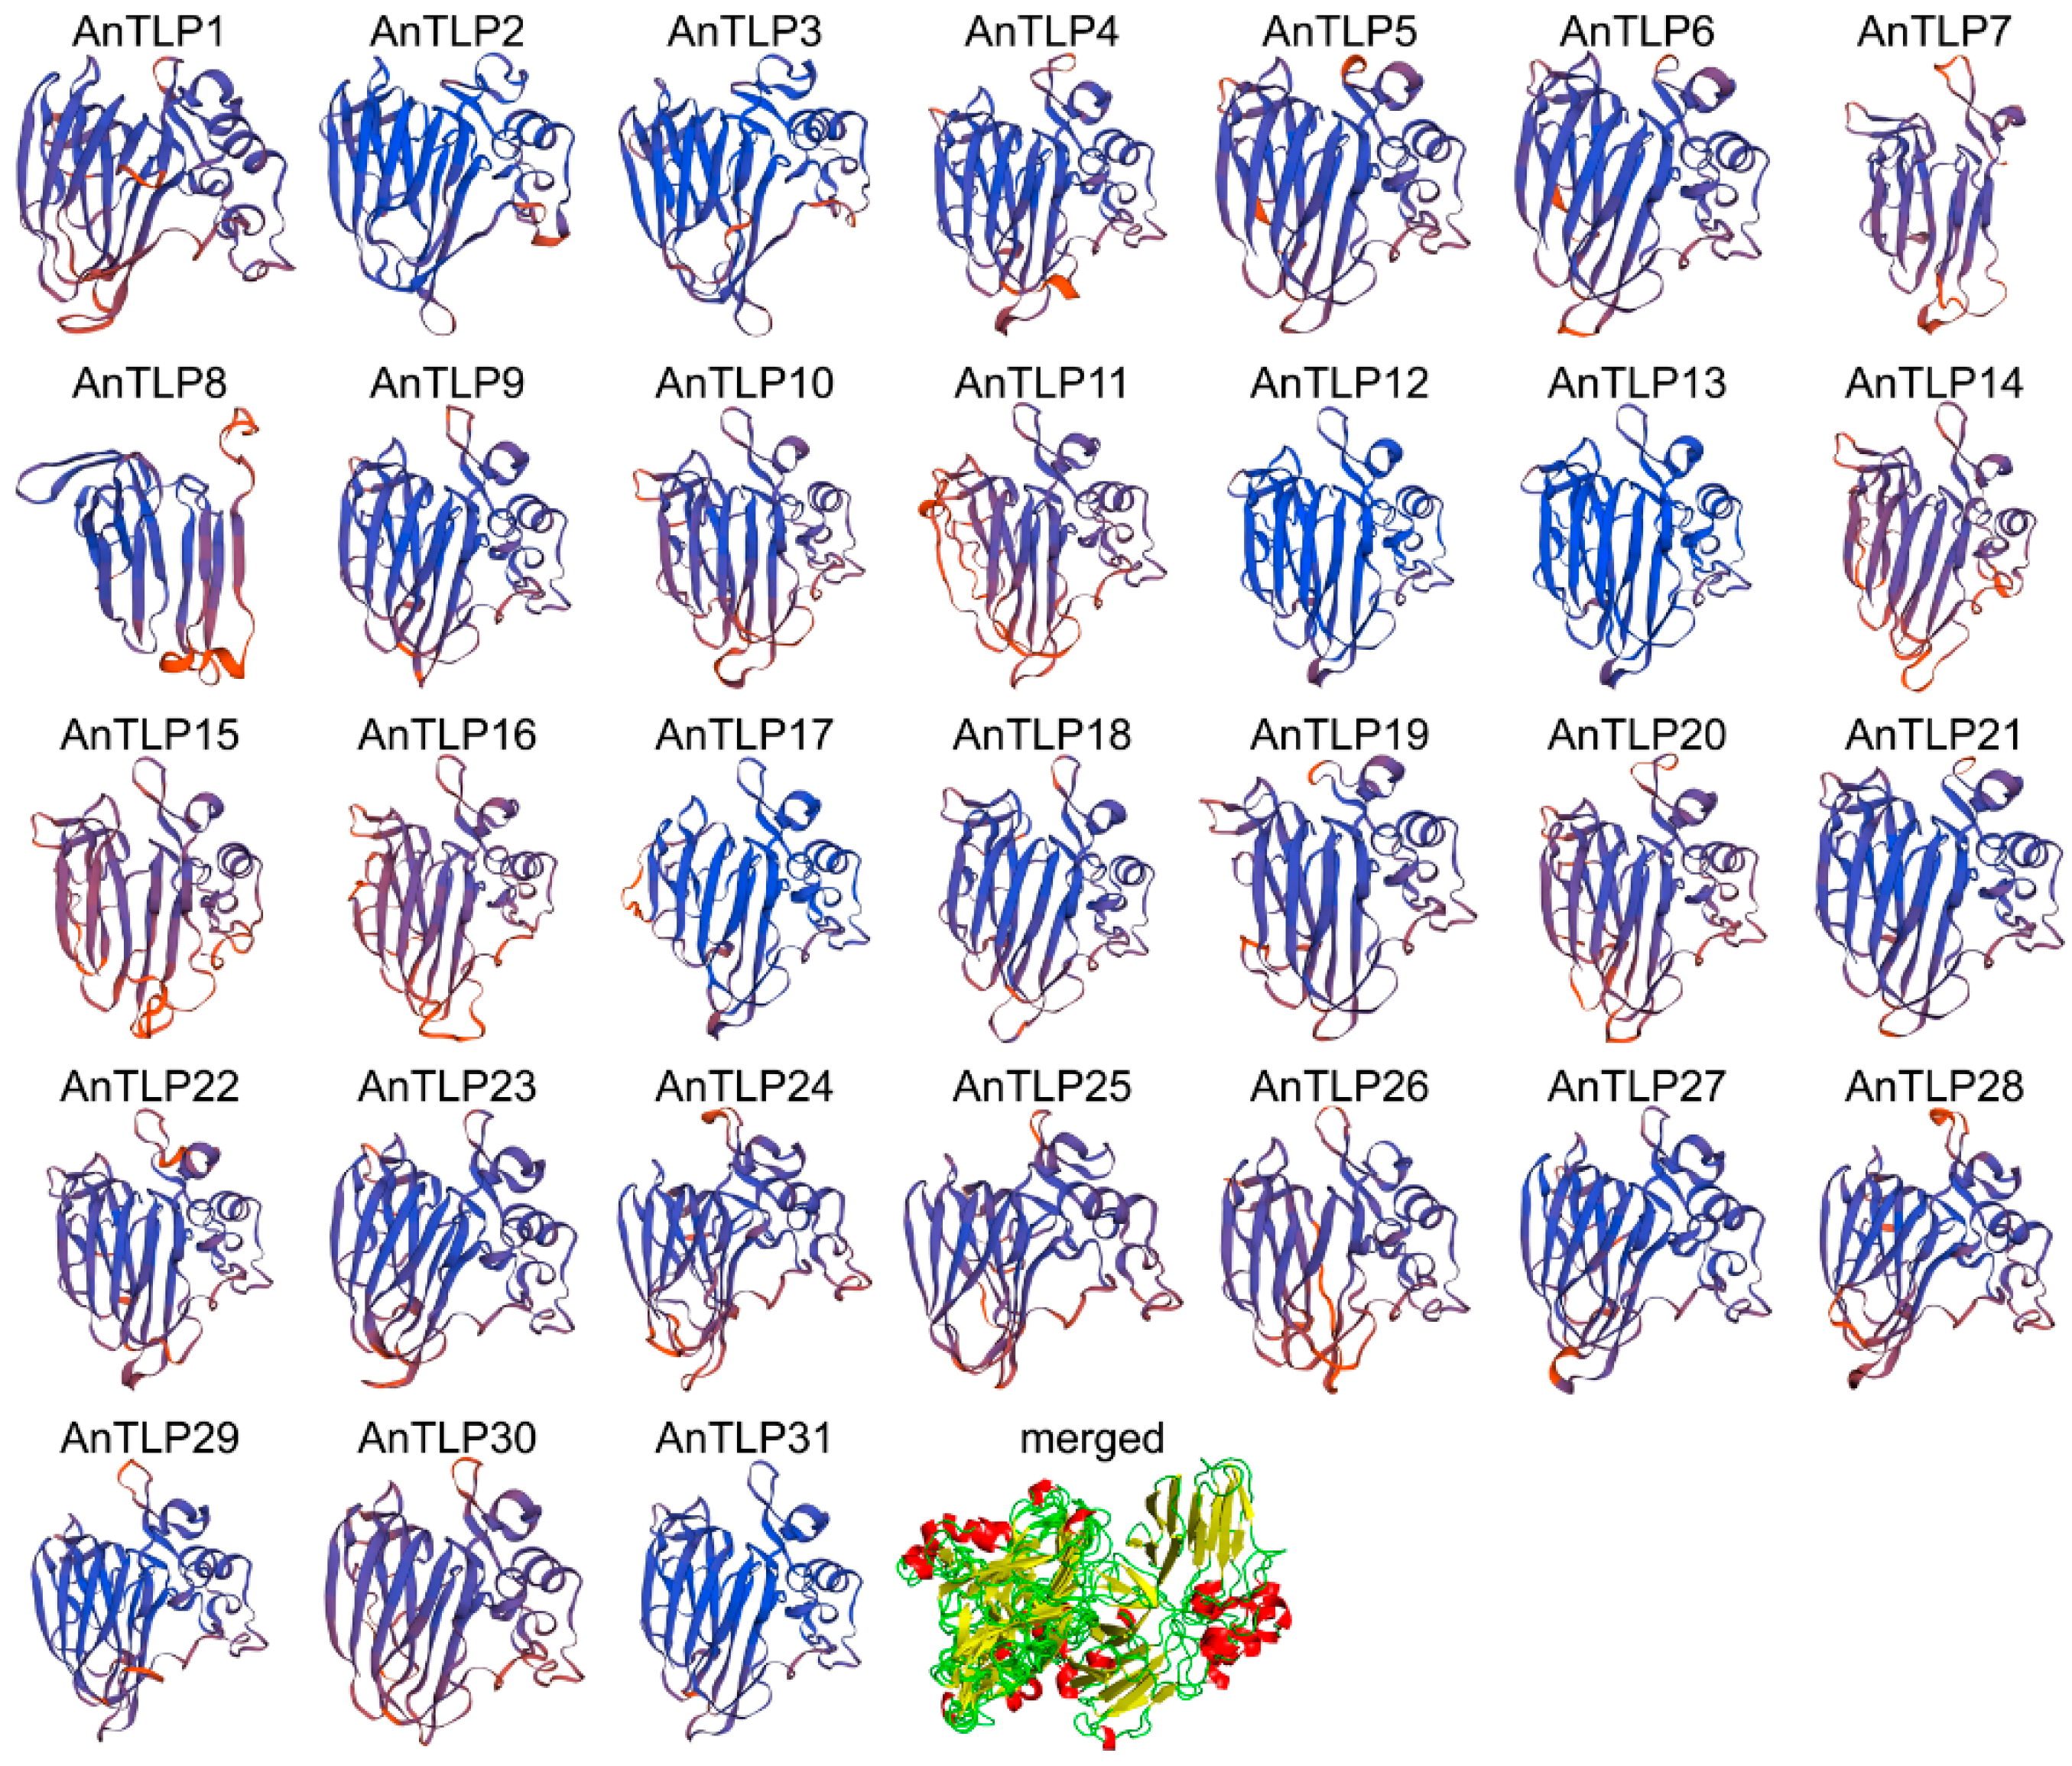
To clarify the differences between AnTLP protein structures, the structure of AnTLP protein was predicted by homology modeling (Figure 4), and the quality of the predicted protein structure was evaluated (Table S1). There were 2–6 α-helix and 10–15 β-sheet and multiple loops in the three-dimensional structure of AnTLP, which was consistent with the typical three-dimensional structure of TLP protein. The identity of AnTLP and template ranged from 36.19% to 75.11%, a value greater than 30%, indicating compliance with homology modelling requirements. Three assessment results showed that the reliability of the predicted three-dimensional structure of AnTLP was high in this present study. AnTLP2, AnTLP3, and AnTLP8 were clearly distinguished from other AnTLP in the merged diagram, indicating that their biological functions might be quite different from other AnTLP.

2.3. Phylogenetics, Gene Duplication, and Divergence of TLP Family in A. nanus

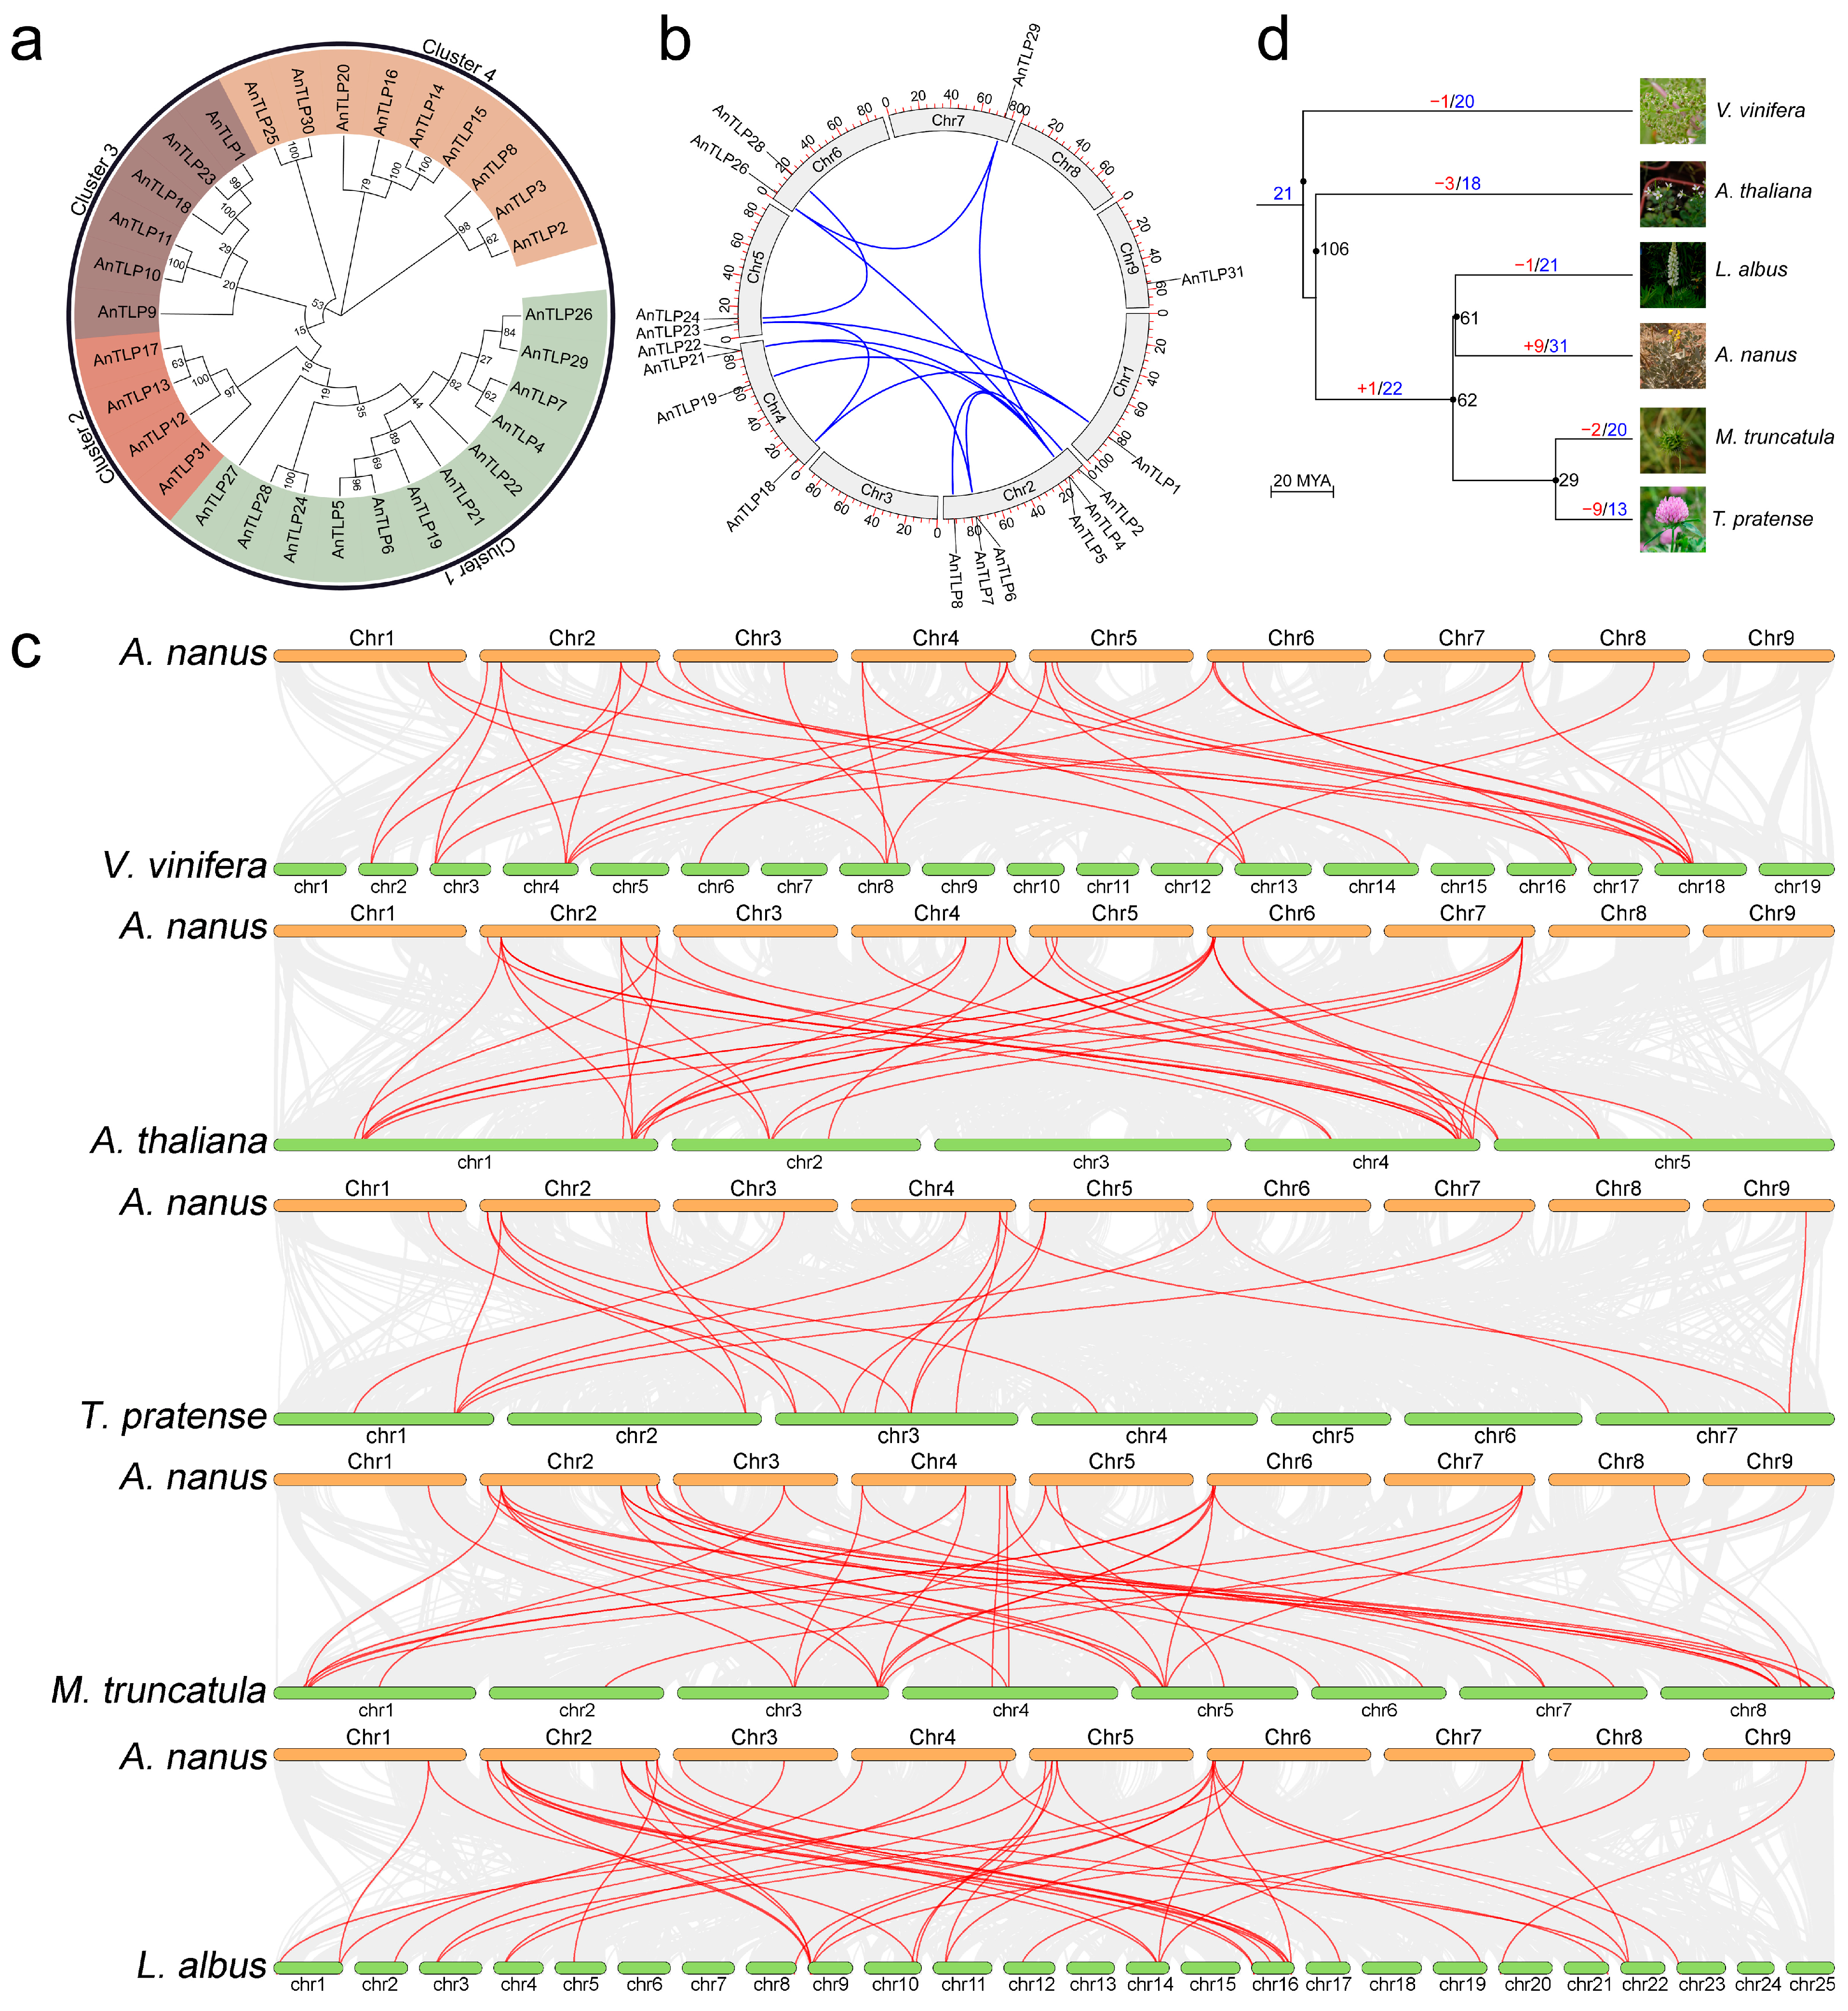
To analyze the evolutionary relationships of the TLP family members in A. nanus, a phylogenetic tree was generated using the amino acid sequences of the predicted AnTLPs (Figure 5a). All AnTLPs were divided into four clusters based on their phylogenetic relationships, with the largest number of AnTLP in Cluster 1 and the smallest number of AnTLP in Cluster 2.
Gene duplication is considered as one of the main driving forces of genome evolution, and segmental duplication and tandem duplication are regarded as two main driving forces for gene family expansion in plants. A total of 16 genes that were generated by segmental duplication and 8 genes that were generated by tandem duplication were identified in the TLP gene family of A. nanus (Figure 1 and Figure 5b).
To reveal the evolution of the TLP gene family in A. nanus, TLP orthologs in related plant species were identified, and 20, 18, 13, 20, and 21 orthologs of AnTLP were found in Vitis vinifera, A. thaliana, Trifolium pratense, Medicago truncatula, and Lupinus albus, respectively. Gene collinearity analysis showed that there was a varying degree of collinearity between the TLP gene family of A. nanus and the TLP gene family of other plants (Figure 5c). We further reconstructed the evolution relationship between the TLP gene family in A. nanus and the other five plant species (Figure 5d).

2.4. Positive Selection and Codon Usage Bias Analysis of TLP Gene Family in A. nanus

To investigate the adaptive evolution of the TLP gene family in A. nanus, the ratio of non-synonymous mutation (Ka) to synonymous mutation (Ks) of AnTLP was calculated. The Ka/Ks value of the gene for neutral selection was 1, the Ka/Ks value of the gene for negative selection was less than 1, and the Ka/Ks value of the gene for positive selection was higher than 1. All Ka/Ks values for AnTLP gene paralogous pairs were less than 1, indicating that all AnTLPs have undergone purifying selection (Table 2).
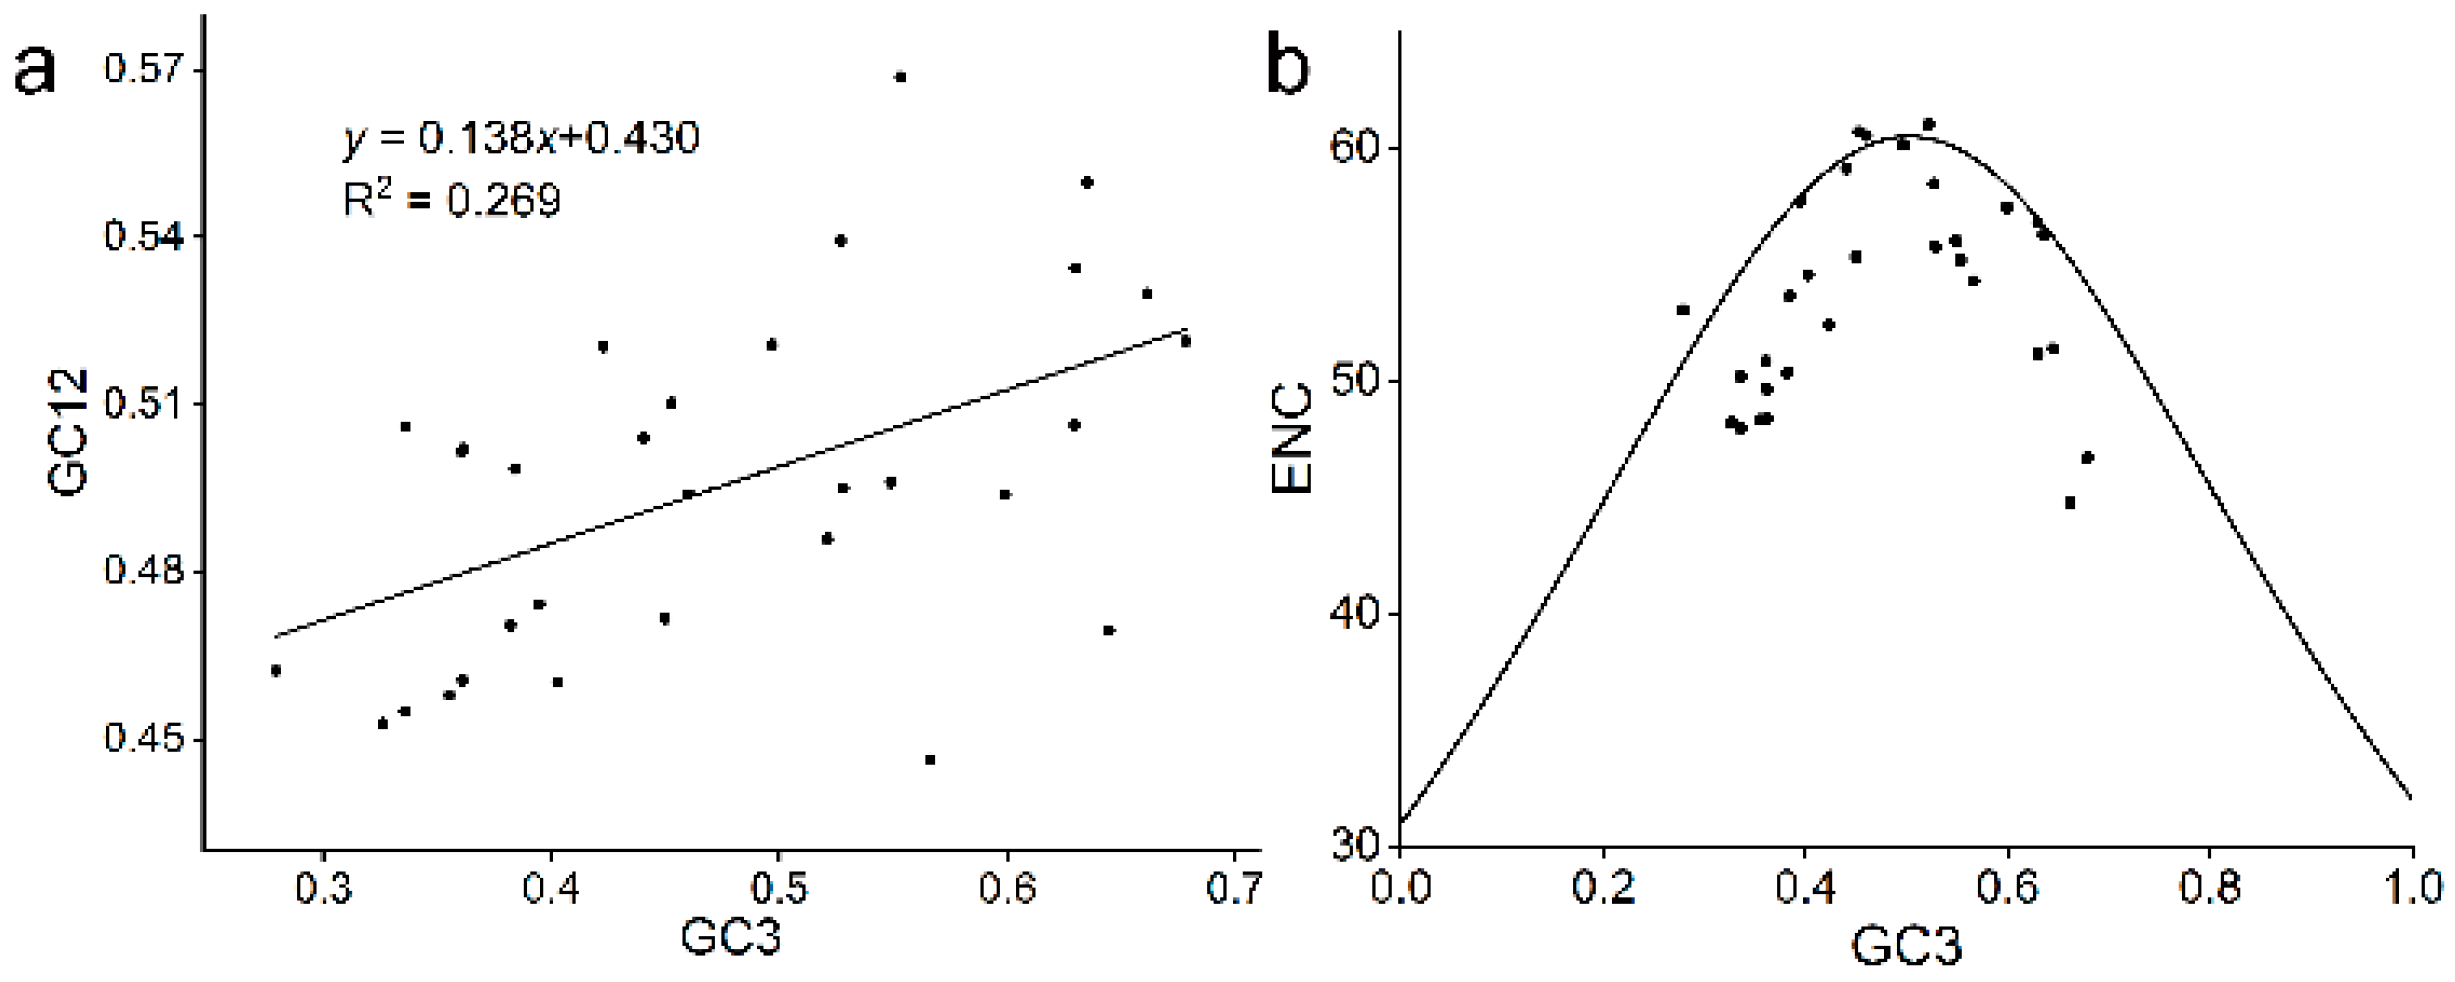
Codon usage bias of TLP gene family was analyzed in A. nanus to better understand the adaptive evolution of AnTLP. The ENC of AnTLP gene was between 44.78 and 61, the CAI value was between 0.17 and 0.31, and the Fop was between 0.30 and 0.55 (Table 3). The Pearson correlation coefficient for GC12 and GC3s of AnTLP was 0.519, indicating that codon usage bias of AnTLP was affected by mutation pressure (Figure 6a). Most of the points in the association map of ENC and GC3s are distributed near the standard curve, indicating that the codon usage bias of AnTLP was affected not only by mutation pressure, but also by selection pressure (Figure 6b).

2.5. Prediction of the Cis-Acting Elements in Promoter Regions of the TLP Genes in A. nanus

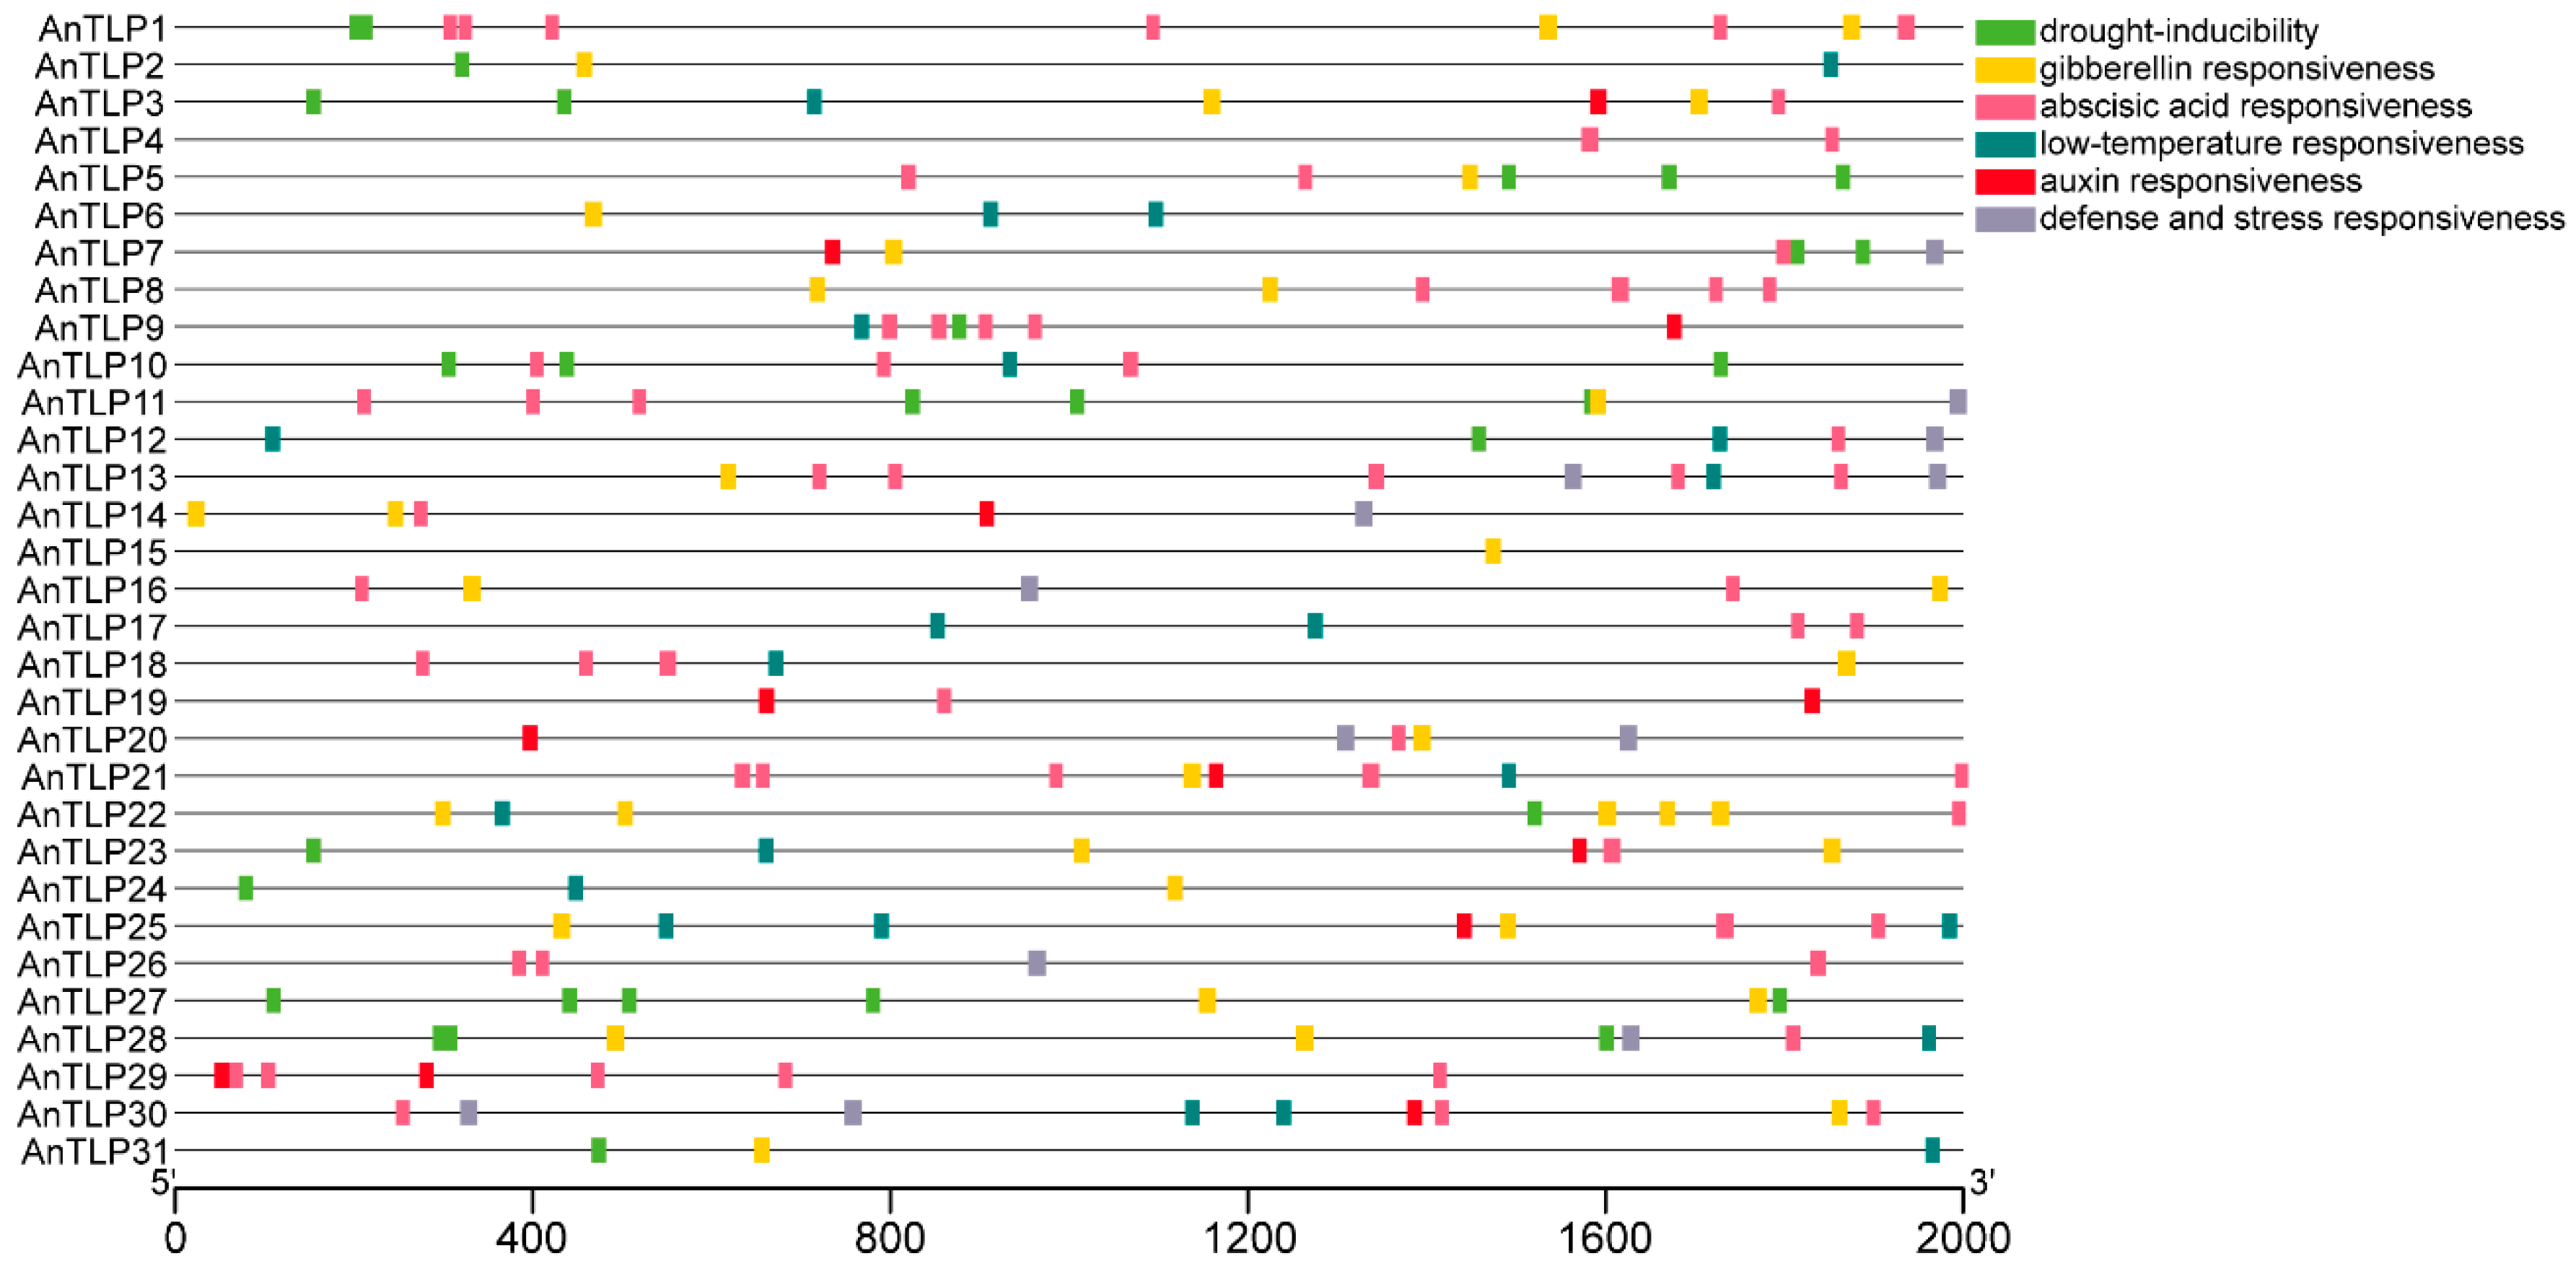
To understand the possible biological functions of AnTLPs, the cis-acting elements in the promoter regions of AnTLP genes were predicted (Figure 7). A total of 17 kinds of cis-acting elements that were involved in abiotic stress response and hormone response were predicted, and these cis-acting elements were involved in plant response to multiple stress signal and hormones, including auxin responsiveness (TGA-box), salicylic acid responsiveness (TCA-element), abscisic acid responsiveness (ABRE), low-temperature responsiveness (LTR), and drought inducibility (MBS). The number of cis-acting elements of the AnTLP1 and AnTLP21 genes was the largest, while the number of cis-acting elements of the AnTLP15 gene was the least. The presence of the LTR element in the promoter regions of 17 AnTLP genes suggested that these genes might be involved in the low-temperature stress response in A. nanus, and the presence of the MBS element in the promoter regions of 15 AnTLP genes suggested that these genes might be involved in the drought stress response in A. nanus.

2.6. Expression Patterns of A. nanus TLP Genes under Osmotic and Cold Stresses

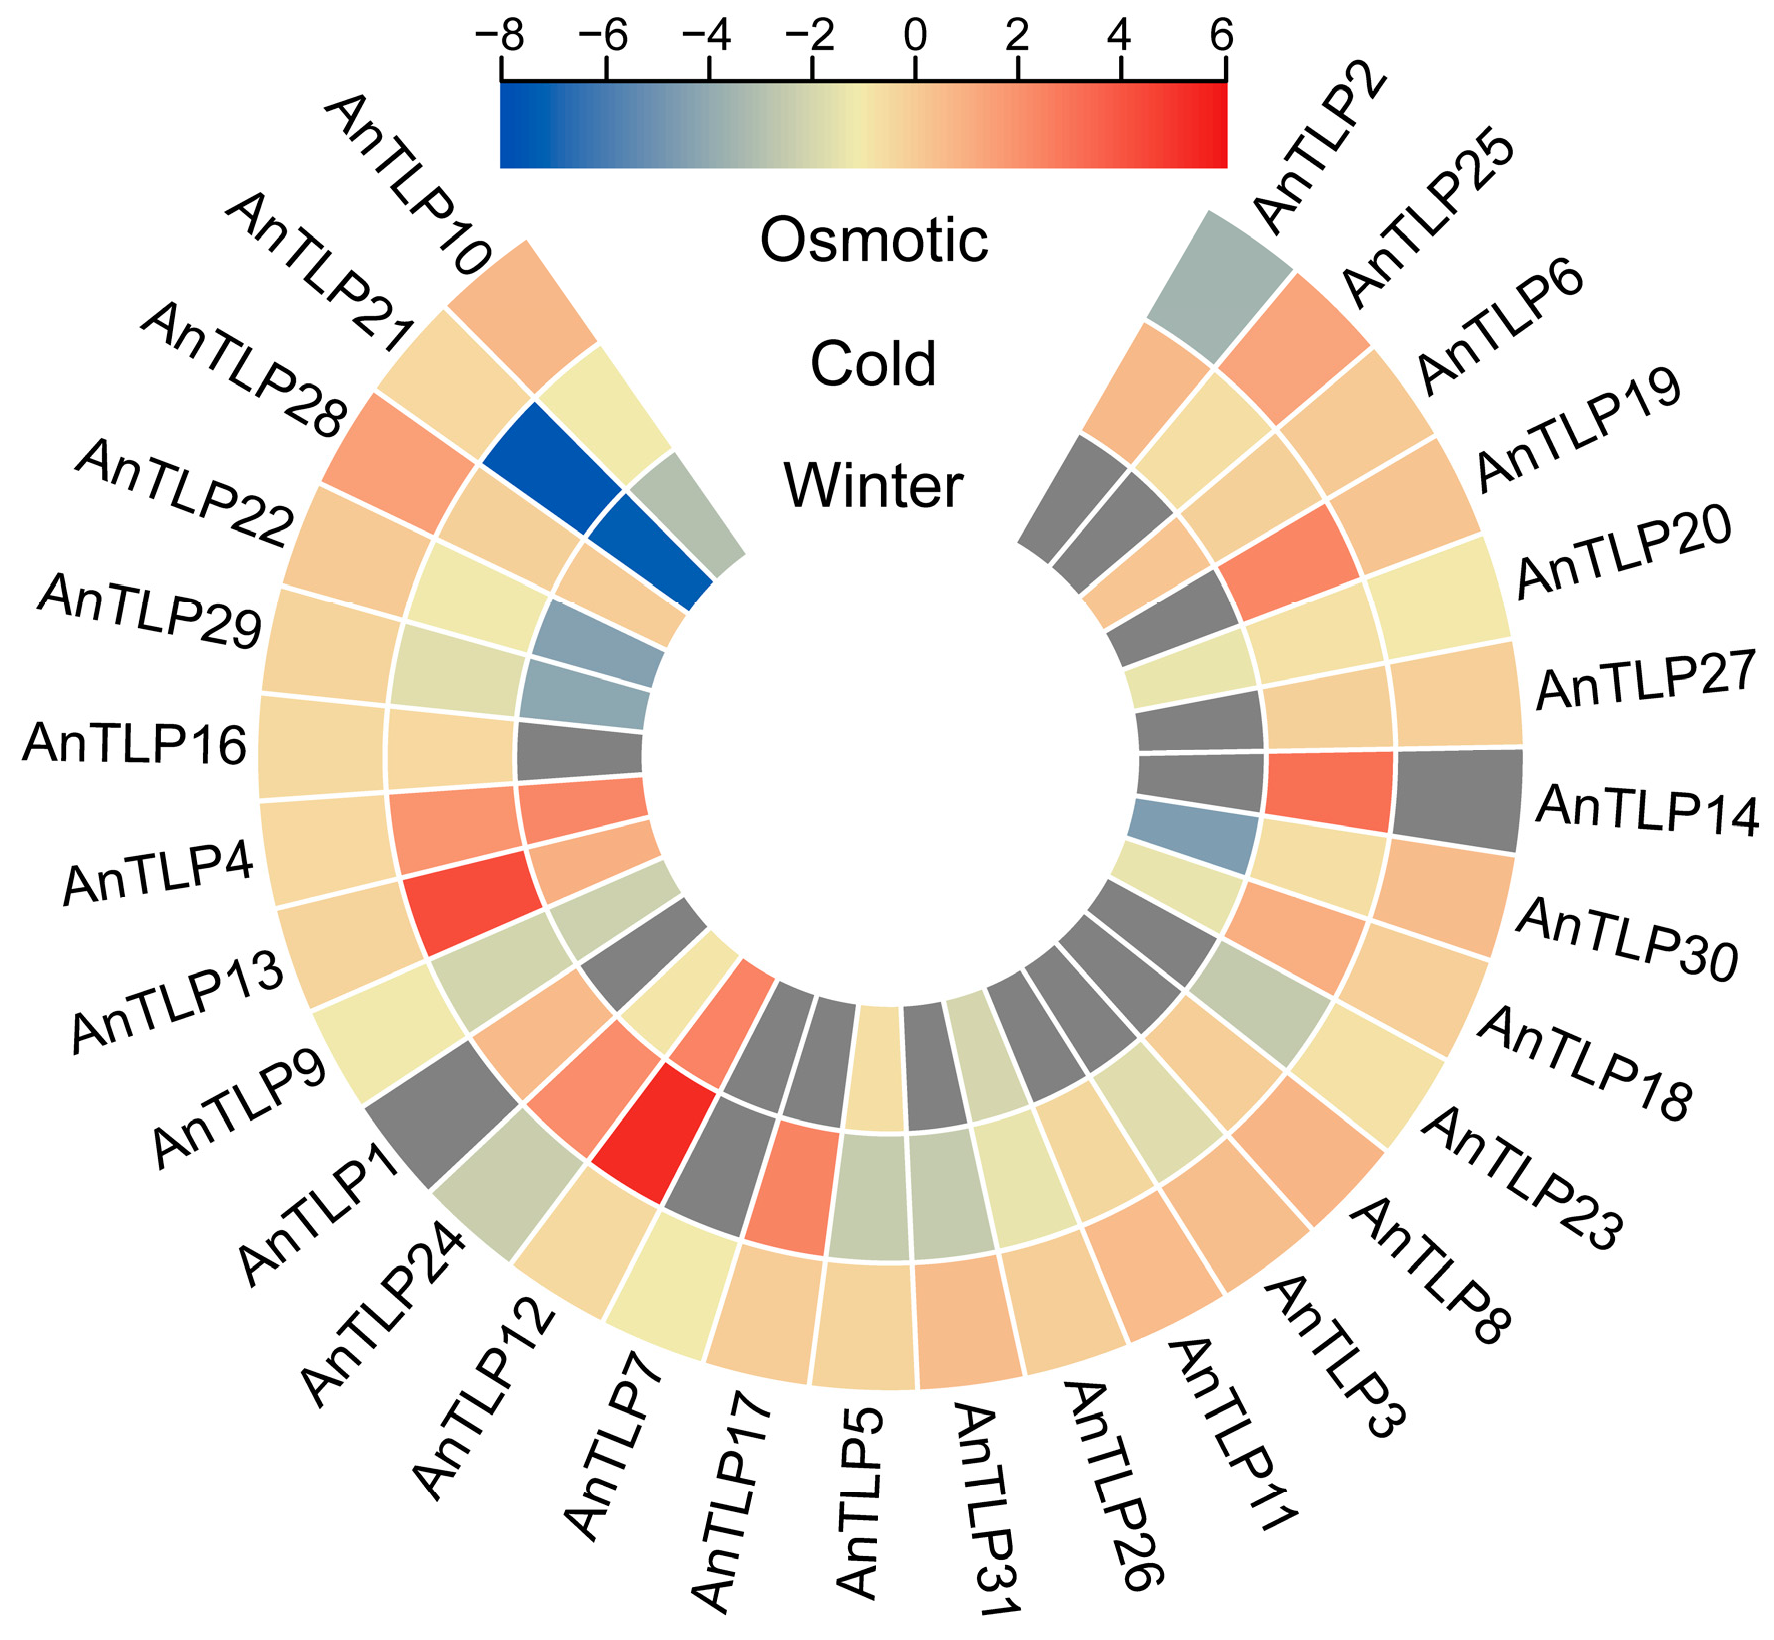
To further evaluate the potential functions of AnTLP genes, especially their roles in osmotic and low-temperature stress responses, the expression patterns of TLP family genes were analyzed using the RNA-seq database and qRT-PCR analysis. The transcriptome data showed that three AnTLP, i.e., AnTLP4, AnTLP12, and AnTLP13, were highly expressed in winter, and more AnTLP genes were up-regulated under short-term cold stress, including the three highly expressed genes in winter (Figure 8). The transcriptome data revealed that AnTLP25 and AnTLP28 were highly expressed under short-term osmotic stress.
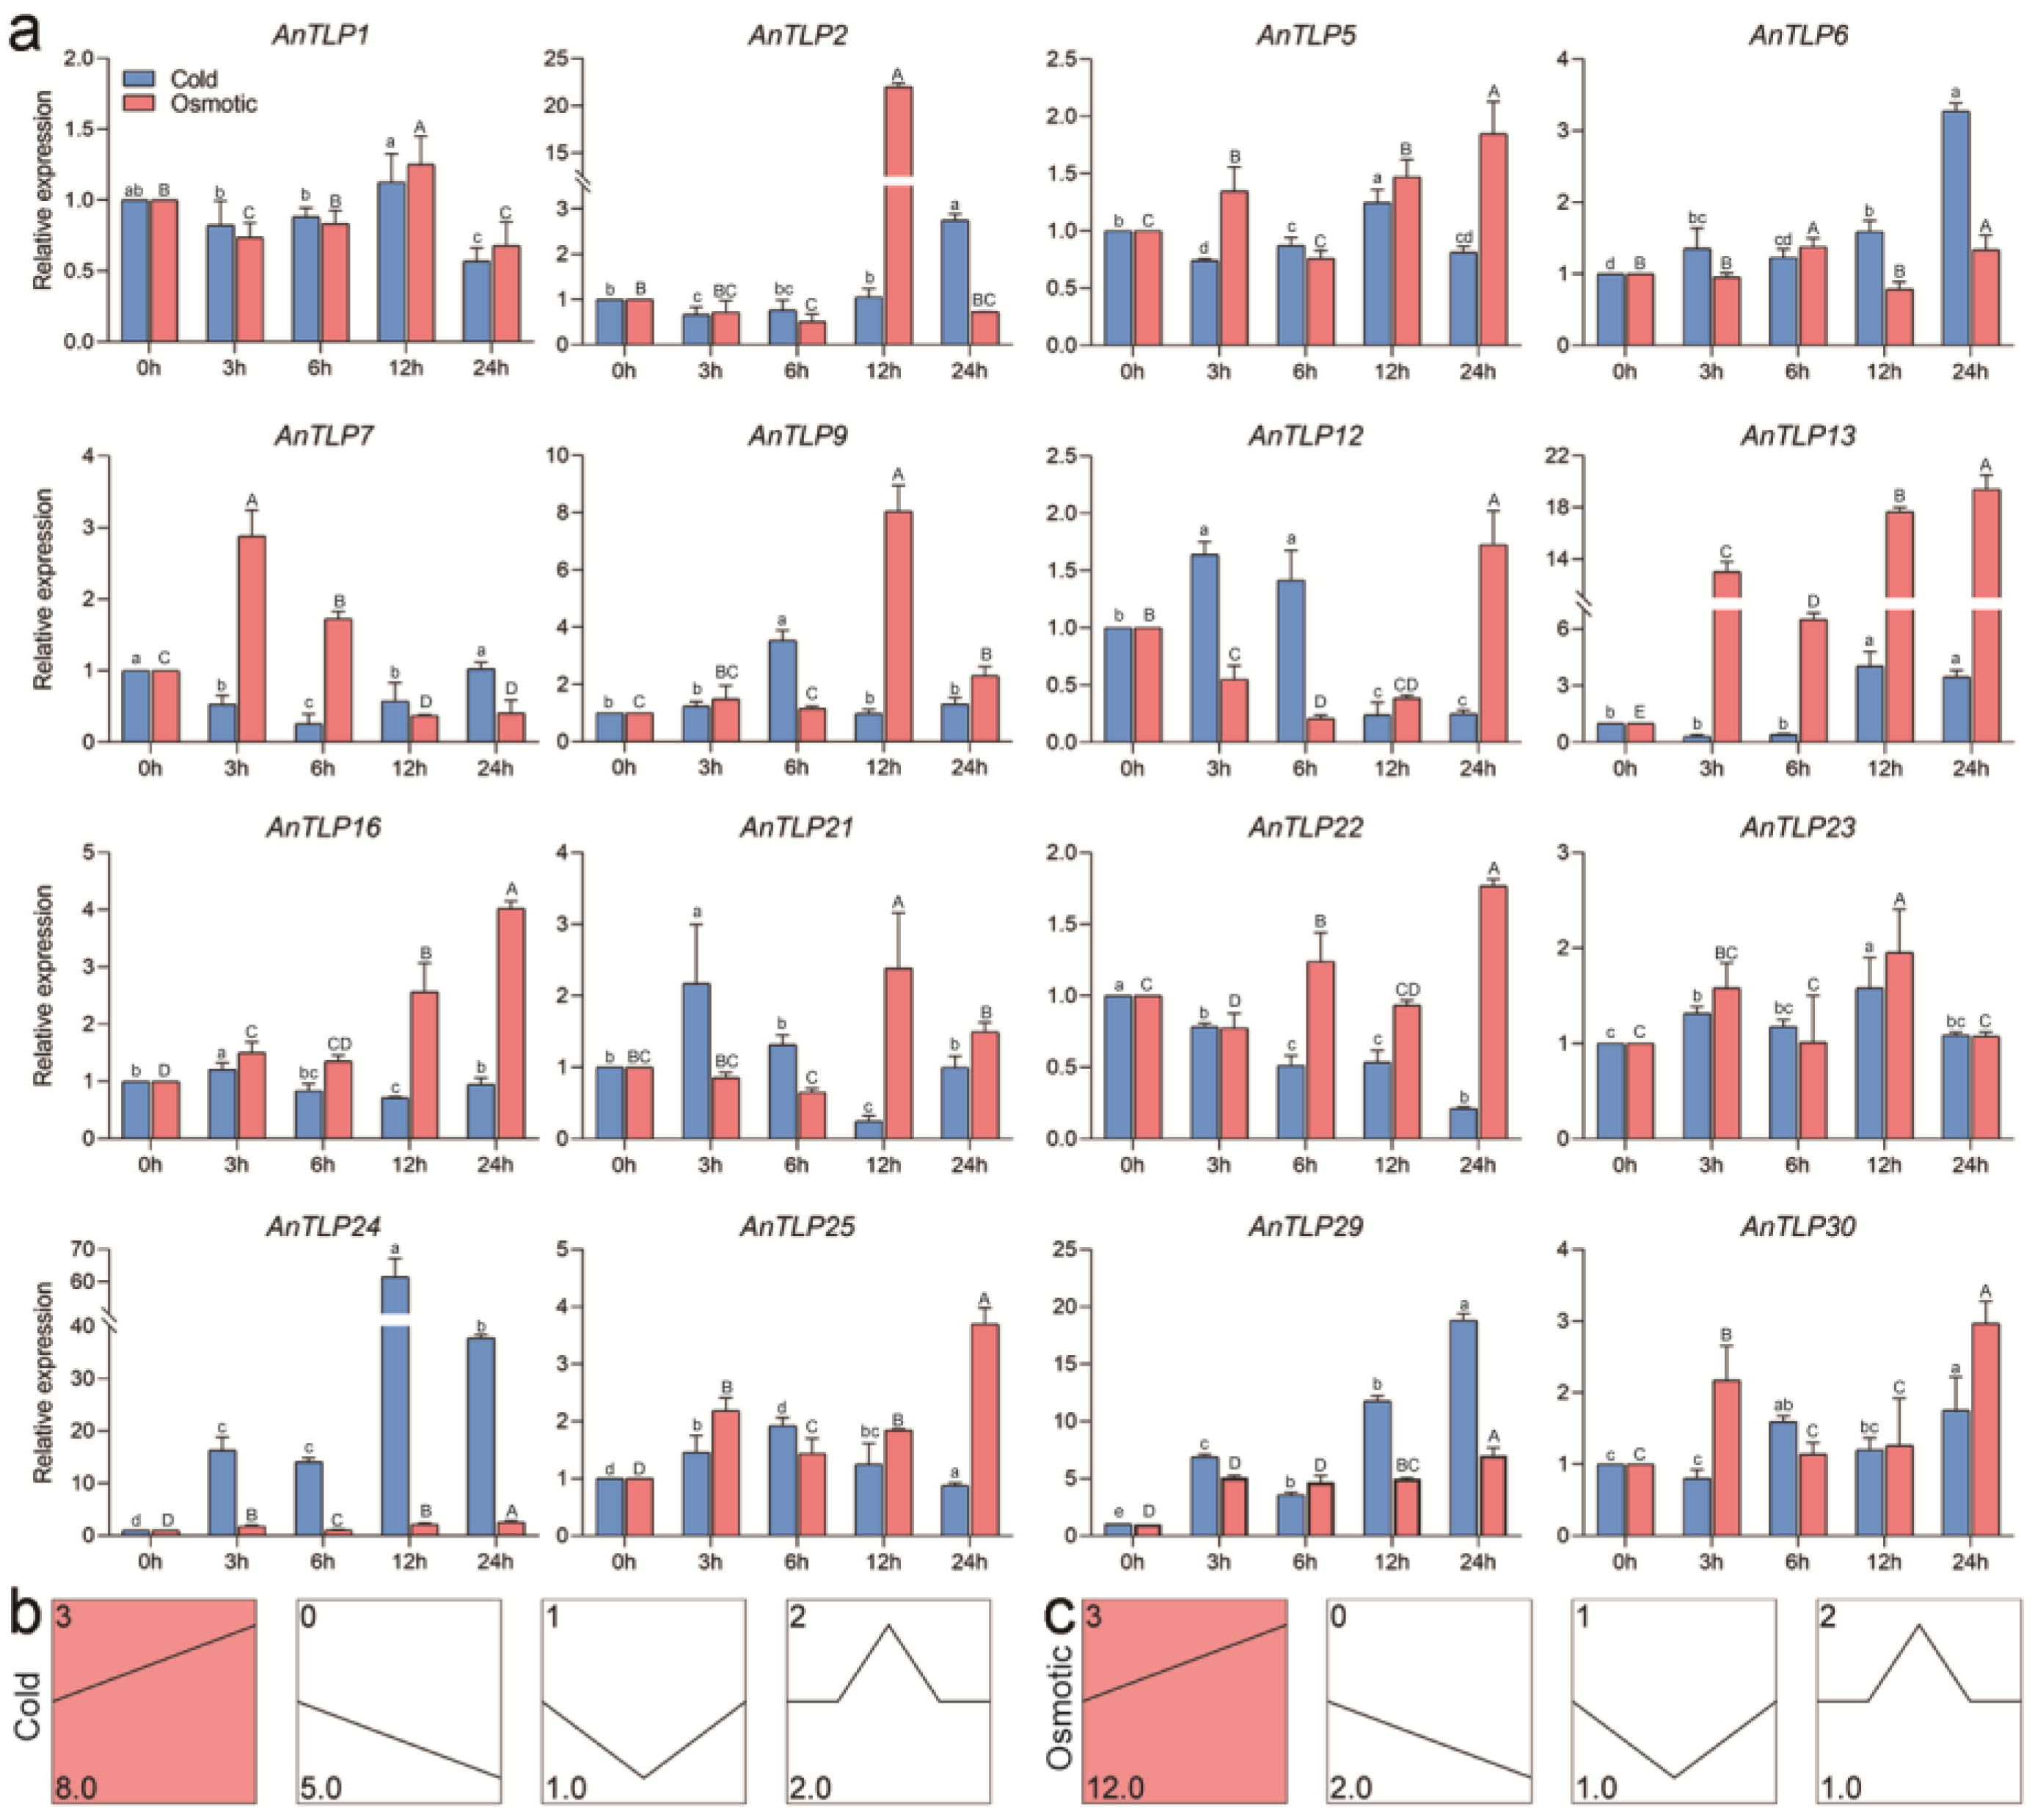
To further investigate the temporal expression pattern of the AnTLP, qRT-PCR analyses were performed for 16 AnTLP genes (Figure 9a). By series test of cluster analysis, AnTLP genes can be classified into four categories based on expression patterns under cold stress and osmotic stress (Figure 9b,c). Under cold stress, the expression levels of eight AnTLP genes increased gradually, including AnTLP24 and AnTLP29, while the expression of five AnTLP genes decreased gradually, including AnTLP16 and AnTLP22. Under osmotic stress, the expression of 12 AnTLP genes increased gradually, including AnTLP14 and AnTLP29, and the expression levels of two other AnTLP genes decreased gradually, including AnTLP1 and AnTLP7.

2.7. Overexpression of AnTLP13 Gene Enhanced the Tolerance to Low-Temperature Stress in E. coli and Yeast

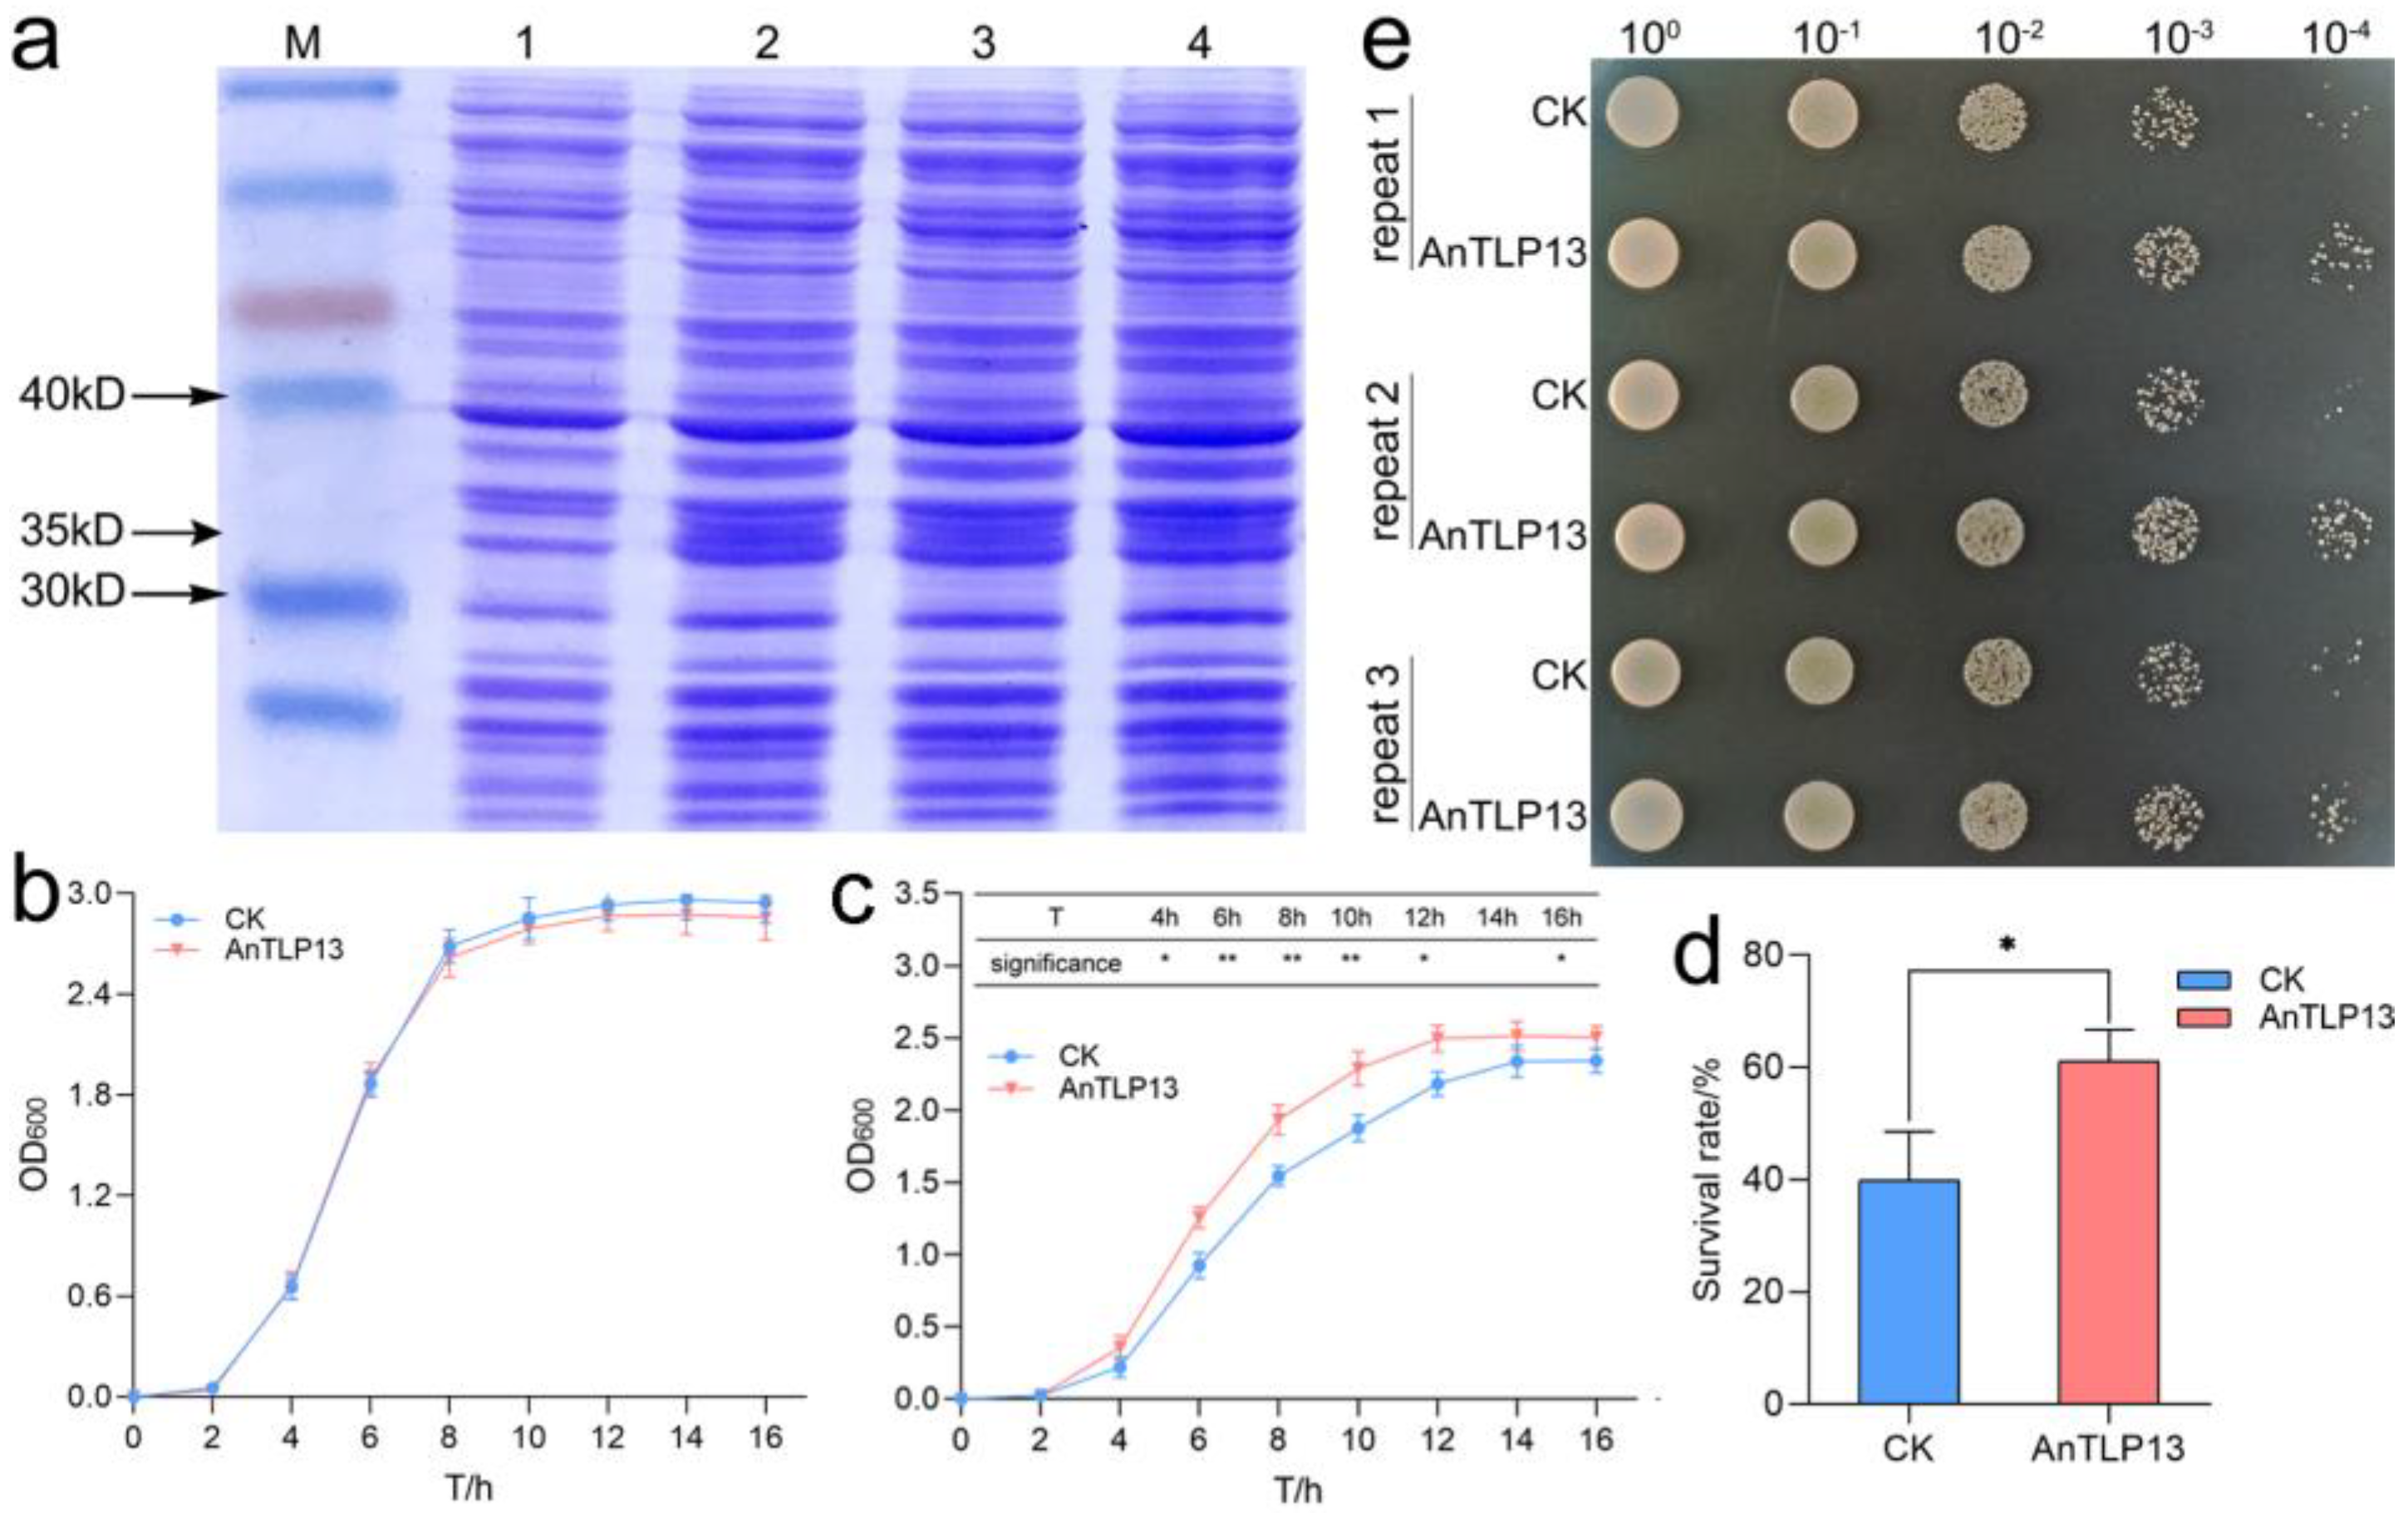
E. coli and yeast growth assay was performed to evaluate the effect of the AnTLP13 gene on the tolerance of E. coli and yeast to low-temperature stress. The AnTLP13 protein bands were found in SDS-PAGE gel, indicating that the AnTLP13 gene was successfully expressed in E. coli cells (Figure 10a). The growth curve of E. coli transformed with empty plasmid (CK) was almost coincident with that of E. coli overexpressing AnTLP13, indicating that overexpression of AnTLP13 did not affect the growth of E. coli under normal growth conditions (Figure 10b). When cultured at 28 °C, the growth rate of E. coli slowed down, and overexpression of the AnTLP13 gene effectively alleviated the inhibitory effect of cold on the growth of E. coli cells (Figure 10c). Repeated freeze–thaw treatment resulted in the mass death of E. coli cells, and overexpression of the AnTLP13 gene significantly increased the survival rate of E. coli after repeated freeze–thaw treatment (Figure 10d). After repeated freeze–thaw treatment, the survival yeast expressing the AnTLP13 gene (recorded as AnTLP13) was significantly higher than the yeast transformed with the pYES2 empty plasmid (recorded as CK) (Figure 10e). The above results showed that overexpression of the AnTLP13 gene enhanced the tolerance to low temperature in both E. coli and yeast.

2.8. Overexpression of AnTLP13 Gene Enhanced the Tolerance of Tobacco to Freezing Stress

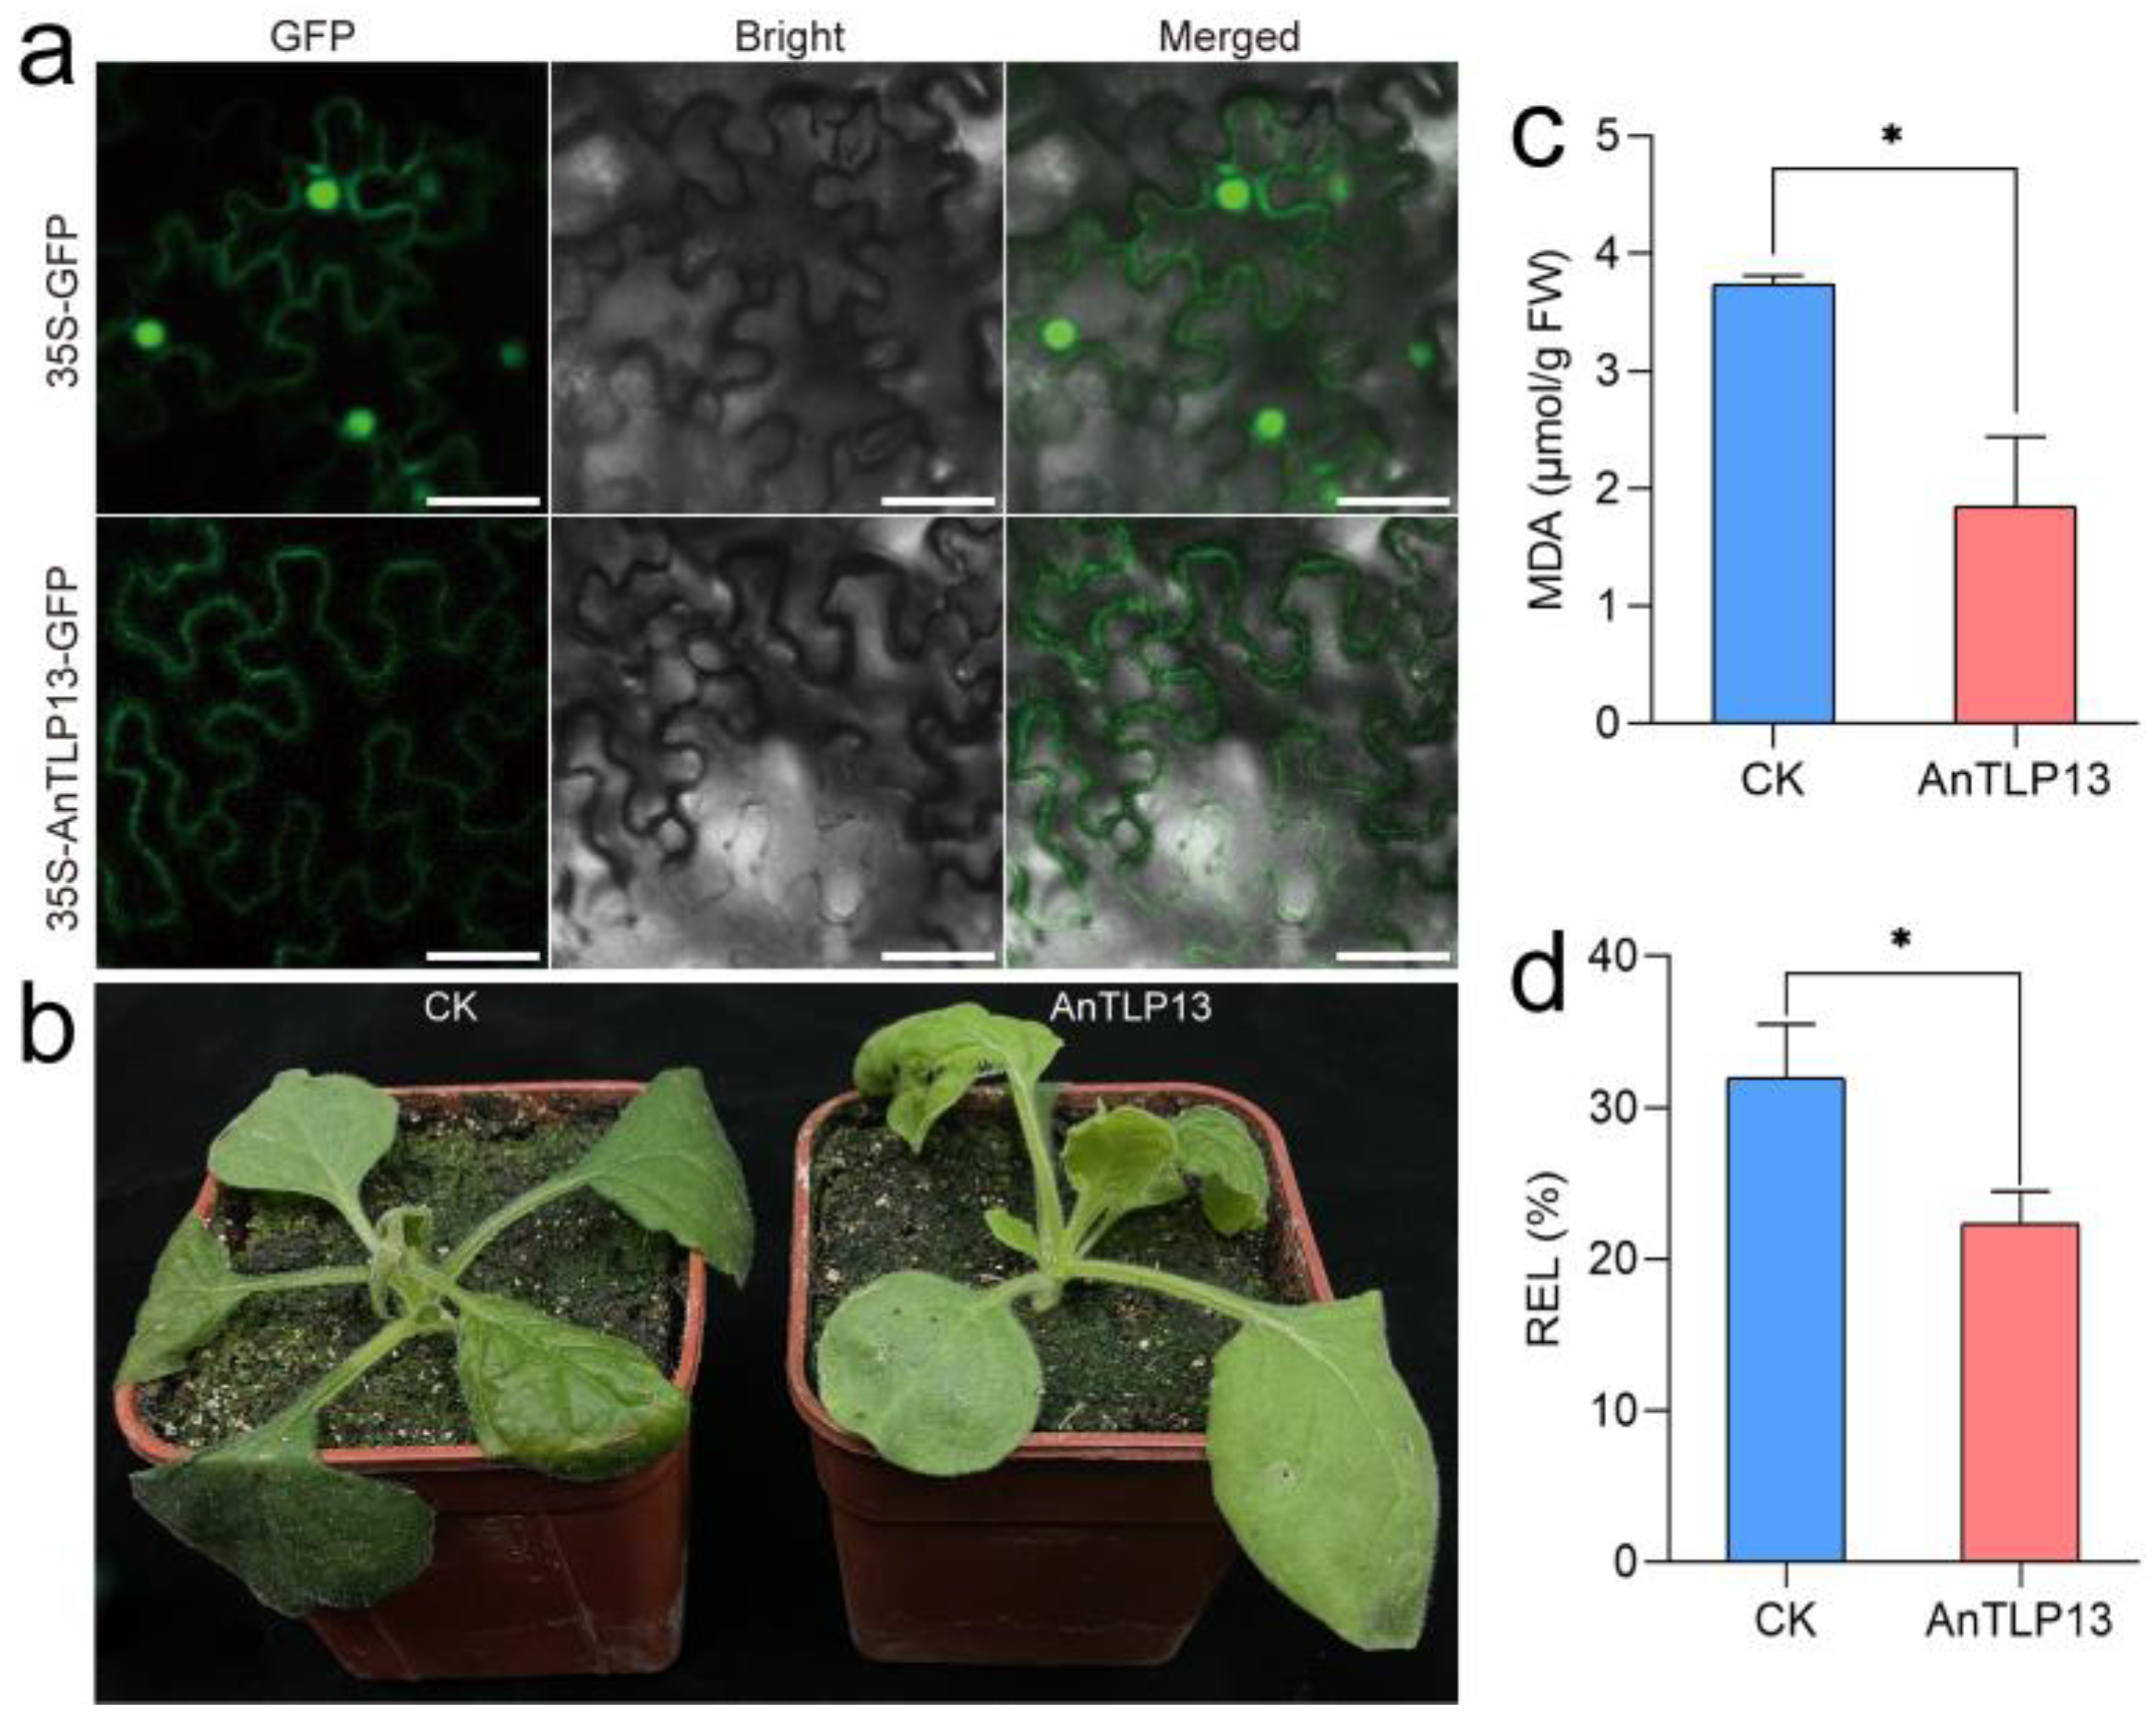
Tobacco transient transformation assay was used to evaluate the protective effect of AnTLP13 on tobacco cells under freezing stress. The tobacco transformed with pCAMBIA1300 empty plasmid was recorded as the CK group, and the tobacco transformed with AnTLP13 was recorded as the AnTLP13 group. Subcellular localization analysis showed that AnTLP13 protein was localized in the apoplast of plant cells (Figure 11a). After tobacco was cultured at −4 °C for 12 h, tobacco seedlings in CK and AnTLP13 groups wilted, but the wilting degree of plants in the AnTLP13 group was relatively low (Figure 11b). MDA and REL are important indicators to evaluate the damage to cell membranes caused by stress conditions, and the MDA content and REL values in the AnTLP13 group were significantly lower than those in the CK group (Figure 11c,d). These data indicate that the expression of the AnTLP13 gene enhanced the tolerance of tobacco seedlings to freezing stress.

3. Discussion

A. nanus is a rare evergreen broad-leaved shrub found in the desert area of Central Asia, and this shrub has higher tolerance to environmental stress, including low-temperature and drought stress. The stress-related genes in the A. nanus genome were considered to contribute to its extremely high level of tolerance to abiotic stress. TLPs are a class of pathogenesis-related proteins, and most TLPs are predicted to be localized into apoplast, where most PR proteins exist. TLPs have been shown to be involved in plant defense by acting as antifungal proteins [1,2,4], and recent evidence has suggested that TLPs might also be involved in abiotic stress response and tolerance in plant. Previous studies have indicated that apoplast proteins such as chitinases might be involved in the response to low-temperature and drought stress in A. nanus [24]. In the present study, we performed a systematically identification of the TLP family in A. nanus, investigated the structure, evolution, and expression profiles of AnTLPs, and analyzed their biological function in abiotic stress response.
At present, TLP genes have been systematically identified in many species, but the number of TLP genes in different plant species is different. There are more TLP genes in Populus trichocarpa [25] and Zea mays [26], with 55 and 49 TLP family genes, respectively, while there are fewer TLP genes in Pinus monticola [27], with only 6 TLP genes. In the present study, 31 TLP genes were identified from the A. nanus genome. Using the same identification method, 32, 25, 49, 23, and 29 TLP genes were identified from V. vinifera, A. thaliana, M. truncatula, T. pratense, and L. albus. It is noteworthy that the number of TLP genes in M. truncatula were significantly higher than those of other plant species. Although M. truncatula, T. pratense, L. albus, and A. nanus are all leguminous plants, their TLP gene numbers were obviously different. It was speculated that the TLP gene family of M. truncatula might have undergone gene expansion.
The orthologous gene pairs between A. nanus and V. vinifera, A. thaliana, T. pratense, M. truncatula, and L. albus were identified in the present study (Figure 5c). In general, the closer the relation between two species is, the greater the number of orthologous gene pairs can be detected between them [28,29,30]. In this present study, the relation between L. albus and A. nanus was the closest, and the number of orthologous gene pairs between the two species was also the largest (21 pairs). However, only 13 orthologous TLP gene were detected between A. nanus and T. pratense, which was far less than that of other legumes. This result indicated that, in addition to the genetic relationship among species, other factors also affect the number of orthologous gene pairs of the same gene family among different plant species. The above analysis showed that there were only 23 TLP genes in the genome of T. pratense, and the number was significantly less than that of other legumes, indicating that the TLP gene family may shrink in T. pratense. This explains why there were fewer orthologous genes between TLPs in A. nanus and T. pratense.
The evolutionary history of the TLP gene family members of A. nanus were reconstructed in the present study based on the collinearity analysis of the TLP gene families of A. nanus and other related five plant species (Figure 5c). There were 21 orthologous genes of AnTLP in the genome of the common ancestor species of V. vinifera and A. thaliana, three of which might be lost in the process of evolution to A. thaliana. The orthologous genes of AnTLP5 were lost before the speciation of V. vinifera. The orthologous gene of AnTLP7 was formed by means of segmental duplication, when the common ancestor species of V. vinifera and A. thaliana diverged into the common ancestor species of A. nanus, M. truncatula, T. pratense, and L. albus. The orthologous gene of AnTLP7 was lost when the common ancestor species of A. nanus, M. truncatula, T. pratense, and L. albus diverged into L. albus; AnTLP24 and AnTLP28 were lost when diverged into M. truncatula, and nine orthologous genes of AnTLP were lost when diverged into T. pratense. Nine AnTLP were formed by means of segmental duplication, when the common ancestor species of A. nanus, M. truncatula, T. pratense, and L. albus diverged into A. nanus. It is worth noting that seven of these nine genes are formed by tandem duplication.
Gene duplication is considered to be one of the main driving forces of genome evolution. Segmental duplication, tandem duplication, and transposition events are the three main modes of gene expansion. Among these modes, fragment duplication and tandem duplication are considered to be the two main drivers of gene family expansion in plants [31]. In the TLP gene family of A. nanus, there were 16 segmental duplication genes and 8 tandem duplication genes. Therefore, the TLP gene family of A. nanus was mainly formed by segmental duplication. It is worth noting that seven tandem repeat genes are located on chromosome 3, and five tandem repeat genes are closely arranged. According to the evolutionary relationship of AnTLPs reconstructed in this study, AnTLP12 may appear in the ancestral species of A. thaliana and grape, while AnTLP13, AnTLP14, AnTLP15, and AnTLP16 may be generated by gene duplication during differentiation into A. nanus. It is speculated that AnTLP13, AnTLP14, AnTLP15, and AnTLP16 may be formed by tandem duplication of AnTLP12. Therefore, the similarities and differences of these five AnTLPs in structure and function may have research value.
Ka/Ks value can be used to reflect the evolutionary direction of genes in environmental selection. A Ka/Ks value greater than 1 indicates that the gene is positive selection, Ka/Ks less than 1 indicates that the gene is purifying selection, and Ka/Ks equal to 1 indicates that the gene evolution is not affected by environmental pressure [32,33,34]. The Ka/Ks of all duplicated TLP genes in this study were less than 1, which means that all duplicated genes have undergone purifying selection in the environment. The Ka/Ks values of A. nanus duplicated genes were between 0.093 and 0.422, and the Ka/Ks values of some duplicated genes were higher, indicating that these genes were under strong environmental selection pressure. Codon usage bias can reflect the type of pressure on gene evolution [35,36]. In the present study, most of the points in the association map of ENC and GC3s were distributed near the standard curve, indicating that the evolution of TLP genes in A. nanus was affected by environmental selection pressure. We also noticed that there was a certain correlation between GC12 and GC3s of the TLP gene family, indicating that the evolution of the TLP gene in A. nanus was also affected by mutation pressure.
The cis-acting elements in the promoter region play important roles in the regulation of gene expression [37,38,39]. There was a large number of cis-acting elements related to plant response to abiotic stress signal predicted from promoters of AnTLPs, and these cis-acting elements included ABRE, LTR, and MBS. There were cis-acting elements related to low-temperature stress response in the promoter region of 17 AnTLP genes, such as AnTLP12 and AnTLP13. There were cis-acting elements associated with drought stress response in the promoter region of 15 AnTLP genes, such as AnTLP10 and AnTLP28. Analysis of transcriptome data showed that AnTLP12 and AnTLP13 were significantly up-regulated under low-temperature stress, which was in line with the results of cis-acting elements prediction of AnTLP12 and AnTLP13. AnTLP13 was transformed into E. coli, yeast, and tobacco to investigate the biological function of AnTLP13 in low-temperature stress tolerance. Compared with the control, E. coli and yeast overexpressing AnTLP13 gene showed stronger tolerance to low temperature. When the AnTLP13 gene was transiently expressed in tobacco leaves, the transgenic tobacco had stronger freezing tolerance than the control. These results demonstrated that AnTLP genes such as AnTLP13 probably contribute to the high tolerance to low temperature in A. nanus. Indeed, TLP from other plant species has been proved to be involved in low-temperature adaptation. For example, overexpression of the wheat TaTLP2 gene in yeast can alleviate the damage of yeast in cold, heat, osmotic, and salt stress [9].

4. Materials and Methods

4.1. Identification of the TLP Proteins in A. nanus

The genomic sequences and annotation information of A. nanus were downloaded from GigaScience Database (http://gigadb.org/, accessed on 16 August 2021, accession number 100466) [40,41]. The genomes of A. thaliana, V. vinifera, M. truncatula, T. pratense, and L. albus were downloaded from the Phytozome 13 database (https://phytozome-next.jgi.doe.gov/, accessed on 16 August 2021, Phytozome genome ID: 167, 457, 385, and 567). HMMER3 software was used to identify the TLP family members in A. nanus [42], based on the TLP domain model (PF01167) in the Pfam database. All candidate sequences were manually checked using the HMMER web server (https://www.ebi.ac.uk/Tools/hmmer/, accessed on 16 August 2021). The physicochemical properties of TLP were predicted using the ProtParam tool (http://web.expasy.org/protparam/, accessed on 30 August 2021) [43]. Subcellular localization predictions were conducted using the WoLF PSORT tool (http://www.genscript.com/psort/wolf_psort.html, accessed on 30 August 2021) [44].

4.2. Chromosomal Location and Gene Structure Analysis of A. nanus TLP Family Genes

Based on annotation information from the A. nanus genome, the location of AnTLP on chromosomes and the exon–intron distribution of AnTLP were visualized using TBtools software [45]. MEME (Multiple Expectation Maximization for Motif Elicitation) (http://meme-suite.org/, accessed on 30 August 2021) [46] was used to identify the conserved motif with a minimum width of 6, a maximum width of 50, a motif number of 20, and E-value < 0.05.

4.3. Multiple Sequence Alignment and Phylogenetic Analysis

Multiple sequence alignment was performed using the MUCSLE algorithm [47]. The phylogenetic tree was constructed using the MEGA X [48], and bootstrap analysis was conducted using 1000 replicates. The synteny analyses of AnTLP were performed using the MCScanx tools [49]. The phylogenetic tree was embellished using Evolview (https://www.evolgenius.info/evolview/, accessed on 30 August 2021) [50]. The synonymous substitution rate (Ks), nonsynonymous substitution rate (Ka), and Ka/Ks ratio between homologous gene pairs were calculated using KaKs_Calculator 2.0 [51]. The time of divergence between the two species was queried through the TIMETREE website (http://www.timetree.org/, accessed on 30 August 2021) [52]. The duplication time of homologous genes within the A. nanus gene family was calculated using the formula T = Ks/2λ. Codon bias analysis of the TLP gene family was performed using CodonW software.

4.4. Prediction of Cis-Acting Elements in Promoter Regions of TLP Genes

PlantCARE database(https://bioinformatics.psb.ugent.be/webtools/plantcare/html/, accessed on 26 January 2022) [53] was used to predict the cis-acting elements in the 2000 bp promoter region upstream of each TLP gene’s start codon, and the results were visualized using TBtools software [45].

4.5. Gene Expression Analysis Based on the Transcriptome Data

A total of 12 transcriptomic datasets of A. nanus were downloaded from the SRA database with accession numbers SRR11089024–SRR11089029 and SRR11087599–SRR11087604, which contained transcriptome data from the control group, osmotic treatment group (20% PEG-6000 solution for 7 days), cold-stress treatment group (4 °C for 7 days), and A. nanus leaves in spring and winter, respectively. The gene expression level of each gene was calculated using the Kallisto quant [54].

4.6. Plant Materials and Stress Treatment

The seeds of A. nanus were collected from Wuqia county, Xinjiang autonomous district, China. The seed germination and planting conditions of A. nanus were based on a previous study [55]. Osmotic and cold-stress treatments were performed with reference to a previous study [24]. In brief, seedlings of A. nanus were randomly divided into 9 groups, and one group grew at normal conditions and was used as the control group. The four osmotic stress treatment groups were irrigated with 20% PEG-6000 for 3 h, 6 h, 12 h, and 24 h. The other four groups were transferred to a 4 °C incubator for cold-stress treatment for 3 h, 6 h, 12 h, or 24 h. Leaf samples from the control groups and the treatments group were collected and snap-frozen in liquid nitrogen, then the samples were stored at −80 °C until RNA extraction.

4.7. RNA Extraction and Quantitative Real-Time PCR (qRT-PCR) Analysis

Total RNA was extracted from the leaves of A. nanus using the Trizol reagent following the manufacturer’s directions (Invitrogen, Carlsbad, CA, USA), and reverse transcription was conducted using a FastQuant RT Kit (with gDNase) (TIANGEN, Beijing, China). The qRT-PCR analysis was performed according to the methods described previously [56], and the eukaryotic translation initiation factor 1 (eIF1) gene was used as the internal control. The primers used for qRT-PCR are listed in Supplementary Table S3. Three biological replicates were used for each group, and three technical replicates of each biological replicate were analyzed. The relative expression of the genes was calculated using the 2−ΔΔCt method [57].

4.8. Vector Construction and Expression in E. coli

The AnTLP13 was expressed in E. coli by reference to the previous method [58]. The vector used in the experiment was pET-28a(+), the enzyme digestion sites were BamHI and HindIII, and the competent cell was E. coli BL21(DE3). The normal growth temperature of E. coli is 37 °C, and the temperature was lowered to 28 °C to simulate cold-stress treatment. When the E. coli was cultured under cold stress, the OD600 value of the medium was recorded every 1 h. When E. coli was in the logarithmic phase, the culture medium was transferred to a −20 refrigerator for freezing treatment. E. coli was frozen at −20 °C for 1 h and then thawed at room temperature, and the treatment was repeated three times. Finally, the survival rate of E. coli after freezing treatment was calculated by colony forming unit (CFU) on LB solid medium. Three independent biological replicates were performed.

4.9. Vector Construction and Expression in Yeast

The AnTLP13 gene was expressed in yeast according to a previous method [59]. AnTLP13 gene was inserted into the pYES2 vector by the restriction sites of HindⅢ and BamHI, and then the recombinant plasmid was transferred into the INVScl yeast strain. When the yeast was in the logarithmic phase, the culture medium was transferred to −20 refrigerator for freezing treatment. Yeast was frozen at −20 °C for 1 h and then thawed at room temperature, and the treatment was repeated three times. Finally, the effect of AnTLP13 on yeast freezing tolerance was analyzed by comparing the number of colonies on SD-Ura solid medium.

4.10. Transient Transformation of AnTLP13 in Tobacco

Seeds of Nicotiana benthamiana were sown in peat soil and vermiculite matrix at a fully mixed volume ratio of 1:1. The seedlings were cultured in a greenhouse at 25 °C, with a light intensity of 400 μmol·m−2·s−1 and a photoperiod of 16/8 h (light/dark). Six seedlings with similar growth status were selected and divided into two groups. The AnTLP13 was transiently expressed in tobacco by reference to the previous method [60]. The vector used in the experiment was pCAMBIA1305, the enzyme digestion sites were XbaI and BamHI, and the competent cell was Agrobacterium tumefaciens GV3101. One group of tobacco plants was transformed transiently with pCAMBIA1305 empty vector, and the other group of plants was transformed transiently with pCAMBIA1305 vector ligated with AnTLP13. All tobacco plants were transferred to a −4 °C plant incubator for cold-stress treatment for 12 h. After freezing-stress treatment, the growth state of tobacco was observed. MDA and REL were measured according to a previously described method [61]. Three biological replicates were executed in the transient expression experiments. The subcellular locations of the AnTLP13 were imaged using an OLYMPUS Inverted Fluorescence Microscope IX81.

4.11. Statistical Analysis

Determination of the physiological indexes was performed in six replicates. All data were calculated using Microsoft Excel 2019 for mean and standard deviation. Analysis of variance (Duncan’s) was performed using R software, and ‘*’ and ‘**’ indicated p < 0.05 and p < 0.01, respectively.

Supplementary Materials

The following supporting information can be downloaded at: https://www.mdpi.com/article/10.3390/ijms24032209/s1.

Author Contributions

Conceptualization, Y.Z. and F.G.; formal analysis, Q.L., X.S., Y.W. and F.G.; funding acquisition, Y.Z.; investigation, Q.L., X.S., Y.W., M.Z. and F.G.; project administration, Y.Z.; writing—original draft, Q.L., Y.W. and F.G.; writing—review and editing, F.G. All authors have read and agreed to the published version of the manuscript.

Funding

This research was funded by the National Natural Science Foundation of China, grant number 31770363 and 31670335, and Beijing Advanced Discipline for Mass Spectrometry Imaging and Metabolomics (No. 104-01900403).

Institutional Review Board Statement

Not applicable.

Informed Consent Statement

Not applicable.

Data Availability Statement

No new data were created or analyzed in this study. Data sharing is not applicable to this article.

Conflicts of Interest

The authors declare no conflict of interest.

References

  1. Sun, W.; Zhou, Y.; Movahedi, A.; Wei, H.; Zhuge, Q. Thaumatin-like protein (Pe-TLP) acts as a positive factor in transgenic poplars enhanced resistance to spots disease. Physiol. Mol. Plant Pathol. 2020, 112, 101512. [Google Scholar] [CrossRef]
  2. Liu, J.J.; Sturrock, R.; Ekramoddoullah, A.K. The superfamily of thaumatin-like proteins: Its origin, evolution, and expression towards biological function. Plant Cell Rep. 2010, 29, 419–436. [Google Scholar] [CrossRef]
  3. Brandazza, A.; Angeli, S.; Tegoni, M.; Cambillau, C.; Pelosi, P. Plant stress proteins of the thaumatin-like family discovered in animals. FEBS Lett. 2004, 572, 3–7. [Google Scholar] [CrossRef]
  4. Li, Z.; Wang, X.; Cui, Y.; Qiao, K.; Zhu, L.; Fan, S.; Ma, Q. Comprehensive genome-wide analysis of thaumatin-like gene family in four cotton species and functional identification of GhTLP19 involved in regulating tolerance to verticillium dahlia and drought. Front. Plant Sci. 2020, 11, 575015. [Google Scholar] [CrossRef]
  5. Iqbal, I.; Tripathi, R.K.; Wilkins, O.; Singh, J. Thaumatin-like protein (TLP) gene family in barley: Genome-wide exploration and expression analysis during germination. Genes 2020, 11, 1080. [Google Scholar] [CrossRef]
  6. Liu, Y.; Cui, J.; Zhou, X.; Luan, Y.; Luan, F. Genome-wide identification, characterization and expression analysis of the TLP gene family in melon (Cucumis melo L.). Genomics 2020, 112, 2499–2509. [Google Scholar] [CrossRef]
  7. Ram, C.; Danish, S.; Kesawat, M.S.; Panwar, B.S.; Verma, M.; Arya, L.; Yadav, S.; Sharma, V. Genome-wide comprehensive characterization and expression analysis of TLP gene family revealed its responses to hormonal and abiotic stresses in watermelon (Citrullus lanatus). Gene 2022, 844, 146818. [Google Scholar] [CrossRef]
  8. Yan, X.; Qiao, H.; Zhang, X.; Guo, C.; Wang, M.; Wang, Y.; Wang, X. Analysis of the grape (Vitis vinifera L.) thaumatin-like protein (TLP) gene family and demonstration that TLP29 contributes to disease resistance. Sci. Rep. 2017, 7, 4269. [Google Scholar] [CrossRef] [Green Version]
  9. Sharma, A.; Sharma, H.; Rajput, R.; Pandey, A.; Upadhyay, S.K. Molecular characterization revealed the role of thaumatin-like proteins of bread wheat in stress response. Front. Plant Sci. 2021, 12, 807448. [Google Scholar] [CrossRef]
  10. de Jesús-Pires, C.; Ferreira-Neto, J.R.C.; Pacifico Bezerra-Neto, J.; Kido, E.A.; de Oliveira Silva, R.L.; Pandolfi, V.; Wanderley-Nogueira, A.C.; Binneck, E.; da Costa, A.F.; Pio-Ribeiro, G.; et al. Plant thaumatin-like proteins: Function, evolution and biotechnological applications. Curr. Protein Pept. Sci. 2020, 21, 36–51. [Google Scholar] [CrossRef]
  11. Kalpana, K.; Maruthasalam, S.; Rajesh, T.; Poovannan, K.; Kumar, K.K.; Kokiladevi, E.; Raja, J.A.J.; Sudhakar, D.; Velazhahan, R.; Samiyappan, R.; et al. Engineering sheath blight resistance in elite indica rice cultivars using genes encoding defense proteins. Plant Sci. 2006, 170, 203–215. [Google Scholar] [CrossRef]
  12. Jiao, W.; Li, X.; Zhao, H.; Cao, J.; Jiang, W. Antifungal activity of an abundant thaumatin-like protein from banana against Penicillium expansum, and its possible mechanisms of action. Molecules 2018, 23, 1442. [Google Scholar] [CrossRef] [Green Version]
  13. Singh, N.K.; Kumar, K.R.; Kumar, D.; Shukla, P.; Kirti, P.B. Characterization of a pathogen induced thaumatin-like protein gene AdTLP from Arachis diogoi, a wild peanut. PLoS ONE 2013, 8, e83963. [Google Scholar] [CrossRef]
  14. Zhu, J.K. Abiotic Stress Signaling and Responses in Plants. Cell 2016, 167, 313–324. [Google Scholar] [CrossRef] [Green Version]
  15. Zhang, H.; Zhu, J.; Gong, Z.; Zhu, J.K. Abiotic stress responses in plants. Nat. Rev. Genet. 2022, 23, 104–119. [Google Scholar] [CrossRef]
  16. Hwarari, D.; Guan, Y.; Ahmad, B.; Movahedi, A.; Min, T.; Hao, Z.; Lu, Y.; Chen, J.; Yang, L. ICE-CBF-COR signaling cascade and its regulation in plants responding to cold stress. Int. J. Mol. Sci. 2022, 23, 1549. [Google Scholar] [CrossRef]
  17. Mukarram, M.; Choudhary, S.; Kurjak, D.; Petek, A.; Khan, M.M.A. Drought: Sensing, signalling, effects and tolerance in higher plants. Physiol. Plant 2021, 172, 1291–1300. [Google Scholar] [CrossRef]
  18. Nguyen, H.C.; Lin, K.H.; Ho, S.L.; Chiang, C.M.; Yang, C.M. Enhancing the abiotic stress tolerance of plants: From chemical treatment to biotechnological approaches. Physiol. Plant 2018, 164, 452–466. [Google Scholar] [CrossRef]
  19. Jacob, P.; Hirt, H.; Bendahmane, A. The heat-shock protein/chaperone network and multiple stress resistance. Plant Biotechnol. J. 2017, 15, 405–414. [Google Scholar] [CrossRef] [Green Version]
  20. Yu, H.Q.; Yong, T.M.; Li, H.J.; Liu, Y.P.; Zhou, S.F.; Fu, F.L.; Li, W.C. Overexpression of a phospholipase Dalpha gene from Ammopiptanthus nanus enhances salt tolerance of phospholipase Dalpha1-deficient Arabidopsis mutant. Planta 2015, 242, 1495–1509. [Google Scholar] [CrossRef]
  21. Ding, L.; Guo, X.; Wang, K.; Pang, H.; Liu, Y.; Yang, Q.; Fu, F.; Li, W.; Yu, H. Genome-wide analysis of BES1/BZR1 transcription factors and their responses to osmotic stress in Ammopiptanthus nanus. J. For. Res. 2020, 26, 127–135. [Google Scholar] [CrossRef]
  22. Liu, Y.; Zhang, L.; Meng, S.; Liu, Y.; Zhao, X.; Pang, C.; Zhang, H.; Xu, T.; He, Y.; Qi, M.; et al. Expression of galactinol synthase from Ammopiptanthus nanus in tomato improves tolerance to cold stress. J. Exp. Bot. 2020, 71, 435–449. [Google Scholar] [CrossRef]
  23. Yu, H.Q.; Han, N.; Zhang, Y.Y.; Tao, Y.; Chen, L.; Liu, Y.P.; Zhou, S.F.; Fu, F.L.; Li, W.C. Cloning and characterization of vacuolar H+-pyrophosphatase gene (AnVP1) from Ammopiptanthus nanus and its heterologous expression enhances osmotic tolerance in yeast and Arabidopsis thaliana. Plant Growth Regul. 2017, 81, 385–397. [Google Scholar] [CrossRef]
  24. Cao, S.; Wang, Y.; Li, Z.; Shi, W.; Gao, F.; Zhou, Y.; Zhang, G.; Feng, J. Genome-wide identification and expression analyses of the chitinases under cold and osmotic stress in Ammopiptanthus nanus. Genes 2019, 10, 472. [Google Scholar] [CrossRef] [Green Version]
  25. Zhao, J.P.; Su, X.H. Patterns of molecular evolution and predicted function in thaumatin-like proteins of Populus trichocarpa. Planta 2010, 232, 949–962. [Google Scholar] [CrossRef]
  26. Cao, J.; Yueqing, L.; Hou, Z.; Li, X.; Ding, L. Expansion and evolution of thaumatin-like protein (TLP) gene family in six plants. Plant Growth Regul. 2016, 79, 299–307. [Google Scholar] [CrossRef]
  27. Liu, J.J.; Zamani, A.; Ekramoddoullah, A.K. Expression profiling of a complex thaumatin-like protein family in western white pine. Planta 2010, 231, 637–651. [Google Scholar] [CrossRef]
  28. Emms, D.M.; Kelly, S. SHOOT: Phylogenetic gene search and ortholog inference. Genome Biol. 2022, 23, 1–13. [Google Scholar] [CrossRef]
  29. Koonin, E.V. Orthologs, paralogs, and evolutionary genomics. Annu. Rev. Genet. 2005, 39, 309–338. [Google Scholar] [CrossRef] [Green Version]
  30. Pimpat, Y.; Saralamba, N.; Boonyuen, U.; Pukrittayakamee, S.; Nosten, F.; Smithuis, F.; Day, N.P.J.; Dondorp, A.M.; Imwong, M. Genetic analysis of the orthologous CRT and MDR1 genes in Plasmodium malariae from Thailand and Myanmar. Malar J. 2020, 19, 315. [Google Scholar] [CrossRef]
  31. Magadum, S.; Banerjee, U.; Murugan, P.; Gangapur, D.; Ravikesavan, R. Gene duplication as a major force in evolution. J. Genet. 2013, 92, 155–1561. [Google Scholar] [CrossRef]
  32. Hurst, L.D. The Ka/Ks ratio: Diagnosing the form of sequence evolution. Trends Genet. 2002, 18, 486. [Google Scholar] [CrossRef] [PubMed]
  33. Fan, S.; Elmer, K.R.; Meyer, A. Genomics of adaptation and speciation in cichlid fishes: Recent advances and analyses in African and Neotropical lineages. Philos. Trans. R. Soc. Lond. B Biol. Sci. 2012, 367, 385–394. [Google Scholar] [CrossRef] [PubMed] [Green Version]
  34. Khan, N.; You, F.M.; Datla, R.; Ravichandran, S.; Jia, B.; Cloutier, S. Genome-wide identification of ATP binding cassette (ABC) transporter and heavy metal associated (HMA) gene families in flax (Linum usitatissimum L.). BMC Genom. 2020, 21, 722. [Google Scholar] [CrossRef]
  35. Parvathy, S.T.; Udayasuriyan, V.; Bhadana, V. Codon usage bias. Mol. Biol. Rep. 2022, 49, 539–565. [Google Scholar] [CrossRef] [PubMed]
  36. Iriarte, A.; Lamolle, G.; Musto, H. Codon Usage Bias: An endless tale. J. Mol. Evol. 2021, 89, 589–593. [Google Scholar] [CrossRef] [PubMed]
  37. Himani, S.; Sonia, S.; Sneh, N.; Rekha, M.; Indu, S.; Ravish, C. Computational analysis of cis-acting regulatory elements in 5’ regulatory regions of sucrose transporter gene families in wheat and Arabidopsis. J. Biotechnol. 2014, 9, 75–81. [Google Scholar]
  38. Chow, C.-N.; Chiang-Hsieh, Y.-F.; Chien, C.-H.; Zheng, H.-Q.; Lee, T.-Y.; Wu, N.-Y.; Tseng, K.-C.; Hou, P.-F.; Chang, W.-C. Delineation of condition specific cis-and trans-acting elements in plant promoters under various endo-and exogenous stimuli. BMC Genom. 2018, 19, 109–121. [Google Scholar] [CrossRef] [Green Version]
  39. Kakei, Y.; Ogo, Y.; Itai, R.N.; Kobayashi, T.; Yamakawa, T.; Nakanishi, H.; Nishizawa, N.K. Development of a novel prediction method of cis-elements to hypothesize collaborative functions of cis-element pairs in iron-deficient rice. Rice 2013, 6, 1–14. [Google Scholar] [CrossRef] [Green Version]
  40. Gao, F.; Li, H.; Xiao, Z.; Wei, C.; Feng, J.; Zhou, Y.J.T. De novo transcriptome analysis of Ammopiptanthus nanus and its comparative analysis with A. mongolicus. Trees 2018, 32, 287–300. [Google Scholar] [CrossRef]
  41. Gao, F.; Wang, X.; Li, X.; Xu, M.; Li, H.; Abla, M.; Sun, H.; Wei, S.; Feng, J.; Zhou, Y.J.G. Long-read sequencing and de novo genome assembly of Ammopiptanthus nanus, a desert shrub. GigaScience 2018, 7, giy074. [Google Scholar] [CrossRef] [PubMed]
  42. Eddy, S.R. Accelerated Profile HMM Searches. PLoS Comput. Biol. 2011, 7, e1002195. [Google Scholar] [CrossRef] [PubMed] [Green Version]
  43. Artimo, P.; Jonnalagedda, M.; Arnold, K.; Baratin, D.; Csardi, G.; de Castro, E.; Duvaud, S.; Flegel, V.; Fortier, A.; Gasteiger, E.; et al. ExPASy: SIB bioinformatics resource portal. Nucleic Acids Res. 2012, 40, 597–603. [Google Scholar] [CrossRef]
  44. Horton, P.; Park, K.J.; Obayashi, T.; Fujita, N.; Harada, H.; Adams-Collier, C.J.; Nakai, K. WoLF PSORT: Protein localization predictor. Nucleic Acids Res. 2007, 35, 585–587. [Google Scholar] [CrossRef] [PubMed] [Green Version]
  45. Chen, C.; Chen, H.; Zhang, Y.; Thomas, H.R.; Frank, M.H.; He, Y.; Xia, R. TBtools: An integrative toolkit developed for interactive analyses of big biological data. Mol. Plant 2020, 13, 1194–1202. [Google Scholar] [CrossRef]
  46. Bailey, T.L.; Boden, M.; Buske, F.A.; Frith, M.; Grant, C.E.; Clementi, L.; Ren, J.; Li, W.W.; Noble, W.S. MEME SUITE: Tools for motif discovery and searching. Nucleic Acids Res. 2009, 37, 202–208. [Google Scholar] [CrossRef]
  47. Edgar, R.C. MUSCLE: Multiple sequence alignment with high accuracy and high throughput. Nucleic Acids Res. 2004, 32, 1792–1797. [Google Scholar] [CrossRef] [Green Version]
  48. Kumar, S.; Stecher, G.; Li, M.; Knyaz, C.; Tamura, K. MEGA X: Molecular evolutionary genetics analysis across computing platforms. Mol. Biol. Evol. 2018, 35, 1547. [Google Scholar] [CrossRef]
  49. Wang, Y.; Tang, H.; Debarry, J.D.; Tan, X.; Li, J.; Wang, X.; Lee, T.H.; Jin, H.; Marler, B.; Guo, H.; et al. MCScanX: A toolkit for detection and evolutionary analysis of gene synteny and collinearity. Nucleic Acids Res. 2012, 40, e49. [Google Scholar] [CrossRef] [Green Version]
  50. Letunic, I.; Bork, P. Interactive Tree of Life (iTOL) v5: An online tool for phylogenetic tree display and annotation. Nucleic Acids Res. 2021, 49, 293–296. [Google Scholar] [CrossRef]
  51. Wang, D.; Zhang, Y.; Zhang, Z.; Zhu, J.; Yu, J. KaKs_Calculator 2.0: A toolkit incorporating gamma-series methods and sliding window strategies. Genom. Proteom. Bioinf. 2010, 8, 77–80. [Google Scholar] [CrossRef]
  52. Kumar, S.; Stecher, G.; Suleski, M.; Hedges, S.B. TimeTree: A resource for timelines, timetrees, and divergence times. Mol. Biol. Evol. 2017, 34, 1812–1819. [Google Scholar] [CrossRef]
  53. Lescot, M.; Dehais, P.; Thijs, G.; Marchal, K.; Moreau, Y.; Van de Peer, Y.; Rouze, P.; Rombauts, S. PlantCARE, a database of plant cis-acting regulatory elements and a portal to tools for in silico analysis of promoter sequences. Nucleic Acids Res. 2002, 30, 325–327. [Google Scholar] [CrossRef]
  54. Bray, N.L.; Pimentel, H.; Melsted, P.; Pachter, L. Near-optimal probabilistic RNA-seq quantification. Nat. Biotechnol. 2016, 34, 525–527. [Google Scholar] [CrossRef]
  55. Wang, Y.; Cao, S.; Sui, X.; Wang, J.; Geng, Y.; Gao, F.; Zhou, Y. Genome-wide characterization, evolution, and expression analysis of the ascorbate peroxidase and glutathione peroxidase gene families in response to cold and osmotic stress in Ammopiptanthus nanus. J. Plant Growth Regul. 2023, 42, 502–522. [Google Scholar] [CrossRef]
  56. Abla, M.; Sun, H.; Li, Z.; Wei, C.; Gao, F.; Zhou, Y.; Feng, J. Identification of miRNAs and their response to cold stress in Astragalus Membranaceus. Biomolecules 2019, 9, 182. [Google Scholar] [CrossRef] [Green Version]
  57. Livak, K.; Schmittgen, T. Analysis of relative gene expression data using real-time quantitative PCR and the 2−ΔΔCT method. Methods 2000, 25, 402–408. [Google Scholar] [CrossRef]
  58. Dhanyalakshmi, K.H.; Nataraja, K.N. Universal stress protein-like gene from mulberry enhances abiotic stress tolerance in Escherichia coli and transgenic tobacco cells. Plant Biol. 2021, 23, 1190–1194. [Google Scholar] [CrossRef]
  59. Yin, J.; Sun, L.; Li, Y.; Xiao, J.; Wang, S.; Yang, J.; Qu, Z.; Zhan, Y. Functional identification of BpMYB21 and BpMYB61 transcription factors responding to MeJA and SA in birch triterpenoid synthesis. BMC Plant Biol. 2020, 20, 374. [Google Scholar] [CrossRef]
  60. Wydro, M.; Kozubek, E.; Lehmann, P. Optimization of transient Agrobacterium-mediated gene expression system in leaves of Nicotiana benthamiana. Acta Biochim. Pol. 2006, 53, 289–298. [Google Scholar] [CrossRef]
  61. Zheng, L.; Wu, W.; Chen, Q.; Zhang, G.; Gao, F.; Zhou, Y. Integrated transcriptomics, proteomics, and metabolomics identified biological processes and metabolic pathways involved in heat stress response in jojoba. Ind. Crops Prod. 2022, 183, 114946. [Google Scholar] [CrossRef]
Figure 1. The distribution of AnTLP genes in the chromosomes of A. nanus. Different colors represented gene replication type. Blue represented fragment replication, and red represented tandem replication.
Ijms 24 02209 g001
Figure 2. Multiple sequence alignment of TLPs in A. nanus. Jalview software was used to visualize the results of multiple sequence alignment, and the color scheme was selected as ‘Clustal’. Conservative domain was used by box (iPR001938, red box; PS00316, blue box). The amino acids in the REDDD motif are highlighted in black letters. The conserved cysteines are highlighted in blue letters.
Ijms 24 02209 g002
Figure 3. Conserved motif and gene structure of TLP gene family in A. nanus. (a) The conserved motif analysis of the TLP family of A. nanus. All motifs were identified using the MEME database. The rectangular box represents the motif, and different colors represent different motifs. The lengths of the proteins and motifs can be estimated using the scale at the bottom. (b) The intro–exon structure of the TLP gene family. Black lines represent introns, yellow rectangles represent CDS, and green rectangles represent untranslated regions (UTRs). The size of exons and introns can be estimated using the scale at the bottom. (c) Motif sequence logo graph. The relative size of the letters represents their frequency in the sequence. The height of each letter is proportional to the frequency of occurrence of the corresponding base at that position.
Ijms 24 02209 g003
Figure 4. Predicted three-dimensional structures of AnTLPs. The three-dimensional structure prediction was performed in the SWISS-MODEL database. Multiple protein models were combined using PyMol software.
Ijms 24 02209 g004
Figure 5. Phylogenetics, gene duplication and divergence of AnTLP genes. (a) The phylogenetic tree of AnTLP family. Different colors represented different cluster. (b) The distribution of segmental duplication genes of AnTLP on the chromosome of A. nanus. (c) Homologous gene pairs between A. nanus and V. vinifera, A. thaliana, M. truncatula, T. pratense, and L. albus, respectively, and the red lines indicate AnTLPs. (d) Evolution of TLP gene family in A. nanus and five relative species. Black numbers represent the time of species differentiation, red numbers represent the number of orthologous genes of AnTLP lost or increased during evolution, and blue numbers represent the number of orthologous genes in AnTLP genes. The gene names represented by red and blue numbers are listed in Table S2. The pictures of A. nanus, V. vinifera, A. thaliana, M. truncatula, T. pratense, and L. albus were obtained from the Plant Photo Bank of China (PPBC).
Ijms 24 02209 g005
Figure 6. The correlation analysis of GC3, GC12, and ENC in A. nanus. (a) The correlation analysis of GC3 and GC12. (b) The correlation analysis of GC3 and ENC.
Ijms 24 02209 g006
Figure 7. Distribution of the predicted cis-acting elements that were involved in abiotic stress response and hormone response in the promoter region of the AnTLP genes in A. nanus. Different color blocks represent different types of cis-acting elements. The position of the cis-acting element in the promoter region can be estimated by the scale at the bottom.
Ijms 24 02209 g007
Figure 8. Expression pattern analysis of AnTLP genes based on transcriptome data.
Ijms 24 02209 g008
Figure 9. Expression patterns of AnTLP genes under cold and osmotic stress. (a) Analysis of temporal expression patterns of AnTLP genes under cold and osmotic stress; blue represents cold stress and red represents osmotic stress. The eIF1 gene was used as the internal control gene. The significance between the data of the cold-stress experimental group is marked with lowercase letters, and the significance between the data of the osmotic stress experimental group is marked with uppercase letters. There is no significant difference between the data sharing the same letters; conversely, there are significant differences between the data. (b) Trend analysis of AnTLP genes expression patterns under cold stress. (c) Trend analysis of AnTLP genes expression patterns under osmotic stress. The colored segment is a significantly enriched module. The number in the upper left corner of the module is the number of the module, and the number in the lower right corner represents the number of genes belonging to the module.
Ijms 24 02209 g009
Figure 10. Overexpression of the AnTLP13 gene enhanced the tolerance to low temperature in E. coli and yeast. (a) Gel electrophoresis of AnTLP13. M in the figure represents the protein marker, and 1 represents the CK group, 2–4 represent the AnTLP13 group. (b) Growth curves of E. coli under normal conditions (37 °C). (c) Growth curves of E. coli under low-temperature stress (28 °C). (d) Survival rate of E. coli under repeated freeze–thaw stress. * and ** indicate p < 0.05 and p < 0.01, respectively. (e) Overexpression of the AnTLP13 gene enhanced the tolerance to repeated freeze–thaw stress in yeast.
Ijms 24 02209 g010
Figure 11. Overexpression of the AnTLP13 gene enhanced the tolerance of tobacco seedlings to freezing stress. (a) Subcellular localization analysis of AnTLP13 during transient expression in tobacco. Bars = 50 μm. (b) Tobacco seedlings of CK and AnTLP13 group were transferred to −4 °C for freezing-stress treatment for 12 h. (c) The MDA content of tobacco leaves after freezing-stress treatment. (d) The values of electrolyte leakage (REL) of tobacco leaves after freezing-stress treatment. ‘*’ indicated p < 0.05.
Ijms 24 02209 g011
Table 1. Characterization of the predicted TLPs in A. nanus.
Sequence IDGene NameGenome LocationAmino Acid LengthMolecular Weight/kDTheoretical pIGRAVYSignal PeptideTMHsSubcellular Localization *
EVM0028587AnTLP1chr1: 84629737-8463081023725.367.430.1571-230extr
EVM0000288AnTLP2chr2: 3943782-394487124526.886.76−0.3711-250extr
EVM0012162AnTLP3chr2: 3949219-395029924126.335.33−0.0681-391extr
EVM0031681AnTLP4chr2: 11425283-1142817530431.344.450.0621-261chlo
EVM0023773AnTLP5chr2: 11445664-1144784931632.845.22−0.0751-281extr
EVM0003940AnTLP6chr2: 77169927-7717267831332.806.19−0.1471-350extr
EVM0027347AnTLP7chr2: 77240207-7724142019620.875.000.3431-231extr
EVM0011680AnTLP8chr2: 91149625-9115030721222.515.850.311-241golg
EVM0028885AnTLP9chr2: 97035730-9703728525027.019.250.0371-281extr
EVM0036902AnTLP10chr3: 3630861-363279527229.756.89−0.0591-361extr
EVM0012276AnTLP11chr3: 3636405-364079122524.818.57−0.145NO1extr
EVM0027709AnTLP12chr3: 60728536-6073071624225.544.78−0.1671-210extr
EVM0030154AnTLP13chr3: 60822641-6082472324225.624.78−0.2361-210extr
EVM0006019AnTLP14chr3: 60829095-6083074124026.044.97−0.1381-220extr
EVM0035676AnTLP15chr3: 60870728-6087224423225.084.92−0.074NO0extr
EVM0033132AnTLP16chr3: 60875649-6087759727029.524.7−0.25NO0chlo
EVM0026680AnTLP17chr3: 66587898-6658948822824.264.37−0.196NO0extr
EVM0006621AnTLP18chr4: 5755011-575657524926.137.380.1051-261extr
EVM0005233AnTLP19chr4: 62429388-6243287630031.555.39−0.168NO1extr
EVM0005658AnTLP20chr4: 81197773-8119913725727.417.17−0.0231-311chlo
EVM0036386AnTLP21chr4: 85077259-8507974134835.134.240.021-221extr
EVM0034723AnTLP22chr4: 85093701-8509707231533.528.750.1511-240extr
EVM0007971AnTLP23chr5: 8628389-863032824525.716.070.1641-220extr
EVM0028324AnTLP24chr5: 12202458-1220430630732.805.02−0.0061-252extr
EVM0001585AnTLP25chr5: 14996048-1499774528730.798.650.081-271plas
EVM0014534AnTLP26chr6: 3060387-306491824626.664.87−0.2431-210chlo
EVM0005703AnTLP27chr6: 4178850-418028424024.75.37−0.075NO0chlo
EVM0035081AnTLP28chr6: 19546129-1954781830933.299.02−0.0021-272extr
EVM0034418AnTLP29chr7: 75592532-7559572232534.154.820.0511-220extr
EVM0006518AnTLP30chr8: 57726394-5772798728831.306.29−0.1111-270extr
EVM0016538AnTLP31chr9: 56159846-5616229326428.235.48−0.059NO0extr
* extr: extracellular matrix, chlo: chloroplast, plas: plasm membrane, golg: golgi apparatus.
Table 2. Analysis of evolutionary selection pressure on the A. nanus TLP gene family.
Segment PairsKaKsKa/KsT(MYA)Selection Pressure
AnTLP1-AnTLP180.2032.1910.093534.39Purifying selection
AnTLP4-AnTLP220.3811.1700.325285.37Purifying selection
AnTLP5-AnTLP210.2741.8050.152440.24Purifying selection
AnTLP6-AnTLP210.2661.2020.221293.17Purifying selection
AnTLP6-AnTLP50.1520.7240.210176.59Purifying selection
AnTLP7-AnTLP220.4911.5210.323370.98Purifying selection
AnTLP7-AnTLP40.3250.8270.392201.71Purifying selection
AnTLP8-AnTLP20.4633.3220.139810.24Purifying selection
AnTLP23-AnTLP10.0580.4020.14498.05Purifying selection
AnTLP24-AnTLP280.1390.3310.42280.73Purifying selection
AnTLP26-AnTLP290.1870.8270.227201.71Purifying selection
AnTLP26-AnTLP40.2741.3130.209320.24Purifying selection
AnTLP29-AnTLP40.2902.9940.097730.24Purifying selection
Table 3. Analysis of the codon usage bias of the A. nanus TLP gene family.
Gene NameCAIFopENCGene NameCAIFopENC
AnTLP250.190.3750.35AnTLP90.240.4844.78
AnTLP240.210.3750.83AnTLP310.250.4253.03
AnTLP230.230.3852.40AnTLP200.300.5546.70
AnTLP300.190.3650.18AnTLP190.200.4455.75
AnTLP10.200.3048.39AnTLP210.200.4455.19
AnTLP280.170.3553.65AnTLP220.250.5056.81
AnTLP260.310.5557.45AnTLP180.180.3447.94
AnTLP270.290.5556.25AnTLP140.220.3549.64
AnTLP290.260.4660.52AnTLP100.240.3848.33
AnTLP30.290.5454.28AnTLP160.240.3957.74
AnTLP80.240.4761.00AnTLP110.220.4254.54
AnTLP60.230.4660.14AnTLP150.230.3748.21
AnTLP20.270.5256.00AnTLP120.270.4660.68
AnTLP50.230.4558.46AnTLP130.280.4559.12
AnTLP70.210.4351.37AnTLP170.280.4655.33
AnTLP40.250.4851.17
Disclaimer/Publisher’s Note: The statements, opinions and data contained in all publications are solely those of the individual author(s) and contributor(s) and not of MDPI and/or the editor(s). MDPI and/or the editor(s) disclaim responsibility for any injury to people or property resulting from any ideas, methods, instructions or products referred to in the content.