Article

Kernel Transcriptome Profiles of Susceptible Wheat Genotypes in Response to Wheat Dwarf Bunt

1
Key Laboratory of the Pest Monitoring and Safety Control of Crops and Forests of the Xinjiang Uygur Autonomous Region, College of Agronomy, Xinjiang Agricultural University, Urumqi 830052, China
2
Key Laboratory of Prevention and Control of Invasive Alien Species in Agriculture & Forestry of the North-Western Desert Oasis, Ministry of Agriculture and Rural Affairs, Urumqi 830052, China
3
College of Plant Protection, Nanjing Agricultural University, Nanjing 210095, China
*
Author to whom correspondence should be addressed.
These authors contributed equally to this work.
Int. J. Mol. Sci. 2023, 24(24), 17281; https://doi.org/10.3390/ijms242417281
Submission received: 22 September 2023 / Revised: 21 November 2023 / Accepted: 7 December 2023 / Published: 8 December 2023
(This article belongs to the Special Issue Discovery of Gene Functions in Crops by Genome Editing and Genomics)

Abstract

:
Wheat dwarf bunt is caused by Tilletia controversa J. G. Kühn (TCK), which is a serious fungal diseases affecting kernels of wheat. In order to identify candidate genes involved in the abnormal development of kernels in wheat, we used RNA sequencing technology to analyze the transcriptome of the abnormal and healthy kernels of a susceptible variety (Yili053) at the mid-filling stage, late-filling stage, and maturity stage, respectively. The differentially expressed genes (DEGs) were analyzed, and there were 3930 DEGs, 28,422 DEGs, and 20,874 DEGs found at the mid-filling stage, late-filling stage, and maturity stage in Yili053, respectively. A total of 1592 DEGs (506 DEGs up-regulated) showed continuously differential expression in the three stages. Gene ontology analysis showed that these DEGs were related to biological regulation, metabolic processes, and the response to stimulus. Kyoto Encyclopedia of Genes and Genomes enrichment analysis showed that these DEGs play major roles in pathways including photosynthesis, carbon metabolism, carbon fixation in photosynthetic organisms, and glyoxylate and dicarboxylate metabolism. Moreover, we predicted that 13 MADS-MIKC transcription factors, which were continuously up-regulated, were crucial for regulating the maturation and senescence of eukaryotes. Some 21 genes related to the plant hormone signaling transduction pathway and 61 genes related to the response to stimulus were analyzed. A total of 26 of them were successful validated with a qPCR analysis. These genes were thought to be involved in the abnormal development of kernels infected by TCK. A transcriptomics analysis of wheat kernels in response to TCK will contribute to understanding the interaction of TCK and wheat, and may provide a basis for knowledge of molecular events in the abnormal development of kernels, which will be helpful for more efficient TCK management.

1. Introduction

Wheat (Triticum aestivum L.) is one of the most crucial crops grown for basic foods [1,2]. Wheat dwarf bunt (WDB) is caused by Tilletia controversa Kühn (TCK), and can reduce yield and quality by infecting wheat kernels [3,4]; total loss might exceed 70–80% [5,6,7]. WDB is a significant global fungal disease, and it has been documented in 15 countries [3,8,9,10,11]. The export of TCK-contaminated wheat from these nations has been subject to restrictions due to the possibility that TCK will spread through spores of the pathogen.
WDB is a seed- and soil-borne disease. Inreases in warfing and tillering are WDB’s characteristic symptoms [12]. Wheat heads are replaced by brown-black teliospores, and sori are formed, also called bunt balls [13]. Usually, all florets are replaced with teliospores in a single spikelet, and the diseased kernels are nearly spherical, rigid, and blocky after being crushed [12]. The teliospores have a rotting fish odor because of the trimethylamine. Even though the rate of infection in the wheat is relatively low, the flour still has distinct smells.
When the pathogen infects the plant, the plant will produce a series of defense responses in order to resist the invasion of the pathogen, such as modification of plant cell walls [14], release of reactive oxygen species [15], production of secondary metabolites [16], and production of pathogenesis-related proteins [17]. These defense responses are associated with disease-causing genes and transcription factors [18]. With the advancement of molecular biological technology, various omics, such as transcriptomics, are widely used in the study of plant–pathogen interaction and gene function.
Using RNA sequencing (RNA-seq) technology to extract total RNA from a given tissue sample and sequence it to identify gene expression levels, it was possible to swiftly and completely gather all the transcriptional data. RNA-seq has proven to be a very effective method of researching the transcriptome expression variations of genes associated with biotic and abiotic stress in wheat. Liu et al. [19] analyzed and compared the gene expression profiling of CMPG1-V transgenic plants and their receptor Yangmai 158 after Blumeria graminis inoculation at four infection stages using RNA-Seq. Jitendra et al. [20] compared the transcriptome in two wheat genotypes with contrasting levels of drought tolerance, and found that regulatory genes such as MT, FT, AP2, etc. were involved in defense response in wheat. The comparison of RNA-seq profiles between glumes of wheat groups differing in glumes toughness and rachis brittleness revealed a few DEGs that may be involved in glumes’ toughness and nutrient remobilization [21]. RNA-seq has been used in wheat kernel development. Liu et al. found that the NAC transcription factor NAC019-A1 was a negative regulator of starch synthesis in wheat developing endosperm [22]. Wei et al. performed isoform sequencing for wheat grain and RNA-seq for the embryo and de-embryonated kernels to analyze their transcriptome characteristics and homoeolog expression bias [23]. Consequently, RNA-seq could offer new information about wheat kernel development after TCK infection.
Although extensive research has analyzed wheat–TCK interactions, but there is little research about the molecular mechanism of wheat kernel abnormality caused by TCK; instead, the majority of studies so far have concentrated on TCK detection and risk analysis [24,25]. Therefore, it is crucial to investigate the genes involved in the aberrant growth of kernels after TCK infection. In this study, RNA-seq was used to examine the traits of the healthy and pathological kernel expression in sensitive wheat cultivars (Yili053). The differentially expressed genes of wheat kernels’ development during the mid-filling stage, late-filling stage, and maturity stages were analyzed, exploring the genes related to the abnormal development of kernels after the effect of TCK. This study can be used as a starting point for further research into the molecular mechanisms underlying the emergence of abnormal kernels in TCK-affected wheat, which would help in managing and preventing the disease.

2. Results

2.1. RNA Sequencing Analysis

In this study, the 18 cDNA libraries (9 TCK-infected and 9 control) were created, containing about 9.76 Gb clean reads of each sample (Table 1). The average GC contents were 54.51% and 57.81% for the control and infected samples, respectively. Q30 values were up to 93.42% and 93.87% for control and infected samples, indicating that a high-quality library was generated.

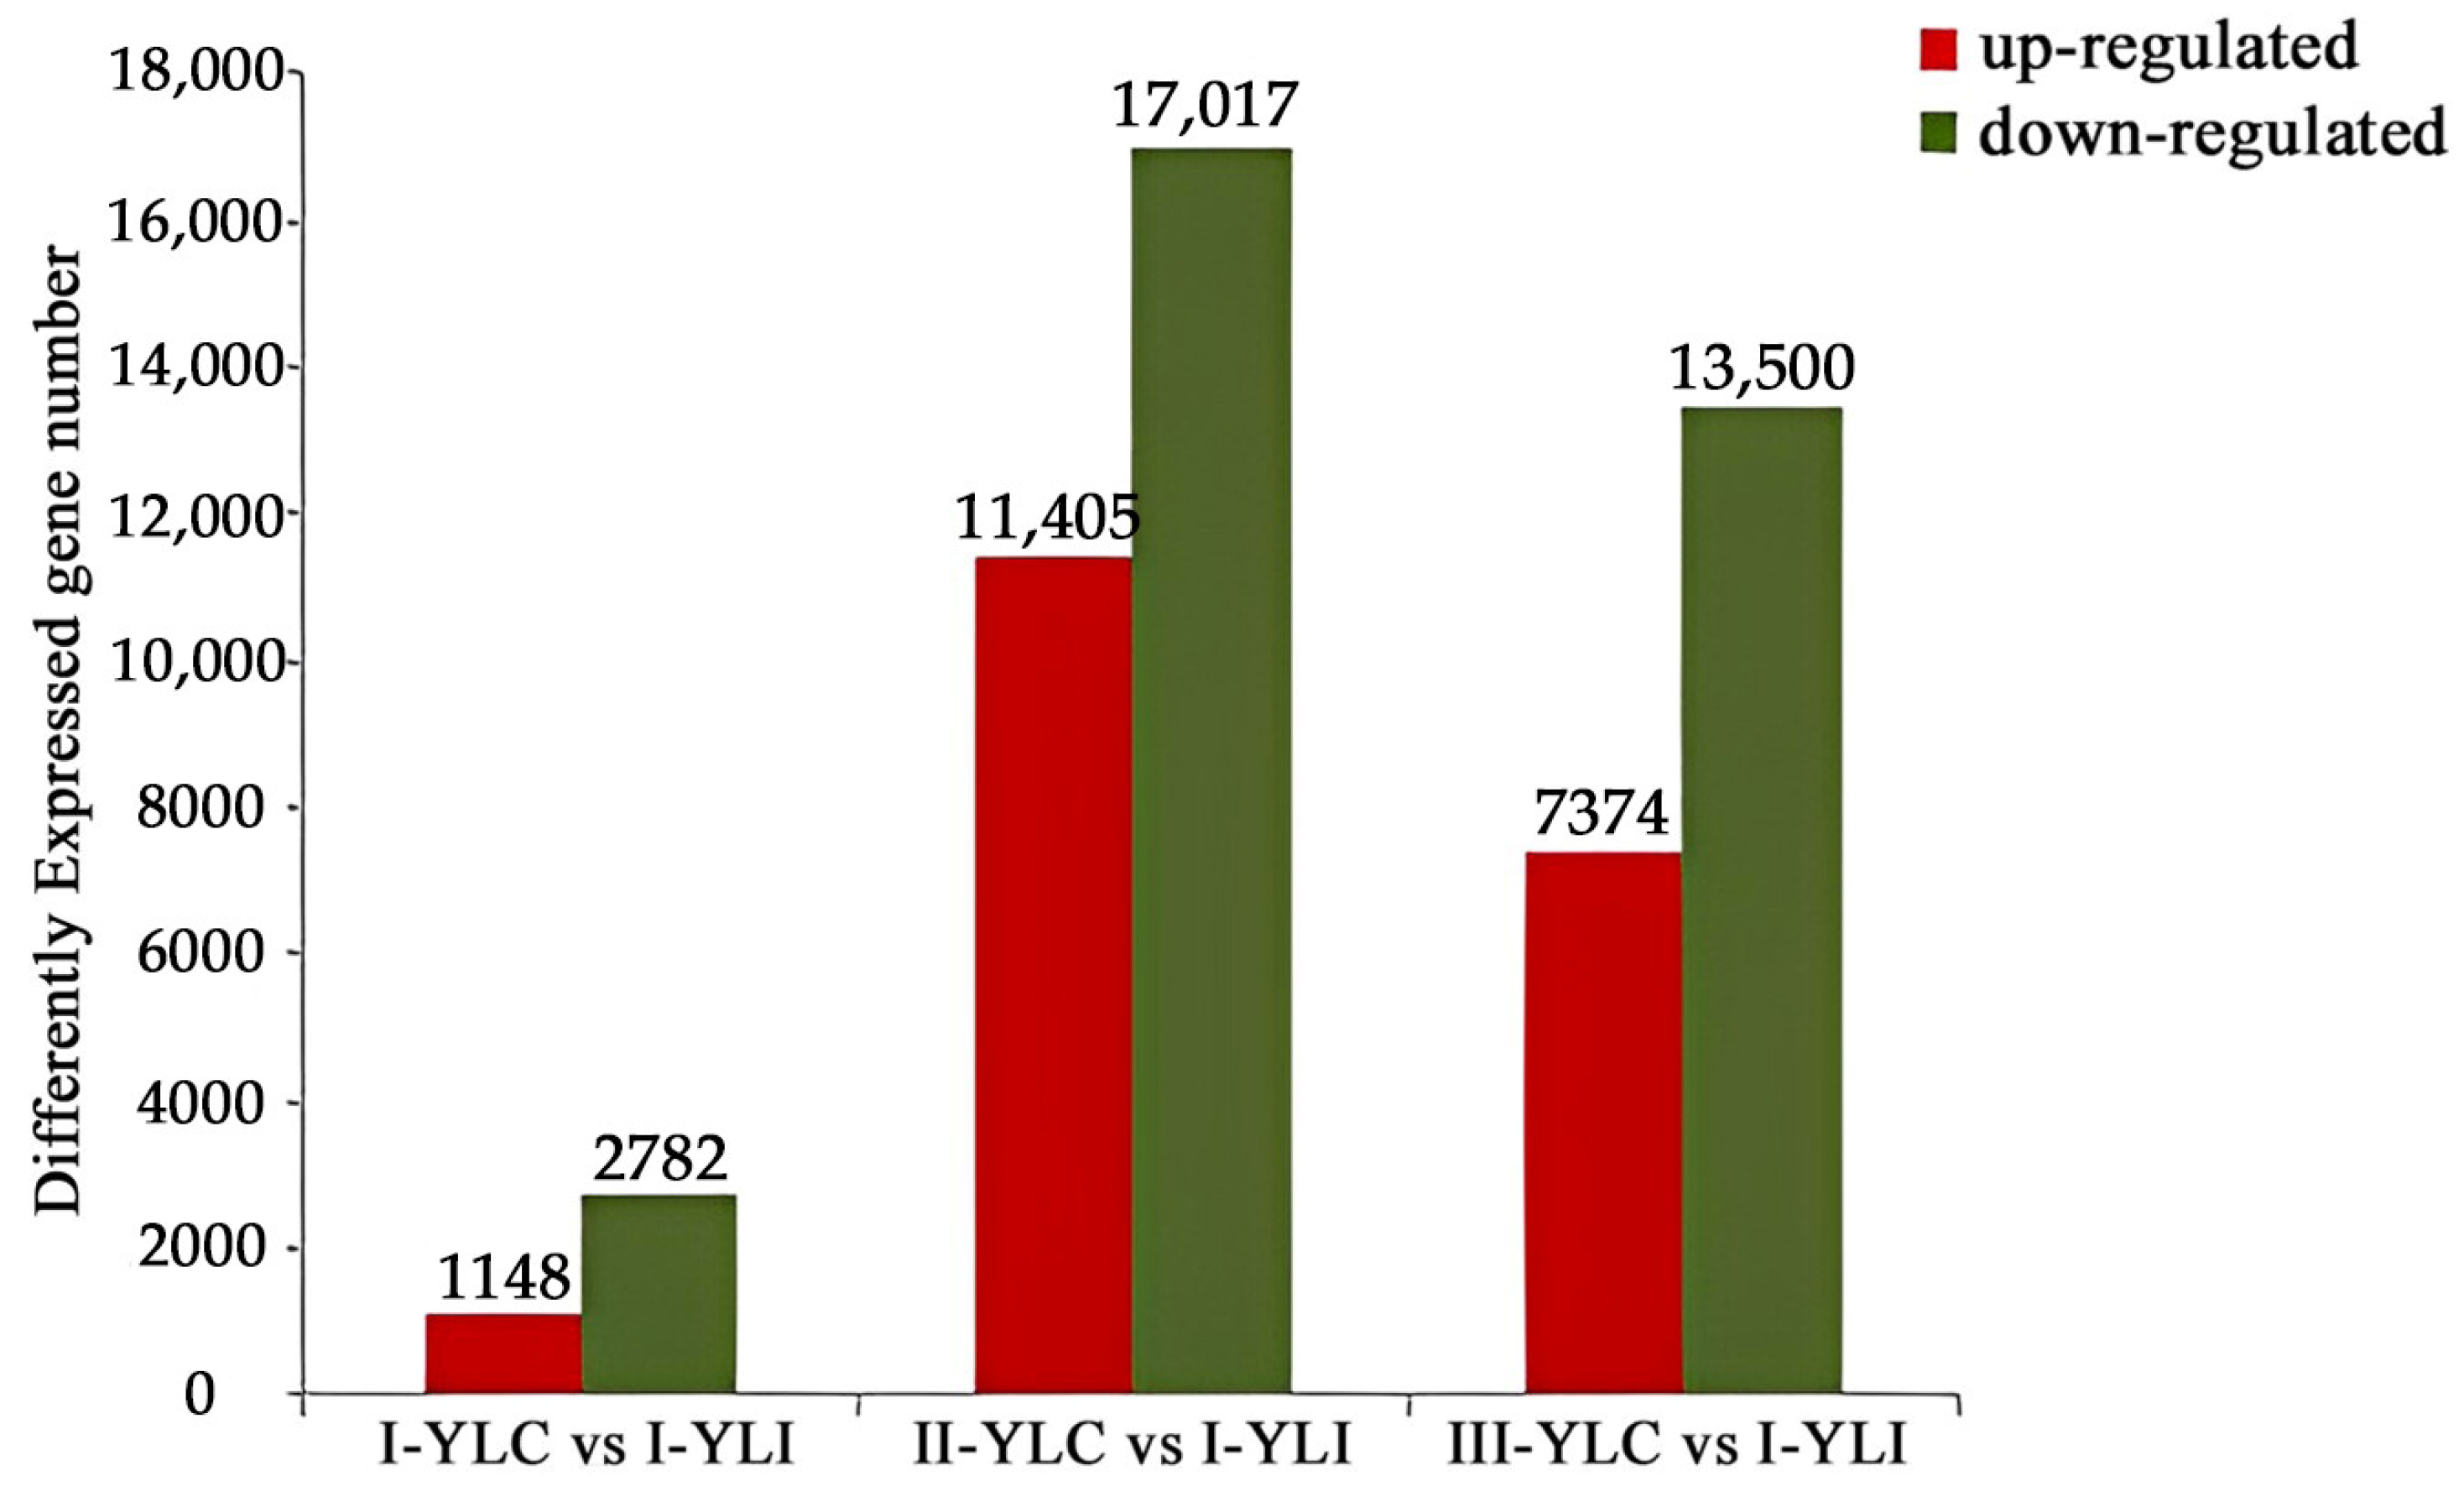
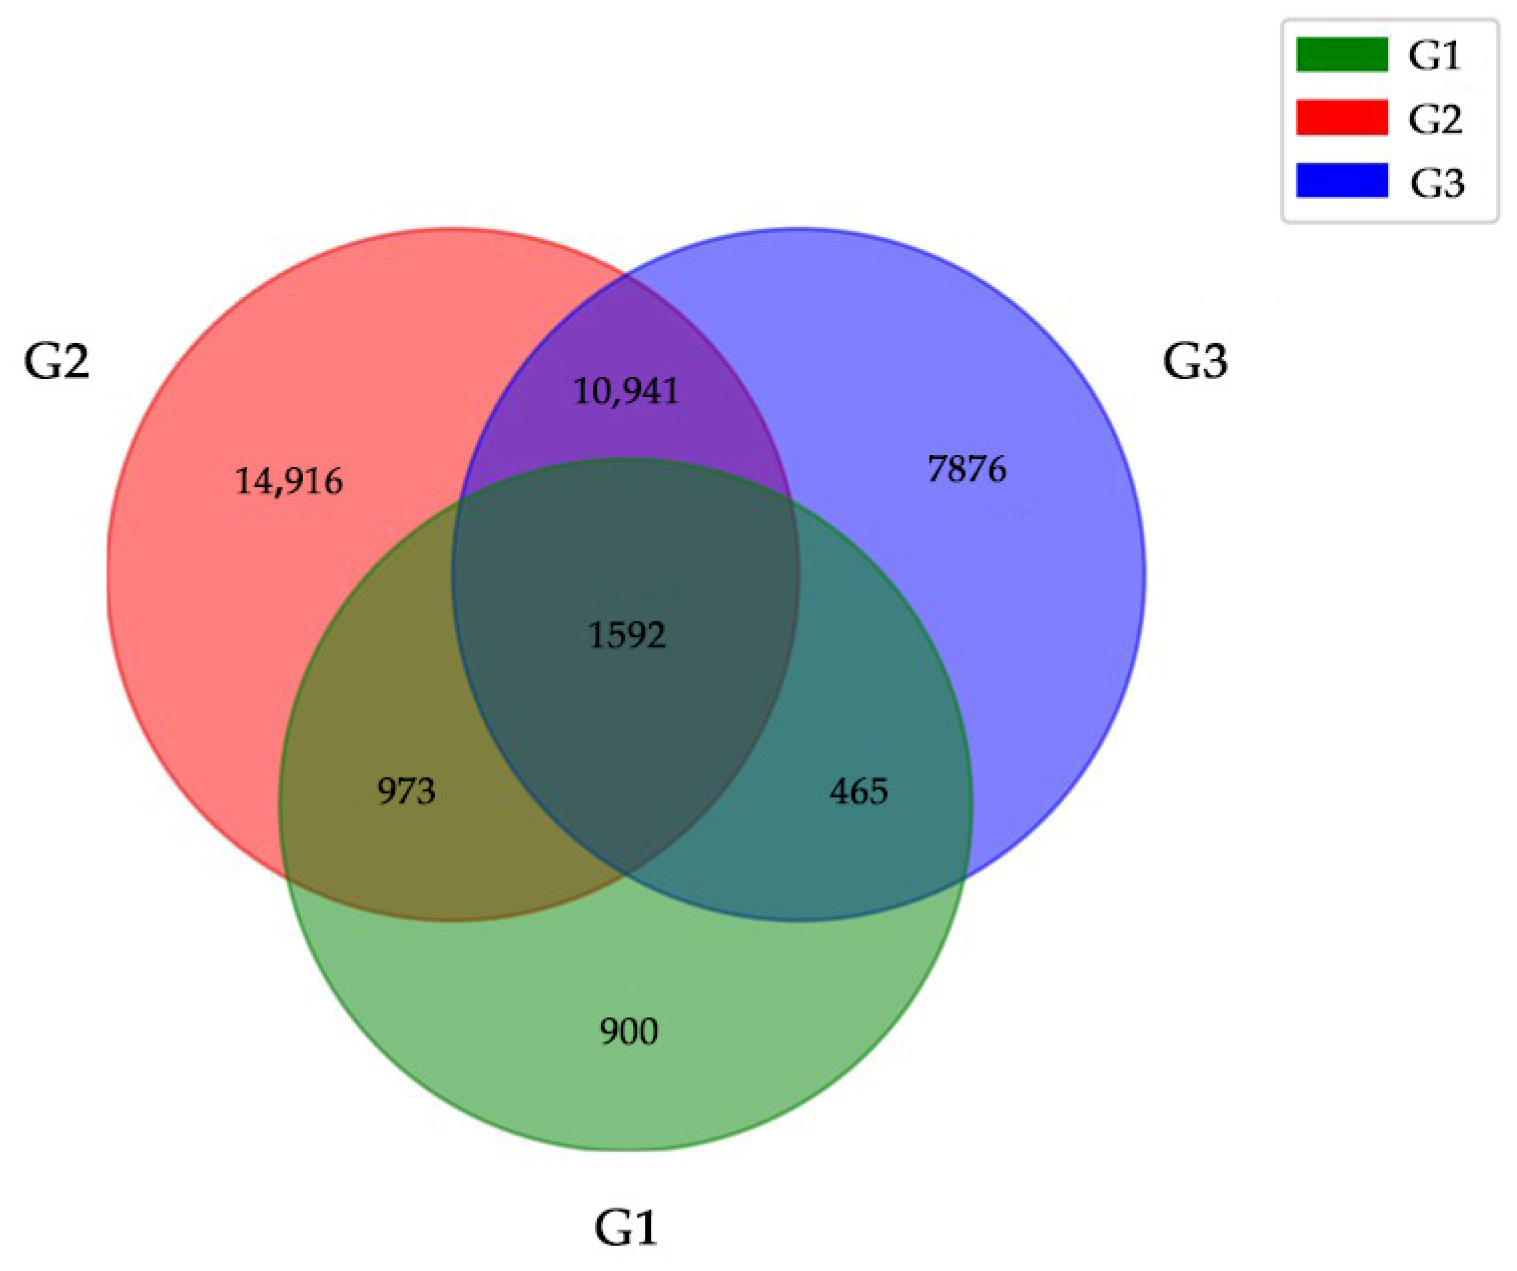
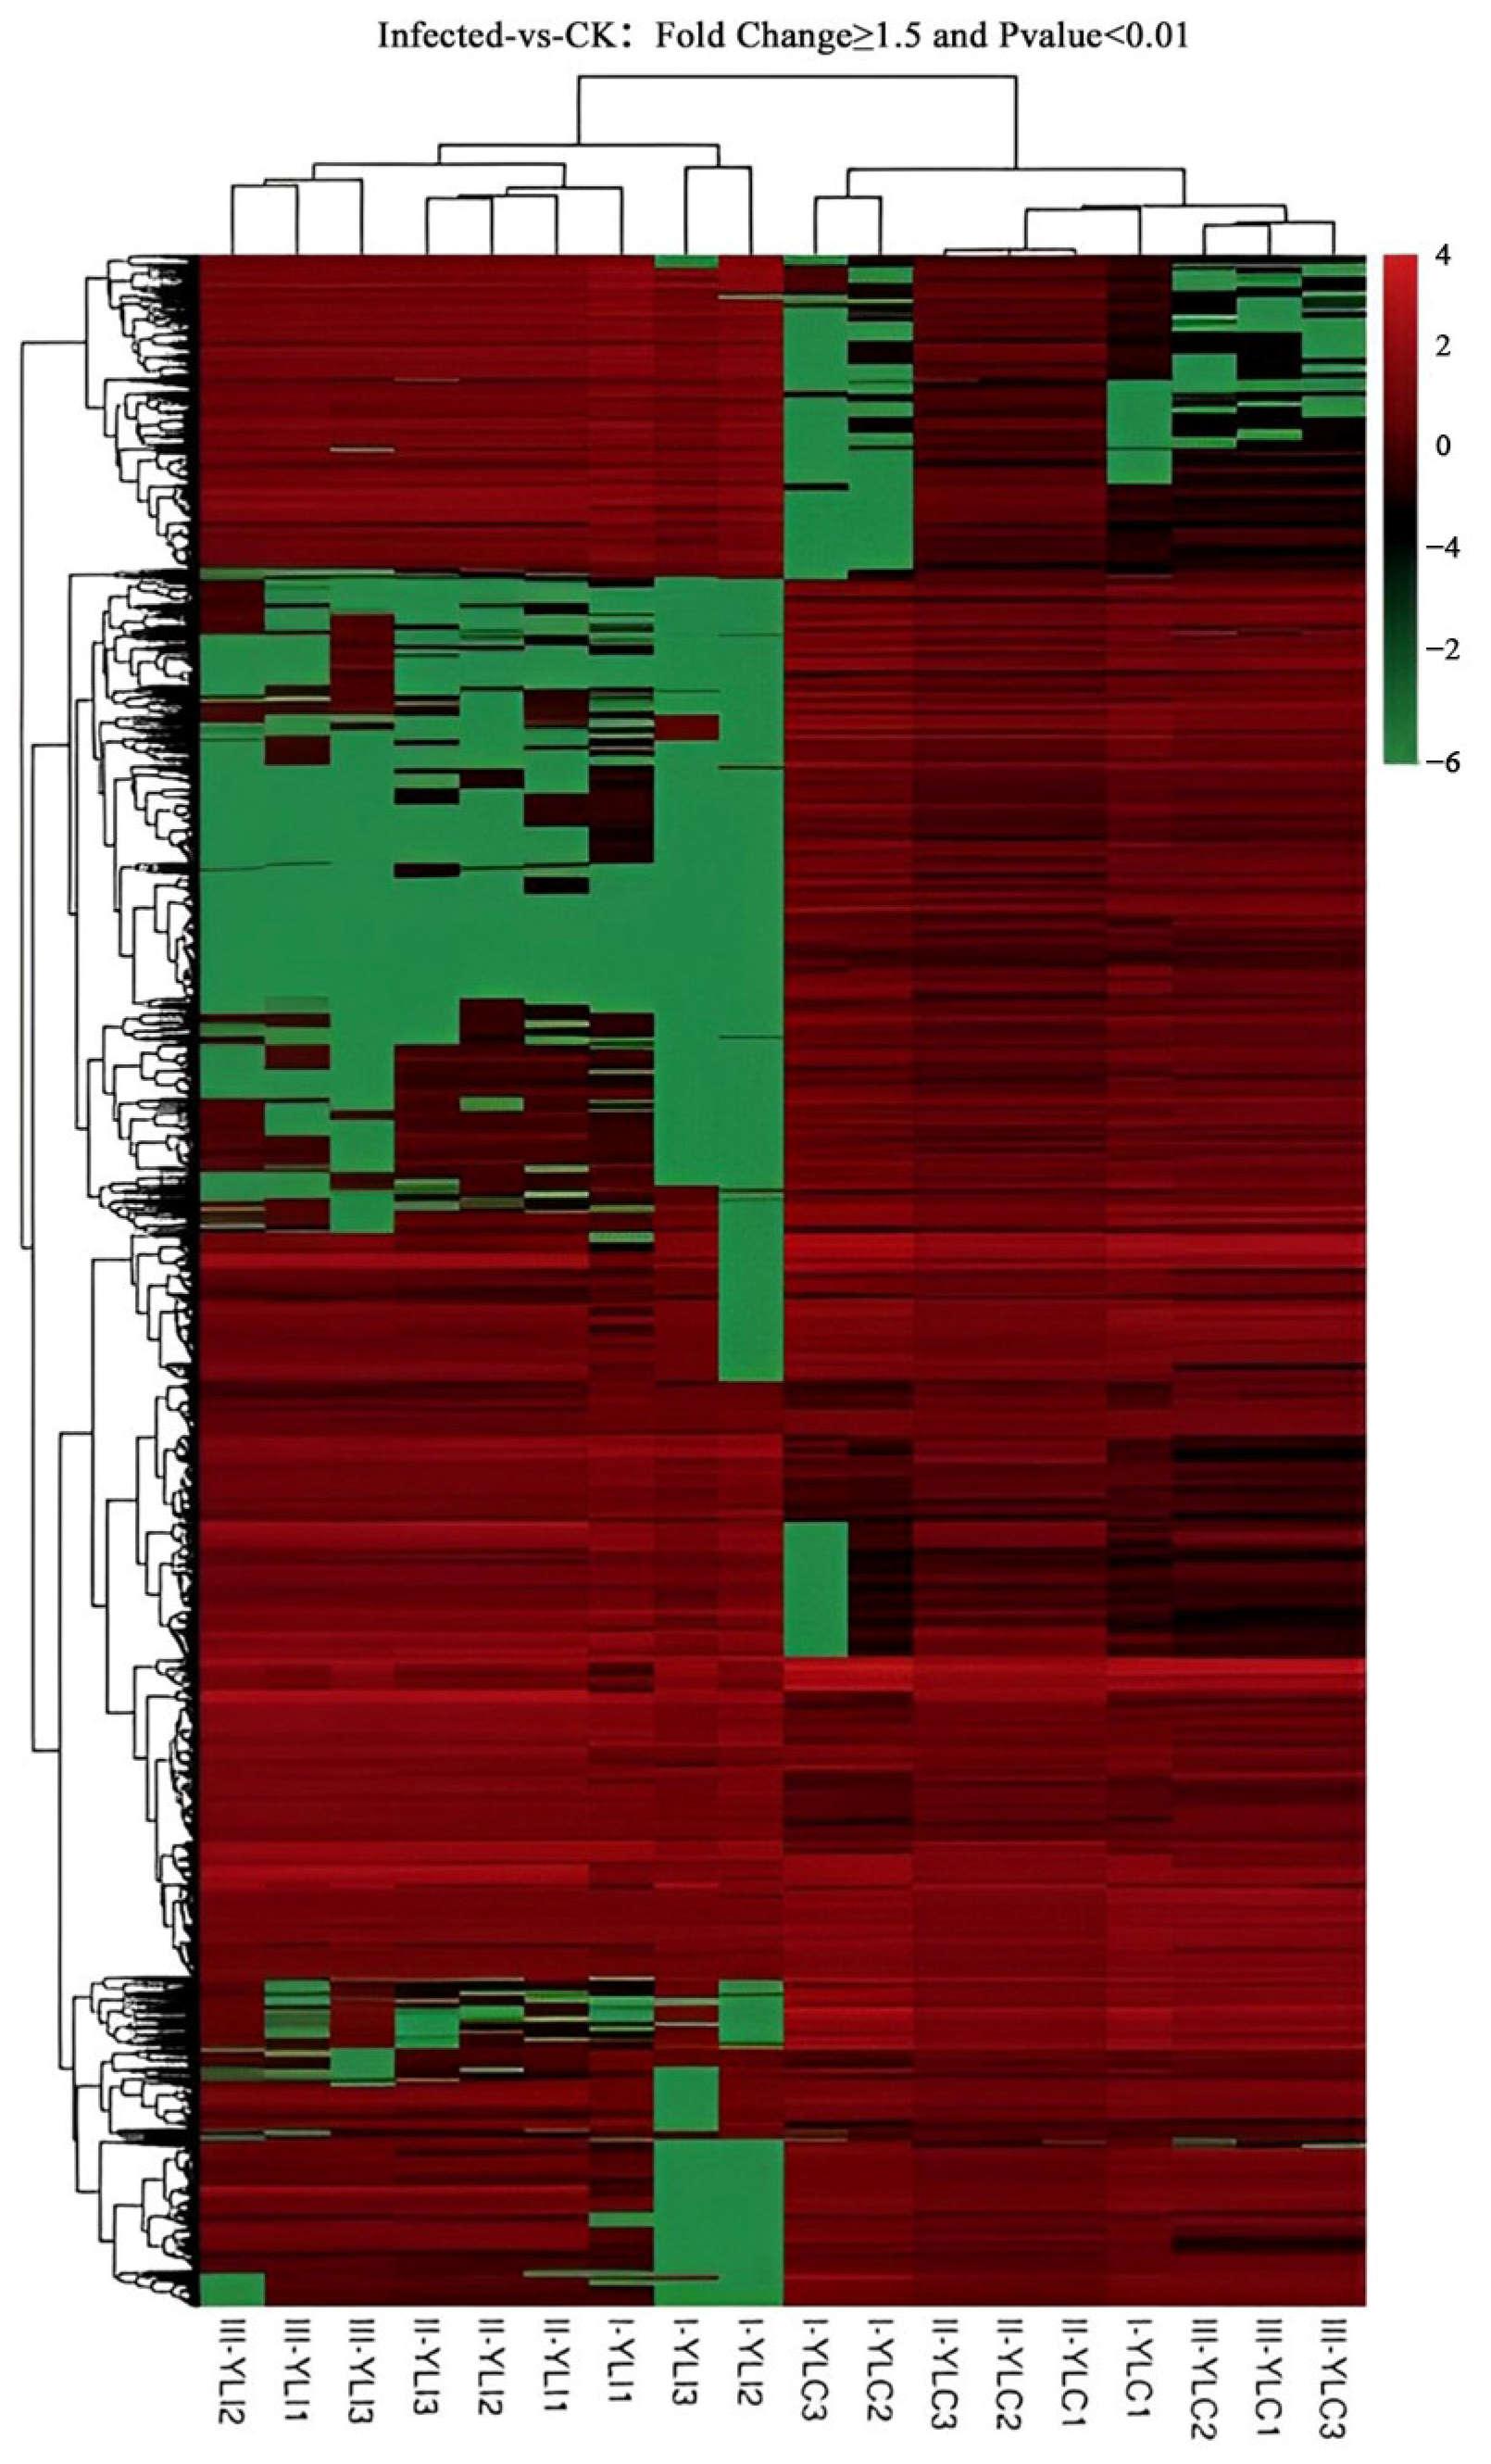
2.2. DEGs Identification

The differentially expressed genes were recognized by the number of reads, with FPKM used to normalize. As a result, there were 3930, 28,422 and 20,874 DEGs found in three periods (Figure 1). The most DEGs were found at the late-filling stage, with 11,405 up-regulated genes and 17,017 down-regulated genes. After the infection of TCK, the number of DEGs increased at late-filling stage and then decreased at the maturity stages.

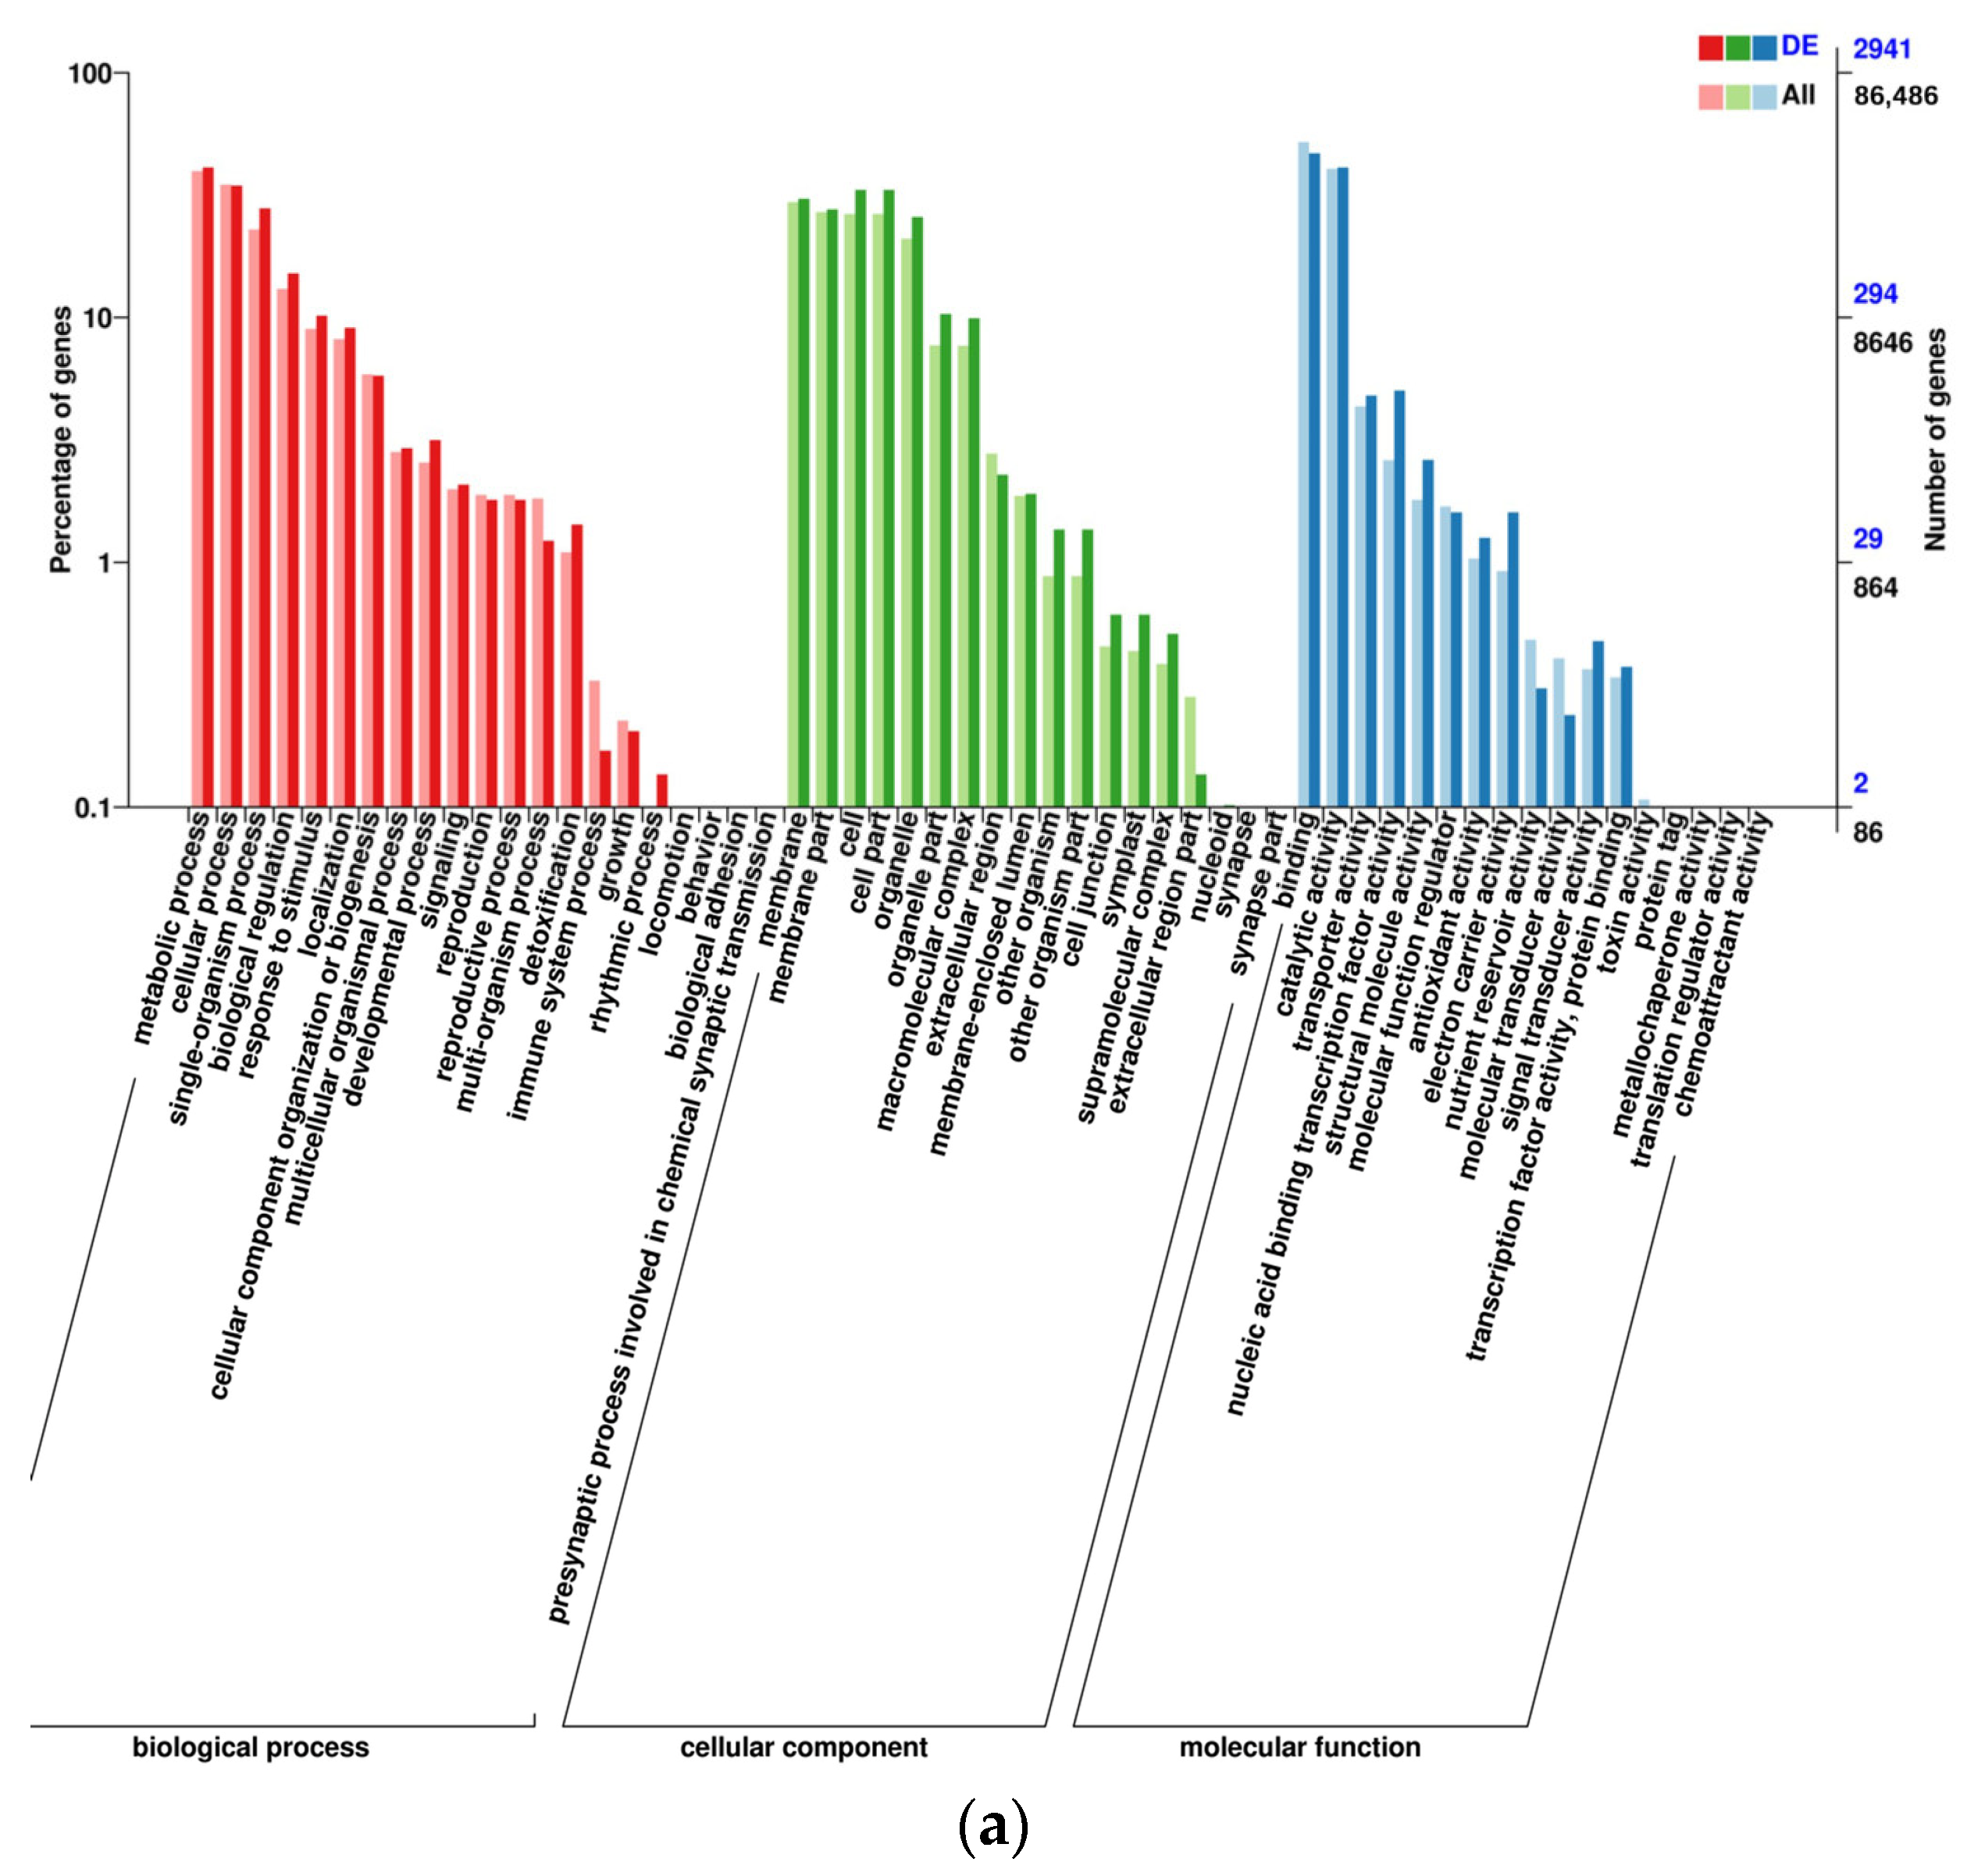
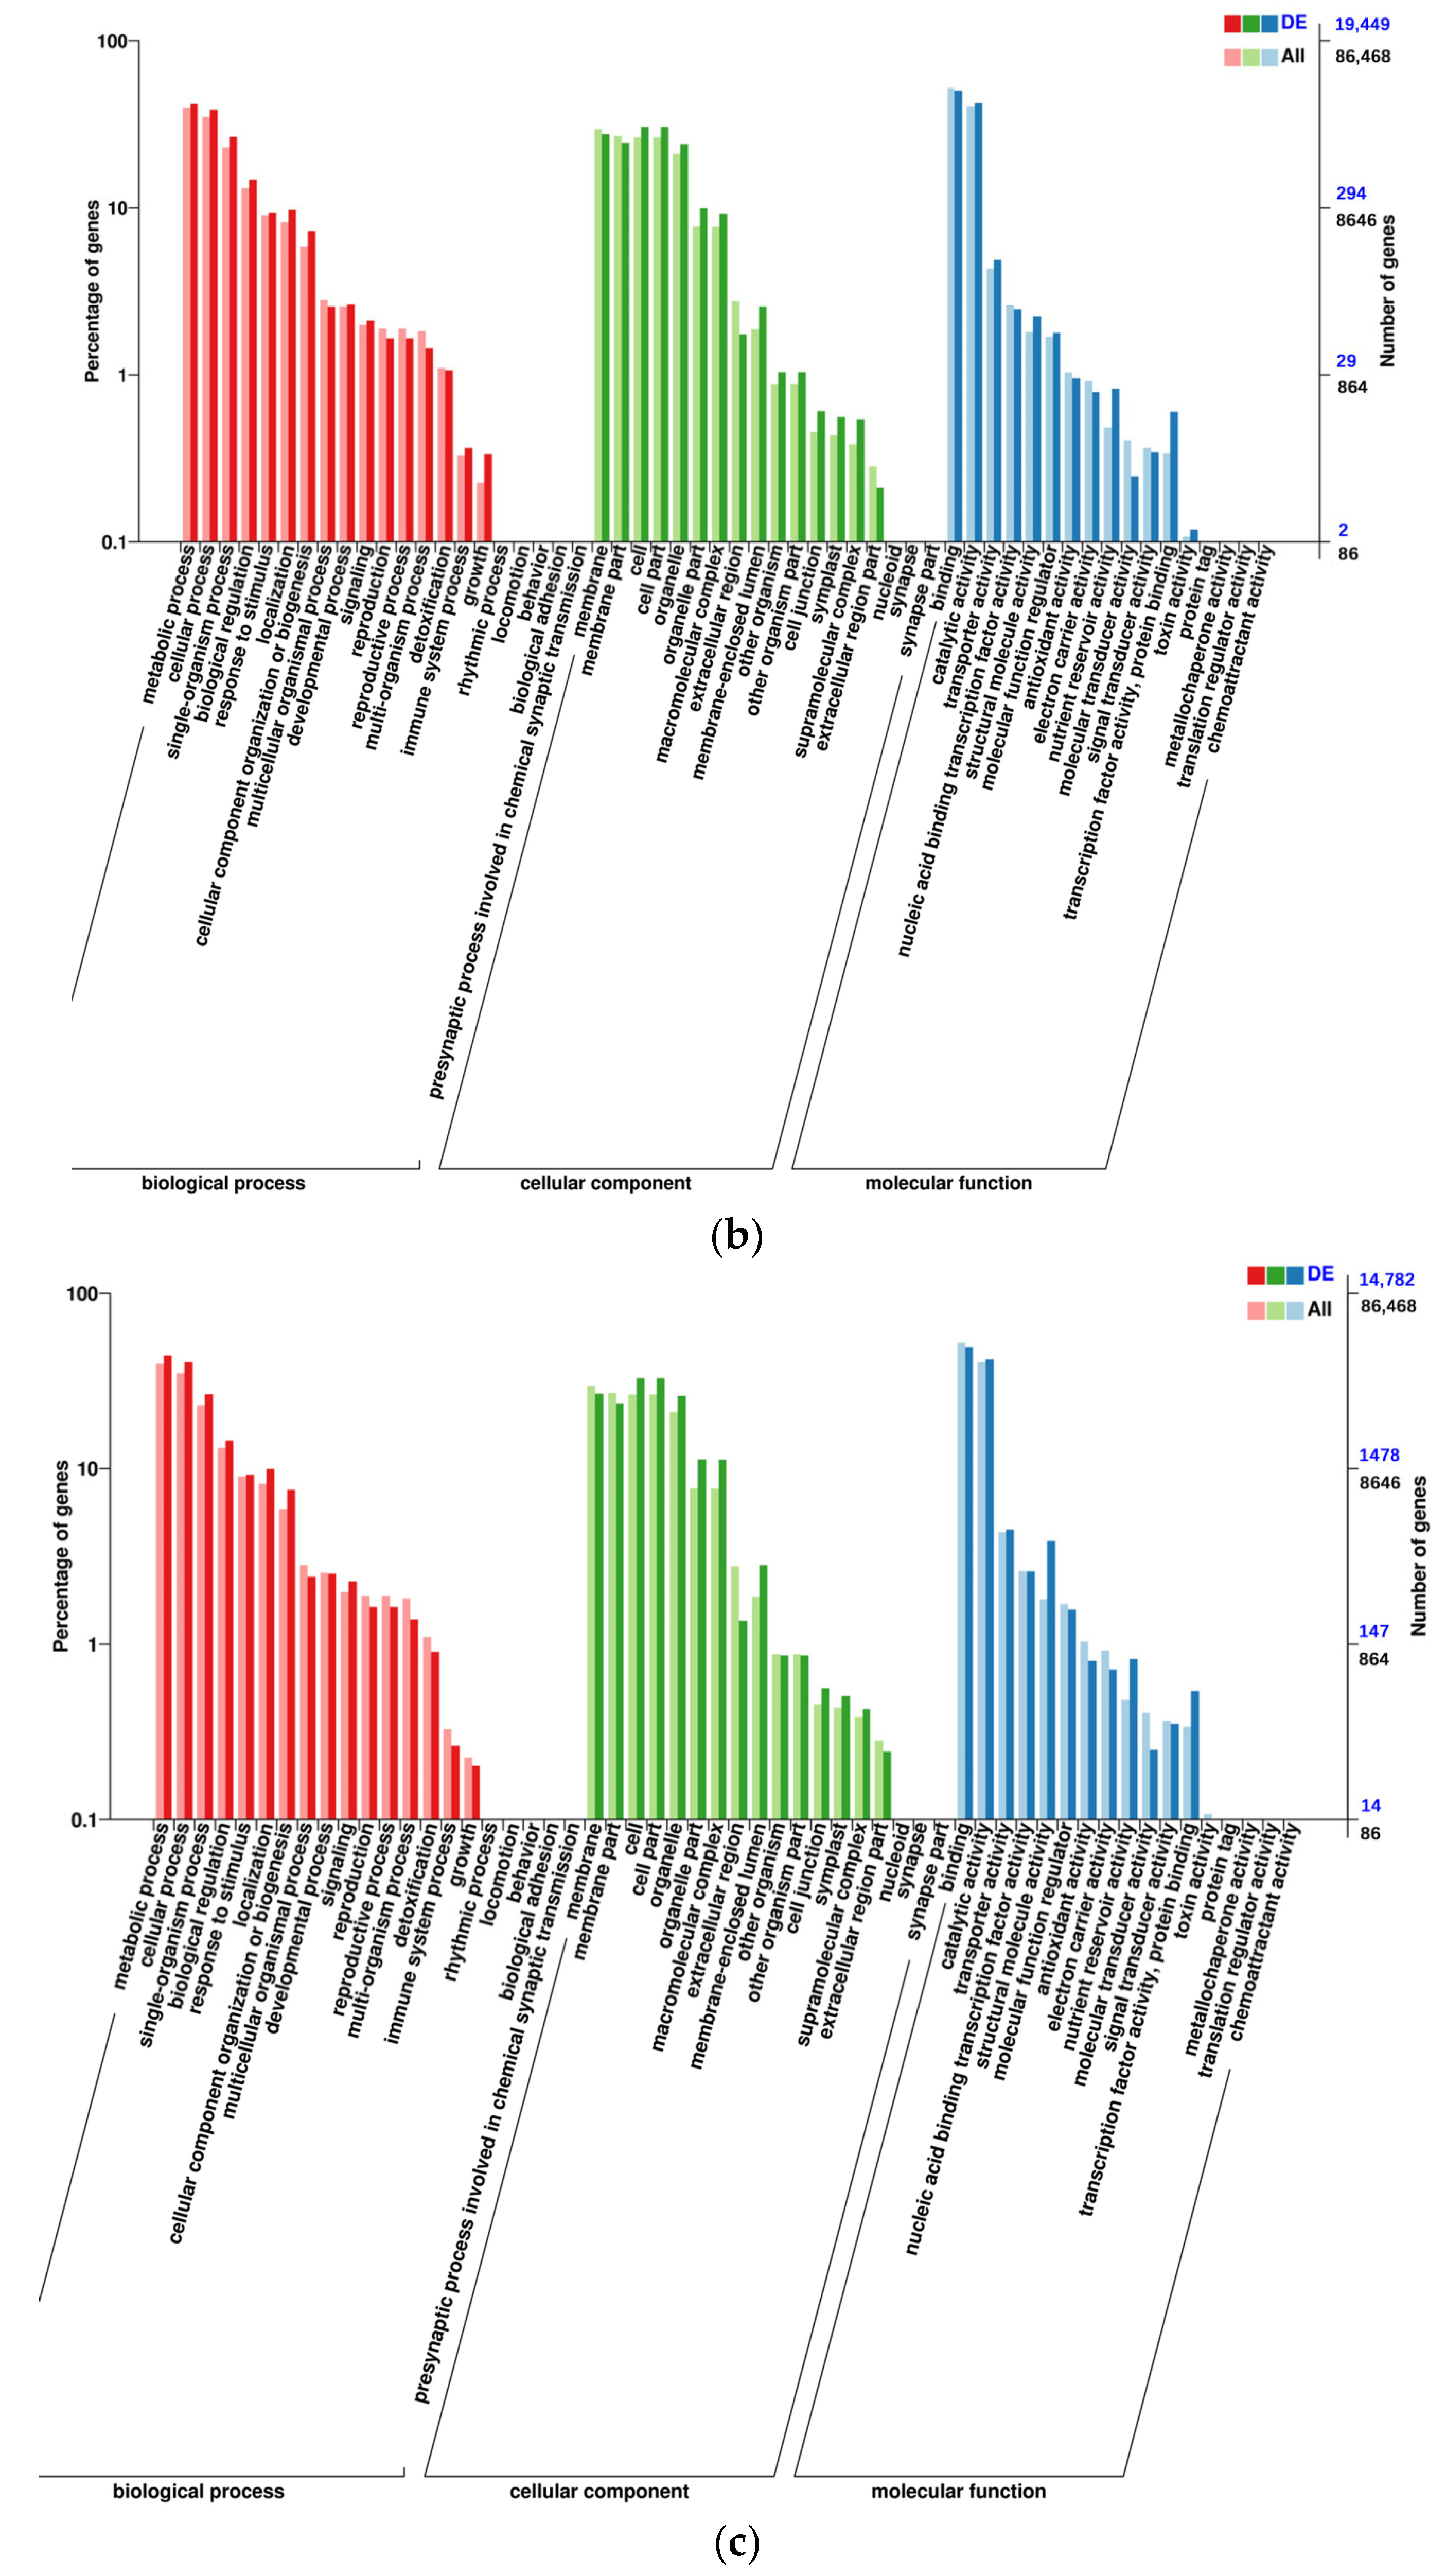
2.3. Gene Ontology Analysis of DEGs

The Gene ontology (GO) analysis was conducted to assess the function of DEGs, which focused primarily on biological process, cellular component, and molecular function (Figure 2). These DEGs were notably enriched 56 GO terms. In the category of biological process, DEGs related to functions such as metabolic processes, cellular processes, single-organism processes, biological regulation, response to stimulus are abundant. It had been proposed that the response of wheat to TCK involved a significant number of genes associated with cell metabolism and stress response. More DEGs had been annotated in the category of cellular component, demonstrating that the TCK infection affects the components of wheat kernel cells and might be connected to the aberrant growth of wheat grains. The development of wheat kernels and the catalytic reaction of enzymes were also impacted by the abundance of genes associated with binding function and catalytic activity in the category of molecular function. Figure 2 showed the GO enrichment in DEGs in all genes, which indicated the importance of a specific GO term in DEGs and all genes, respectively. The terms with two bars significantly different from each other can be picked up as potential targets for further analysis on functions, since these GO terms were enriched differently between DEGs-based and all-gene-based enrichment.

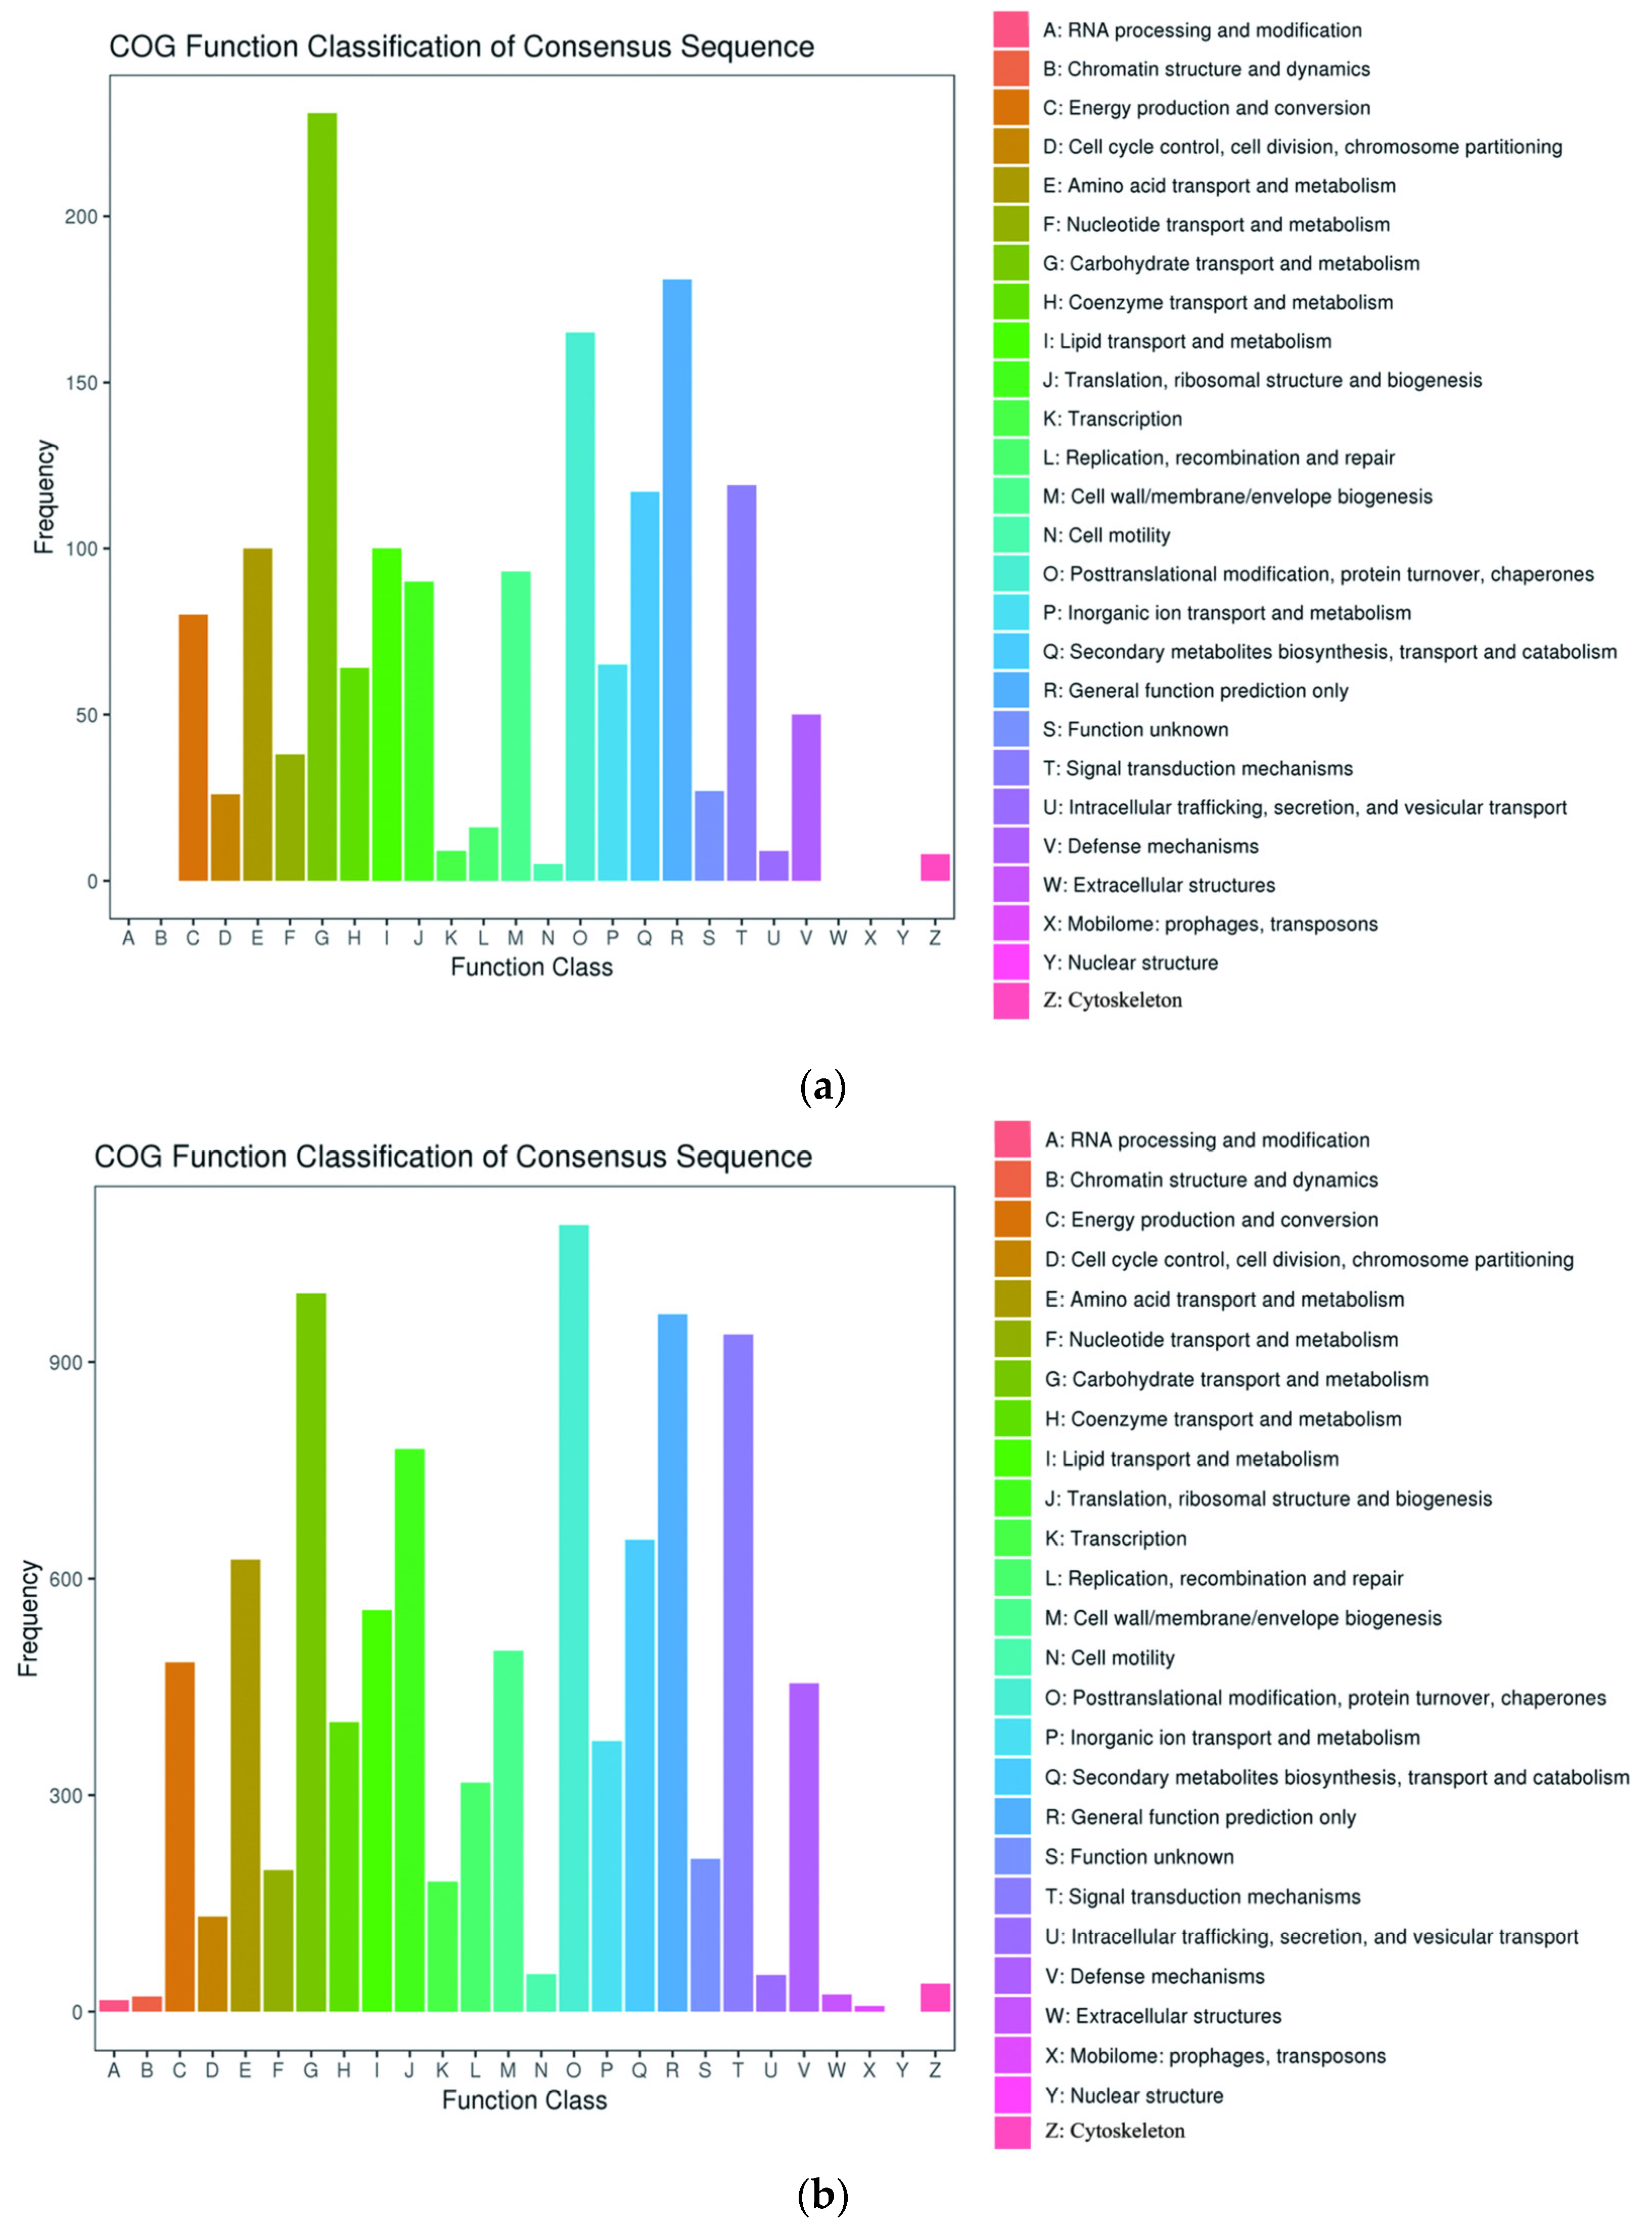
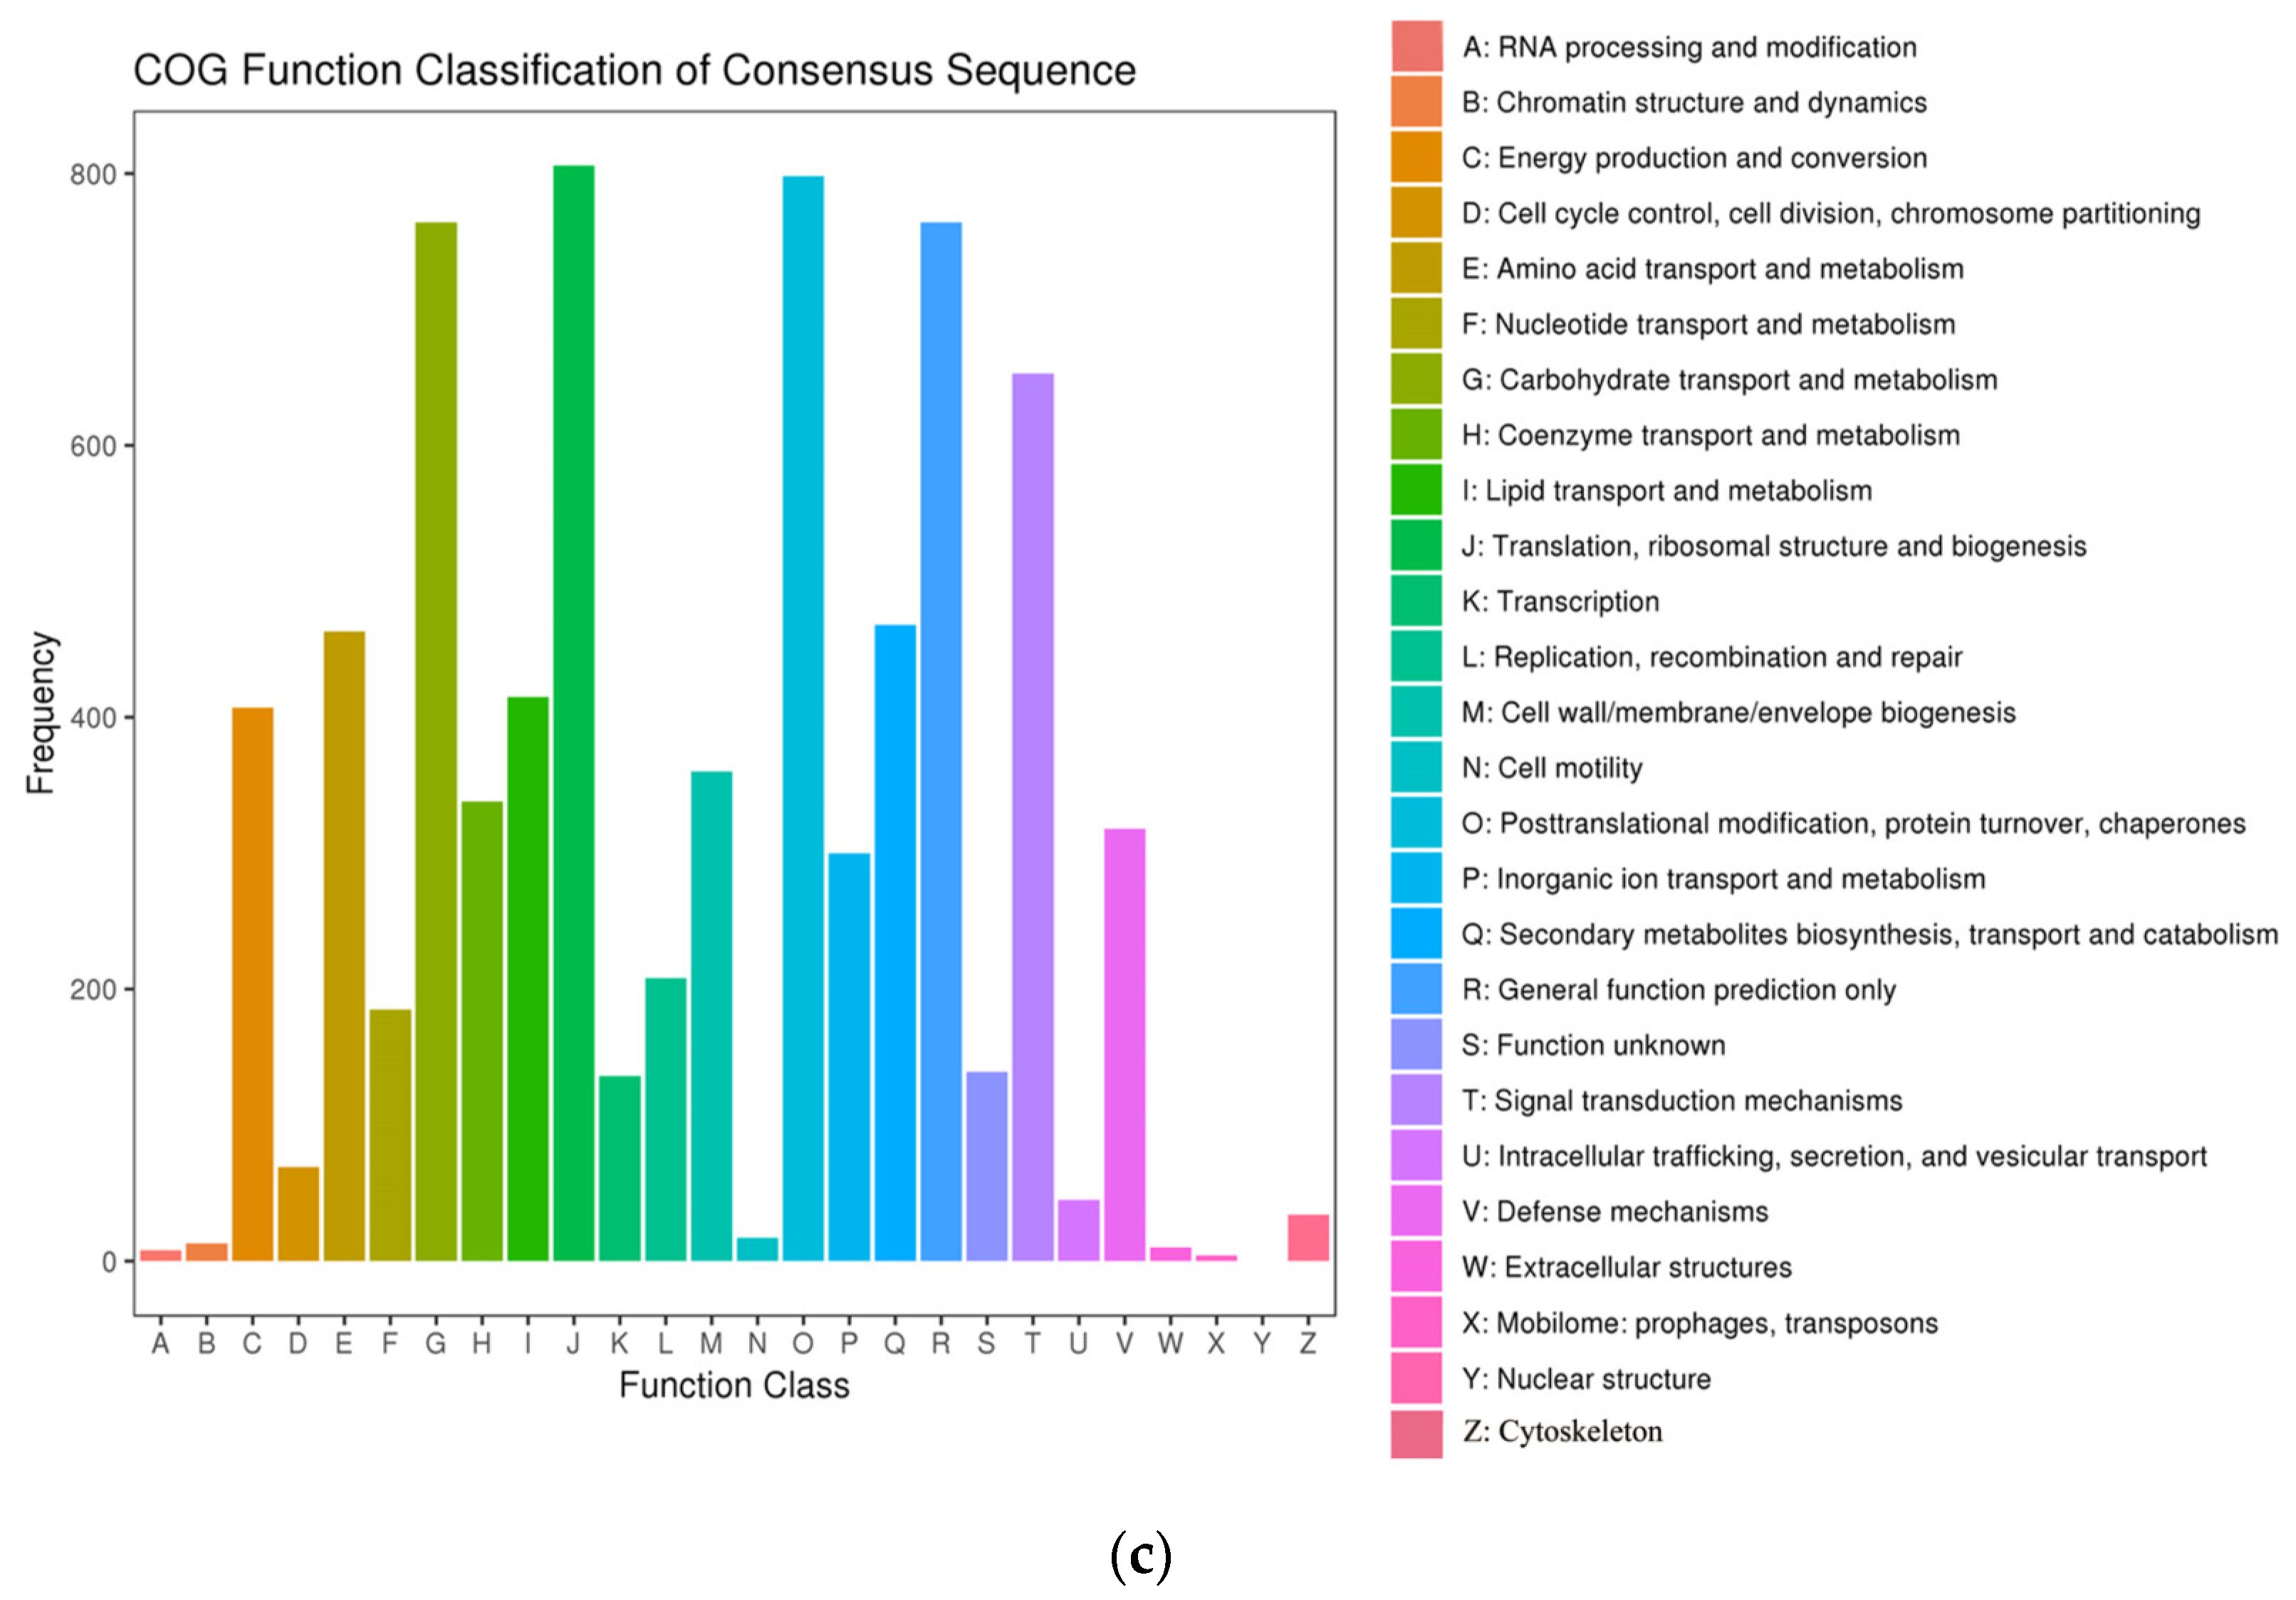
2.4. Cluster of Orthologous Groups Analysis of DEGs

Clusters of Orthologous Groups (COG) analysis can analyze the evolution of DEGs and predict the function of proteins. These DEGs were compared to the database and divided into 26 functional categories (Figure 3). At the mid-filling stage, the gene functions were involved in carbohydrate transport, metabolism, post-translation modification, protein turnover, chaperones and general function prediction. In addition to the aforementioned three functions, translation, ribosomal structure, biogenesis, and signal transduction mechanisms were involved in at the late-filling stage and maturity stage.

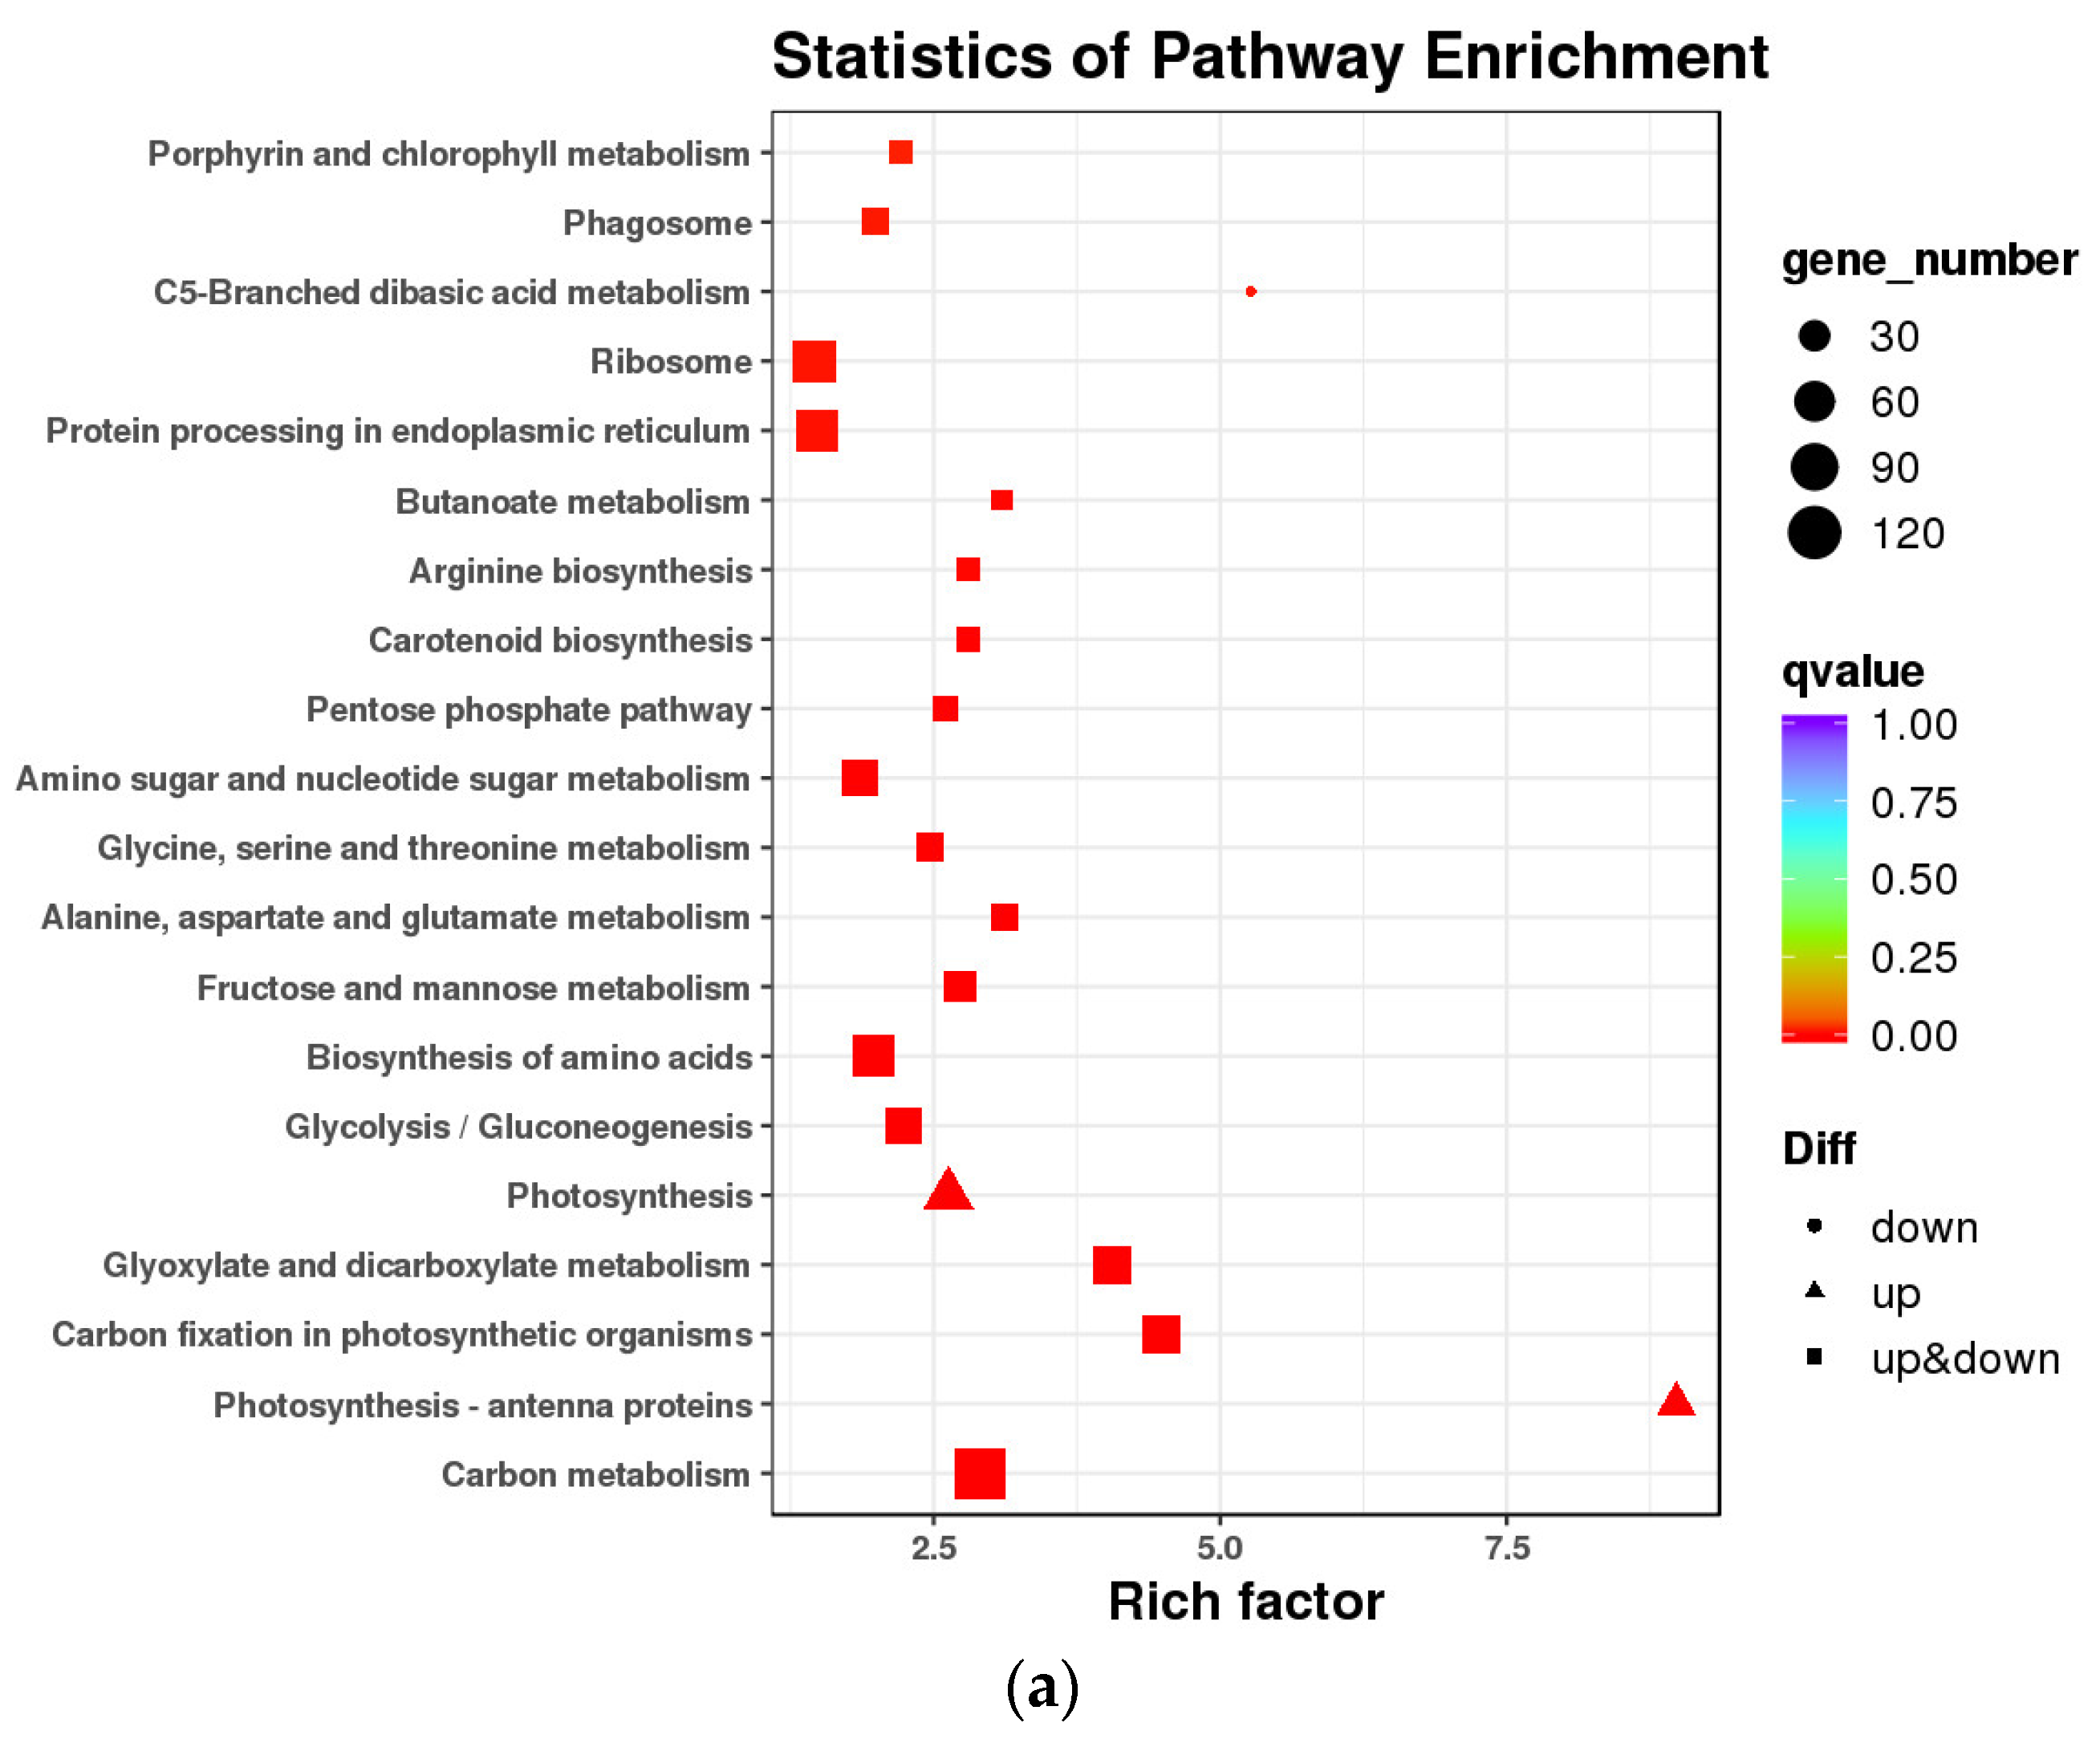
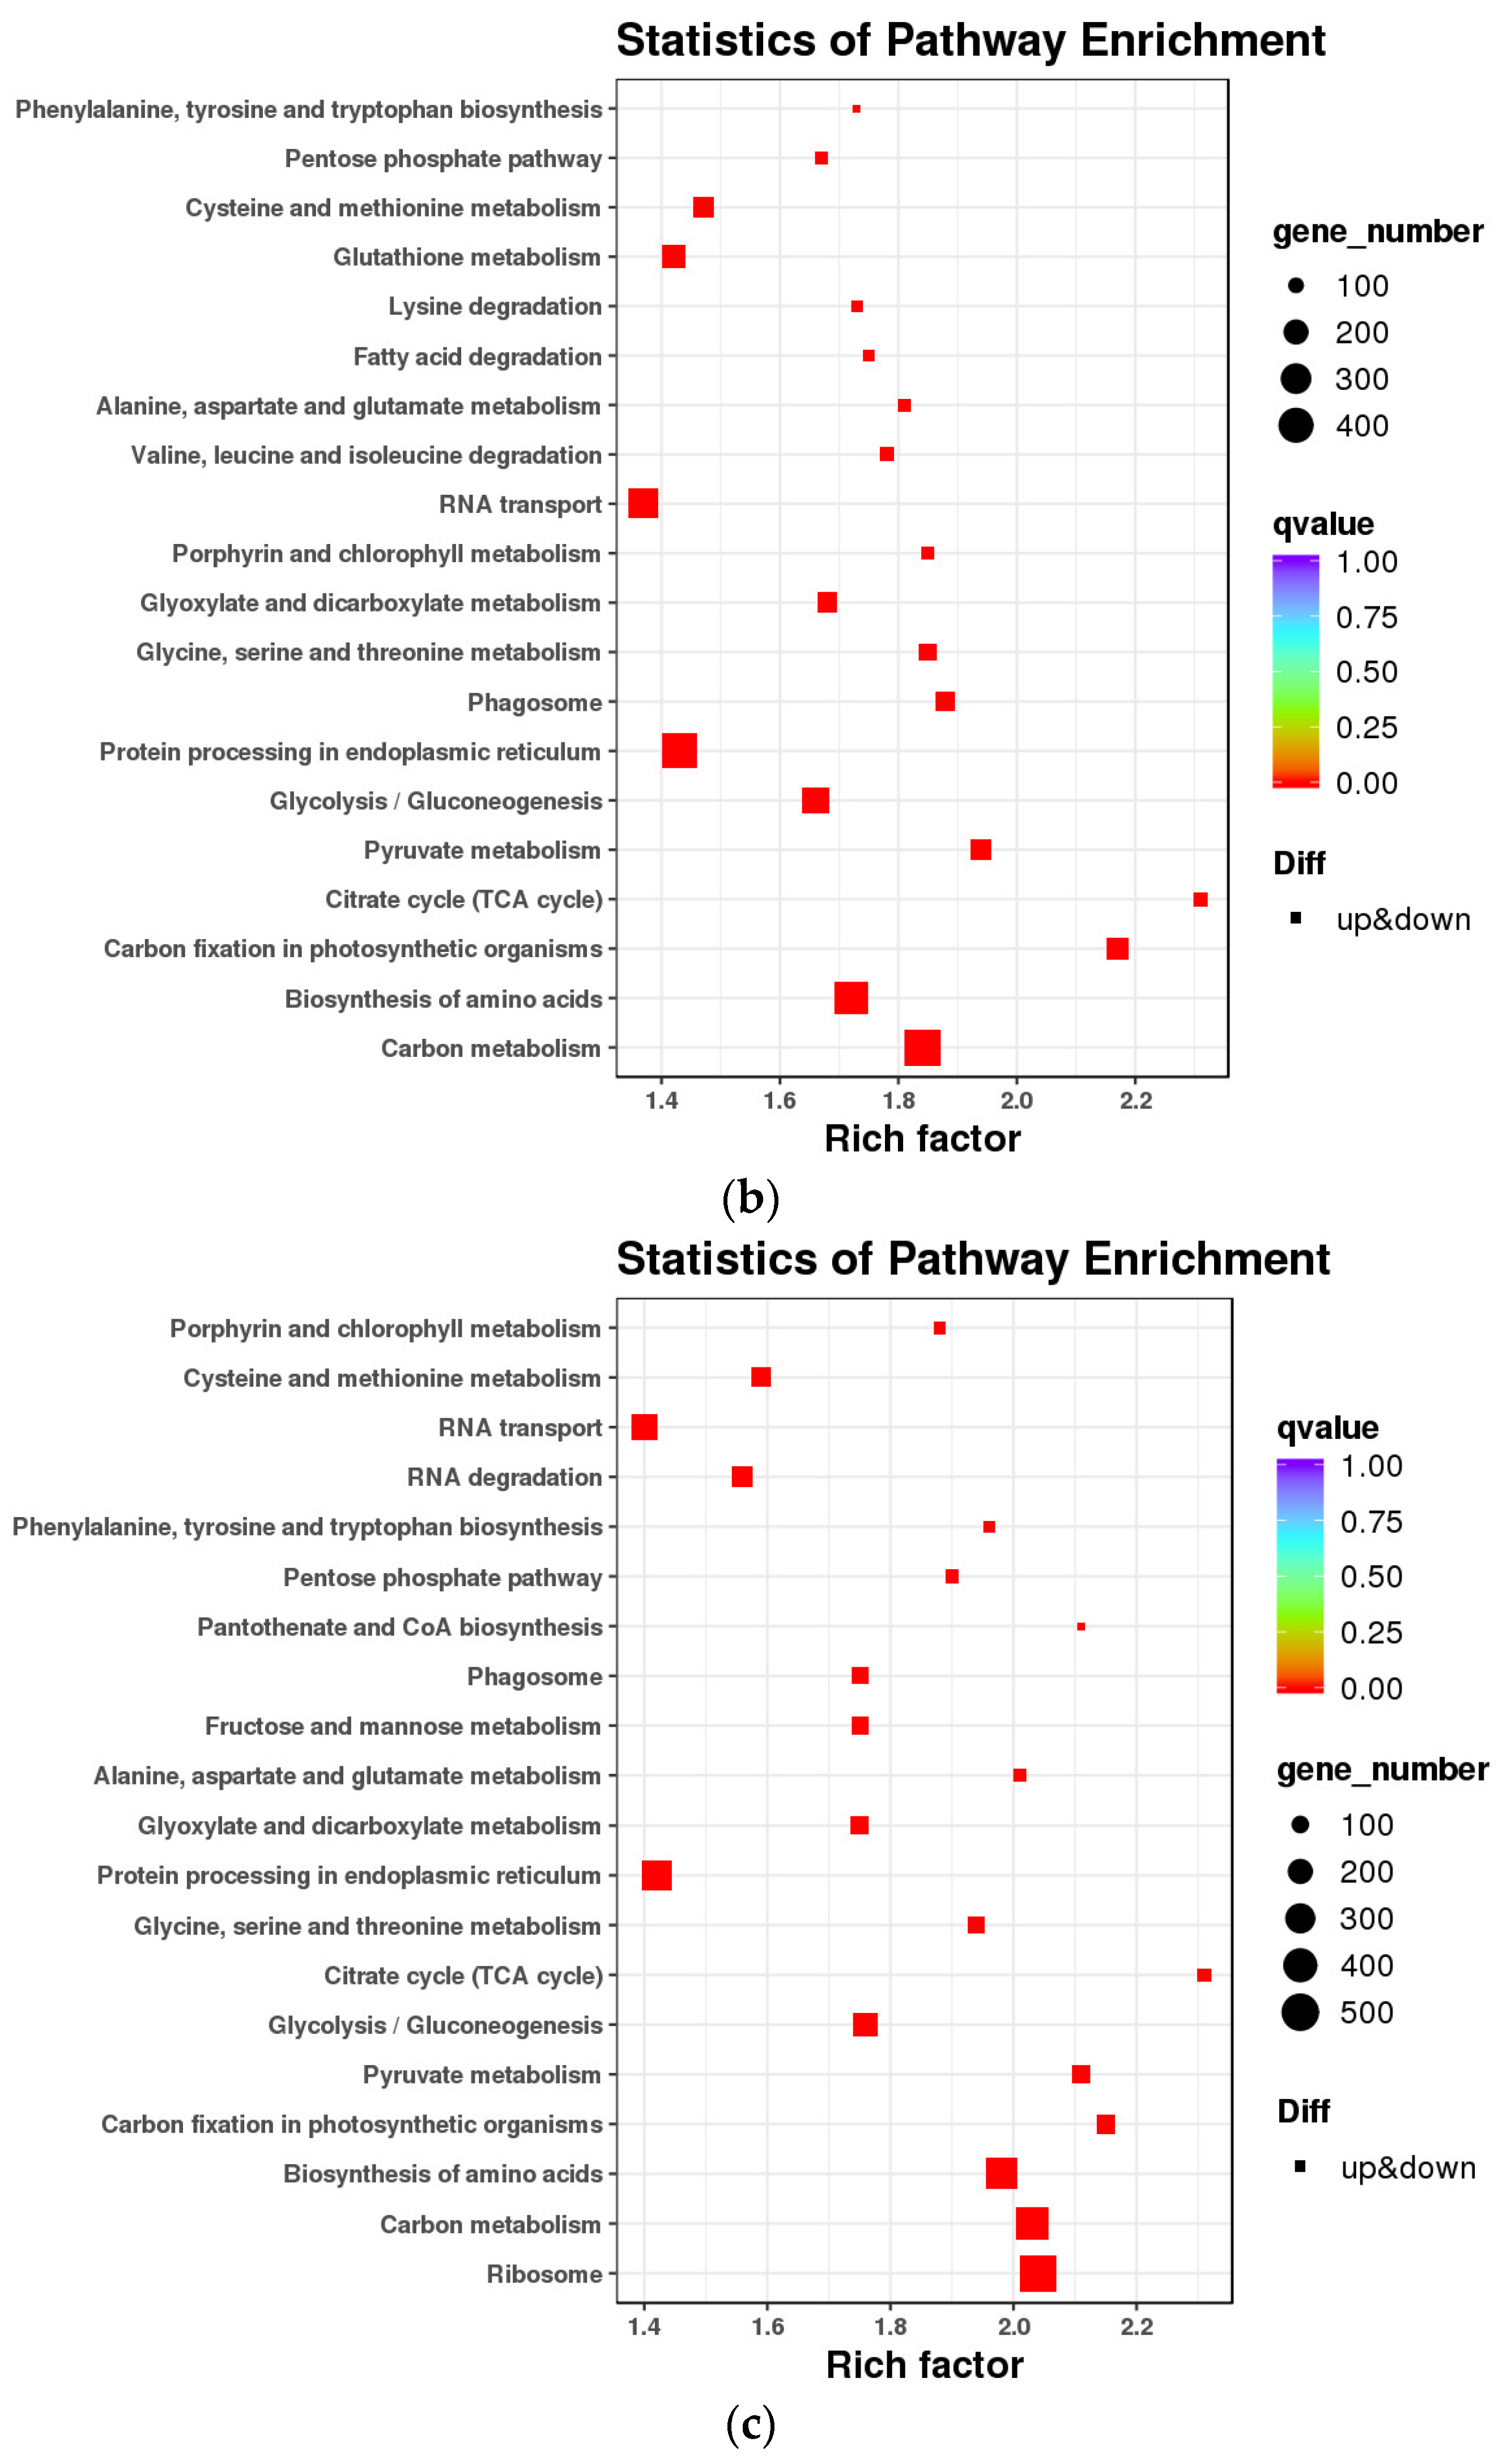
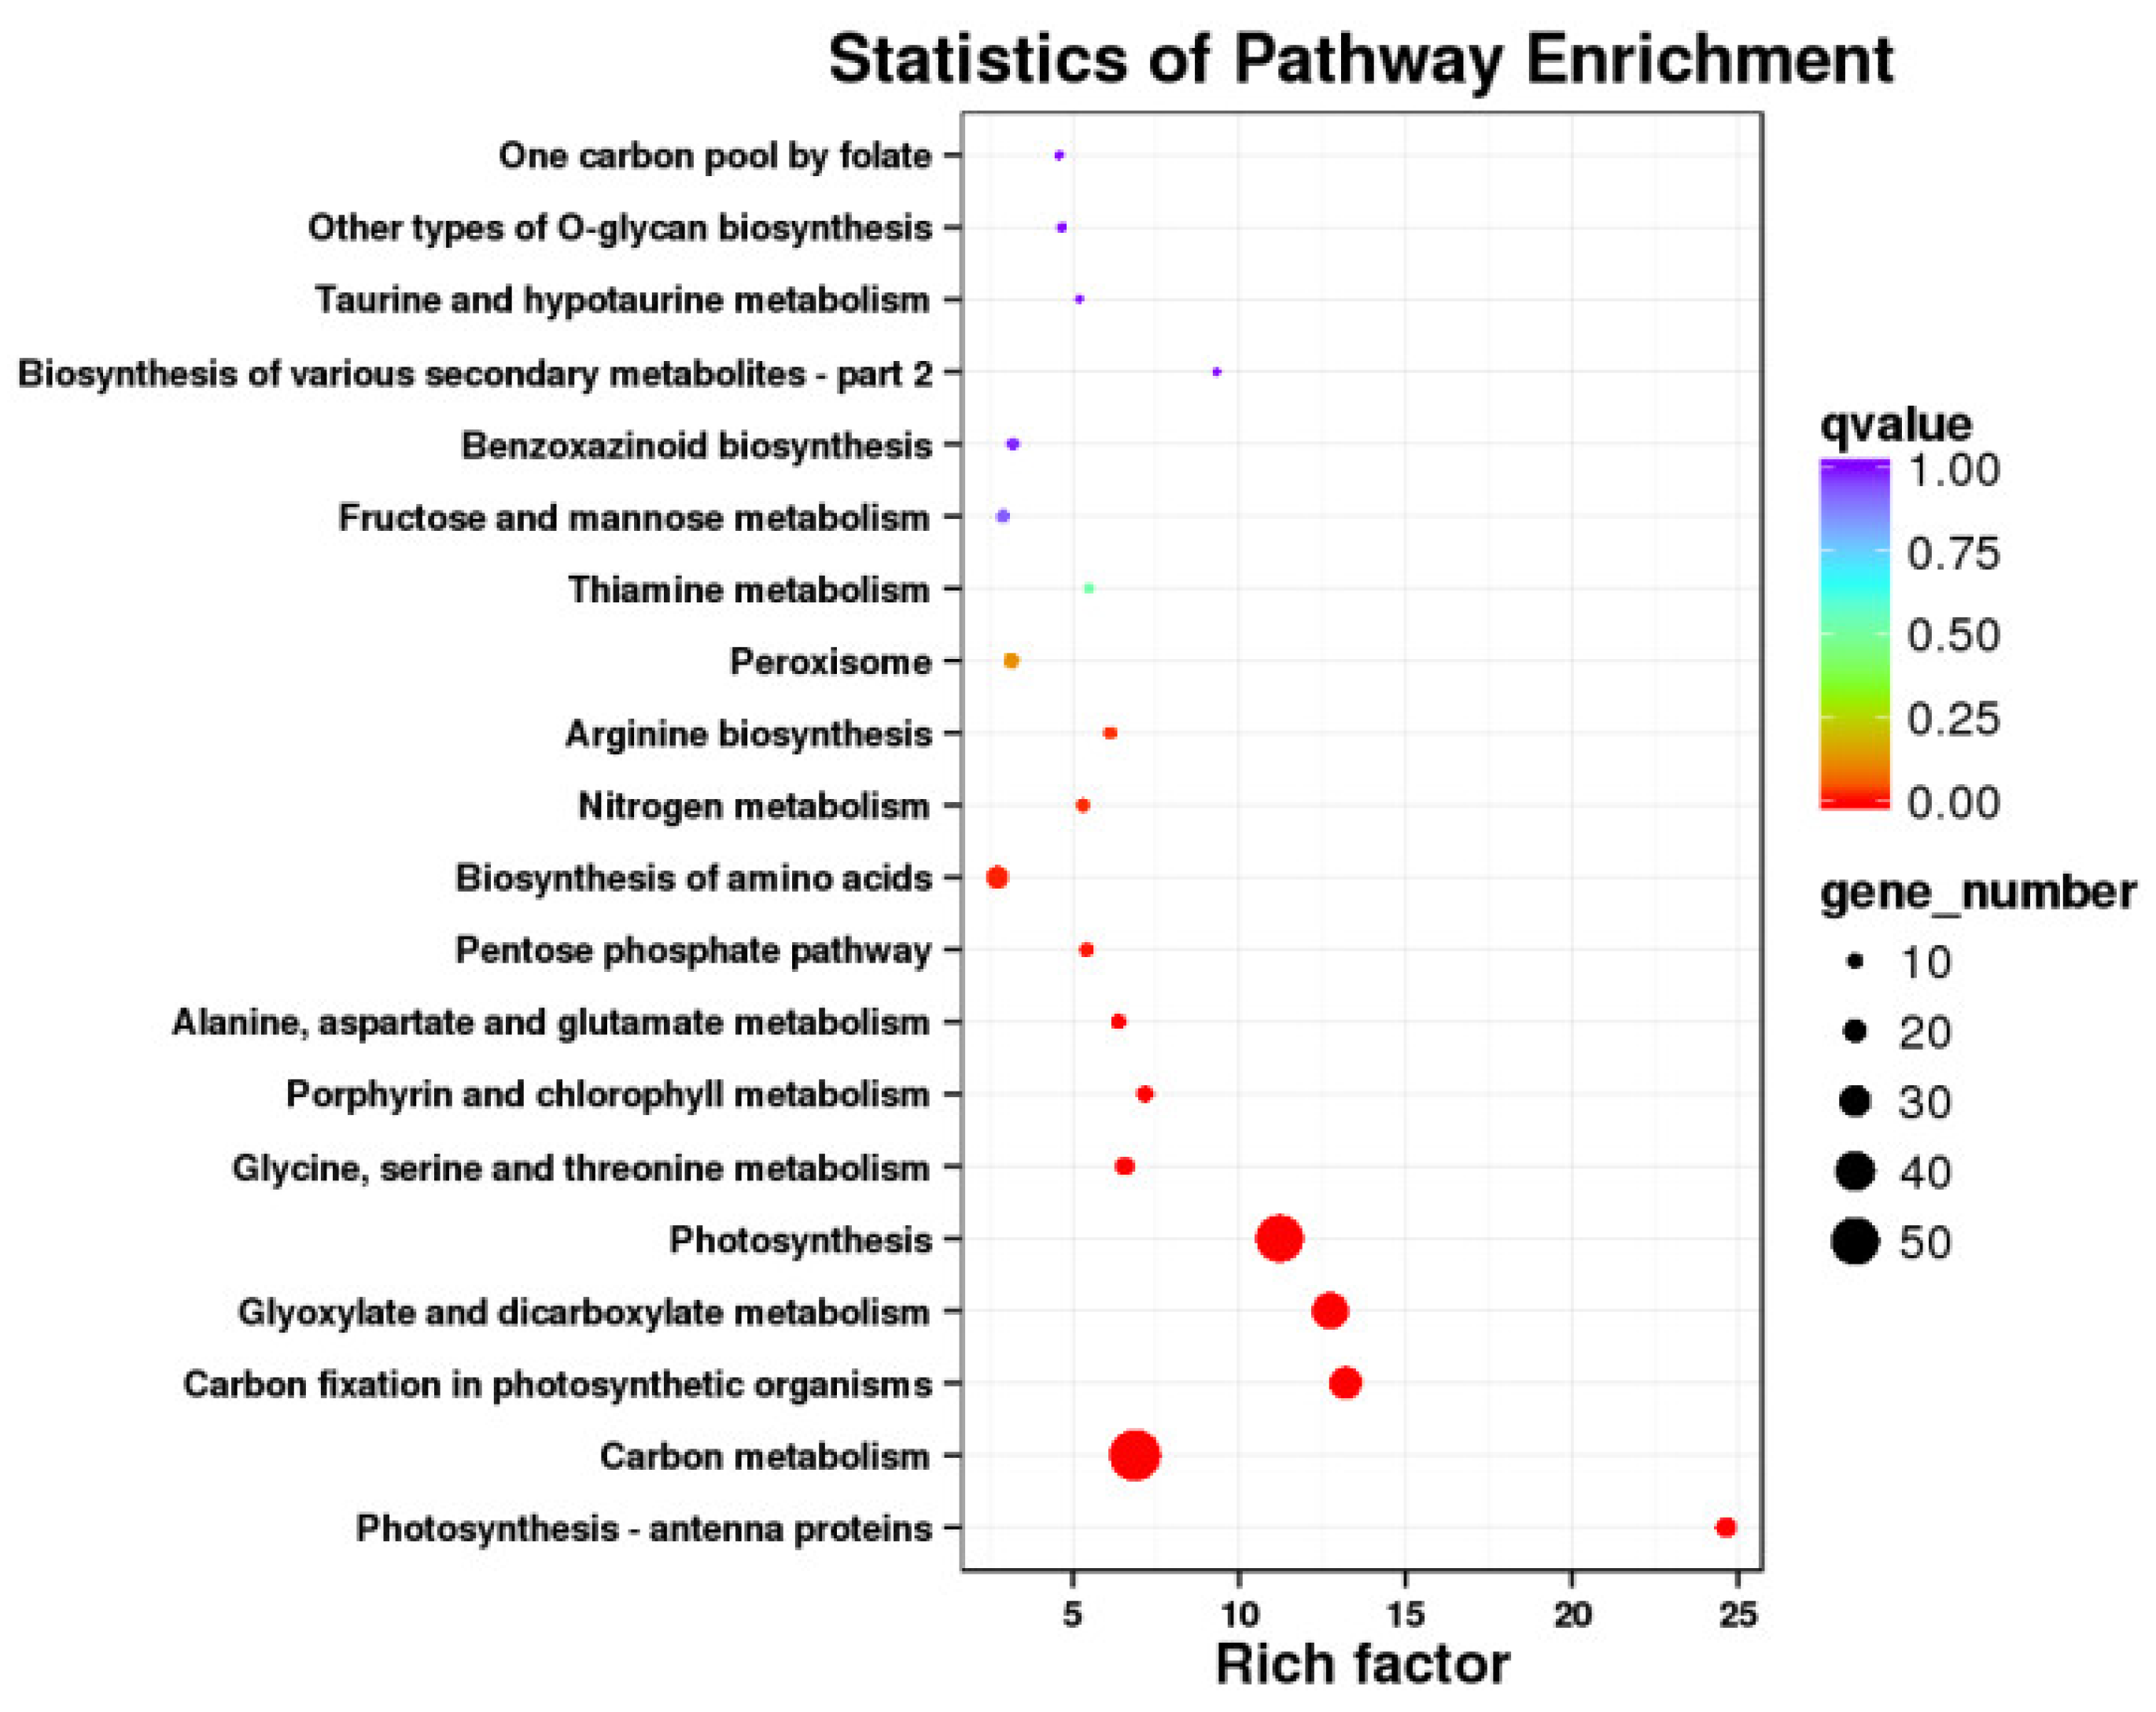
2.5. KEGG Pathway Enrichment Analysis of DEGs

Kyoto Encyclopedia of Genes and Genomes (KEGG) was used to examine the DEGs participating in signal transduction and metabolism pathways. The top 20 pathways that were considerably enriched and had the lowest q-value were chosen after the DEGs and KEGG databases were compared (Figure 4).
Carbon metabolism had the highest gene enrichment (121DEGs) and photosynthesis-antenna proteins had the highest enrichment factor value (8.98) at the mid-filing stage. Only up regulated genes were enriched in photosynthetic antenna proteins and photosynthesis pathways, while only down regulated genes were enriched in the C5-Branched dibasic acid metabolism pathway. During the late-filing stage, carbon metabolism had the largest gene enrichment (480 DEGs), the endoplasmic reticulum’s protein processing had the second-highest enrichment factor value (442 DEGs), tricarboxylic acid cycle (TCA cycle) had the highest enrichment factor value (2.31). During the mature stage, ribosome (525 DEGs) and carbon metabolism (420 DEGs) were the two most strongly enriched metabolic pathway, the TCA cycle being the most highly enriched factor value (2.31).

2.6. Candidate Genes Related to Abnormal Kernels Development

The shared DEGs in infected and control samples were analyzed using venn diagram, which continuously differentially expressed in three growth stages of wheat, were selected as candidate genes. A total of 1592 DEGs were screened that were shown in Figure 5. Heatmap of constantly expressed DEGs was displayed in Figure 6, 506 genes were shown to be consistently up-regulated. The KEGG annotation showed that the 506 DEGs play major roles in pathways including photosynthesis, carbon metabolism, carbon fixation in photosynthetic organisms, and glyoxylate and dicarboxylate metabolism (Figure 7).

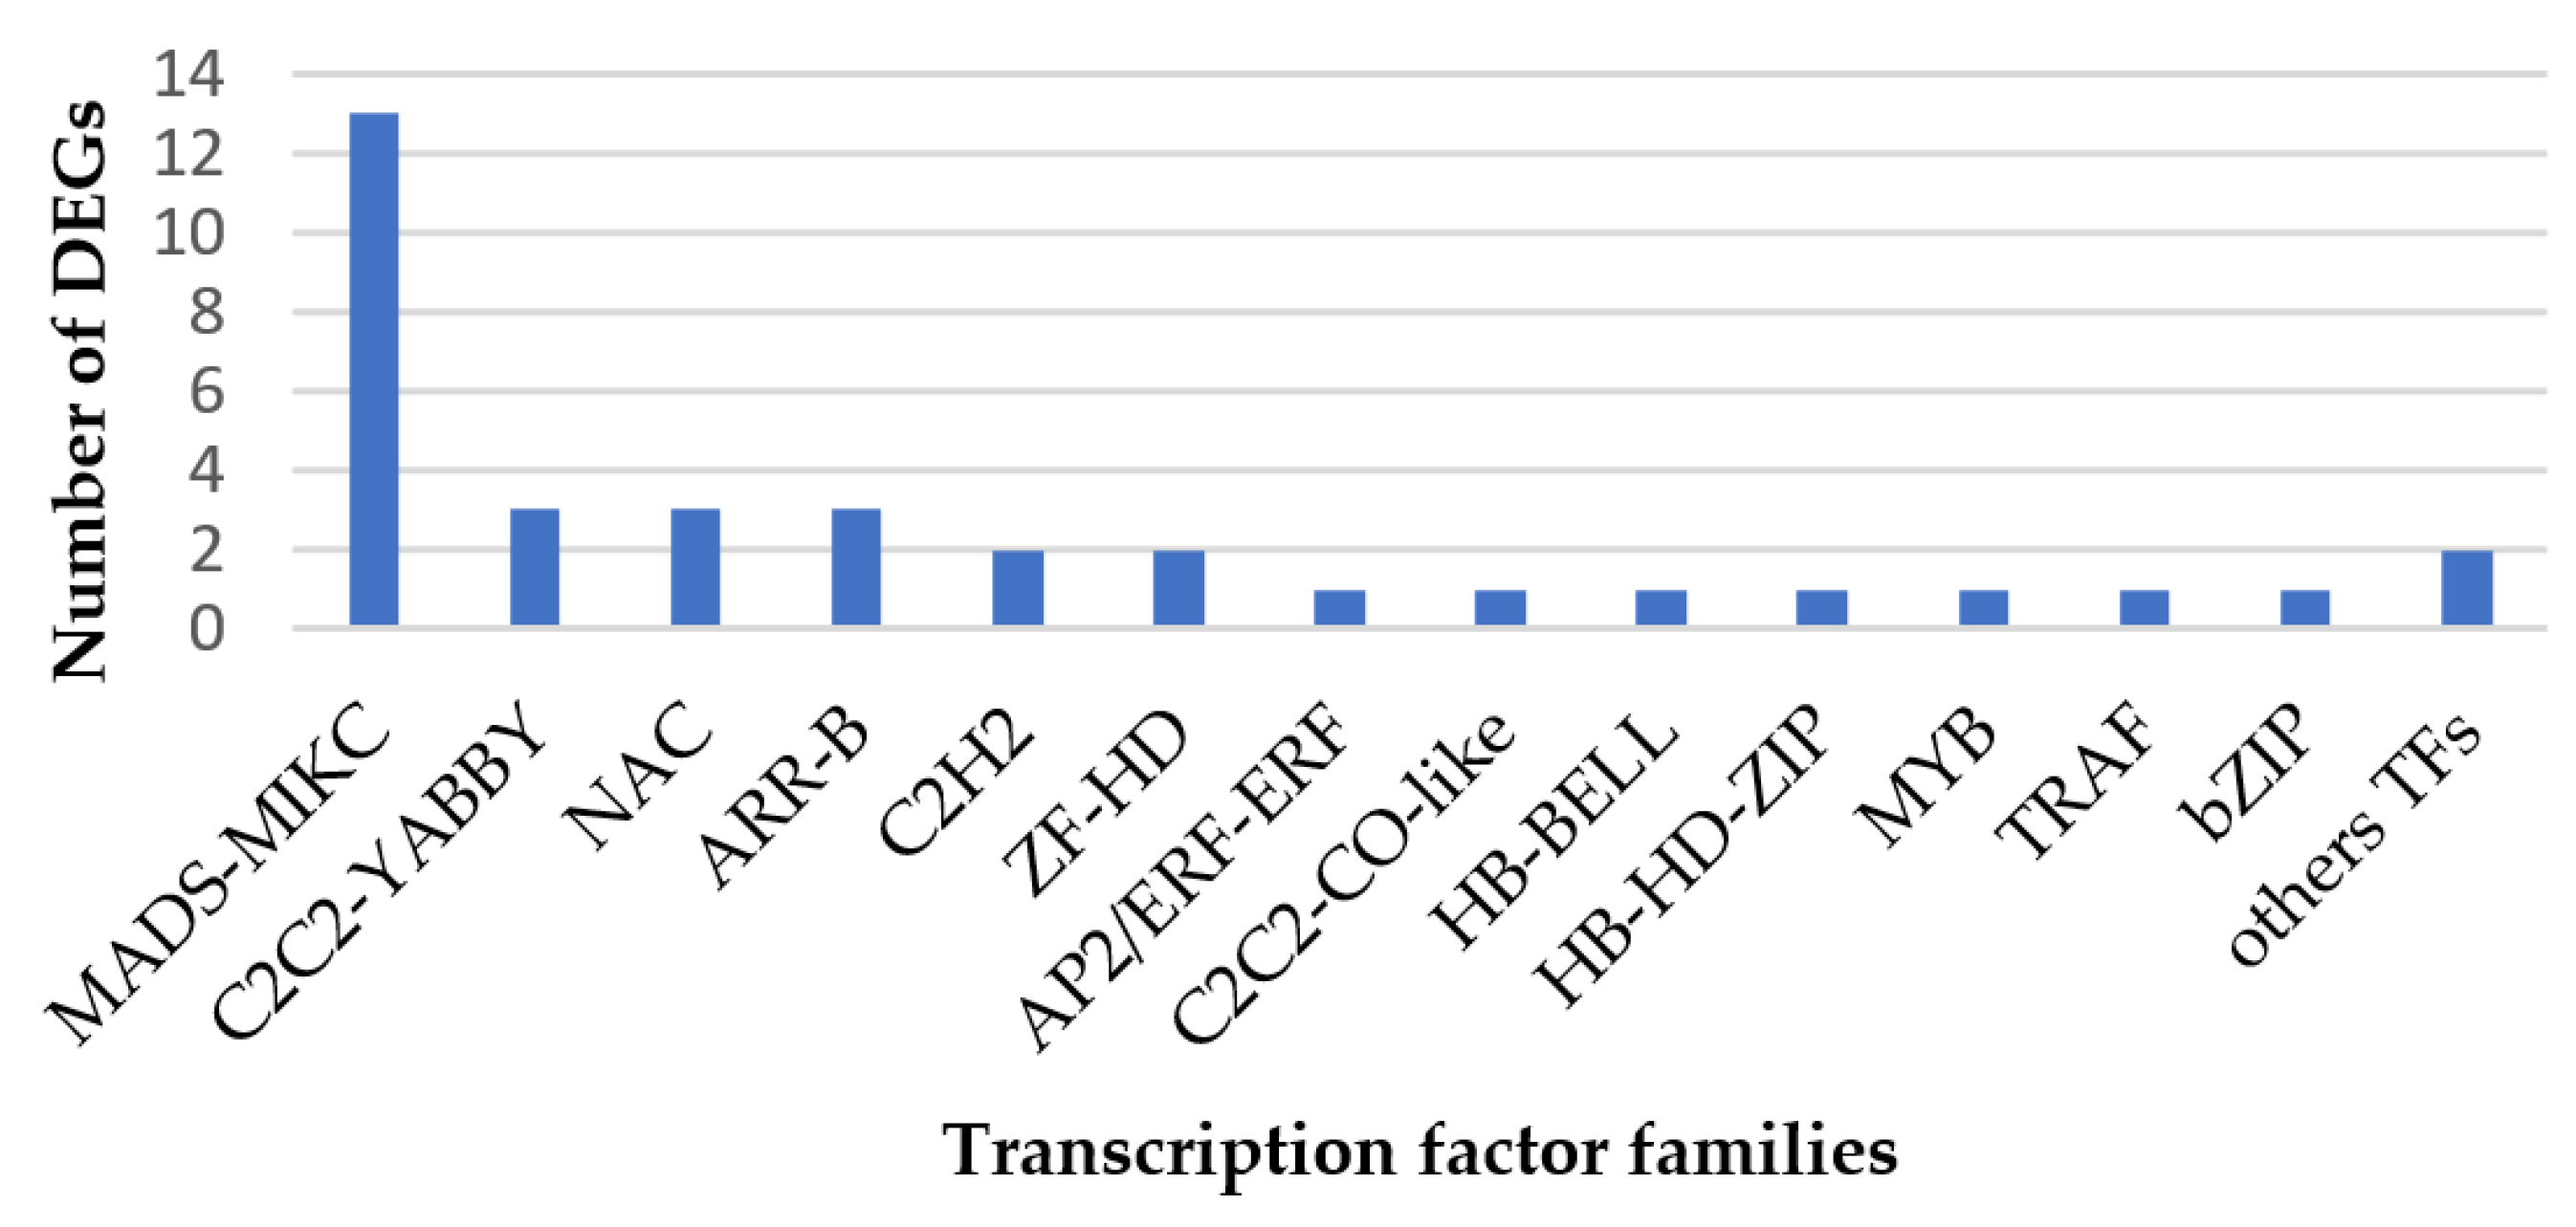
2.7. Transcription Factors Prediction

Transcription factors (TFs) are key components involved in the transcriptional regulatory system. A total of 5050 TFs were identified in three growth periods; among them, 127 TFs were identified to be consistently differentially expressed, 35 of which were shown to be continuously up-regulated during the three growth periods. These TFs included 13 MADS-MIKC, 3 C2C2-YABBY, 3 NAC, 3 ARR-B, 2 C2H2, 2 ZF-HD, 1 AP2/ERF-ERF, 1 C2C2-CO-like, 1 HB-BELL, 1 HB-HD-ZIP, 1 MYB, 1 TRAF, 1 bZIP, and 2 other TFs (Figure 8).

2.8. DEGs Related to Plant Hormone Biosynthesis

DEGs related to the plant hormones of infected kernels were analyzed. A total of 32 genes were continuously differentially expressed in three stages (Table 2). Most of these DEGs were down-regulated in infected kernels; only three DEGs were continuously up-regulated. These DEGs were enriched in the pathway of plant hormone signal transduction, the MAPK signaling pathway, protein processing in the endoplasmic reticulum, and glutathione metabolism.

2.9. DEGs Involved in Response to Stimulus

DEGs related to response to stimulus in infected kernels were identified. There were 61 genes that showed continuously differentially expression in the three stages. Following the annotation of KEGG, the DEGs were enriched in nine pathways, including photosynthesis–antenna proteins, protein processing in the endoplasmic reticulum, glycerophospholipid metabolism, plant hormone signal transduction, butanoate metabolism, galactose metabolism, glutathione metabolism, the MAPK signaling pathway, and alpha-linolenic acid metabolism. During the three stages, there were 19 genes that showed continuous upregulation. Most of these genes were enriched in the photosynthesis–antenna protein metabolic pathway (Table 3).

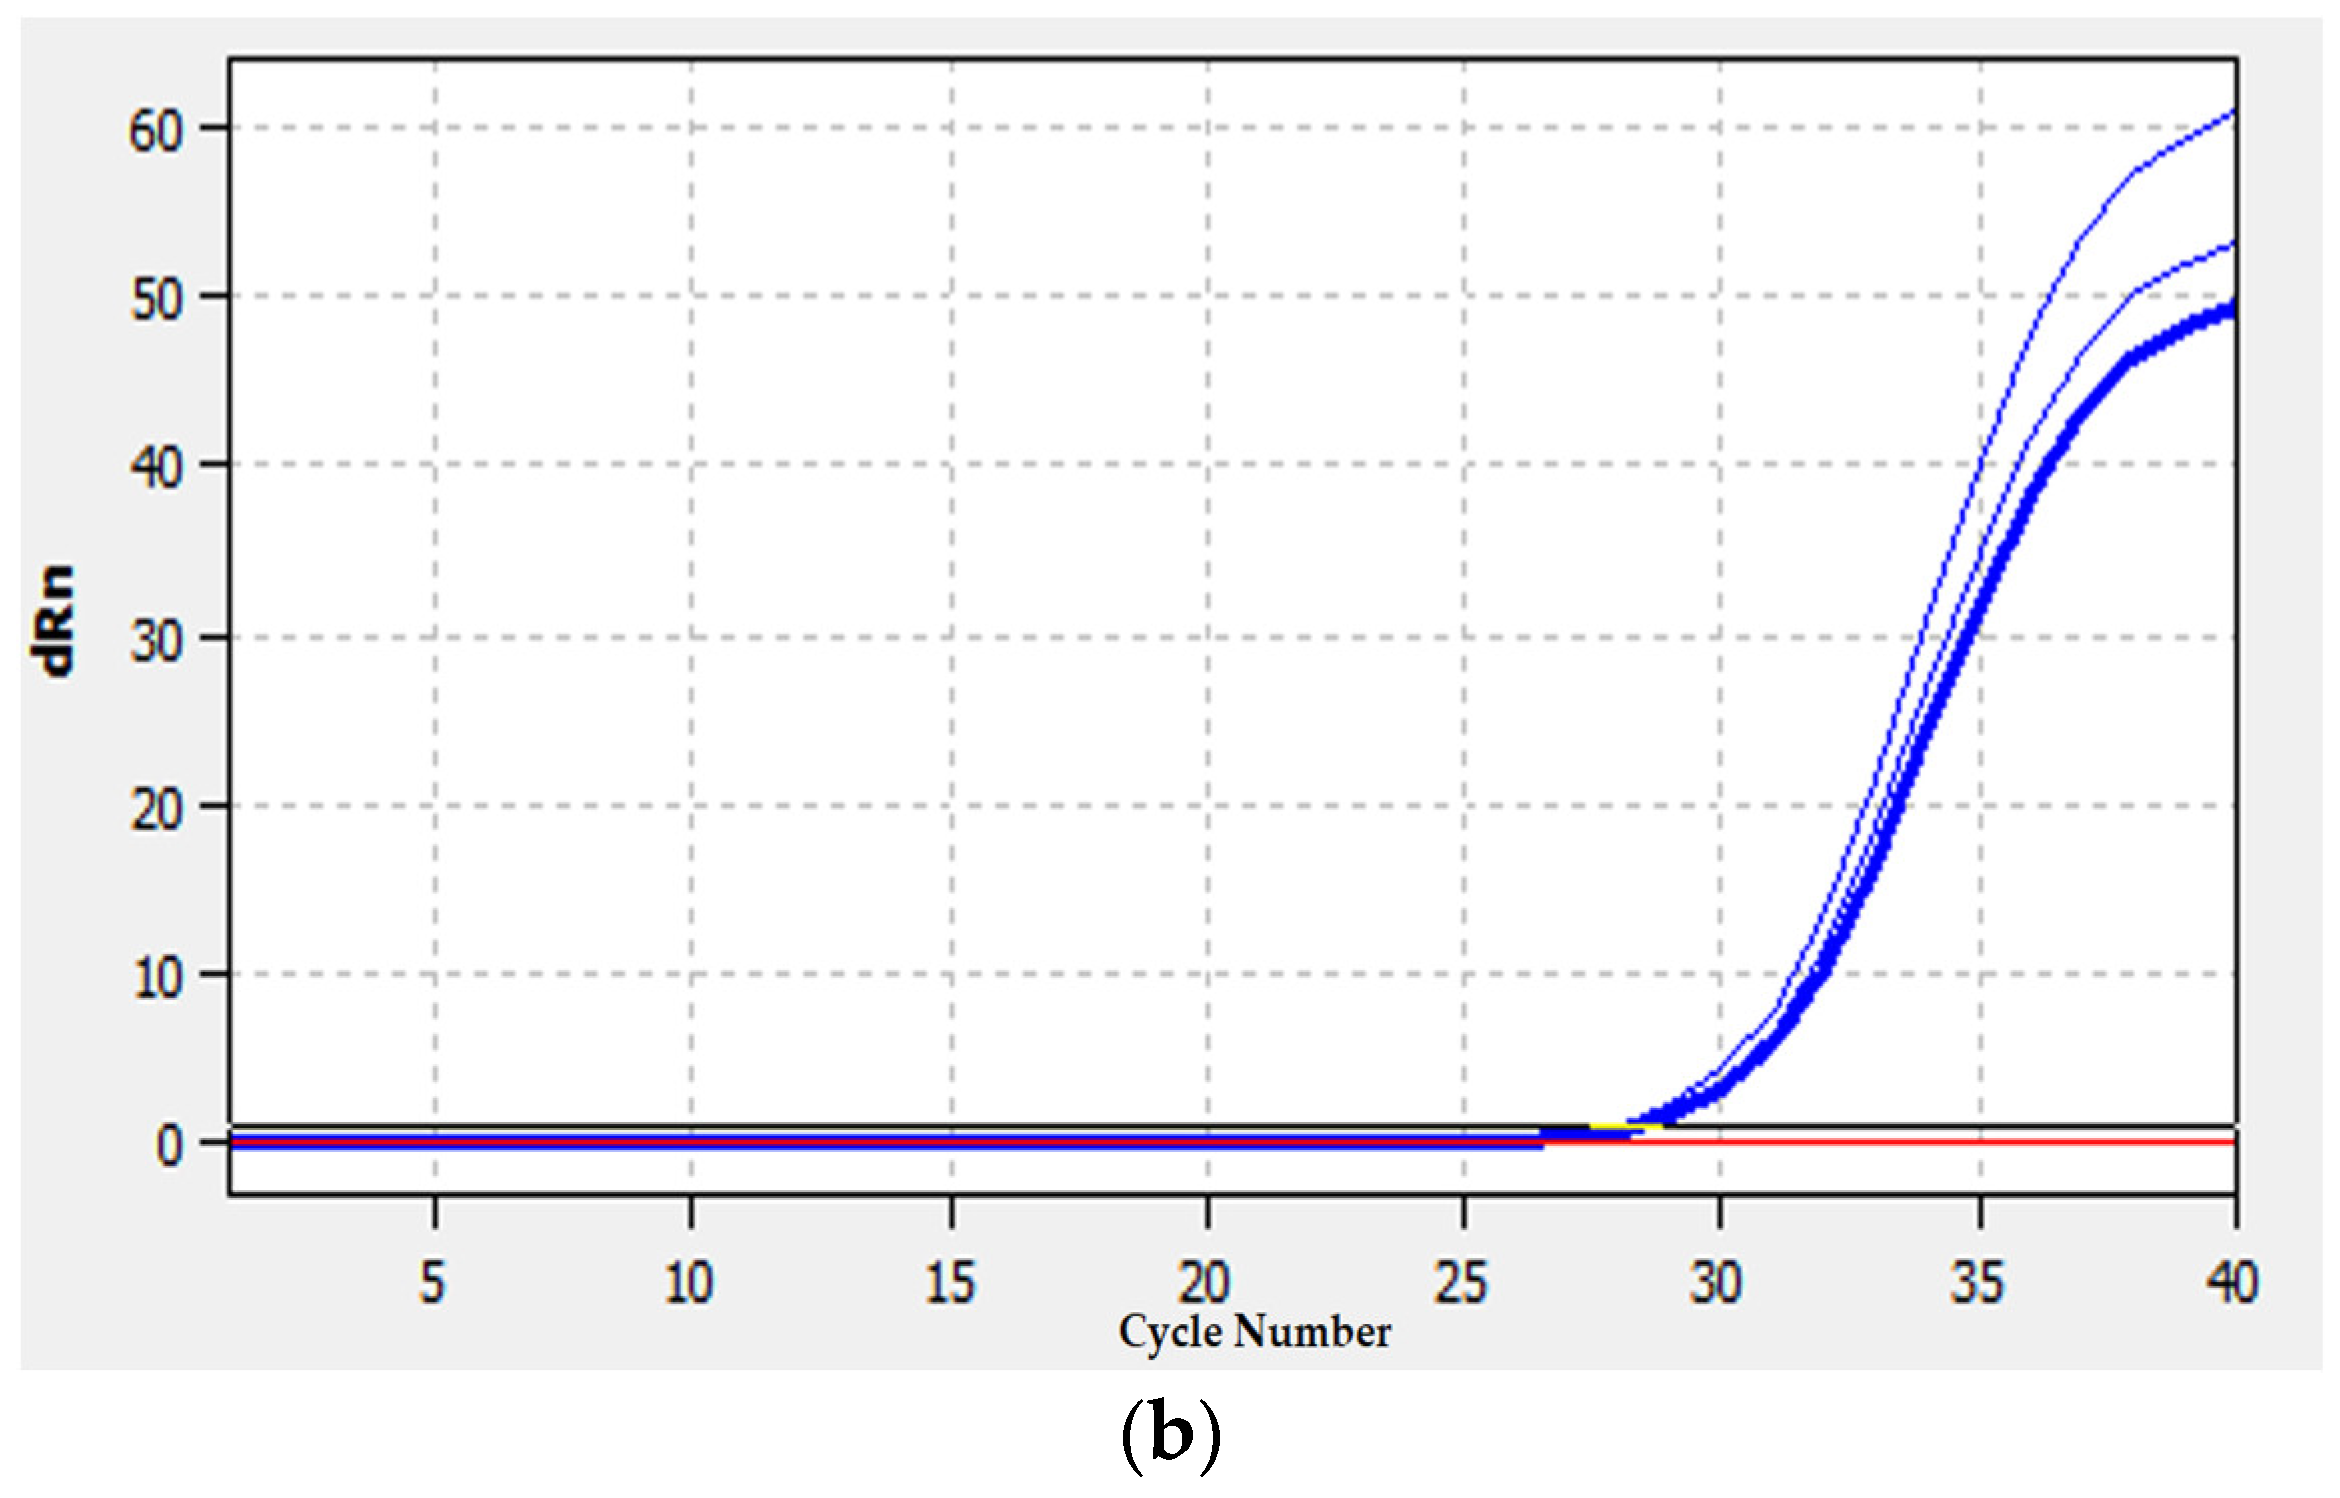
2.10. qRT-PCR Analysis

The expression level of 24 randomly selected DEGs was detected by qRT-PCR. The expression results were consistent with the results of RNA-Seq analysis (Table 4, Figure 9). This indicated that the results of RNA sequencing were reliable.

3. Discussion

The occurrence of and change in biological processes were closely related to the regulation of gene expression and the transcriptome. Proteins encoded by mRNA play a major role in life activities. These mRNAs are the bond that connects genes to proteins, and are the most important form of regulation. In order to clarify the molecular mechanism of the abnormal development of kernels in wheat infected by TCK, RNA-Seq was used to analyze the transcription level of three growth stages of the wheat cultivar Yili053. The results suggested that the TCK infection could cause changes in the transcriptome in wheat, that is, these DEGs might be related to the abnormal development of kernels.
There were 3930, 28,422, and 20,874 DEGs in Yili 053 during the mid-filling stage, the late-filling stage, and maturity stage, respectively. The late-filling stage had the highest number of DEGs. Therefore, it was concluded that the late-filling stage was the key stage at which wheat kernels respond to infection by TCK. The results of GO annotation showed that a lot of DEGs were enriched in biological regulation, metabolic processes, and the response to stimulus. The GO results support that the infection of pathogen could change the primary (plant growth) and secondary (defensive reaction) metabolism of plants. This indicated that energy is expended via the metabolism in relation to plant defense [26,27,28,29]. Ren et al. [30] clarified that a large number of genes related to cellular and metabolic processes are differentially expressed in wheat after infection by TCK. The results of this study were consistent with those of previous studies.
KEGG analysis showed that most DEGs in three growth stages of wheat were enriched in photosynthesis, carbon metabolism, and carbon fixation in photosynthetic organisms. Photosynthesis of leaves mainly serves to provide photosynthates for plant vegetative organ building, but only some of the photosynthates are transported to the developing grain [31]. After flowering, wheat leaves gradually age, and photosynthetic function decreases. At this time, non-leaf photosynthetic organs such as the spike, peduncle, and sheath of wheat can still proceed with photosynthesis, and provide carbon assimilates for wheat grain filling [32]. Our results showed that the wheat may achieve grain filling by enhancing grain photosynthesis after TCK infection.
Transcription factors play an important role in regulating plant growth and development. Our studies showed that 13 MADS-MIKC transcription factors were continuously up-regulated, and played an important role in regulating the maturation and senescence of eukaryotes. MADS-box transcription factors could affect the integrity of cell walls by regulating the expression of PKC genes in the phosphatidylinositol signaling system [33]. NAC transcription factors play an important role in almost every stage of growth and stress conditions in plants [34,35]. However, in our study, only two NAC transcription factors were continuously up-regulated; the reasons for this will be studied in the future. ZF-HD family proteins were widely distributed in terrestrial plants [36]. Many studies have confirmed that plant ZF-HD transcription factors are involved in many biological processes, such as growth, abiotic stress, and plant hormone response [37]. In our study, it was found that ZF-HD transcription factor could also respond to biotic stresses such as TCK. Some 35 transcription factors were identified continuously up-regulated in infected kernels, as found using RNA-Seq. The differential expression of these transcription factors indicated that they could respond to TCK infection.
The plant hormone signal transduction pathway played an important role in the development of wheat kernels; the formation of many kernels is affected through the corresponding signal transduction pathway. Some studies have shown that polyamines, as an important plant growth regulator, have a significant effect on the grain filling of cereal crops. Spraying exogenous polyamines could significantly promote grain filling and the weight of kernels in wheat [38]. A higher ratio of abscisic acid (ABA) was beneficial to the development of endosperm cell and grain filling, which increased the rate of grain filling and the weight of kernels [39]. As a plant growth regulator, ABA can regulate the translocation of photosynthetic products to kernels, and promote the synthesis of starch [40]. At the same time, heteroauxin also promotes the accumulation of dry matter in kernels [41]. Many studies have shown that plant hormones can regulate wheat grain filling and promote the accumulation of starch, which is of great significance in the development of wheat kernels. In this study, most of the genes involved in the plant hormone signal transduction pathway showed a pattern of down-regulation, indicating that infection by TCK inhibited the plant hormone signal transduction pathway; this might be an important reason for the abnormal development of wheat kernels. The inhibition of plant hormone signal transduction leads to the failure of grain filling, and infection by TCK in wheat kernels tissue resulted in the formation of sori.

4. Materials and Methods

4.1. Fungal Material and Culture

TCK was provided by the United States Department of Agriculture, Agricultural Research Service, Aberdeen, ID, USA. The 2% soil–agar medium plates containing TCK teliospores were cultured in an incubator (MLR-352H-PC, Panasonic, Osaka, Japan) at 5 °C for 24 h light cycle. Under an automated inverted fluorescence microscope (IX83, Olympus, Tokyo, Japan), teliospore germination and hyphal development could be seen after being parafilm-covered for 60 days. The hyphae were collected, combined with distilled water, and used to inoculate wheat at a concentration of 106 spores per milliliter with an OD600 of 0.15 [18].

4.2. Plants Material and Inoculation

Wheat cultivar (Yili053) was provided by the Institute of Crop Science, Chinese Academy of Agricultural Sciences, Beijing, China, and was susceptible to TCK. The protocol in this study complied with relevant institutional, national, and international guidelines and legislation.
Wheat seeds were sterilized for 1 min with 30% NaClO and then rinsed three times with sterile water. Seeds were vernalized for a month at 5 °C in plates. Seedlings were transferred into pots with soil and organic matter in a 1:2 ratio after being vernalized, then transferred to growth chambers (ARC-36, Percival, Perry, IA, USA). Ten seedlings were planted in each pot, and six pots were utilized for inoculation, while six pots were used as controls. Wheat seedlings were grown in conditions with 14 h light/10 h dark cycle at 5 °C during the tillering stage. Additionally, wheat seedlings were raised at 25 °C throughout the boot stage. The wheat spikes were injected with 1 mL teliospore suspensions during the early boot stage, while the spikes were still covered by the leaf sheaths. The inoculation procedure was performed three times with a one-day interval [18]. Meanwhile, the control treatment samples received the same amount of sterile water, and were raised under identical circumstances.

4.3. RNA Extraction, cDNA Library Construction, and Sequencing

Kernels from three distinct heads of the wheats that had been inoculated and the controls were collected at the mid-filling stage, late-filling stage, and maturity stages, respectively. Each treatment contained three replications. Kernel samples were promptly flash-frozen in liquid nitrogen and stored at −80 °C. Total RNA was extracted from the infected and control samples at specific periods using the TRNzol Universal Reagent Kit (Tiangen, Beijing, China), following the manufacturer’s instructions. The purity and concentration of the RNA were detected using NanoDrop 2000 (Thermo Fisher Scientific, Wilmington, DE, USA). RNA integrity was assessed using the RNA Nano 6000 Assay Kit (Agilent Technologies, Santa Clara, CA, USA). mRNA was enriched using poly-T oligo-attached magnetic beads, followed by the enzymatic fragmentation; first-strand cDNA was synthesized using a random hexamer primer and M-MuLV reverse transcriptase, while the second strand was synthesized using RNase H and a DNA polymerase I system. The ds-cDNA samples were then purified using an AMPure XP system (Beckman Coulter, Beverly, MA, USA) followed by A-tailing, adapter ligation, and then enrichment by PCR. The PCR products were purified with an AMPure XP system, and the quality of the library was assessed with an Agilent Bioanalyzer 2100 system [30]. Sequencing was carried out with an Illumina HiSeq2500 system at Biomarker Technologies Co. Ltd. (Beijing, China).

4.4. Quality Control, Mapping, and DEGs Screening

After removing adaptor sequences, low-quality reads, and reads containing ploy-N, the raw data were converted into clean reads, and Q30 and GC content were computed. The Hisat2 (v2.0.4) tool [42] was used to map the clean reads to the IWGSC RefSeq 1.1 reference genome with default configuration. Cufflinks (version 2.2.1) was used to measure FPKM (reads per kilobase of exon model per million mapped reads) values [43], then the DEGs between infected and control samples in three periods were assessed with DESeq2 [44] R package (v1.6.3). An adjusted p-value < 0.01 and log2FC (fold change) > 1.5 were chosen as the thresholds for significantly different expression. Candidate genes related to abnormal kernel development were those in which differential expression was consistently observed within the three periods between infected and control kernels.

4.5. Functional Annotation of DEGs

Gene ontology [45] was implemented with the GOseq R package (v3.10.1) based on Wallenius non-central hyper-geometric distribution [46], which can adjust for gene length bias in DEGs. p-values < 0.05 were considered significant GO terms. Clusters of orthologous group terms (COG) [47] and Kyoto Encyclopedia of Genes and Genomes (KEGG) [48] enrichment analyses were carried out to predict possible functional classifications and molecular pathways, respectively. COG is a protein database generated by comparing the protein sequences of complete genomes. Each cluster contains proteins or groups of paralogs from at least three lineages. We used an eggnog-mapper to predict functions. KEGG [49] is a database resource for understanding the high-level functions and utilities of biological systems, such as the cell, the organism and the ecosystem, from molecular level information, especially large-scale molecular datasets generated by genome sequencing and other high-throughput experimental technologies (http://www.genome.jp/kegg/ (accessed on 10 March 2023)). We used KOBAS (v3.0) [50] software to count enrichment of DEGs in KEGG pathways.

4.6. Validation of RNA-Seq Results Using qRT-PCR

The expression profiles of randomly selected DEGs at different growth stages were analyzed using qRT-PCR. The GAPDH gene was used as an endogenous control [51]. Table 5 contains a list of the primers used in this experiment. Three replicates were employed for each gene. qTOWER 2.0/2.2 quantitative real-time PCR thermal cyclers (Jena, Germany) were used to conduct qRT-PCR. Reverse transcription was performed using a TUREscript first-stand cDNA SYNTHESIS Kit (AiDLAB Biotech, Beijing, China) according to the manufacturer’s instructions. SYBR® Green (Thermo Fisher) was used as a detection dye. All genes underwent pre-denaturation for 3 min at 95 °C, followed by 40 cycles of 95 °C for 10 s (denaturation), 60 °C for 30 s (extension), and 72 °C for 30 s in a 20 uL reaction volume. The specificity of the amplification was verified by a melt curve analysis (from 60 to 95 °C). The 2−ΔΔCt method was used to determine each gene’s expression level [52].

5. Conclusions

In this study, the transcriptome characteristics of infected and healthy kernels at three time points were analyzed. As far as we know, this is the first manuscript that describes the abnormal development of wheat kernels affected by TCK at the molecular level. There were 3930 DEGs selected at the mid-filling stage, 28,422 DEGs at the late-filling stage, and 20,874 genes at the maturity stage. Additionally, we predicted 13 MADS-MIKC transcription factors, which were crucial for regulating the maturation and senescence of eukaryotes. We have found 21 genes related to the plant hormone signaling transduction pathway, and 61 genes related to the response to stimulus. A total of 26 of them were successfully validated by our qPCR analysis. These identified putative target genes may be related to the abnormal development of kernels infected by TCK. These results will aid in our understanding of TCK’s infection mechanism, which will provide a theoretical framework for its scientific management.

Author Contributions

Conceptualization, Q.L.; methodology, S.S.; software, Z.Z.; validation, T.S. and J.C.; formal analysis, S.S.; investigation, T.S.; writing—original draft preparation, S.S. and Z.Z.; writing—review and editing, Q.L. and J.C.; visualization, Z.Z.; project administration, Q.L.; funding acquisition, Q.L. All authors have read and agreed to the published version of the manuscript.

Funding

This research was funded by the National Natural Science Foundation of China (32360659 and 31860477).

Institutional Review Board Statement

This study did not require ethical approval.

Informed Consent Statement

Not applicable.

Data Availability Statement

Data are contained within the article.

Conflicts of Interest

The authors declare no conflict of interest.

References

  1. Jia, W.M.; Zhou, Y.L.; Duan, X.Y.; Yong, L.O.; Ding, S.L.; Cao, X.R.; Bruce, D.F. Assessment of risk of establishment of wheat dwarf bunt (Tilletia controversa) in China. J. Integr. Agric. 2013, 12, 87–94. [Google Scholar] [CrossRef]
  2. Shakoor, M.A.; Ahmad, M.; Ghazali, H.Z.; Ahmad, S.; Balouch, M.A.; Anjum, R.; Hussain, M. Chemotherapy of karnal bunt of wheat. Int. J. Adv. Res. Biol. Sci. 2014, 1, 163–188. [Google Scholar]
  3. Hoffmann, J.A. Bunt of wheat. Plant Dis. 1982, 66, 979–986. [Google Scholar] [CrossRef]
  4. Trione, E.J. Dwarf bunt of wheat and its importance in international wheat trade. Plant Dis. 1982, 66, 1083–1088. [Google Scholar] [CrossRef]
  5. Holton, C.S. Preliminary investigations of dwarf bunt of wheat. Phytopathology 1941, 31, 74–82. [Google Scholar]
  6. Wagner, F. Occurrence, spore germination, and infection of dwarf bunt on wheat. Z. Pflanzenkrankh. Pflanzenpathol. Pflanzensch. 1950, 1, 1–13. [Google Scholar]
  7. Slinkard, A.E.; Ellicitt, F.C. The effect of bunt incidence on the yield of wheat in eastern Washington. Agron. J. 1954, 46, 439–441. [Google Scholar] [CrossRef]
  8. Baylis, R.J. Studies of Tilletia controversa, the cause of dwarf bunt of winter. Can. J. Bot. 1958, 36, 17–32. [Google Scholar] [CrossRef]
  9. Tyler, L.J.; Jensen, N.F. Some factors that influence development of dwarf bunt in winter wheat. Phytopathology 1958, 48, 565–571. [Google Scholar]
  10. Purdy, L.H.; Kendrick, E.L.; Hoffmann, J.A.; Holton, C.S. Dwarf bunt of wheat. Annu. Rev. Microbiol. 1963, 17, 199–222. [Google Scholar] [CrossRef]
  11. Martens, J.; Seaman, W.W.; Atkinson, T.H. Diseases of Field Crops in Canada: An Illustrated Compendium; Canadian Phytopathological Society: Harrow, ON, USA, 1984; 160p. [Google Scholar]
  12. Muhae-Ud-Din, G.; Chen, D.; Liu, T.; Chen, W.; Gao, L. Characterization of the wheat cultivars against Tilletia controversa Kühn, causal agent of wheat dwarf bunt. Sci. Rep. 2020, 10, 9029. [Google Scholar] [CrossRef] [PubMed]
  13. Aggarwal, R.; Singh, D.V.; Srivastava, K.D. Studies on the ontogeny of teliospore ornamentation of Neovossia indica observed through scanning electron microscopy. Indian Phytopathol. 1999, 52, 417–419. [Google Scholar]
  14. Cohn, J.; Sessa, G.; Martin, G.B. Innate immunity in plants. Curr. Opin. Immunol. 2001, 13, 55–62. [Google Scholar] [CrossRef] [PubMed]
  15. Gurjar, M.S.; Jain, S.; Aggarwal, R.; Saharan, M.S.; Kumar TP, J.; Kharbikar, L. Transcriptome analysis of wheat–Tilletia indica interaction provides defense and pathogenesis-related genes. Plants 2022, 11, 3061. [Google Scholar] [CrossRef] [PubMed]
  16. Frey, M.; Schullehner, K.; Dick, R.; Fiesselmann, A.; Gierl, A. Benzoxazinoid biosynthesis, a model for evolution of secondary metabolic pathways in plants. Phytochemistry 2009, 70, 1645–1651. [Google Scholar] [CrossRef] [PubMed]
  17. Xu, T.S.; Qin, D.D.; Muhae-Ud-Din, G.; Liu, T.G.; Chen, W.Q.; Gao, L. Characterization of histological changes at the tillering stage (Z21) in resistant and susceptible wheat plants infected by Tilletia controversa Kühn. BMC Plant Biol. 2021, 21, 49. [Google Scholar] [CrossRef] [PubMed]
  18. He, T.; Ren, Z.; Muhae-Ud-Din, G.; Guo, Q.; Liu, T.; Chen, W.; Gao, L. Transcriptomics Analysis of Wheat Tassel Response to Tilletia laevis Kühn, Which Causes Common Bunt of Wheat. Front. Plant Sci. 2022, 13, 823907. [Google Scholar] [CrossRef] [PubMed]
  19. Liu, J.; Sun, L.; Chen, Y.; Wei, L.; Hao, Y.; Yu, Z.; Wang, Z.; Zhang, H.; Zhang, X.; Li, M.; et al. The Regulatory Network of CMPG1-V in Wheat-Blumeria graminis f. sp. tritici interaction revealed by temporal profiling using RNA-Seq. Int. J. Mol. Sci. 2020, 21, 5967. [Google Scholar] [CrossRef]
  20. Kumar, J.; Gunapati, S.; Kianian, S.F.; Singh, S.P. Comparative analysis of transcriptome in two wheat genotypes with contrasting levels of drought tolerance. Protoplasma 2018, 255, 1487–1504. [Google Scholar] [CrossRef]
  21. Zou, H.; Tzarfati, R.; Hübner, S.; Krugman, T.; Fahima, T.; Abbo, S.; Saranga, Y.; Korol, A.B. Transcriptome profiling of wheat glumes in wild emmer, hulled landraces and modern cultivars. BMC Genom. 2015, 16, 777. [Google Scholar] [CrossRef]
  22. Liu, Y.; Hou, J.; Wang, X.; Li, T.; Majeed, U.; Hao, C.; Zhang, X. The NAC transcription factor NAC019-A1 is a negative regulator of starch synthesis in wheat developing endosperm. J. Exp. Bot. 2020, 71, 5794–5807. [Google Scholar] [CrossRef] [PubMed]
  23. Wei, J.; Cao, H.; Liu, J.-d.; Zuo, J.-h.; Fang, Y.; Lin, C.-T.; Sun, R.-z.; Li, W.-l.; Liu, Y.-x. Insights into transcriptional characteristics and homoeolog expression bias of embryo and deembryonated kernels in developing grain through RNA-Seq and Iso-Seq. Funct. Integr. Genom. 2019, 19, 919–932. [Google Scholar] [CrossRef] [PubMed]
  24. Gao, L.; Yu, H.; Han, W.; Gao, F.; Liu, T.; Liu, B.; Kang, X.; Gao, J.; Chen, W. Development of a SCAR marker for molecular detection and diagnosis of Tilletia controversa Kühn, the causal fungus of wheat dwarf bunt. World J. Microbiol. Biotechnol. 2014, 30, 3185–3195. [Google Scholar] [CrossRef] [PubMed]
  25. Li, C.; Wei, X.; Gao, L.; Chen, W.; Liu, T.; Liu, B. iTRAQ-based proteomic analysis of wheat bunt fungi Tilletia controversa, T. caries, and T. foetida. Curr. Microbiol. 2018, 75, 1103–1107. [Google Scholar] [CrossRef]
  26. Berger, S. Visualization of dynamics of plant-pathogen interaction by novel combination of chlorophyll fuorescence imaging and statistical analysis: Diferential efects of virulent and avirulent strains of P. syringae and of oxylipins on A. thaliana. J. Exp. Bot. 2007, 58, 797–806. [Google Scholar] [CrossRef] [PubMed]
  27. Ehness, R.; Ecker, M.; Godt, D.E.; Roitsch, T. Glucose and stress independently regulate source and sink metabolism and defense mechanisms via signal transduction pathways involving protein phosphorylation. Plant Cell. 1997, 9, 1825–1841. [Google Scholar] [CrossRef] [PubMed]
  28. Berger, S.; Sinha, A.K.; Roitsch, T. Plant physiology meets phytopathology: Plant primary metabolism and plant-pathogen interactions. J. Exp. Bot. 2007, 58, 4019–4026. [Google Scholar] [CrossRef]
  29. Siemens, J. Transcriptome analysis of Arabidopsis clubroots indicate a key role for cytokinins in disease development. Mol. Plant-Microbe Interact. 2006, 19, 480–494. [Google Scholar] [CrossRef]
  30. Ren, Z.; Liu, J.; Din GM, U.; Zhang, H.; Du, Z.; Chen, W.; Liu, T.; Zhang, J.; Zhao, S.; Gao, L. Transcriptome analysis of wheat spikes in response to Tilletia controversa Kühn which cause wheat dwarf bunt. Sci. Rep. 2020, 10, 21567. [Google Scholar] [CrossRef]
  31. Gebbing, T.; Schnyder, H. 13C Labeling kinetics of sucrose in glumes indicates significant refixation of respiration CO2 in the wheat ear. Aust. J. Plant Physiol. 2001, 28, 1047–1053. [Google Scholar]
  32. Feng, B.; Li, H.W.; Wang, F.H.; Kong, L.A.; Zhang, B.; Wang, Z.S.; Li, S.D. Photosynthetic characteristic and contribution of non-foliar photosynthetic organs to grain yield in wheat. Plant Physiol. J. 2019, 55, 32–40. [Google Scholar]
  33. Chen, T.C.; Yang, G.H.; Jiang, D.X.; Wu, S.L.; Chen, J.Q.; Xie, B.G.; Jiang, Y.J.; Chen, B.Z. Effects of MADS-box transcription factors regulated Phosphatidylinositol signalling system on Volvariella volvacea during storage. Acta Edulis Fungi 2021, 28, 11–17. [Google Scholar]
  34. Zhou, H.H.; Huang, H.; Xu, B.L.; Su, X.; Deng, R.; Hong, Y.B.; Jiang, M.; Song, F.M.; Zhang, H.J. Biological function of NAC transcription factors in plant abiotic and biotic stress responses. Plant Physiol. J. 2017, 53, 1372–1382. [Google Scholar]
  35. Sicilia, A.; Russo, R.; Caruso, M.; Arlotta, C.; Di Silvestro, S.; Gmitter, F.G., Jr.; Gentile, A.; Nicolosi, E.; Lo Piero, A.R. Transcriptome analysis of Plenodomus tracheiphilus infecting rough lemon (Citrus jambhiri Lush.) indicates a multifaceted strategy during host pathogenesis. Biology 2022, 11, 761. [Google Scholar] [CrossRef] [PubMed]
  36. Hu, W.; Pamphilis, C.W.; Ma, H. Phylogenetic analysis of the plant-specific zinc finger-homeobox and mini zinc finger gene families. J. Integr. Plant Biol. 2008, 50, 1031–1045. [Google Scholar] [CrossRef]
  37. Zhang, J.Y.; Chao, M.N.; Du, H.Y.; Yu, D.Y.; Huang, F. Cloning and expression analysis of ZF-HD transcription factor GmZHD1 in Glccine max. Acta Agric. Boreali—Sin. 2017, 32, 1–7. [Google Scholar]
  38. Liu, Y.; Wen, X.; Gu, D.; Guo, Q.; Zeng, A.; Li, C.; Liao, Y. Effect of Polyamine on grain filling of winter wheat and its physiological mechanism. Acta Agron. Sin. 2013, 39, 712–719. [Google Scholar] [CrossRef]
  39. Liu, K. Regulation of Abscisic Acid and Ethylene to Grain Filling in rice and Wheat and Its Physiological Mechanism. Ph.D. Thesis, Yangzhou University, Yangzhou, China, 2008. (In Chinese). [Google Scholar]
  40. Yang, J.C.; Wang, Z.Q.; Zhu, Q.S.; Su, B.L. Regulation of ABA and GA to the grain filling of rice. Acta Agron. Sin. 1999, 25, 343–348. [Google Scholar]
  41. Wang, H.B. Effects of Wxogenous IAA and 6-BA Treatment on Grain Weight and Filling Rate of Different Allelic Variations of TaGW2-6A in Wheat; Northwest A&F University: Xianyang, China, 2020; p. 239. [Google Scholar]
  42. Kim, D.; Langmead, B.; Salzberg, S.L. HISAT: A fast spliced aligner with low memory requirements. Nat. Methods 2015, 12, 357–360. [Google Scholar] [CrossRef]
  43. Wang, G.D.; Zhang, S.; Ma, X.C.; Wang, Y.; Kong, F.Y.; Meng, Q.W. A stress-associated NAC transcription factor (Sl NAC35) from tomato plays a positive role in biotic and abiotic stresses. Physiol. Plant. 2016, 158, 45–64. [Google Scholar] [CrossRef]
  44. Love, M.I.; Huber, W.; Anders, S. Moderated estimation of fold change and dispersion for RNA-seq data with DESeq2. Genome Biol. 2014, 15, 550. [Google Scholar] [CrossRef]
  45. Michael, A.; Catherine, A.B.; Judith, A.B.; Botstein, D.; Butler, H.; Cherry, J.M.; Davis, A.P.; Dolinski, K.; Dwight, S.S.; Eppig, J.T.; et al. Gene ontology: Tool for the unification of biology. Gene Ontol. Consort. Nat Genet 2000, 25, 25–29. [Google Scholar]
  46. Young, M.D.; Wakefield, M.J.; Smyth, G.K.; Oshlack, A. Gene ontology analysis for RNA-seq: Accounting for selection bias. Genome Biol. 2010, 11, R14. [Google Scholar] [CrossRef] [PubMed]
  47. Koonin, E.V. The Clusters of Orthologous Groups (COGs) Database: Phylogenetic classification of proteins from complete genomes. In The NCBI Handbook; Antenna House: Newport, DE, USA, 2002. [Google Scholar]
  48. Kanehisa, M.; Goto, S.; Kawashima, S.; Okuno, Y.; Hattori, M. The KEGG resource for deciphering the genome. Nucleic Acids Res. 2004, 32, D277–D280. [Google Scholar] [CrossRef] [PubMed]
  49. Kanehisa, M.; Araki, M.; Goto, S.; Hattori, M.; Hirakawa, M.; Itoh, M.; Katayama, T.; Kawashima, S.; Okuda, S.; Tokimatsu, T.; et al. KEGG for linking genomes to life and the environment. Nucleic Acids Res. 2008, 36, D480–D484. [Google Scholar] [CrossRef]
  50. Mao, X.; Cai, T.; Olyarchuk, J.G.; Wei, L. Automated genome annotation and pathway identification using the KEGG Orthology (KO) as a controlled vocabulary. Bioinformatics 2005, 21, 3787–3793. [Google Scholar] [CrossRef] [PubMed]
  51. Singh, J.; Aggarwal, R.; Gurjar, M.S.; Sharma, S.; Jain, S.; Saharan, M.S. Identification and expression analysis of pathogenicity-related genes in Tilletia indica inciting Karnal bunt of wheat. Australas. Plant Pathol. 2020, 49, 393–402. [Google Scholar] [CrossRef]
  52. Pfaf, M.W. A new mathematical model for relative quantifcation in real-time RT-PCR. Nucleic Acids Res. 2001, 29, e45. [Google Scholar] [CrossRef]
Figure 1. The overall distribution of DEGs in TCK-infected vs. control samples at three growth periods. Note: Comparison group: I-YLC and I-YLI in mid-filling stage; II-YLC and II-YLI in late-filling stage; III-YLC and III-YLI in maturity stage.
Ijms 24 17281 g001
Figure 2. GO analysis of DEGs. Note: (a) Comparison group: YLC and YLI in mid-filling stage; (b) YLC and YLI in late-filling stage; (c) YLC and YLI in maturity stage. X-axis: Go terms and classifications; Y-axis: Number of DEGs (genes) annotated to the term (right) and percentage of that in all DEGs (genes) (left).
Ijms 24 17281 g002aIjms 24 17281 g002b
Figure 3. Comparison of COG databases. Note: (a) Comparison group: YLC and YLI in mid-filling stage; (b) YLC and YLI in late-filling stage; (c) YLC and YLI in maturity stage.
Ijms 24 17281 g003aIjms 24 17281 g003b
Figure 4. Enrichment scatter map of KEGG pathway. Note: (a) Comparison group: YLC and YLI in mid-filling stage; (b) YLC and YLI in late-filling stage; (c) YLC and YLI in maturity stage.
Ijms 24 17281 g004aIjms 24 17281 g004b
Figure 5. Venn diagram analysis of the DEGs in Yili 053. G1 represents the shared DEGs of I-YLC vs. I-YLI; G2 represents the shared DEGs of II-YLC vs. II-YLI; and G3 represents the shared DEGs of III-YLC vs. III-YLI.
Ijms 24 17281 g005
Figure 6. Heatmap of Yili 053 continuously expressed DEGs.
Ijms 24 17281 g006
Figure 7. Enrichment scatter map of KEGG pathway.
Ijms 24 17281 g007
Figure 8. DEGs of transcription factors, which were continuously up-regulated.
Ijms 24 17281 g008
Figure 9. Amplification curve of DEGs that were continuously up-regulated. Note: (a) TraesCS4B02G122300 gene; (b) TraesCS7D02G419400 gene. Blue line represents the sample signal, the red line represents the baseline.
Ijms 24 17281 g009aIjms 24 17281 g009b
Table 1. Summary statistics of RNA-Seq data.
NumbersSamplesClean ReadsClean BasesGC ContentQ30 (%)
1I-YLC133,846,47010,118,821,24655.69%95.46%
2I-YLC238,588,62711,517,825,57254.84%95.00%
3I-YLC337,958,89711,343,101,53654.37%95.01%
4I-YLI137,731,98611,276,627,55257.82%93.91%
5I-YLI235,408,40410,561,674,36458.70%93.97%
6I-YLI343,665,45513,042,812,83458.55%93.90%
7II-YLC137,424,10911,172,643,12051.80%91.54%
8II-YLC239,668,01911,817,094,73252.53%91.17%
9II-YLC343,770,04413,052,803,51451.85%91.92%
10II-YLI141,044,11812,272,430,46656.42%93.91%
11II-YLI241,626,95412,447,001,05856.32%93.99%
12II-YLI343,680,49413,053,542,61856.40%93.96%
13III-YLC141,024,04712,249,838,09657.04%93.24%
14III-YLC242,236,37612,634,731,48856.04%94.14%
15III-YLC336,526,90610,892,077,86456.40%93.28%
16III-YLI143,832,29913,101,853,39058.51%93.54%
17III-YLI243,363,05812,976,495,30458.83%93.85%
18III-YLI345,101,79013,488,891,93658.73%93.80%
Note: I-YLC represents control samples in the mid-filling stage, II-YLC represents control samples in the late-filling stage, III-YLC represents control samples in the mature stage. I-YLI represents infected samples in the mid-filling stage, II-YLI represents infected samples in the late-filling stage, III-YLI represents infected samples in the maturity stage.
Table 2. DEGs related to plant hormones.
Gene IDI-YLC vs. I-YLIII-YLC vs. II-YLIIII-YLC vs. III-YLIKEGG_Pathway_Annotation
TraesCS4D02G258000upupup-
TraesCS5B02G162100upupup-
TraesCS7D02G419400upupupPlant hormone signal transduction (ko04075)
TraesCS1B02G229400downdowndownMAPK signaling pathway—plant (ko04016); Plant hormone signal transduction (ko04075)
TraesCS1B02G237400downdowndown-
TraesCS1D02G146900downdowndownPlant hormone signal transduction (ko04075)
TraesCS1D02G218200downdowndownMAPK signaling pathway—plant (ko04016); Plant hormone signal transduction (ko04075)
TraesCS2A02G309300downdowndownPlant hormone signal transduction (ko04075)
TraesCS2D02G234100updowndownProtein processing in the endoplasmic reticulum (ko04141)
TraesCS3A02G006600downdowndown-
TraesCS3A02G145300downdowndownPlant hormone signal transduction (ko04075)
TraesCS3A02G233000downdowndownPlant hormone signal transduction (ko04075)
TraesCS3A02G307100downdowndownPlant hormone signal transduction (ko04075)
TraesCS3A02G371800downdowndownPlant hormone signal transduction (ko04075)
TraesCS3A02G372000downdowndownPlant hormone signal transduction (ko04075)
TraesCS3A02G372100downdowndownPlant hormone signal transduction (ko04075)
TraesCS3B02G007400downdowndown-
TraesCS3B02G404300downdowndownPlant hormone signal transduction (ko04075)
TraesCS3B02G404400downdowndownPlant hormone signal transduction (ko04075)
TraesCS3D02G292100downdowndownPlant hormone signal transduction (ko04075)
TraesCS3D02G364900downdowndownPlant hormone signal transduction (ko04075)
TraesCS4B02G161800downdowndownPlant hormone signal transduction (ko04075)
TraesCS4D02G210900downupupMAPK signaling pathway—plant (ko04016); Plant hormone signal transduction (ko04075)
TraesCS4D02G231900downdowndown-
TraesCS5A02G243900downdowndown-
TraesCS5A02G265600downdowndownPlant hormone signal transduction (ko04075)
TraesCS5B02G265300downdowndownPlant hormone signal transduction (ko04075)
TraesCS5D02G206700downdowndownMAPK signaling pathway—plant (ko04016); Plant hormone signal transduction (ko04075)
TraesCS5D02G432700downupupGlutathione metabolism (ko00480)
TraesCS7B02G019600downupup-
Triticum_aestivum_newGene_3982downdowndownPlant hormone signal transduction (ko04075)
Triticum_aestivum_newGene_8549downdowndown-
Table 3. DEGs related to response to stimulus.
Gene IDKEGG_Pathway_Annotation
TraesCS1A02G403300Photosynthesis–antenna proteins (ko00196)
TraesCS1B02G432700Photosynthesis–antenna proteins (ko00196)
TraesCS1D02G411300Photosynthesis–antenna proteins (ko00196)
TraesCS2A02G206200Photosynthesis–antenna proteins (ko00196)
TraesCS2D02G209900Photosynthesis–antenna proteins (ko00196)
TraesCS3B02G133400Galactose metabolism (ko00052)
TraesCS4B02G122300-
TraesCS4B02G200100Glutathione metabolism (ko00480)
TraesCS4D02G258000-
TraesCS4D02G319100-
TraesCS5A02G322500Photosynthesis–antenna proteins (ko00196)
TraesCS5A02G350600Photosynthesis–antenna proteins (ko00196)
TraesCS5B02G162100-
TraesCS5B02G572400Glutathione metabolism (ko00480)
TraesCS5D02G413300Alpha-linolenic acid metabolism (ko00592)
TraesCS6A02G372100-
TraesCS6D02G152700Photosynthesis–antenna proteins (ko00196)
TraesCS6D02G356100-
TraesCS7A02G177700Protein processing in the endoplasmic reticulum (ko04141)
Table 4. Validation of RNA sequencing by qRT-PCR.
Gene IDqRT-PCRFPKMValidatedGene IDqRT-PCRFPKMValidated
TraesCS1A02G4033000.2 ± 0.10 gh44.83+TraesCS5B02G5724000.64 ± 0.03 ef30.59+
TraesCS1B02G4327000.28 ± 0.01 gh55.71+TraesCS5D02G4133002.9 ± 1.67 a8.4+
TraesCS2A02G2062000.32 ± 0.13 gh32.49+TraesCS6D02G1527001.65 ± 0.15 c24.14+
TraesCS2D02G2099000.37 ± 0.05 fg37.23+TraesCS7A02G1777000.95 ± 0.63 d24.43+
TraesCS3B02G1334000.03 ± 0.11 h76.43+TraesCS7D02G4194000.22 ± 0.03 gh12.13+
TraesCS4B02G1223000.19 ± 0.29 gh4.81+TraesCS1B02G2294000.26 ± 0.2 gh5.12+
TraesCS4B02G2001000.30 ± 0.11 gh24.14+TraesCS2A02G3093000.12 ± 0.06 gh4.34+
TraesCS4D02G2580000.13 ± 0.01 gh56.0+TraesCS2D02G2341000.16 ± 0.09 gh5.29+
TraesCS4D02G3191001.97 ± 0.72 b4.02+TraesCS3D02G3649000.17 ± 0.1 gh19.24+
TraesCS5A02G3225000.43 ± 0.41 fg15.25+TraesCS4D02G2109000.3 ± 0.27 gh15.05+
TraesCS5A02G3506001.48 ± 0.02 c63.58+TraesCS5D02G2067000.32 ± 0.27 gh3.49+
TraesCS5B02G1621000.76 ± 0.13 de38.2+TraesCS5D02G4327000.4 ± 0.96 gh214.13+
Note: a–h represents significant difference in the amount of gene expression detected by qRT-PCR. “+” represents the gene that can be detected by qRT-PCR.
Table 5. Primers of selected DEGs for expression analysis using qRT-PCR.
Gene IDForward Primer (5′-3′)Reverse Primer (5′-3′)
TraesCS1A02G403300ATGTTCGGCTTCTTCGTGCCAGGCGTTGTTGTTGAC
TraesCS1B02G432700TTCTCCATGTTCGGCTTCTCCAGGCGTTGTTGTTGAC
TraesCS2A02G206200CTGGTGATCGGGTACATCCAGAGTCTCCTTCTTCTCC
TraesCS2D02G209900ATCGGGTACATCGAGTTCCAGAGTCTCCTTCTTCTCC
TraesCS3B02G133400GCTACAACACCGAGAATGCTAGACCCGAATCTCCAA
TraesCS4B02G122300CCTGAAGCTCTCCTACACGCTGGTCGTAGTAGAGTG
TraesCS4B02G200100TGCTGCCTGATGATTCTGTCGCTGAACTTTCCCAAG
TraesCS4D02G258000GTGGTGCTCTACGACCTCTAGGCGTCCAGGTTGTTG
TraesCS4D02G319100TGGCTCTTCAGTTCCTCTGACCTTCTTCTTCTCCTTGG
TraesCS5A02G322500TTCTCCATGTTCGGCTTCTCCAGGCGTTGTTGTTGAC
TraesCS5A02G350600ATGTTCGGCTTCTTCGTGCCAGGCGTTGTTGTTGAC
TraesCS5B02G162100AGCGGCATATTTACTTCGTCAGCATCAAGGTAGGTT
TraesCS5B02G572400CCGAGAAGTTGCTGTCACCTGAGGTCTGCGATGGAT
TraesCS5D02G413300GATCTTGCTGCCAATGCTAAGTTGATGCGGTCCTTG
TraesCS6D02G152700AAGAGCGAGAAGGAGATGTGAGGATGTTGTTGTTGAC
TraesCS7A02G177700AGCTTCTTCTCGCAGGACCCTCCATCAGAGACAGCAG
TraesCS7D02G419400CCAGTCCAAGAACCAGTACGACGACAGGTAGAAAGT
TraesCS1B02G229400CATACGATTCAAGGAGGTTGAAAGTAGTTGCTGGAAGA
TraesCS2A02G309300CTAACTGTCTCAGGTGATGCTTCTAACTTGGCGACTT
TraesCS2D02G234100GGCAATAGACTCTGTTCAGGGGCTCCATCAGGTTCTTC
TraesCS3D02G364900CGGCAGTCTTCCATCTTCACTCCTCGGCATTCCATA
TraesCS4D02G210900ATACGGCGGCATAGACTGTACTTGGCGGGCTCAATC
TraesCS5D02G206700CGTTCATTGGCTGCTTCTAGGTCAAGATTGCCGACTC
TraesCS5D02G432700CTGGACATCCTCAAGACCCTCTCGTAGCTGTGGAAC
Disclaimer/Publisher’s Note: The statements, opinions and data contained in all publications are solely those of the individual author(s) and contributor(s) and not of MDPI and/or the editor(s). MDPI and/or the editor(s) disclaim responsibility for any injury to people or property resulting from any ideas, methods, instructions or products referred to in the content.

